Article

Risk Evolution Analysis of Seafarers’ Unsafe Acts in Maritime Accidents Based on Directed Weighted CN

1
School of Economics and Management, Dalian Ocean University, Dalian 116023, China
2
School of Maritime Economics and Management, Dalian Maritime University, Dalian 116026, China
*
Author to whom correspondence should be addressed.
Appl. Sci. 2024, 14(6), 2595; https://doi.org/10.3390/app14062595
Submission received: 19 February 2024 / Revised: 11 March 2024 / Accepted: 13 March 2024 / Published: 20 March 2024

Abstract

:
Seafarers’ unsafe acts as the direct causes of maritime accidents are considered to be the result of the interaction between complex and dynamic influencing factors. Identifying the risk evolution characteristics and paths of seafarers’ unsafe acts has always been a challenge in maritime safety management. For this purpose, the present study introduces association rule technique into complex network to develop a directed weighted interaction network of seafarers’ unsafe acts and their influencing factors. Through global network topology analysis and local network community detection, the risk evolution characteristics of seafarers’ unsafe acts in maritime accidents are analyzed from a multidimensional perspective. The results indicate that the developed network has small-world characteristics, and the top 10 critical nodes all belong to seafarers’ unsafe acts, of which failure to make proper sound and light signals achieves the highest PageRank value. Results from this study would help maritime stakeholders to understand the evolution mechanism of seafarers’ unsafe acts and develop safety management strategies for interrupting the risk propagation of seafarers’ unsafe acts.

1. Introduction

Safety at sea has always been a major concern for the shipping industry, due to the serious consequences of maritime accidents [1]. Based on accident causation theory, accidents occur as a result of the consistent evolution of physical unsafe conditions and human unsafe acts under the interaction of environmental conditions, management defects, and other influencing factors. A large number of studies have been devoted to investigate the causes of industrial accidents and pointed out that human unsafe acts are the main and direct causes of accidents [2]. The international shipping industry began to recognize the significance of unsafe acts in the 1970s [3], and 80% of maritime accidents were attributed to unsafe acts of seafarers [4]. The International Maritime Organization (IMO) called on countries to make sure that they pay more attention to unsafe acts when conducting maritime transport safety studies [5]. With the efforts of IMO, the International Convention on Standards of Training, Certification and Watchkeeping for Seafarers (STCW Convention) and the International Safety Management Code (ISM Code) were introduced sequentially, which proposed new requirements for promoting maritime safety from the perspective of seafarer training and management, respectively. In 1999, to avoid neglecting or missing critical information on human factors in maritime investigations, IMO adopted the Amendments to the Code for the Investigation of Marine Casualties and Incidents (A.884(21)), which provides maritime investigators with methods and procedures for investigating human factors in the maritime accidents [6]. Although the shipping industry continues to take proactive initiatives to improve the safety of seafarers’ acts, the incidence of maritime accidents has not been controlled to the expected level [7,8].
Safety in maritime transportation is based on the coordinated operation of the “human-ship-management-environment” system [9]. The purpose of maritime safety management is to avoid unsafe acts of seafarers, eliminate unsafe conditions of objects, reduce unsafe management in the organization and control unsafe factors in the environment. Due to the progress of science and technology, the safety and reliability of ship machinery have been greatly improved, and the use of various monitoring and warning means has made the negative influence of environment factors effectively controlled. However, the seafarers, as the only part of the system with subjective initiative, have uncertainty in their acts. The occurrence of seafarers’ unsafe acts is considered to be the result of the interaction among various complex and dynamic influencing factors [10,11]. Factors from organization, technology, environment, and individual traits are coupled and superimposed on individual seafarers, making the generation of seafarers’ unsafe acts uncertain, sudden, and random. As a result, human factors are recognized as the dominant cause of maritime accidents, accounting for 75–96% of maritime casualties [3,4,7]. Particularly, 79% of tugboat groundings [12], 84–88% of tanker grounding accidents [13], and 89–96% of collisions [14] were demonstrated to be triggered by human factors. In order to interrupt the risk propagation of human factors, clarifying seafarers’ unsafe acts and their influencing factors, and exploring the complex risk interaction law among multiple factors have always been difficult issues in safety management and also important research trends in the field of maritime safety.
As the complexity of maritime transportation activities increases, the interaction between seafarers’ unsafe acts and their influencing factors has deepened. The traditional probability-based methods are no longer competent for risk assessment and cannot clarify the complex risk interaction in maritime transportation activities. Therefore, this study integrates association rule and complex network theory to analyze the interaction of seafarers’ unsafe acts and their influencing factors in maritime transportation activities. This study develops the interaction network of seafarers’ unsafe acts and their influencing factors to investigate the risk evolution law and characteristics of seafarers’ unsafe acts and clarify the critical factors in the risk interaction network.

2. Literature Review

To assess maritime transport risks for maritime safety, IMO has proposed a structured Formal Safety Assessment (FSA) method. The FSA method takes into account factors such as ship conditions, organizational management, hardware and external environment to provide a useful reference for maritime stakeholders in conducting maritime risk assessments [15]. In the context of the FSA, the research process concerning risk assessment of maritime human-related accidents has been promoted. A variety of quantitative methods and techniques have been adopted to analyze the risk evolution process of seafarers’ unsafe acts in maritime accidents, especially probability-based methods such as Fault Tree Analysis (FTA) [16] and Bayesian Network (BN) [17,18]. Trucco et al. [19] introduced FTA and BN for maritime transport risk analysis and used BN to estimate the probability of the basic events in FTA. Ung [13] used FTA and CREAM to assess the probability of human errors in ship grounding accidents. Deacon et al. [20] developed and validated an accident risk assessment method to assess the risk of human errors during offshore evacuation. In addition, Li et al. [15] utilized BN to explore the key maritime risk influencing factors based on global maritime accident data. Most methodological techniques were used for static analysis; however, BN could also be developed as a dynamic analysis model to deal with risk coupling problems. For example, Liu et al. [21] constructed the dynamic BN to characterize the risk evolution in subsea blowout accidents, and Huang et al. [22] quantified the effect of risk coupling between the operational failures using BN-K2 algorithm. In practice, clarifying the risk interaction process helps to maintain system safety and is critical for improving system reliability, especially for maritime transportation systems characterized by high uncertainty and human intervention.
Recently, various methodological tools have been proposed to achieve the analysis of risky interactions. In particular, network-based methods have received much attention. For example, Lam and Tai [23] used network topological approach to identify complex risk interactions in railroad accidents, and Liu et al. [24] also investigated related areas and used causal network method to mine fault information. Due to the high complexity of causal relationships among risk events, it is difficult for traditional methods to effectively analyze them. Meanwhile, complex network (CN) has shown powerful applicability because of the quantitative analysis metrics under the CN theory that are able to assess risk events, such as degree distributions, clustering coefficients, betweenness, etc., and it has been widely utilized in the field of coal mines [25], urban railway [26], and construction [27]. Ma et al. [28] stated that complex network could present and analyze complex interactions between influencing factors and identify key factors more effectively than traditional methods such as fault tree analysis, event tree analysis, and Bayesian network. Considering the advantages of complex network, Lan et al. [29] proposed a ship collision causation network model using complex network and identified the critical factors that effect accident severity. Further, Gan et al. [1] constructed a network model of China’s coastal maritime accidents to explore the key factors of maritime accidents, and then proposed risk prevention measures. Although CN-based risk analysis methods have been introduced in the maritime accident domain, relevant studies focused on the network topology analysis without in-depth analysis of the risk evolution mechanisms in the network.
Additionally, complex network is strongly expandable and could be integrated with other techniques, such as Event Tree Analysis (ETA) [30] and Association Rule (AR) [31]. For instance, Ma et al. [30] used ETA to identify the event chain from 39 ship grounding accident reports, thereby combining all the event chains to develop the CN, which was quite time-consuming. However, AR could discover potential, meaningful associations in a dataset without prior knowledge [32]. It has been widely used in the domains of metro engineering [33], aviation [34], and road traffic [35]. To the authors’ knowledge, only a few studies have utilized AR to establish CN in the field of maritime accidents.
The purpose of the present study is to reveal the complex evolution law of seafarers’ unsafe acts involved in maritime accidents, based on which tailored safety management recommendations are made to reduce the risks of maritime transport activities. Specifically, the present study introduces association rule (AR) technique into complex network (CN) to avoid the defect that the edge weights are over-reliant on experts’ subjective experience in the traditional complex network development process, and to develop a directed weighted interaction network of seafarers’ unsafe acts and their influencing factors. Furthermore, through global network topology analysis and local network community structure extraction, the risk evolution characteristics of seafarers’ unsafe acts in maritime accidents are analyzed from a multidimensional perspective, and the risk propagation paths of seafarers’ unsafe acts and their influencing factors are quantitatively revealed to provide strong support for interrupting the risk propagation of seafarers’ unsafe acts.

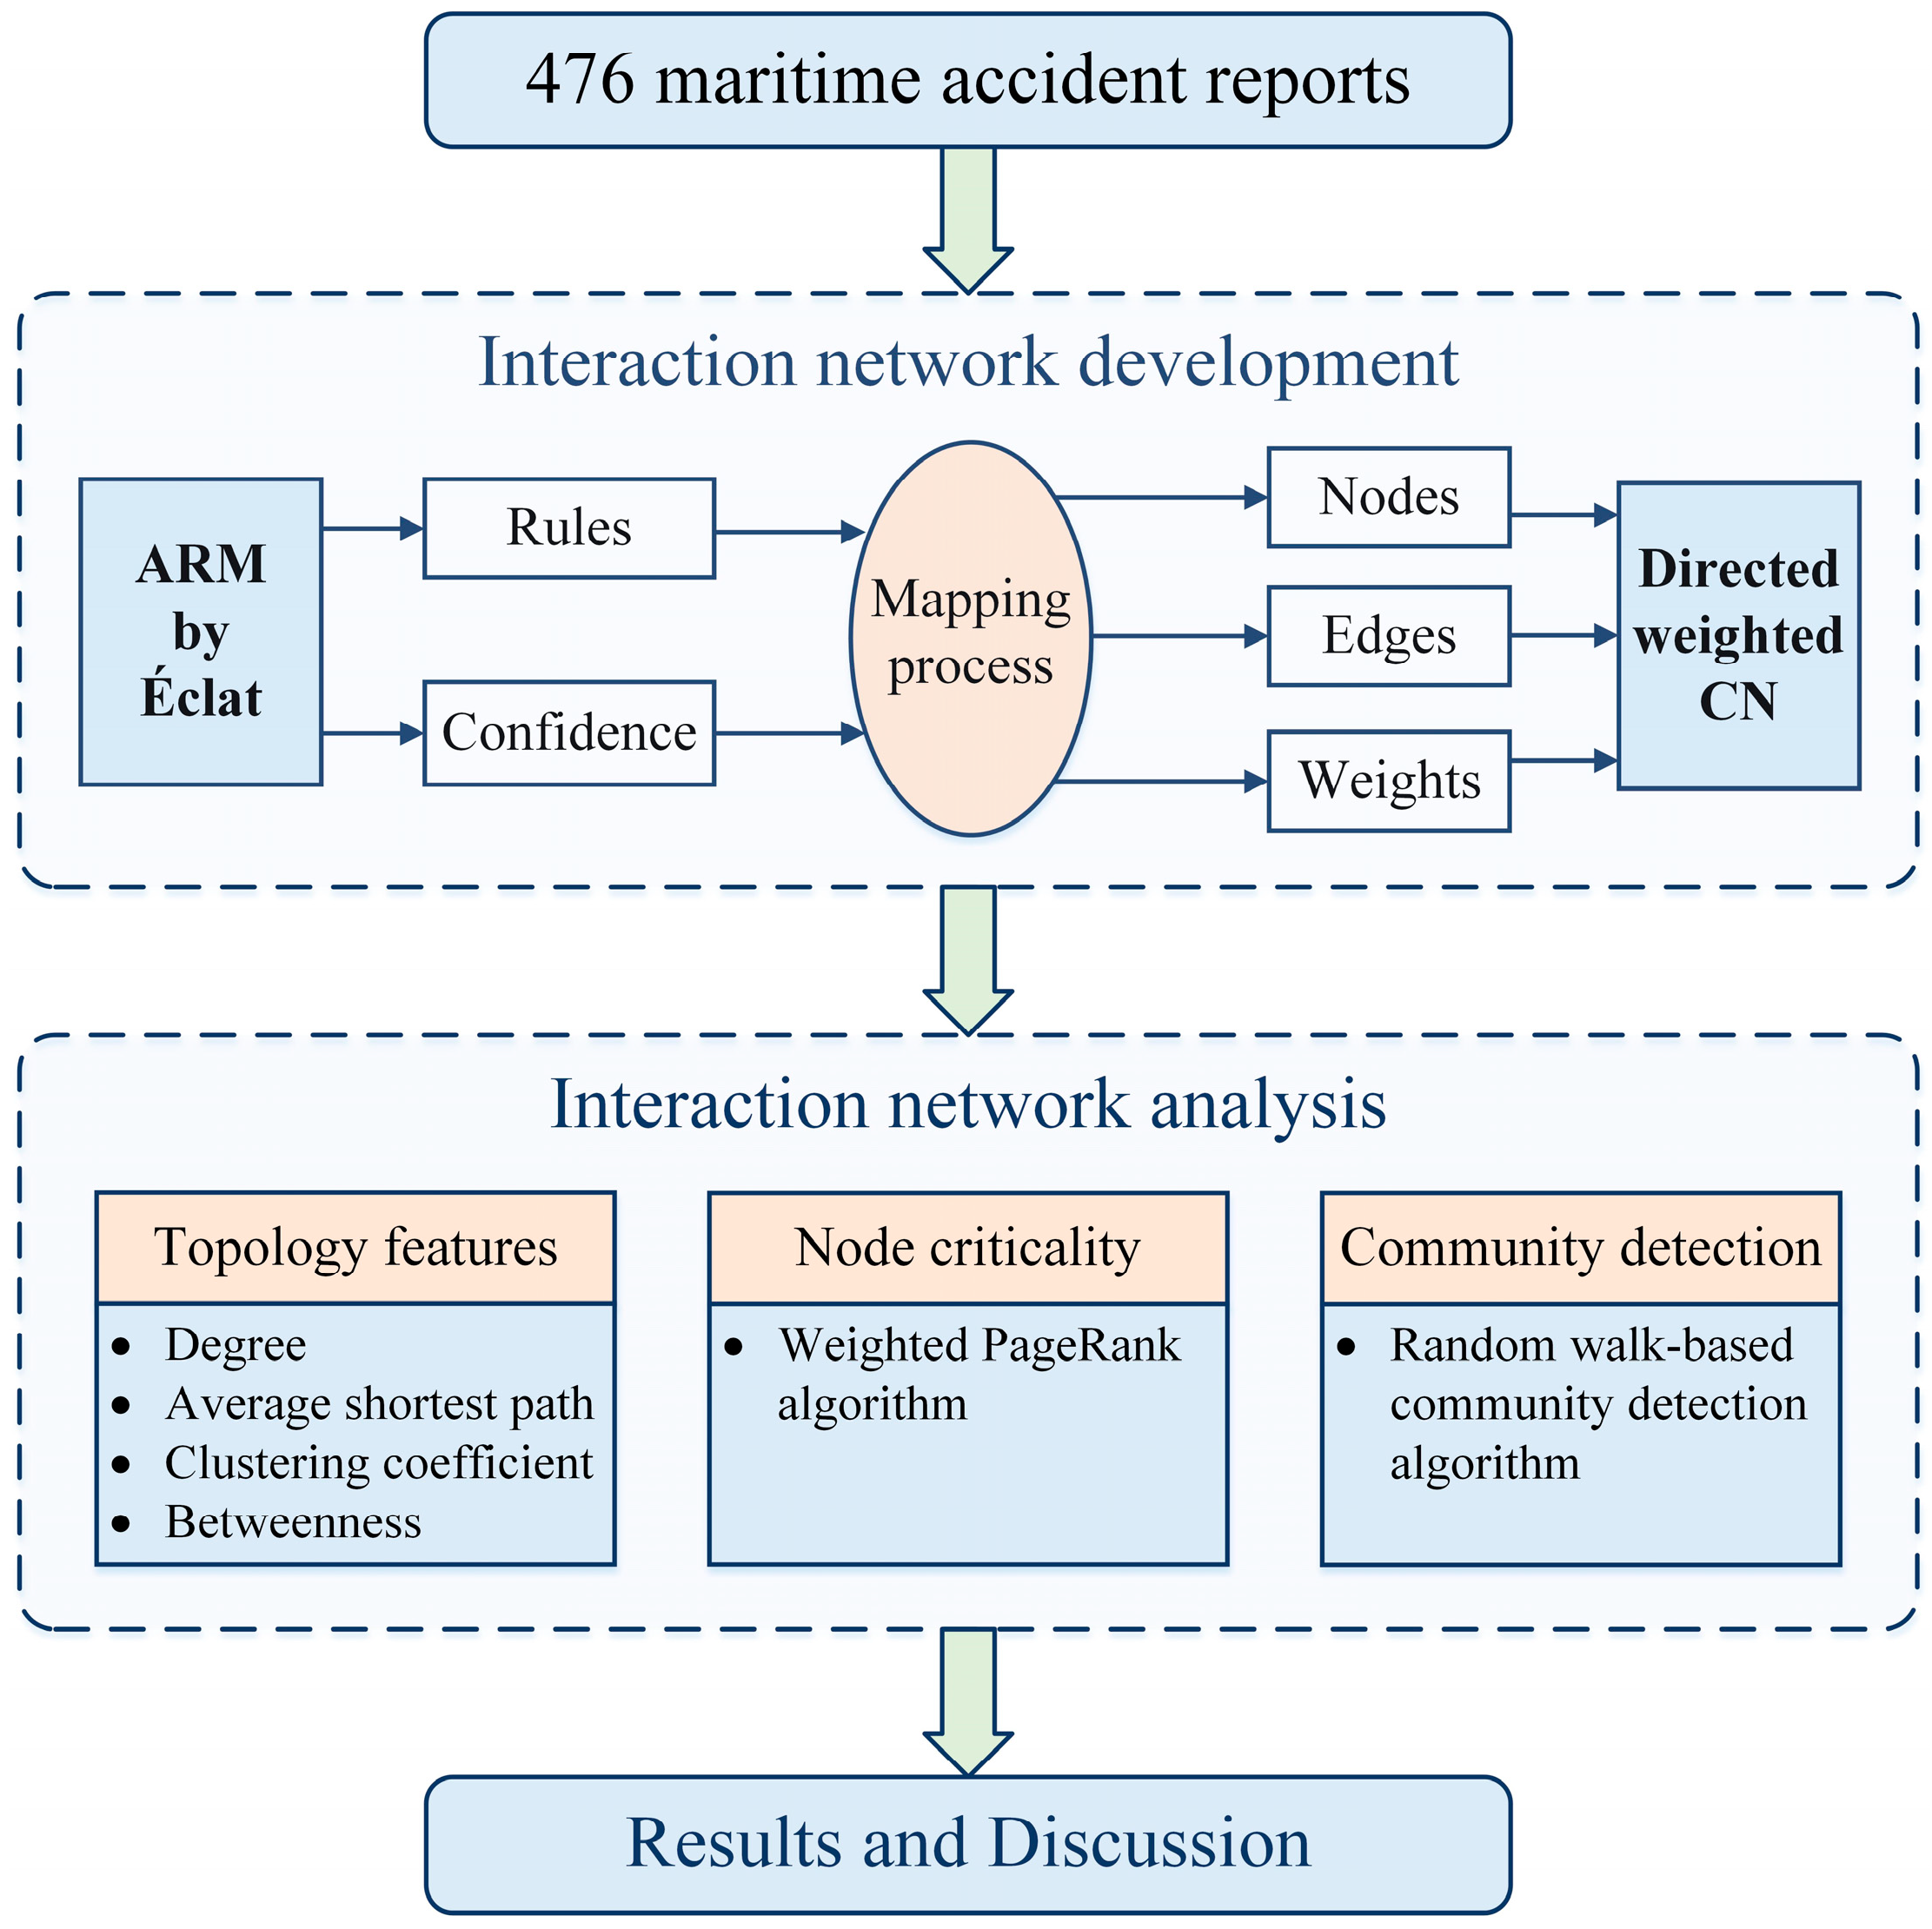
3. Materials and Methodology

The process of risk interaction analysis based on AR-CN is shown in Figure 1. The risk interaction network is constructed by introducing association rules into complex network. Specifically, the association rules are decomposed into nodes and edges of the network, and the confidence value of the rules represents the weight of the edges. The detailed process is described in Section 3.3.1. Then, the risk evolution characteristics of seafarers’ unsafe acts are systematically analyzed based on the complex network theory from three perspectives: topology feature, node criticality, and community detection.

3.1. Data Source

Official maritime accident investigation reports are well recognized as a reliable source that can obtain objective and comprehensive information about the maritime accidents [36]. To ensure the authority and timeliness of maritime accident investigation reports, a total of 555 maritime accidents that occurred between 2011 and 2020 were collected from the official website of seven countries’ official maritime investigation authorities, which recorded maritime accidents that occurred in national waters, including China Maritime Safety Administration (MSA, Beijing, China), Marine Accident Investigation Branch (MAIB, Southampton, UK), Swedish Accident Investigation Board (SHK, Stockholm, Sweden), Australian Transport Safety Bureau (ATSB, Canberra, Australia), United States National Transportation Safety Board (NTSB, Washington, DC, USA), Japan Transport Safety Board (JTSB, Tokyo, Japan) and Korean Maritime Safety Tribunal (KMST, Sejong City, Republic of Korea). The collected reports contain the five most frequently occurring types of maritime accidents, which are collision, grounding, contact, sinking, and fire/explosion.
In order to ensure that the maritime accident reports involved seafarers’ unsafe acts, this study initially screened the collected maritime accident reports and removed the accidents caused exclusively by objective factors such as environmental factors and ship factors. Finally, 476 maritime accident reports were obtained for further analysis, and the basic statistical information of the accident reports is shown in Table 1.
Lan et al. [37] developed a classification analysis framework for seafarers’ unsafe acts. With the help of the framework, this study extracted 31 seafarers’ unsafe acts and 38 influencing factors from the 476 accident reports. Table 2 provides the descriptive statistics of the seafarers’ unsafe acts and their influencing factors.

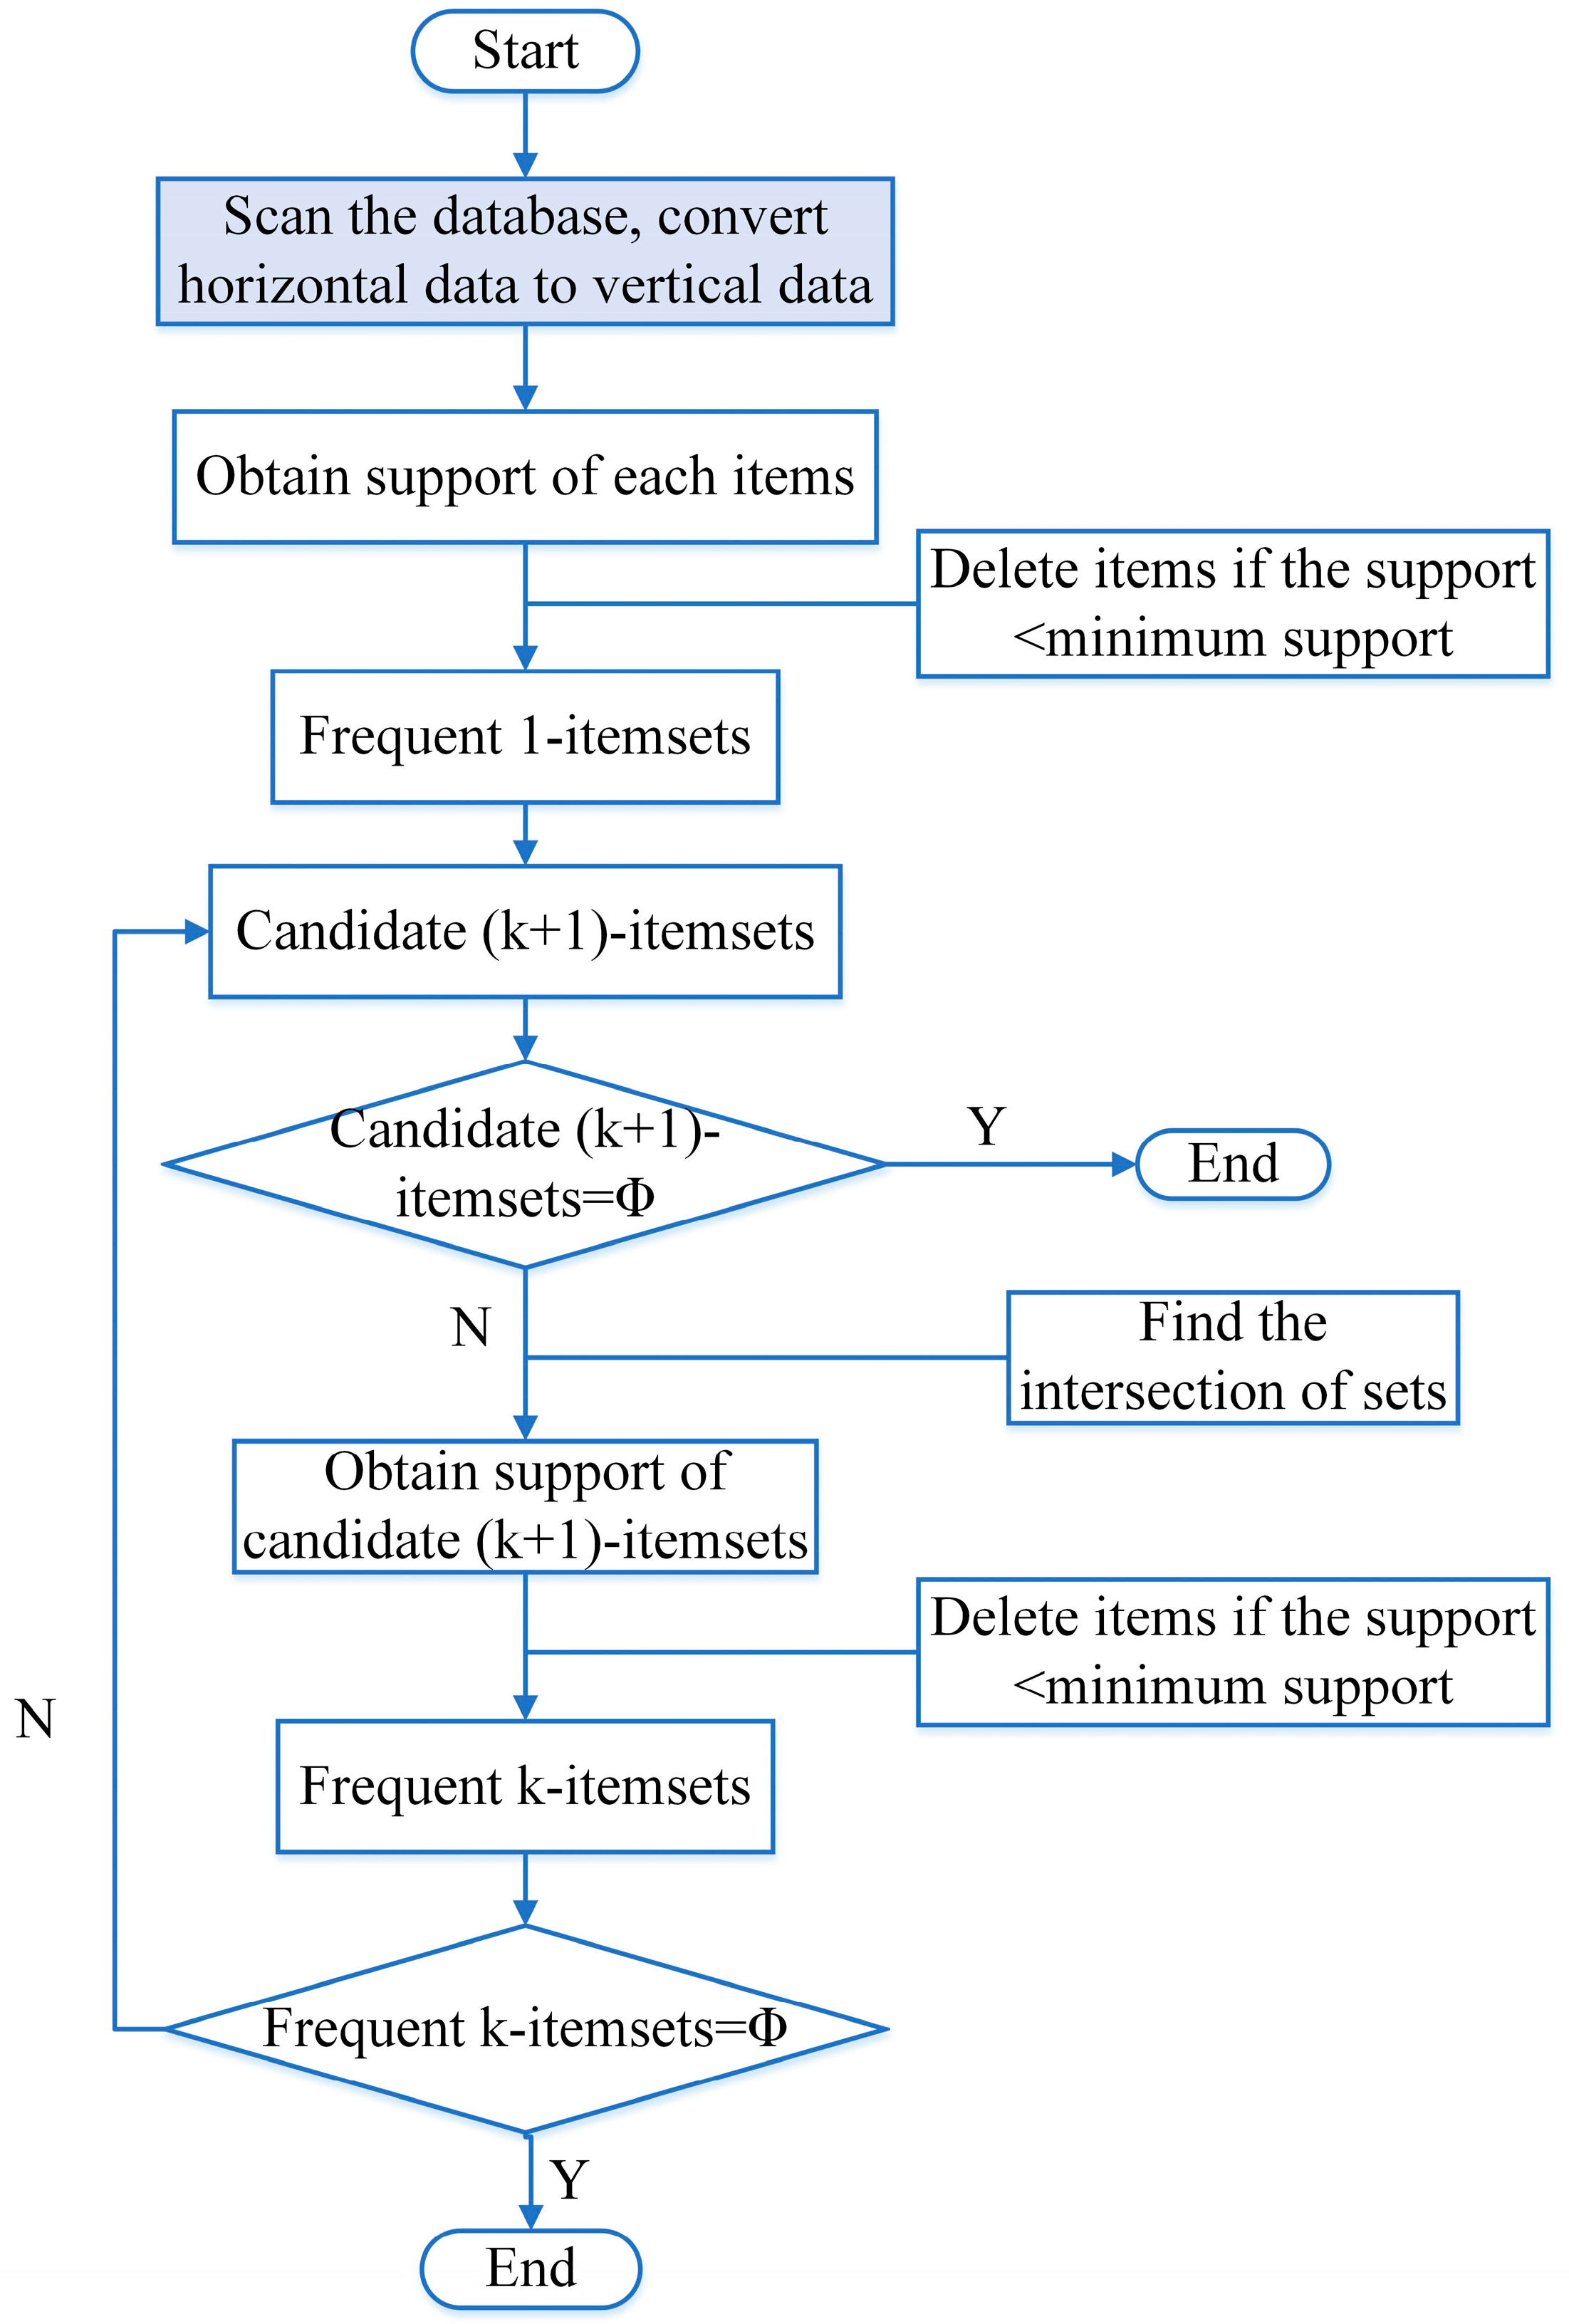
3.2. Association Rule

Association rule (AR) is an important part of machine learning with the purpose of revealing the interrelationships hidden in massive amount of data [35]. Association rule technique is more adaptable, because there is no requirement for whether the sample data obey a normal distribution or satisfy a correlation test using association rule technique [34]. The concept of association rule is as follows: assume that I = { i 1 , i 2 , , i n } is a set of items (items), the length of an itemset denotes the number of items contained in an itemset, and an itemset of length k is called a k-item set. Given a transaction database T = { t 1 , t 2 , , t n } , where each t is a non-empty subset of I. The association rules are denoted as X Y , where X I , Y I , X Y = . X is the left-hand-side (LHS) and Y is the right-hand-side (RHS). Each association rule is identified by support, confidence and lift [35], which are calculated as follows [38]:
S u p p o r t ( X Y ) = P ( X Y )
C o n f i d e n c e ( X Y ) = P ( Y / X )
L i f t ( X Y ) = c o n f . ( X Y ) / s u p p . ( Y )
Support of X Y represents the probability that the data set contains both X and Y [39]. Confidence is used to measure the probability of X occurring if Y occurs, i.e., the conditional probability. A rule is considered strongly associated if it is greater than or equal to the minimum support and minimum confidence [40]. Lift considers the probability of Y changing when X occurs to characterize the degree of association between the LHS and RHS, which could avoid the interference of pseudo-strong association rules and prevent invalid association rules appearing in the final result. A rule is regarded as a valid strong association rule when the lift value is greater than 1 [41]. These three thresholds are manually set according to the needs of data mining [42,43].
There are three typical association rule mining algorithms: Apriori, FP-Growth, and Éclat. However, no matter which algorithm is used, the basic association rule mining process is the same, which consists of two parts: mining frequent itemsets and extracting association rules [32]. First, all frequent itemsets are mined from the database, which are the itemsets with support greater than or equal to the minimum support. The k-itemsets that satisfy this condition are called frequent k-itemsets. Then, association rules are generated, which are the frequent itemsets with confidence greater than or equal to the minimum confidence.
Éclat is a classical algorithm for searching frequent itemsets in vertical data formats [38]. The core idea of the Éclat algorithm is to divide the search space into smaller subspaces using prefix-based equivalence relations, and each subspace is searched independently using a bottom-up search method to generate frequent item sets. The flowchart is illustrated in Figure 2.

3.3. Complex Network

3.3.1. Directed Weighted CN Development Based on AR

A complex network is a simple graph G = ( V ,   E ) consisting of a certain number of node sets V and edge sets E , where V = { v 1 , v 2 , , v n } represents the set of all nodes and E = { e 1 , e 2 , , e n } represents the set of all edges. The complex network can be expressed by the adjacency matrix A as follows:
A i j = { a i j × w i j ,             i j 0 ,                                   e l s e
where a i j   ( i , j V ) is equal to 1 when event i triggers event j and 0 otherwise. w i j denotes the weights of the edges between adjacent nodes i and j in the network, i.e., the frequency of event j triggered by event i . When the adjacency matrix is symmetric, the network is undirected, and conversely, it is a directed network. If all the w i j are not equal in the network, the network can be considered a weighted networks, otherwise it is an unweighted network.
There are diverse interactions between seafarers’ unsafe acts and their influencing factors in maritime transportation activities, i.e., the interaction network of seafarers’ unsafe acts and their influencing factors belongs to a directed weighted network. In a directed weighted network, nodes, directed edges and edge weights represent seafarers’ unsafe acts/influencing factors, interaction between seafarers’ unsafe acts/influencing factors and their strengths, respectively. In the present study, based on the complex network theory, the association rule results are mapped into the directed weighted network, and the mapping process is shown in Figure 3. The process consists of three main steps [29]:
(1)
Each influencing factor/seafarers’ unsafe acts in the association rule represents a node of the network;
(2)
The LHS and RHS in the association rules represent two adjacent nodes i and j , respectively, and each association rule forms a directed edge of the network;
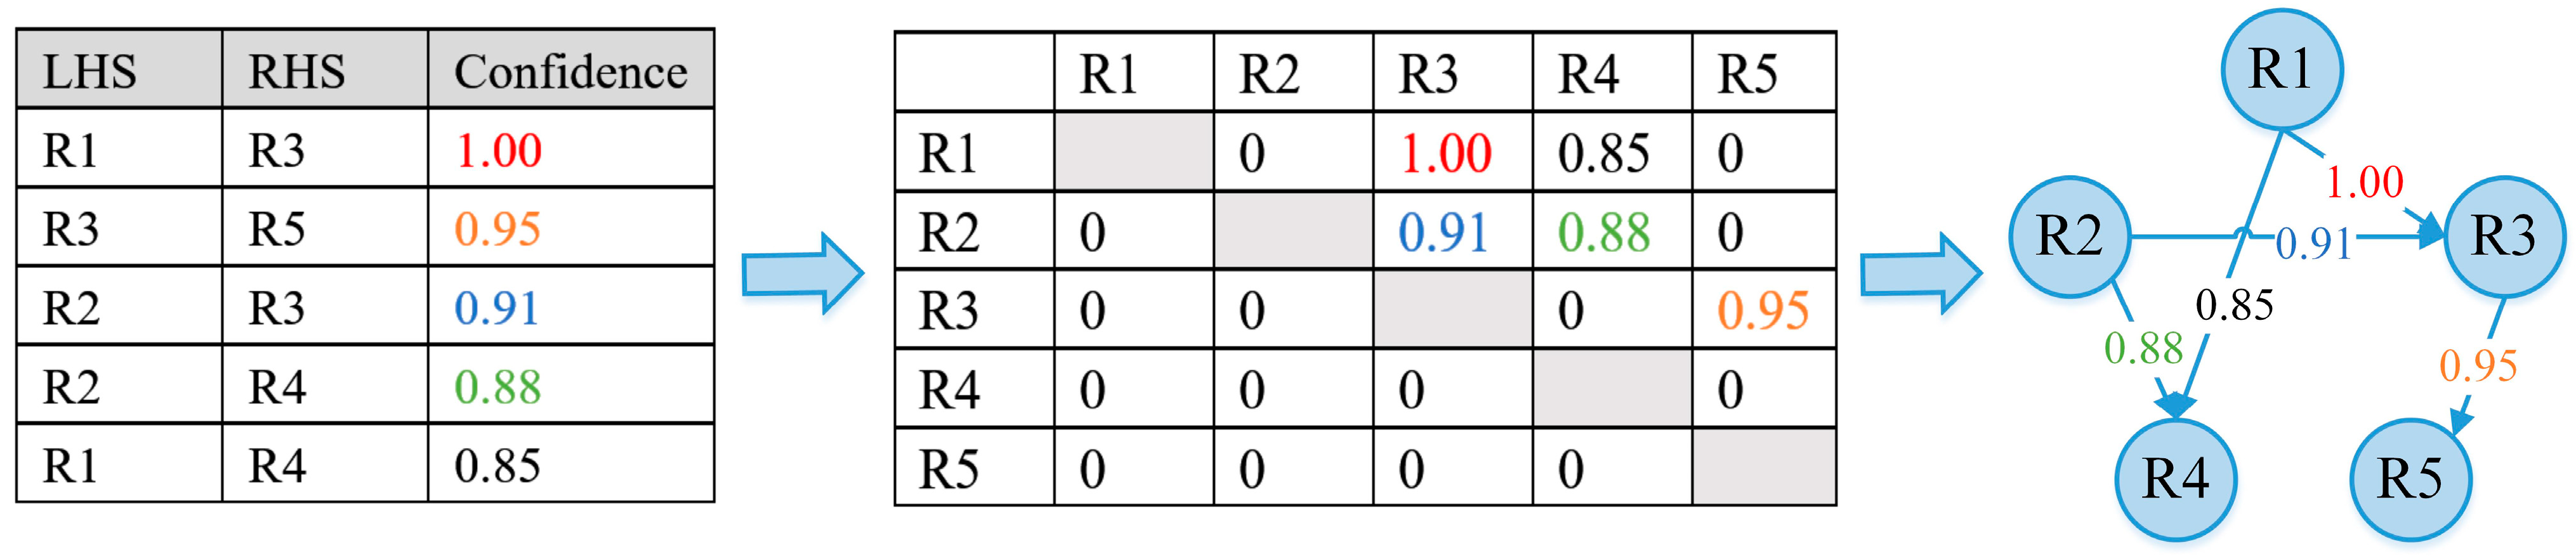
(3)
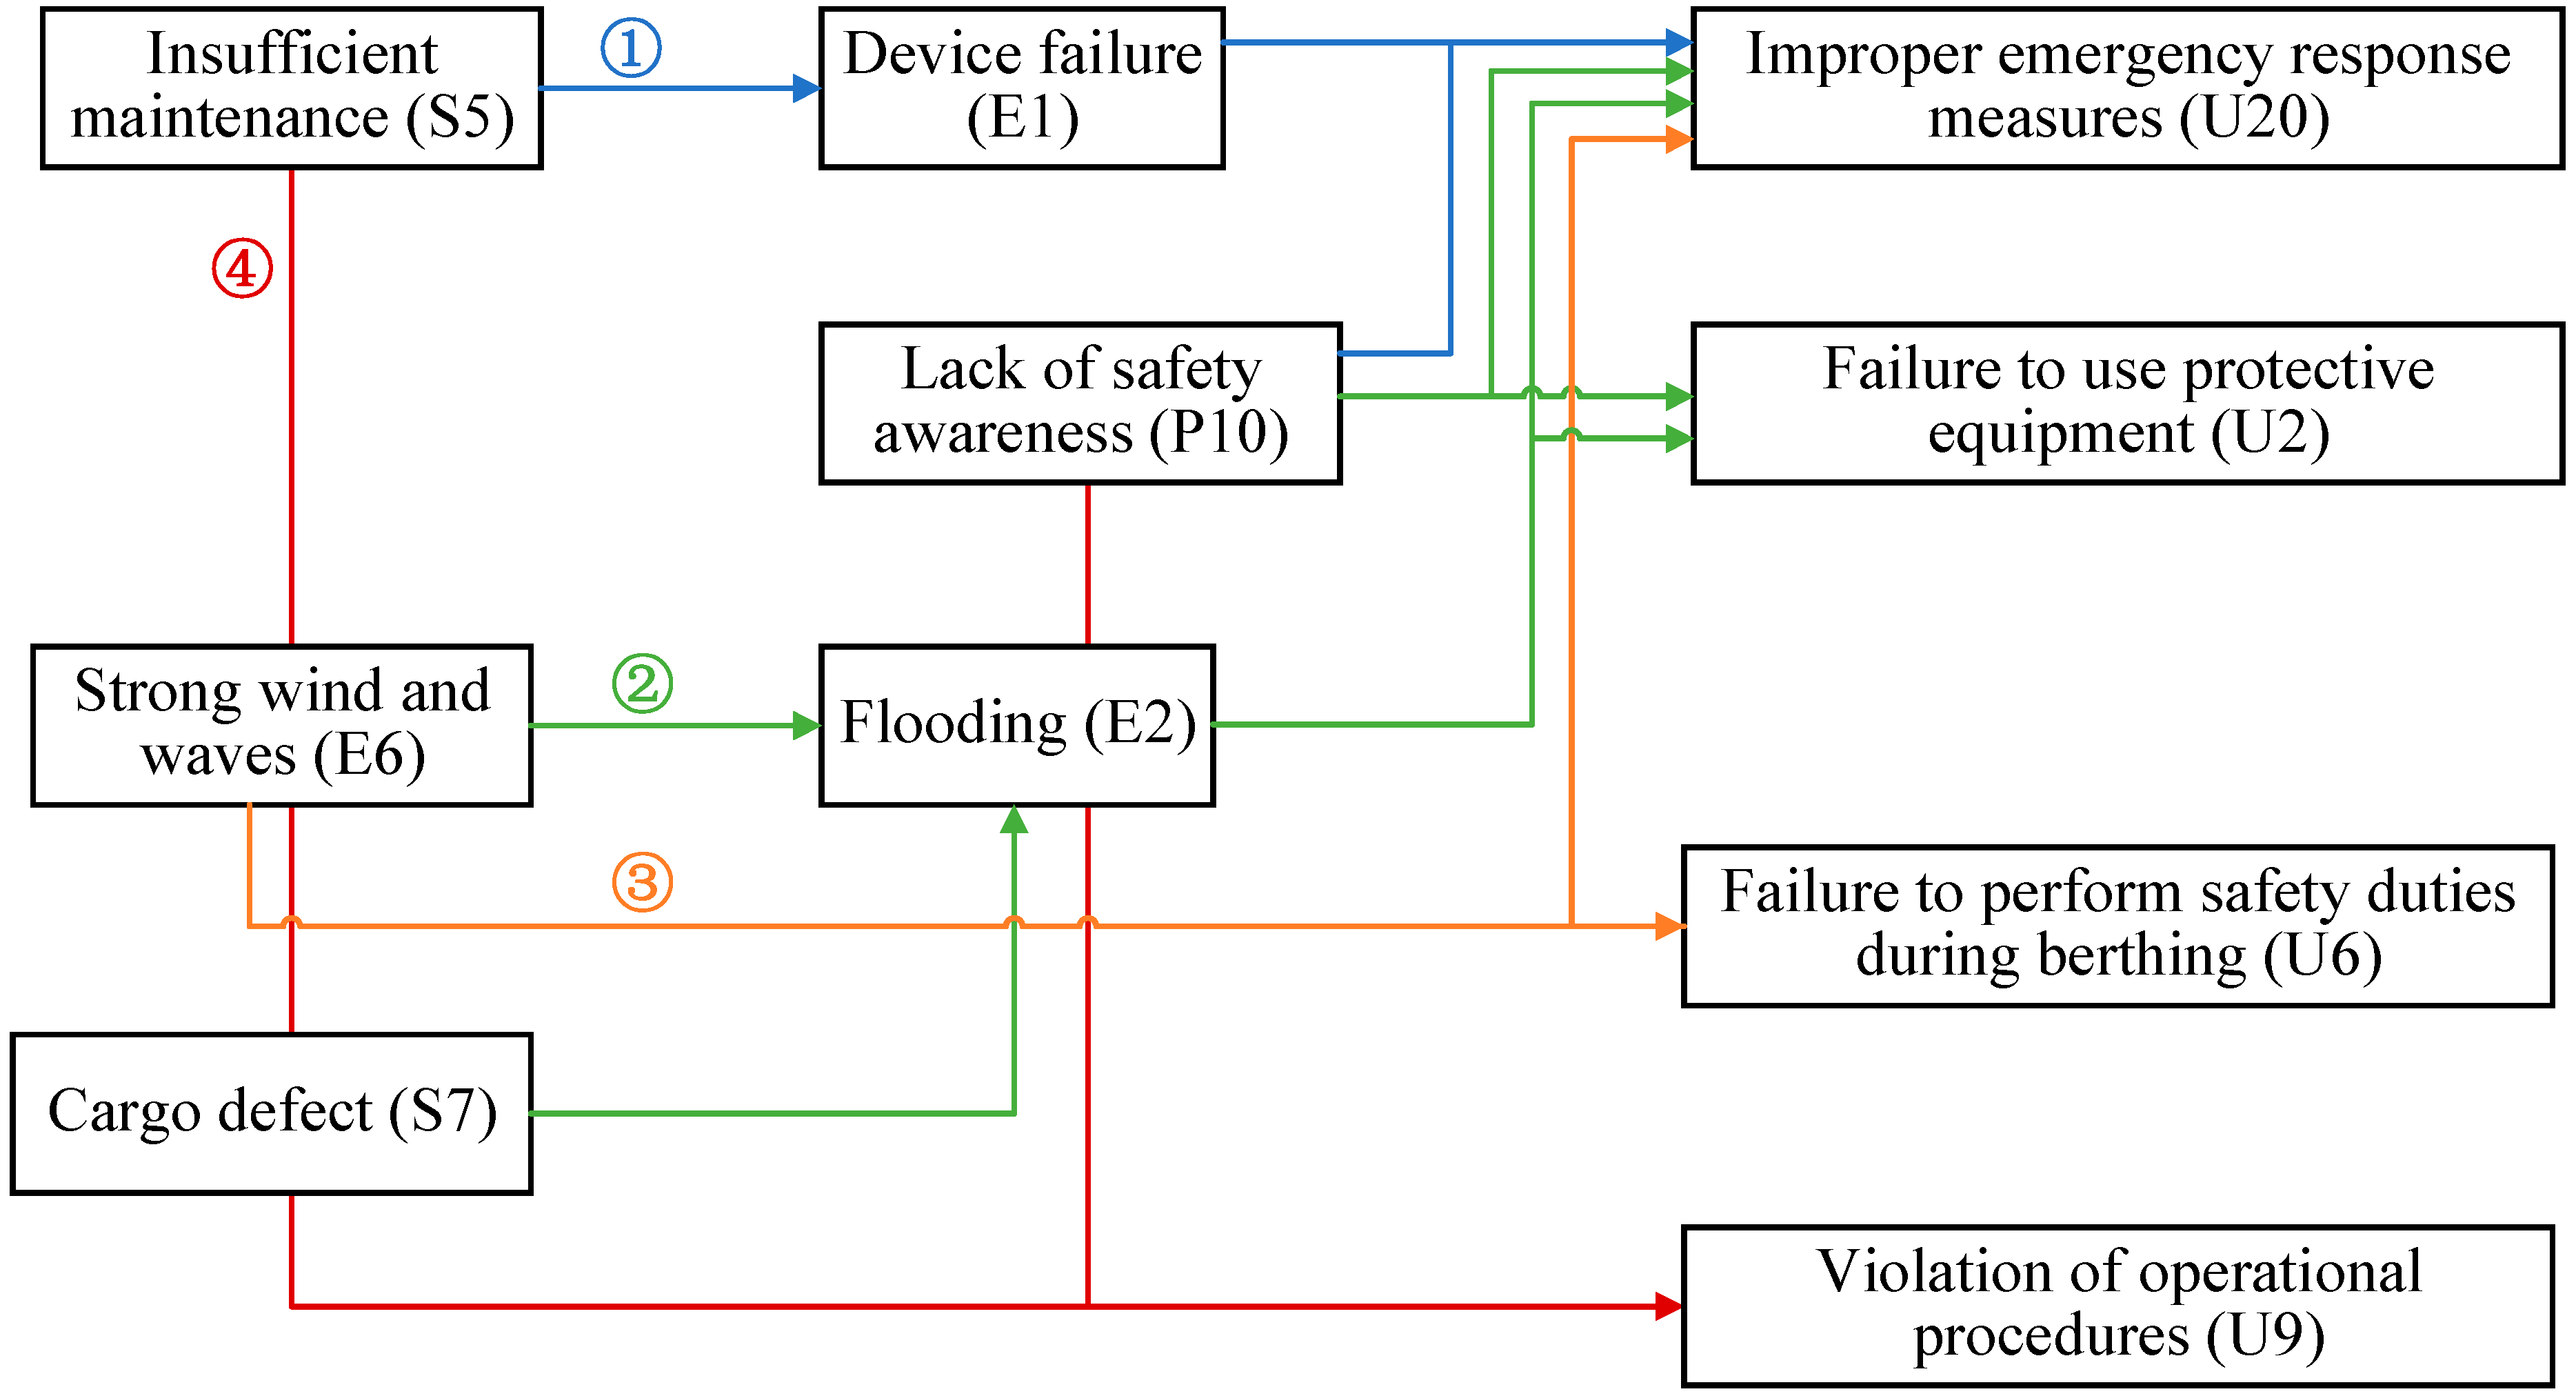
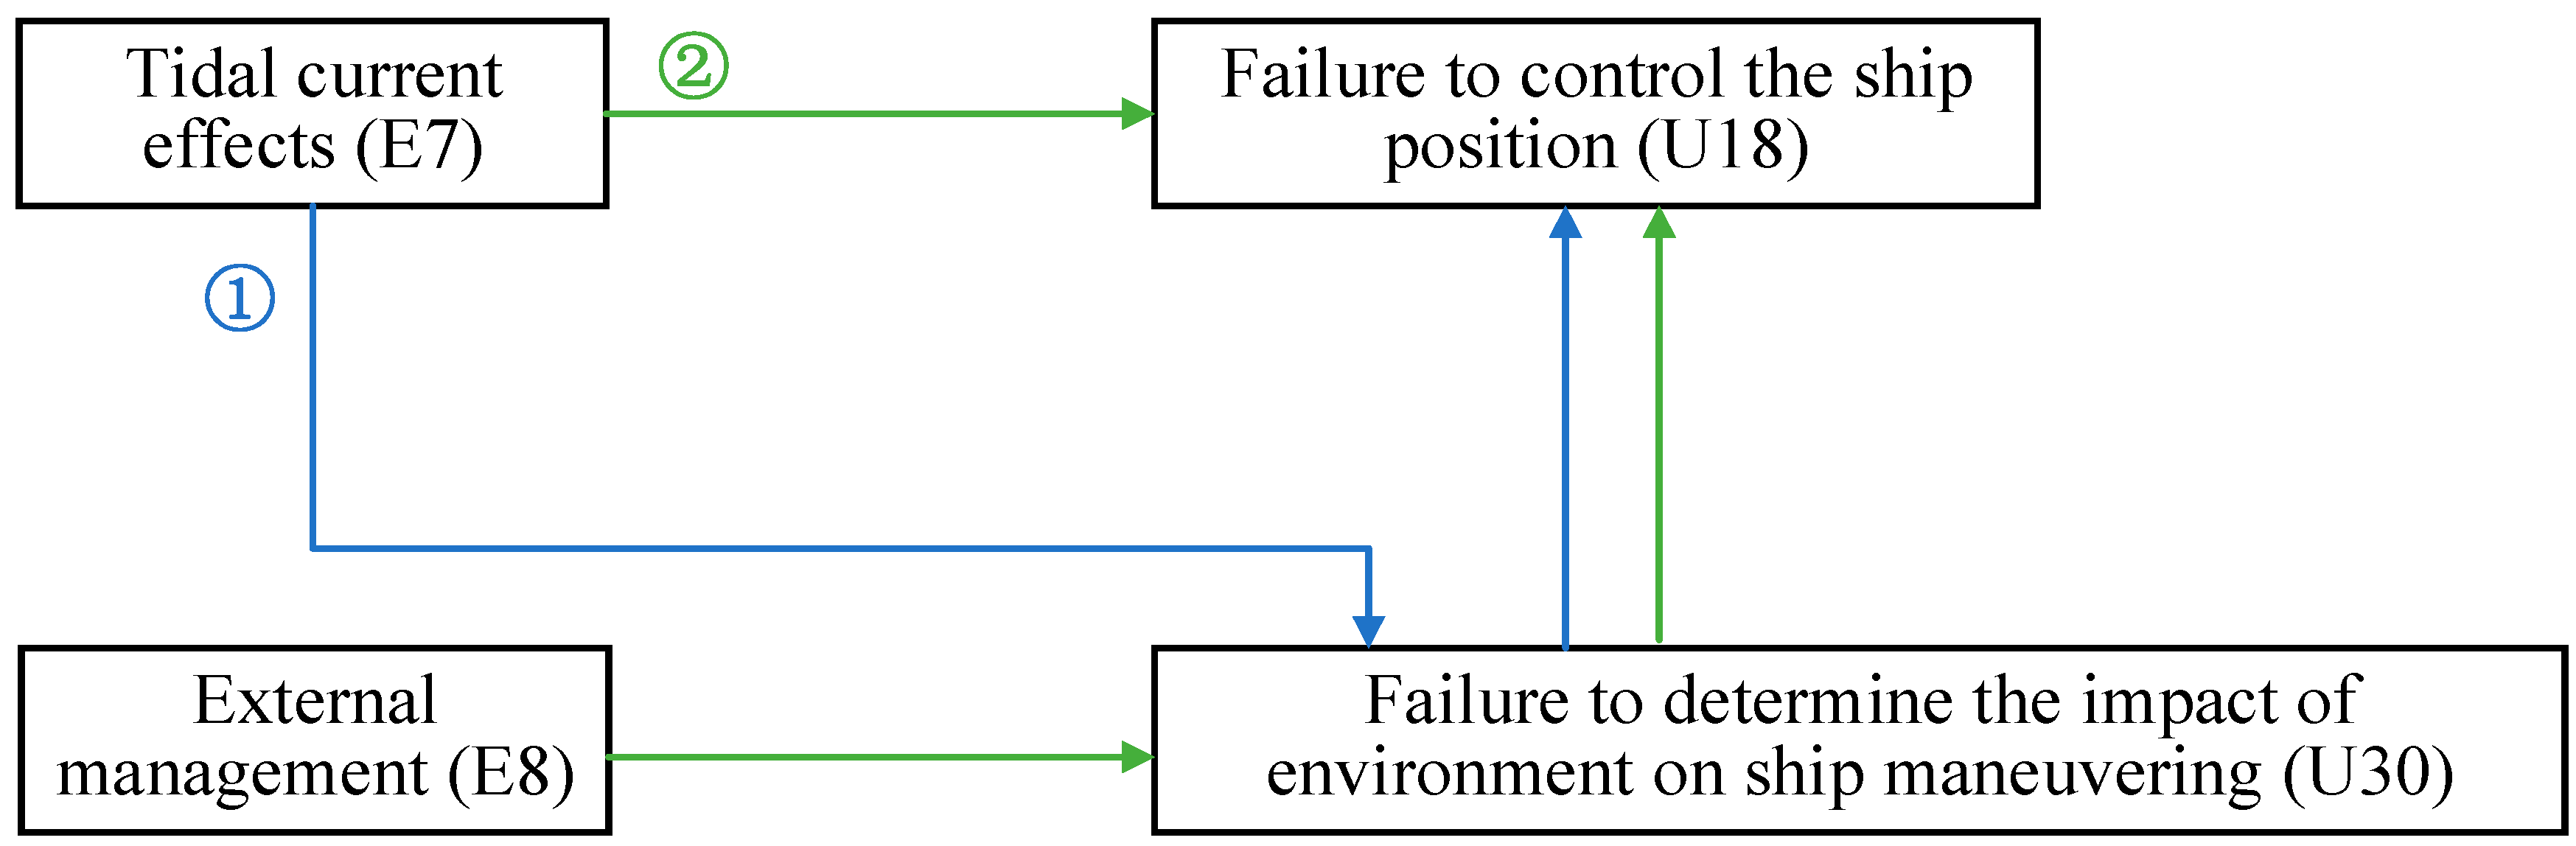
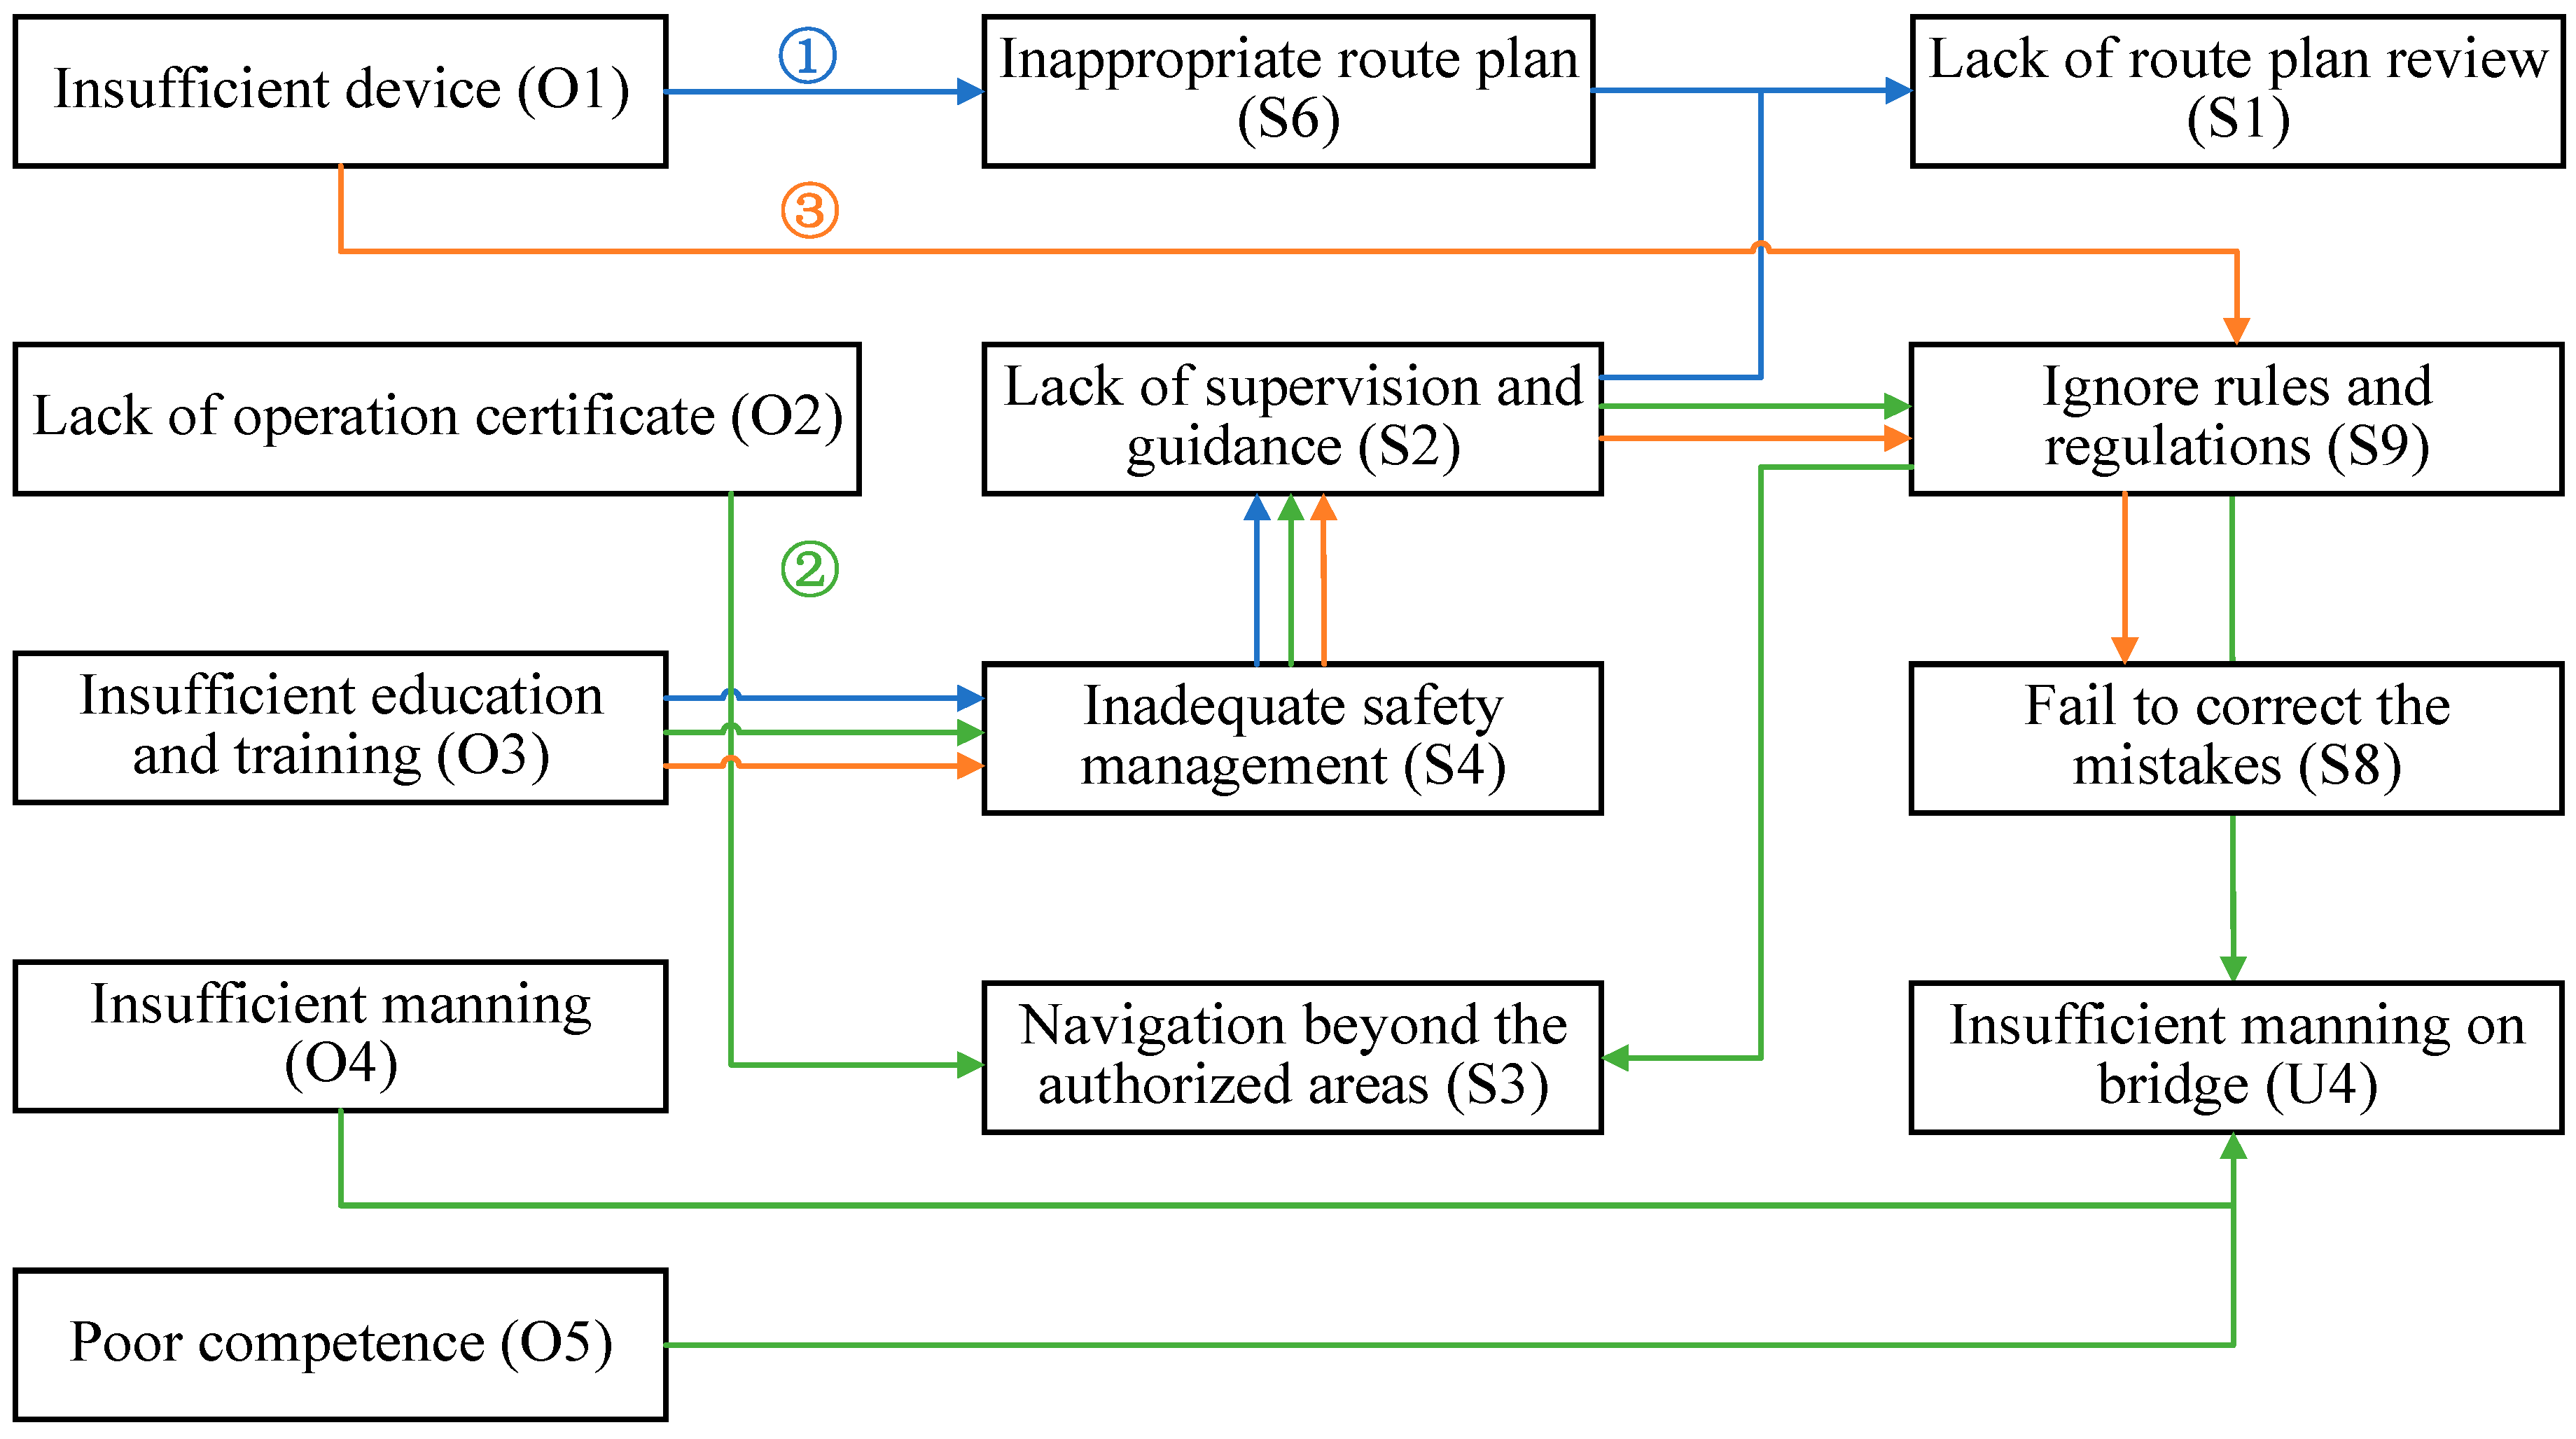
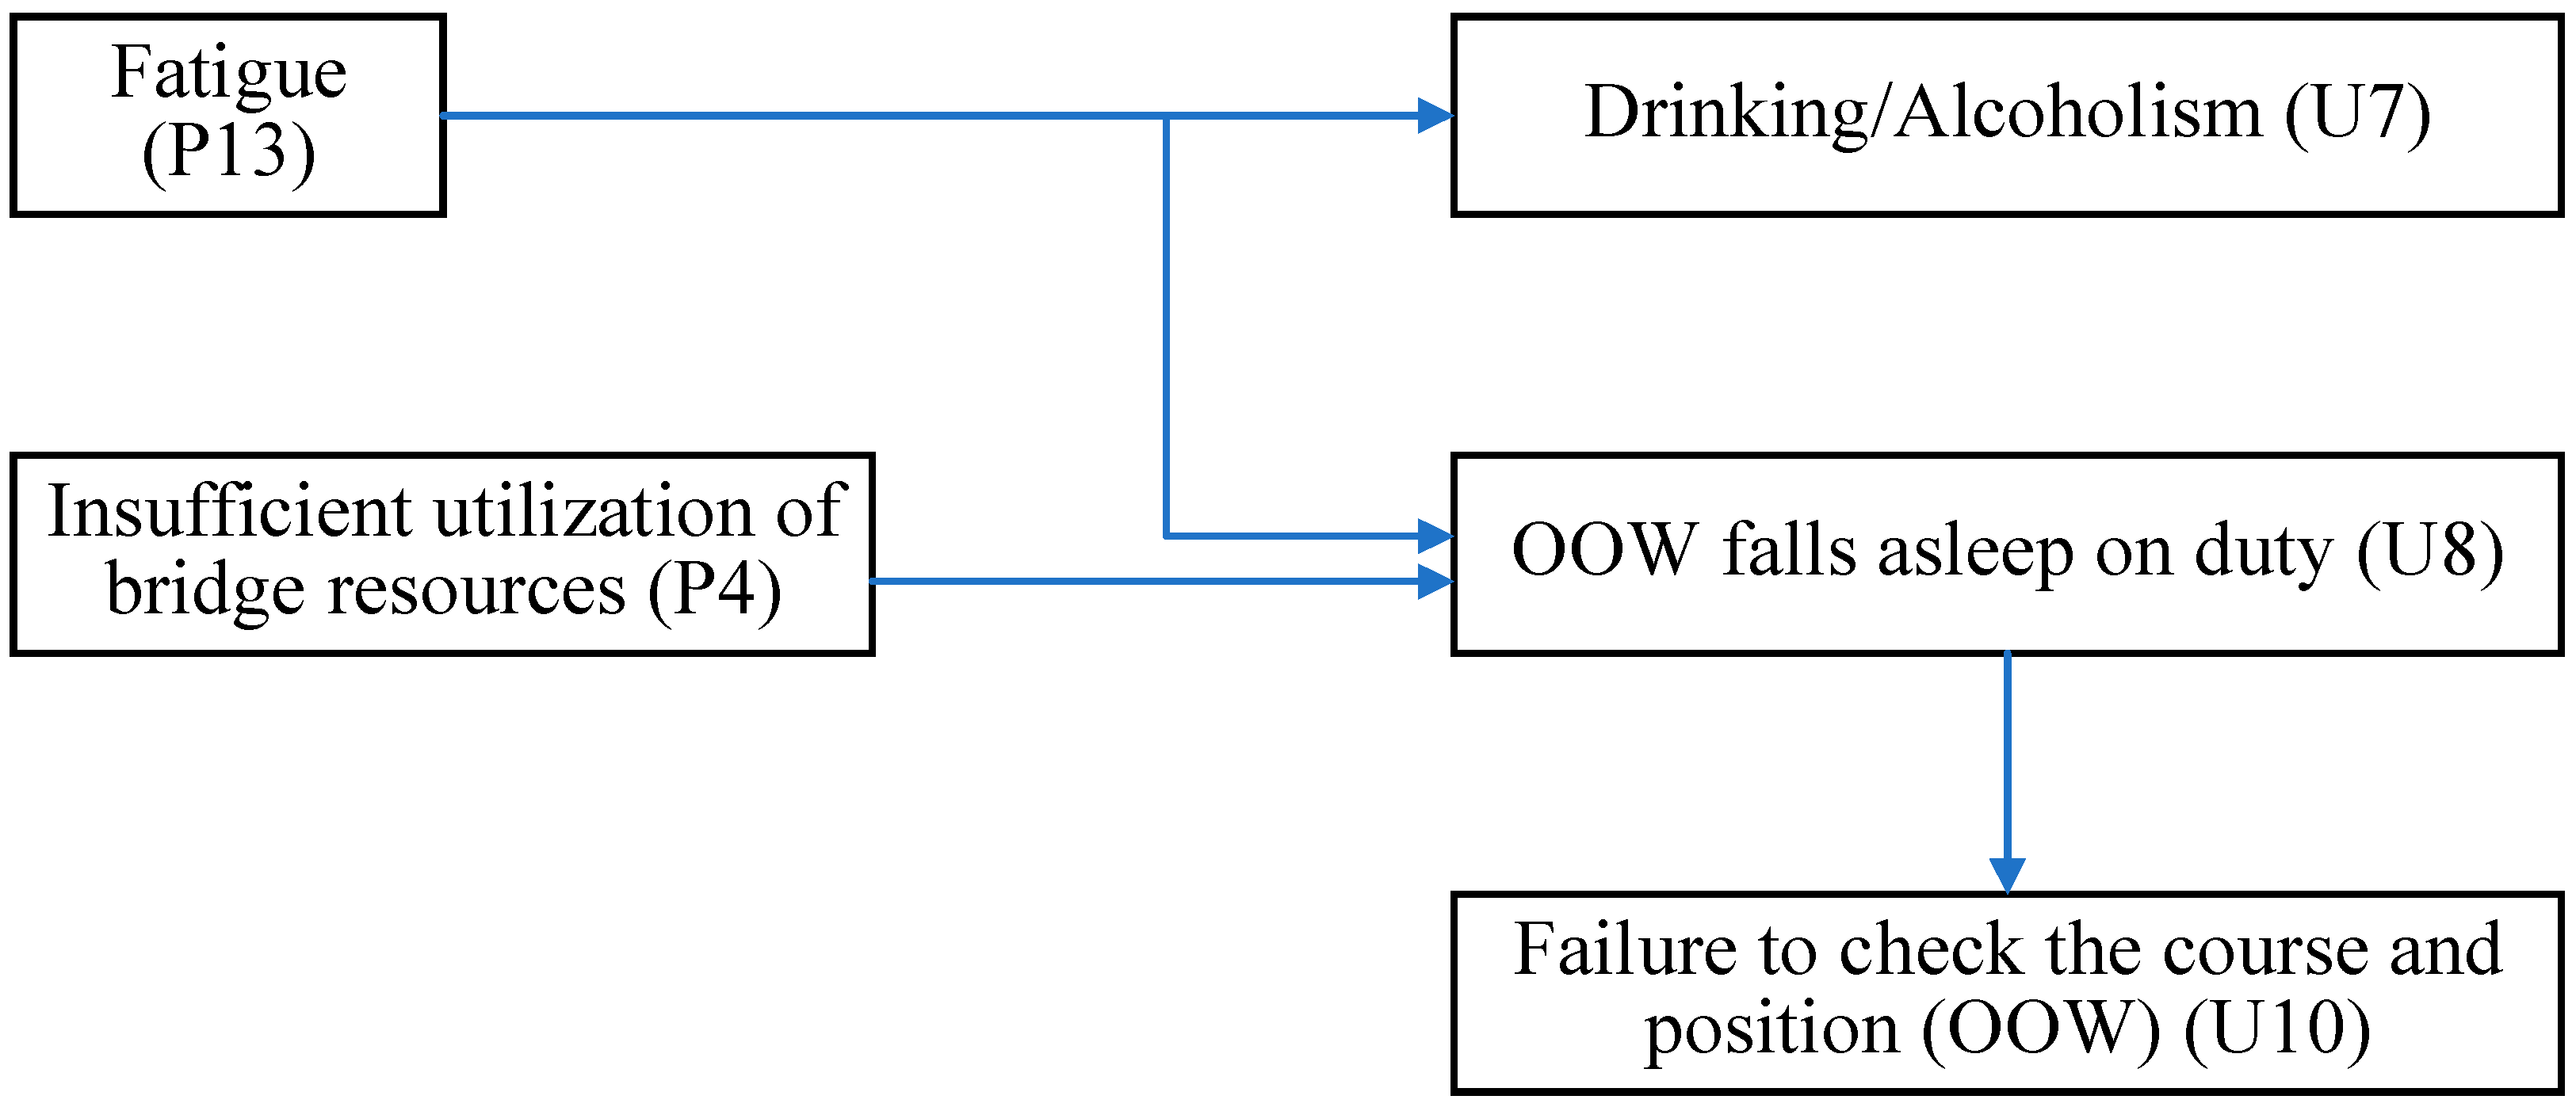
The confidence value of the association rules is used as the weight w i j of the edges. To clarify the process, suppose five rules, define R as risk factor, and the confidence values are marked with different colors in Figure 3.

3.3.2. Network Topology Features

Each network has specific topology features to characterize its connectivity, interactions and dynamic evolution process. Analyzing the topology features of a network could provide a comprehensive understanding of the network structure and identify the key nodes and their dynamic interaction characteristics in the network.
(1) Degree
Degree in a complex network is the most basic network topology feature. The degree of a node d ( i ) represents the number of edges that connect the node to other nodes. In a directed network, the degree of node i can be divided into out-degree ( d o u t ( i ) ) and in-degree ( d i n ( i ) ). The out-degree of node i is calculated by the number of edges from node i to other nodes, while the in-degree of node i represents the number of edges from other nodes to node i , which can be expressed as [30]:
d ( i ) = j V a j i + j V a i j
d i n ( i ) = j V a j i
d o u t ( i ) = j V a i j
where V denotes the set of all nodes.
The average of the degrees of all nodes in the network d ( i ) is called the average degree of the network and is calculated as:
d ( i ) = 1 N i = 1 N d ( i )
where N denotes the total number of nodes in the network.
(2) Average path length
Average path length L is the average of the shortest paths between all possible node pairs in the network, which can quantify the distance level of the network calculated as [33]:
L = 1 N ( N 1 ) i < j l i , j
where N denotes the total number of nodes in the network; l i , j   is the number of edges of the shortest path between nodes i and j .
The network diameter is the maximum distance between any two nodes in the network, i.e., the maximum of all the l i , j . The network diameter is used to measure the density of the network, the smaller the diameter, the more densely connected the network is.
(3) Clustering coefficient
The clustering coefficient C measures the degree of aggregation between network nodes, which is defined as:
C = 2 d i / d i ( d i 1 )
where d i represents the number of edges among its neighbors; d ( i )   denotes the degree of the node. The higher the clustering coefficient of a node, the greater the likelihood that other nodes will cluster around it. The average clustering coefficient (ACC) of the network is the average of the CC of all nodes.
In directed weighted networks, the clustering coefficients also need to take into account the weights of the edges. Barrat et al. [44] defined the formula for calculating the weighted clustering coefficients C i w   as follows:
C i w = 1 s i ( d i 1 ) j , h w i j + w i h 2 a i j a i h a j h
where s i is the sum of the weights of all adjacent edges of node i ; w i j denotes the weights of the edges between adjacent nodes i and j ; w i h denotes the weights of the edges between adjacent nodes i and h .
(4) Betweenness
The betweenness of a node B i   is the number of times all shortest paths in the network pass through the node which can describes the influence of the node in the global network, and is calculated as [33]:
B i = j i h N N j h ( i ) N j h
where N j h is the number of shortest paths connecting nodes j and h ; N j h ( i ) is the number of shortest paths connecting nodes j and h and passing through node i ; N denotes the total number of nodes in the network.
The betweenness centrality of a node C B ( i )   is the normalized betweenness of the node, which is calculated as:
C B ( i ) = 2 B i ( N 1 ) ( N 2 )

3.3.3. Node Criticality

Critical node mining and assessment are important elements in complex network research when complex network theory is applied to risk analysis. In general, the criticality of nodes depends on the network model and topology. Currently, scholars have proposed various node criticality assessment methods from different perspectives, such as centrality algorithm [24], K-Shell decomposition [45], and PageRank algorithm [46]. In particular, the PageRank algorithm is a specialized algorithm developed by Google to measure the importance of a specific page relative to other pages in a search engine, and is a classic method for identifying the criticality of nodes in a directed complex network [47].
The PageRank algorithm assigns an initial PageRank value to each node in the directed network to indicate the importance of the node in its initial state, and then iterates until convergence [48]. During the iteration, each node assigns its current PageRank value equally to all connected edges of the node, and then each node obtains a new PageRank value by summing up the PageRank values assigned to all edges pointing to this node. The process iterates until the result converges to obtain the final PageRank value of the node. Note that the PageRank values of the nodes form a probability distribution on the network, so the sum of the PageRank values of all nodes will be 1. The PageRank value of node i can be defined as:
P R i = γ j V a j i d o u t ( j ) P R j + 1 γ N
where γ [ 0 ,   1 ) is a damping factor ensuring the algorithm never gets stuck in a “sinking node”; N denotes the total number of nodes in the network.
The interaction network of seafarers’ unsafe acts and their influencing factors to be constructed in this study belongs to a directed weighted network, therefore, considering the weighted characteristics of the network, the weighted PageRank algorithm is used to perform the node criticality analysis, which is expressed as [49]:
P R i = γ j V w j i s o u t ( j ) P R j + 1 γ N
where w j i is the weight of the edge of node j pointing to node i ; s o u t ( j ) is the sum of the weights of all output edges of node j .

3.3.4. Community Detection

Complex networks are usually locally clustered and considered to be composed of different “clusters” depending on the density of connections between different nodes in the network. A cluster is a community structure in a network, where nodes in a cluster are more densely connected, while nodes between clusters are more sparsely connected [50]. Exploring the community structure in the interaction network of seafarers’ unsafe acts and their influencing factors could help to understand the structure and function of the global network and further discover the local patterns of interaction between seafarers’ unsafe acts and their influences in the network. The same pattern represents the same risk mechanism among nodes and is more likely to propagate risk than nodes outside the pattern.
Commonly used community structure detection algorithms include graph partitioning-based community detection algorithm, clustering-based community detection algorithm, modularity maximization-based community detection algorithm, and random walk strategy-based community detection algorithm [51]. In this regard, the community discovery algorithm based on random walk strategy considers that random walk in the network tends to “fall” into the densely connected part corresponding to the community. As a result, Pons and Latapy [52] proposed a random walk-based inter-vertex similarity measure method, which could efficiently discover the community structure of the network when there are less than 1000 nodes in the network [53].
The basic idea of the method is that short-distance random walk tends to stay in the same community. The random walk on a network G is driven by its transition matrix P , which can be obtained from the adjacency matrix A of the network G . The random walk of length t can be represented by the matrix Pt, where P i j t = ( P t ) i j is the probability of going from i to j through a random walk of length t . The parameter t should be set to make the random walk long enough to ensure that sufficient information about the network topology could be collected, but not too long to avoid reaching a balanced distribution. Then, the distances between all adjacent nodes are calculated by:
r i j = D 1 2 P i . t D 1 2 P j . t
where .   is the Euclidean norm; P i . t is the i t h row of P t ; P j . t   is the j t h row of P t ;   D is the degree matrix of nodes. When adjacent nodes belong to different communities, the r i j distance is larger; conversely, the r i j distance is smaller.
Similarly, the distance between two different communities can be calculated by:
r C 1 C 2 = D 1 2 P C 1 . t D 1 2 P C 2 . t
where P C . t is the probability vector that go from community C to vertex j in t steps:
P C j t = 1 | C | i C P i j t
Next, two adjacent communities are selected to merge into a new community and the distance between communities is updated, and the process is repeated to minimize the change σ ( C 1 , C 2 ) between all community pairs in the current division.
σ ( C 1 , C 2 ) = 1 n | C 1 | | C 2 | | C 1 | + | C 2 | r C 1 C 2 2
As research progresses, many community detection methods are proposed. It is also crucial to evaluate and compare the quality of the community detection results found by these methods. Clauset et al. [54] proposed Modularity to evaluate the closeness of each community structure after the division of the network structure. The basic idea is that the probability of connectivity between nodes in a community is greater than the probability of connectivity between nodes in other communities. The higher the connection density between nodes in a community, the better the quality of the community, which is calculated as:
Q = 1 2 m i , j ( A i j d i d j 2 m ) δ ( c i , c j )
where m is the number of edges; A i j is the element of A adjacency matrix in the i t h row and j t h column; d i and d j are the degrees of nodes i and   j , respectively; δ ( c i , c j )   is used to determine whether nodes i and j are both in the same community; if they are in the same community, then δ ( c i , c j ) = 1 , otherwise it is equal to 0. The modularity takes values between 0 and 1. When the modularity value is equal to 0, it means that all nodes in the complex network are classified in the same community. In general, the discovered community is considered to have a good community structure when the modularity value is between 0.3 and 0.7 [54].

4. Results and Discussion

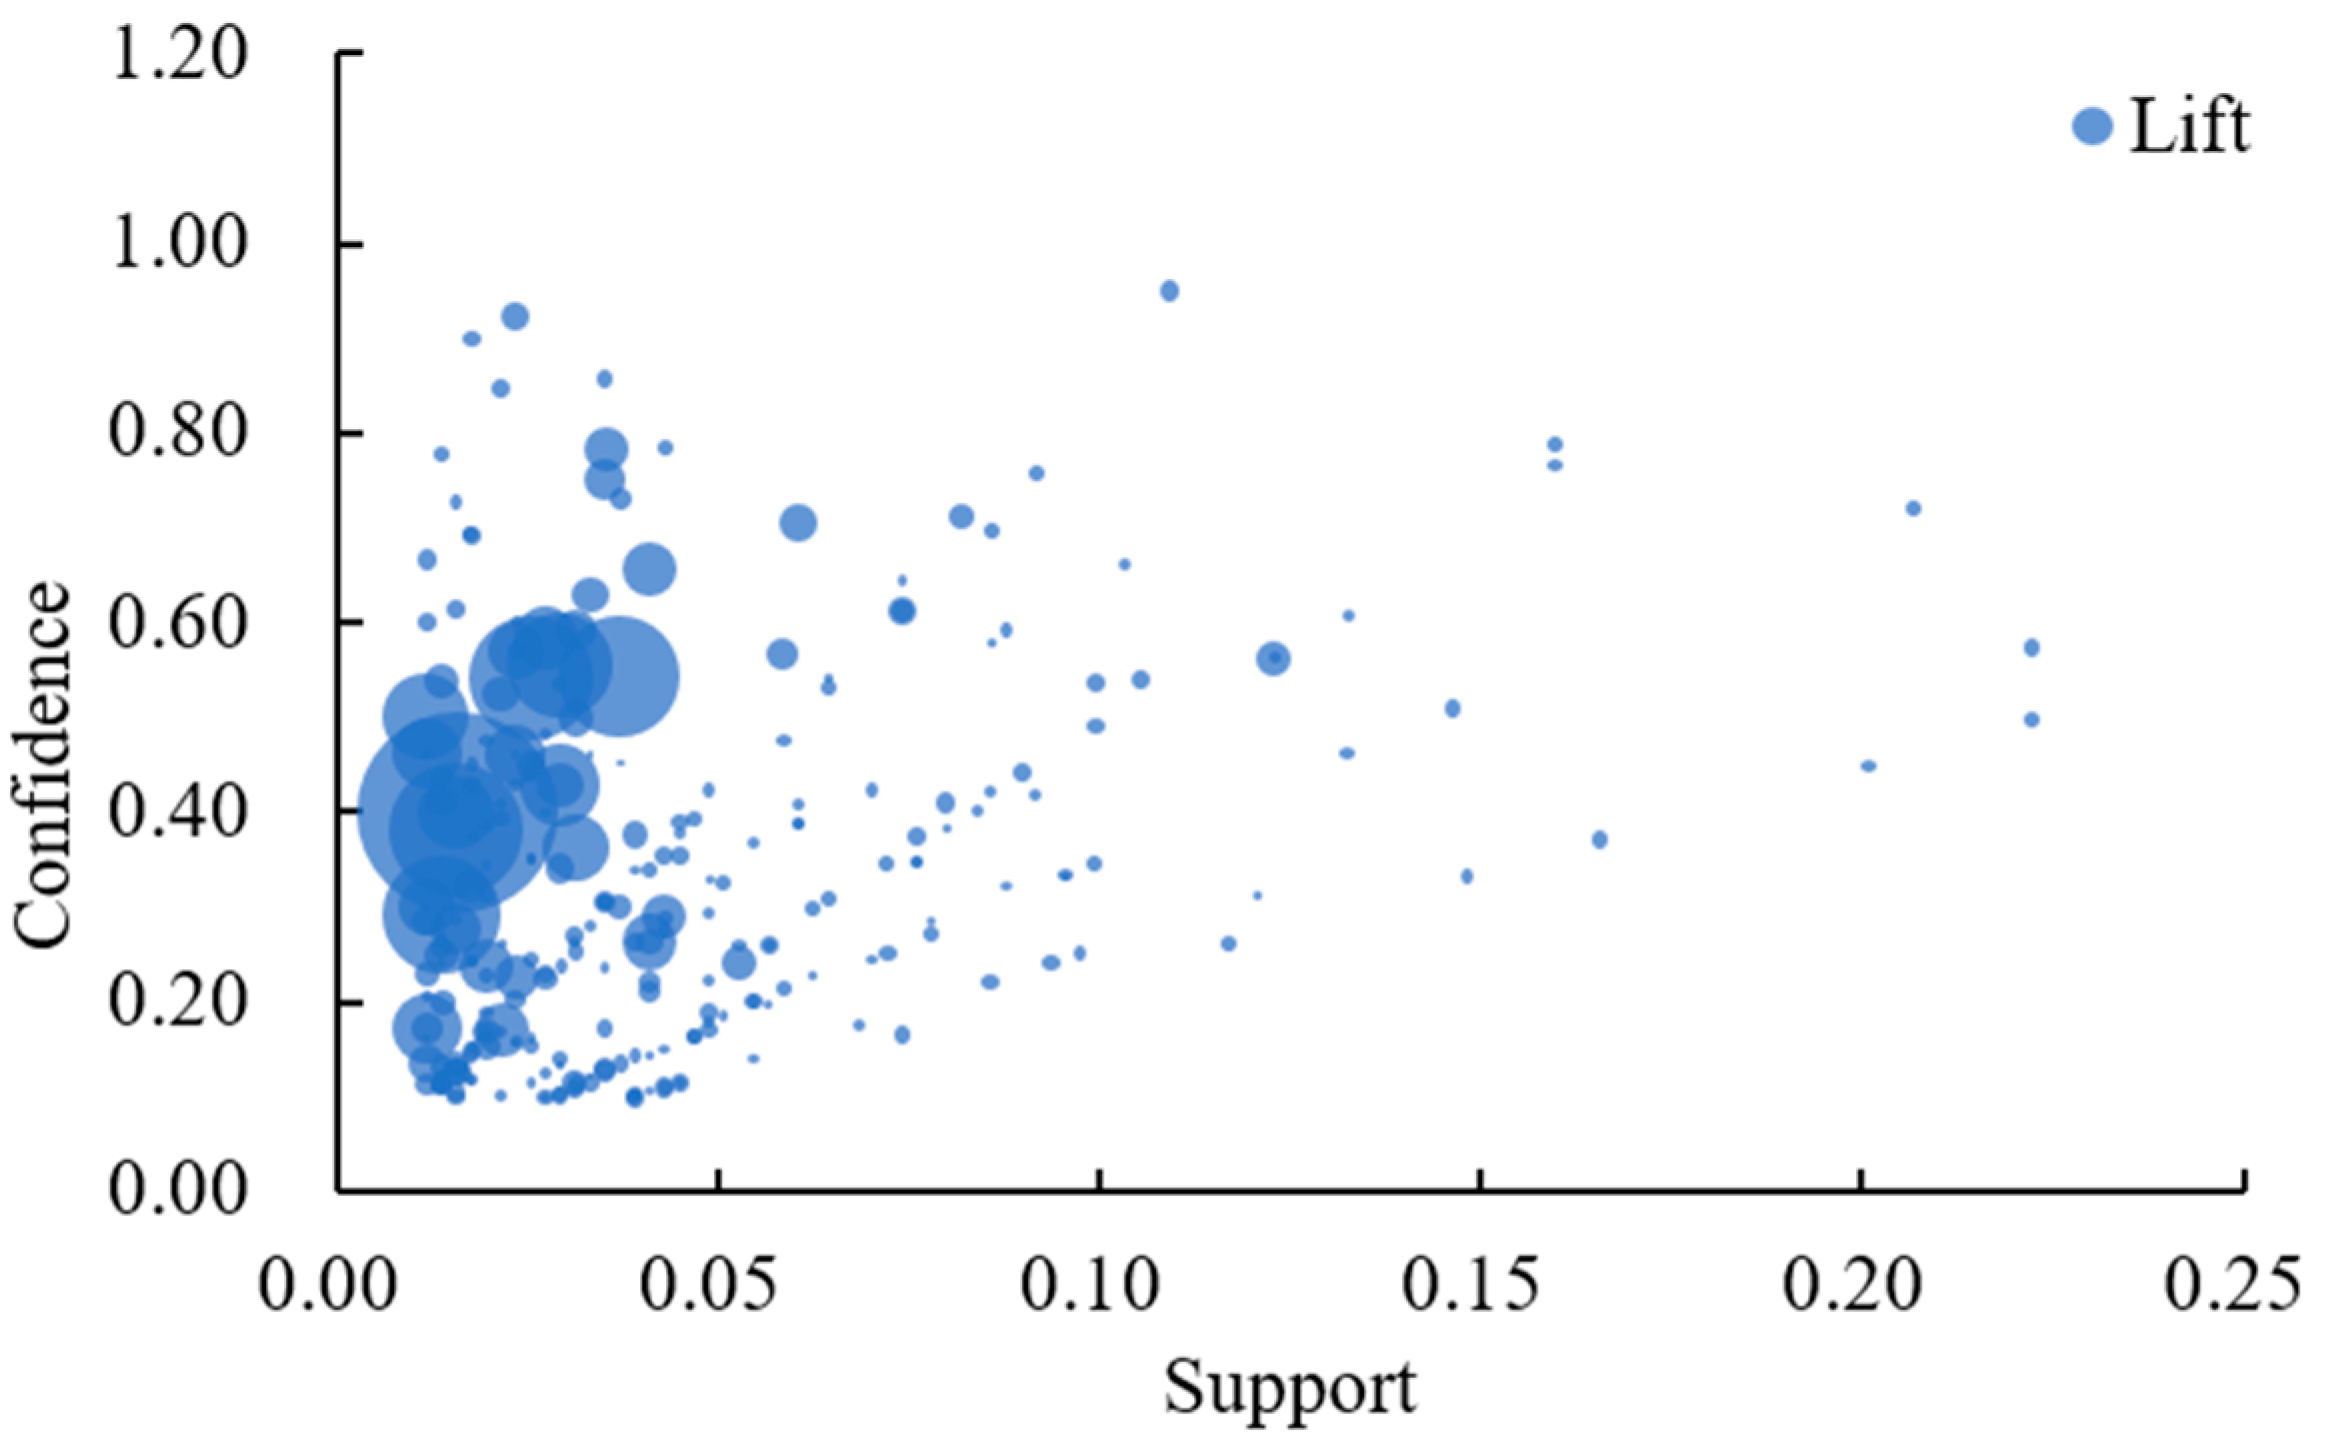
4.1. Complex Network Development Based on AR

In the present study, association rule mining is implemented by R 4.3.1 using the package “arules”. Due to the data imbalance problem in the dataset, in order to focus on the less frequently occurring interactions among seafarers’ unsafe acts and their influencing factors, this study set the minimum support to 0.01, the minimum confidence to 0.1, the lift to greater than 1, and the maximum length of the itemset to 2 after many trials. Finally, a total of 504 association rules are obtained. Then, the interactions between the LHS and RHS in these association rules are further analyzed, and the rules with inverse or unreasonable relationships are removed. Finally, 260 association rules are retained, as shown in Figure 4.
Based on the generated 260 association rules, this study developed an interaction network of seafarers’ unsafe acts and their influencing factors with 53 nodes and 260 directed edges, as shown in Figure 5. The circles represent the nodes and the arrows represent the directed edges.

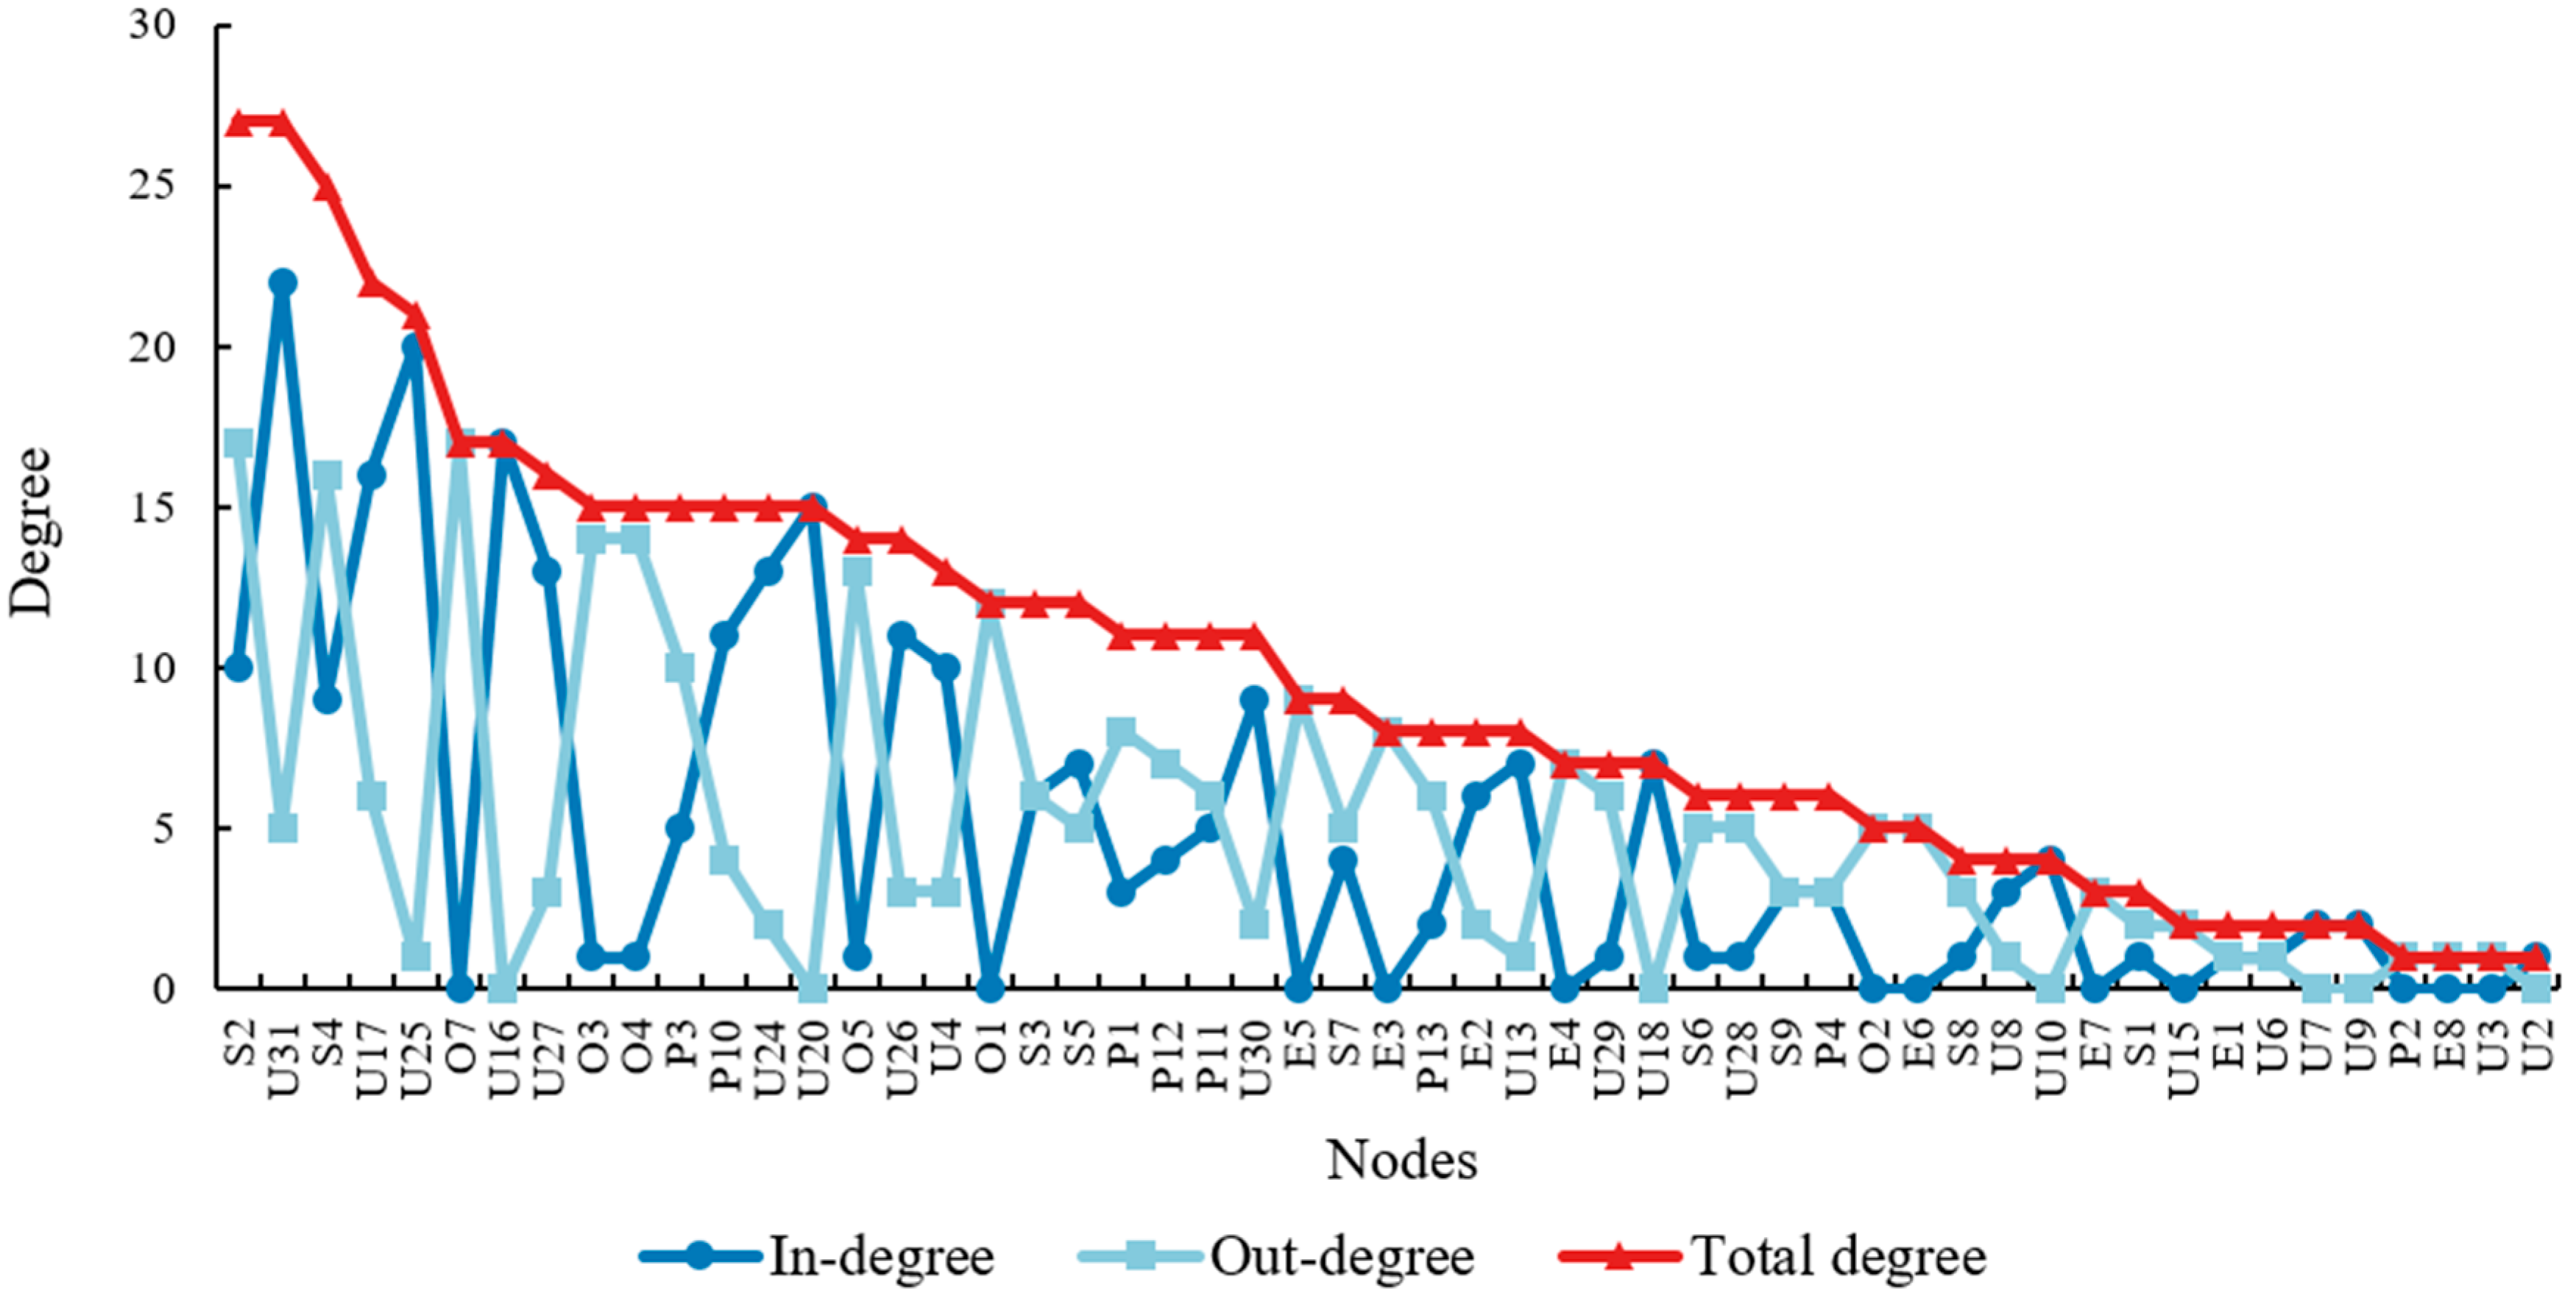
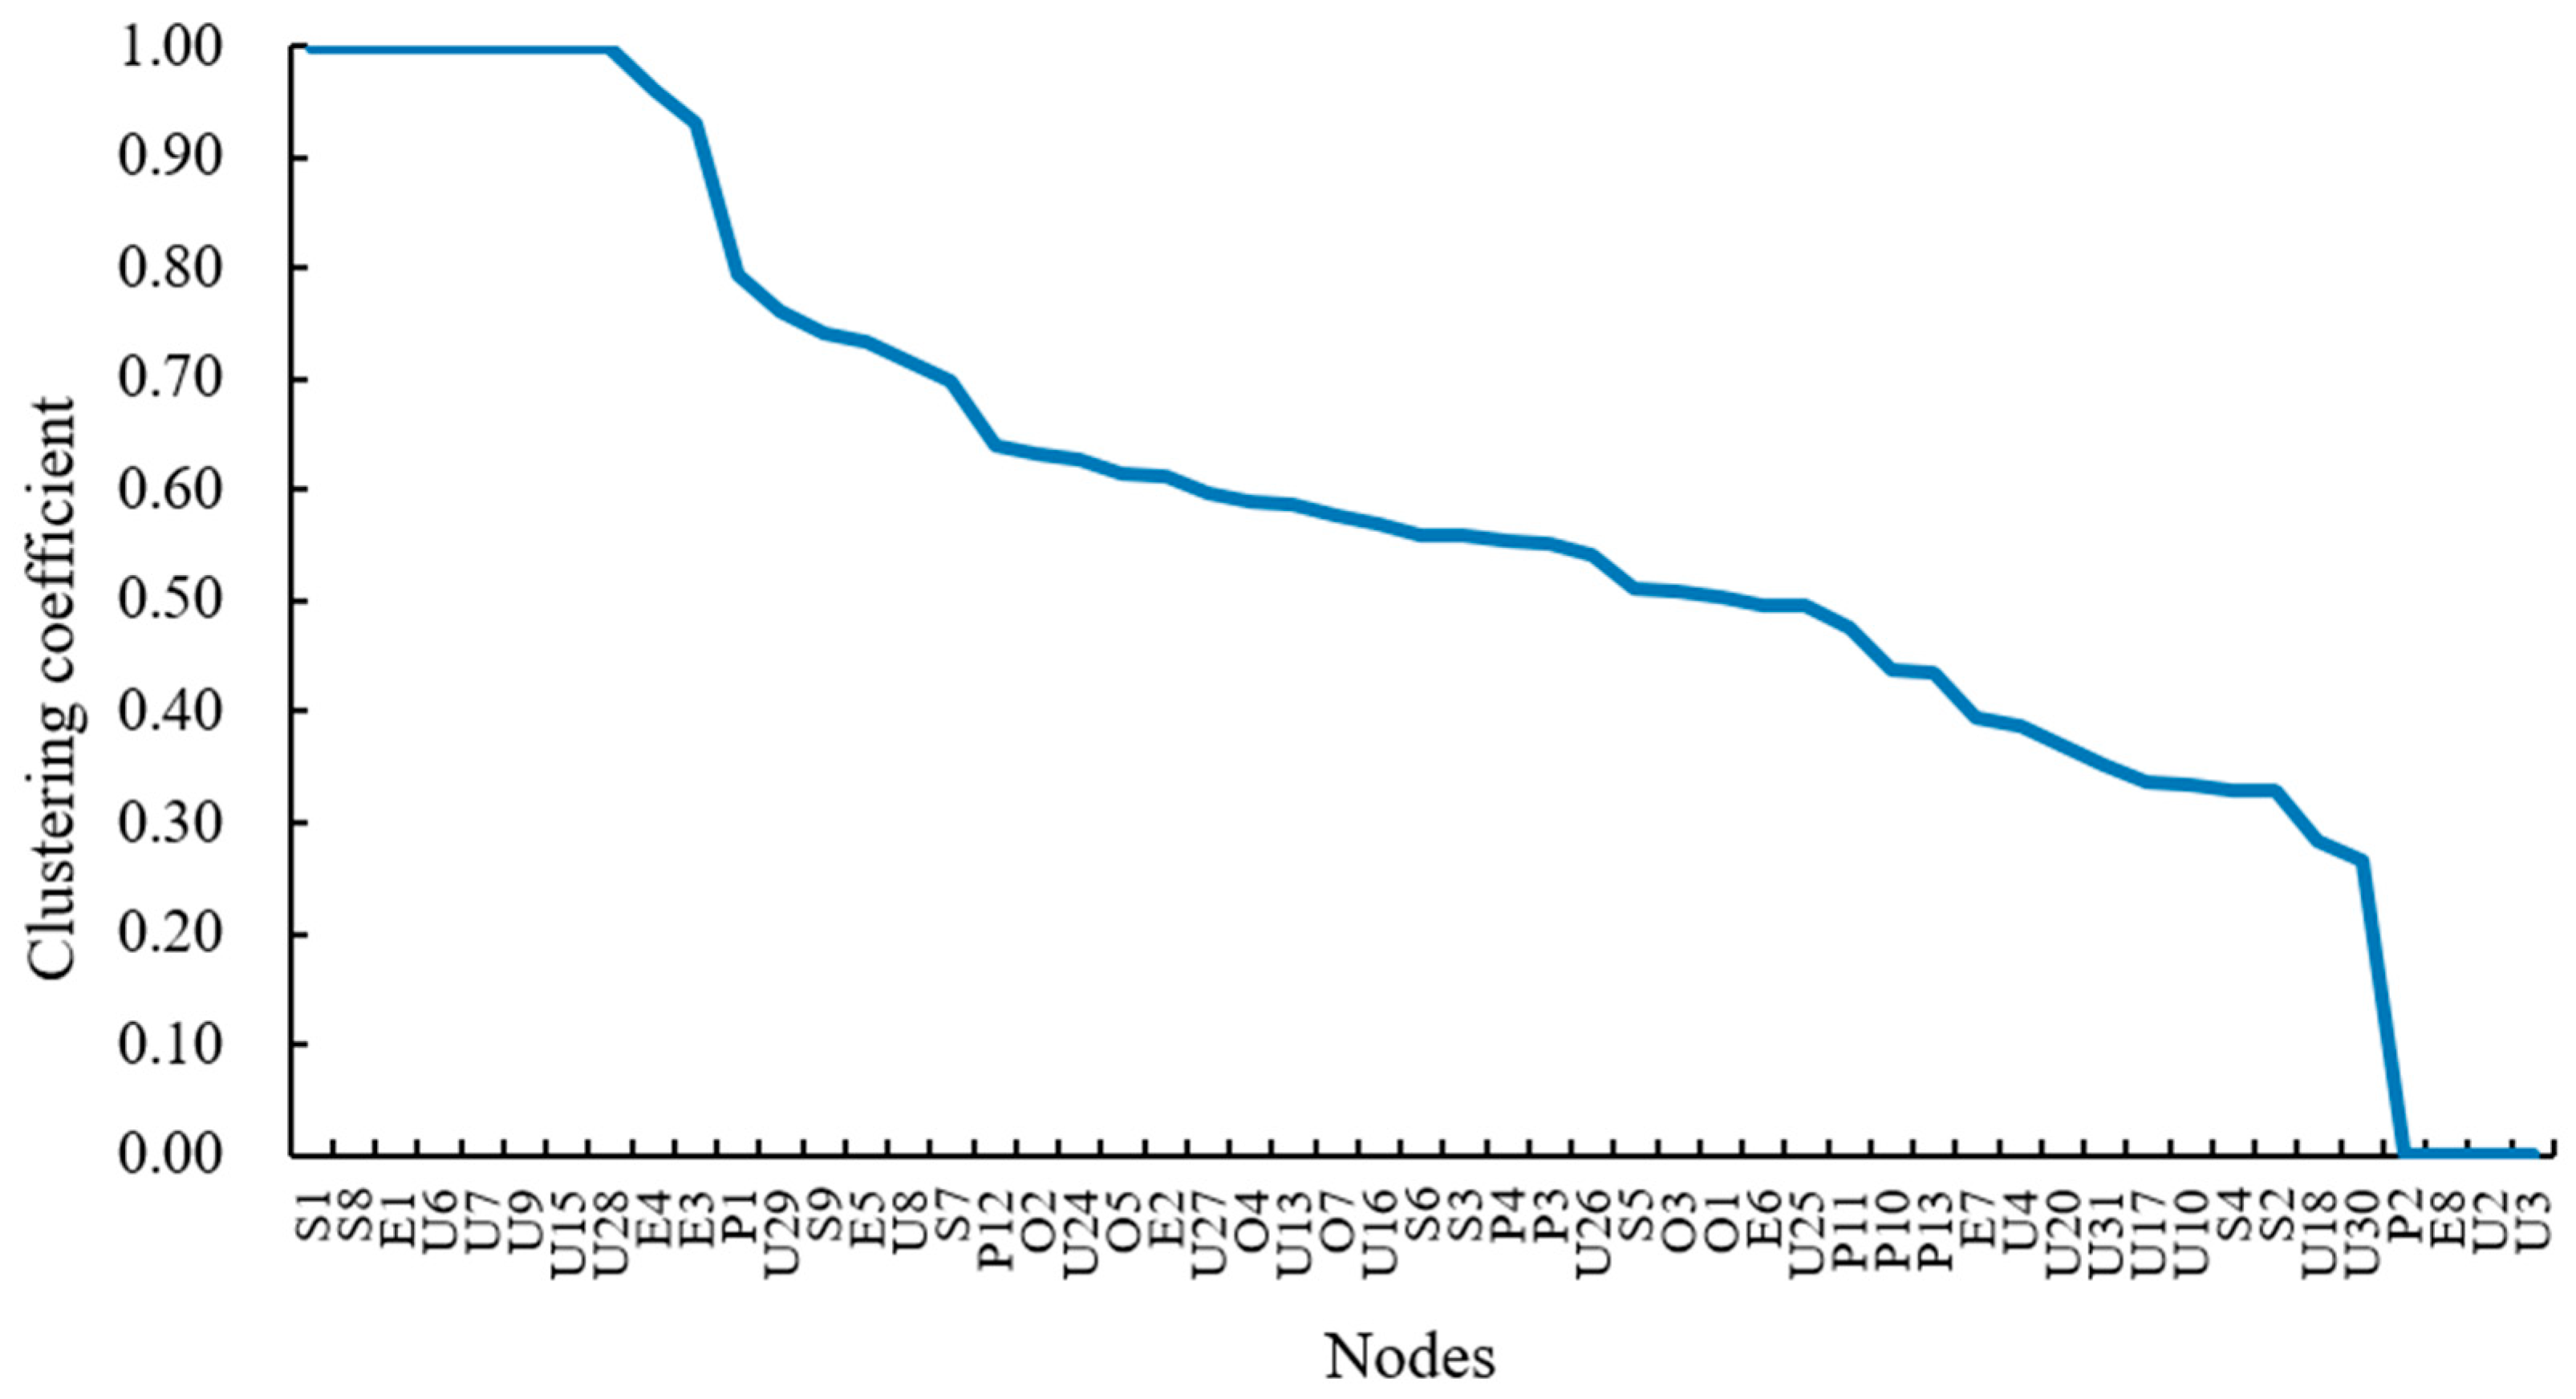
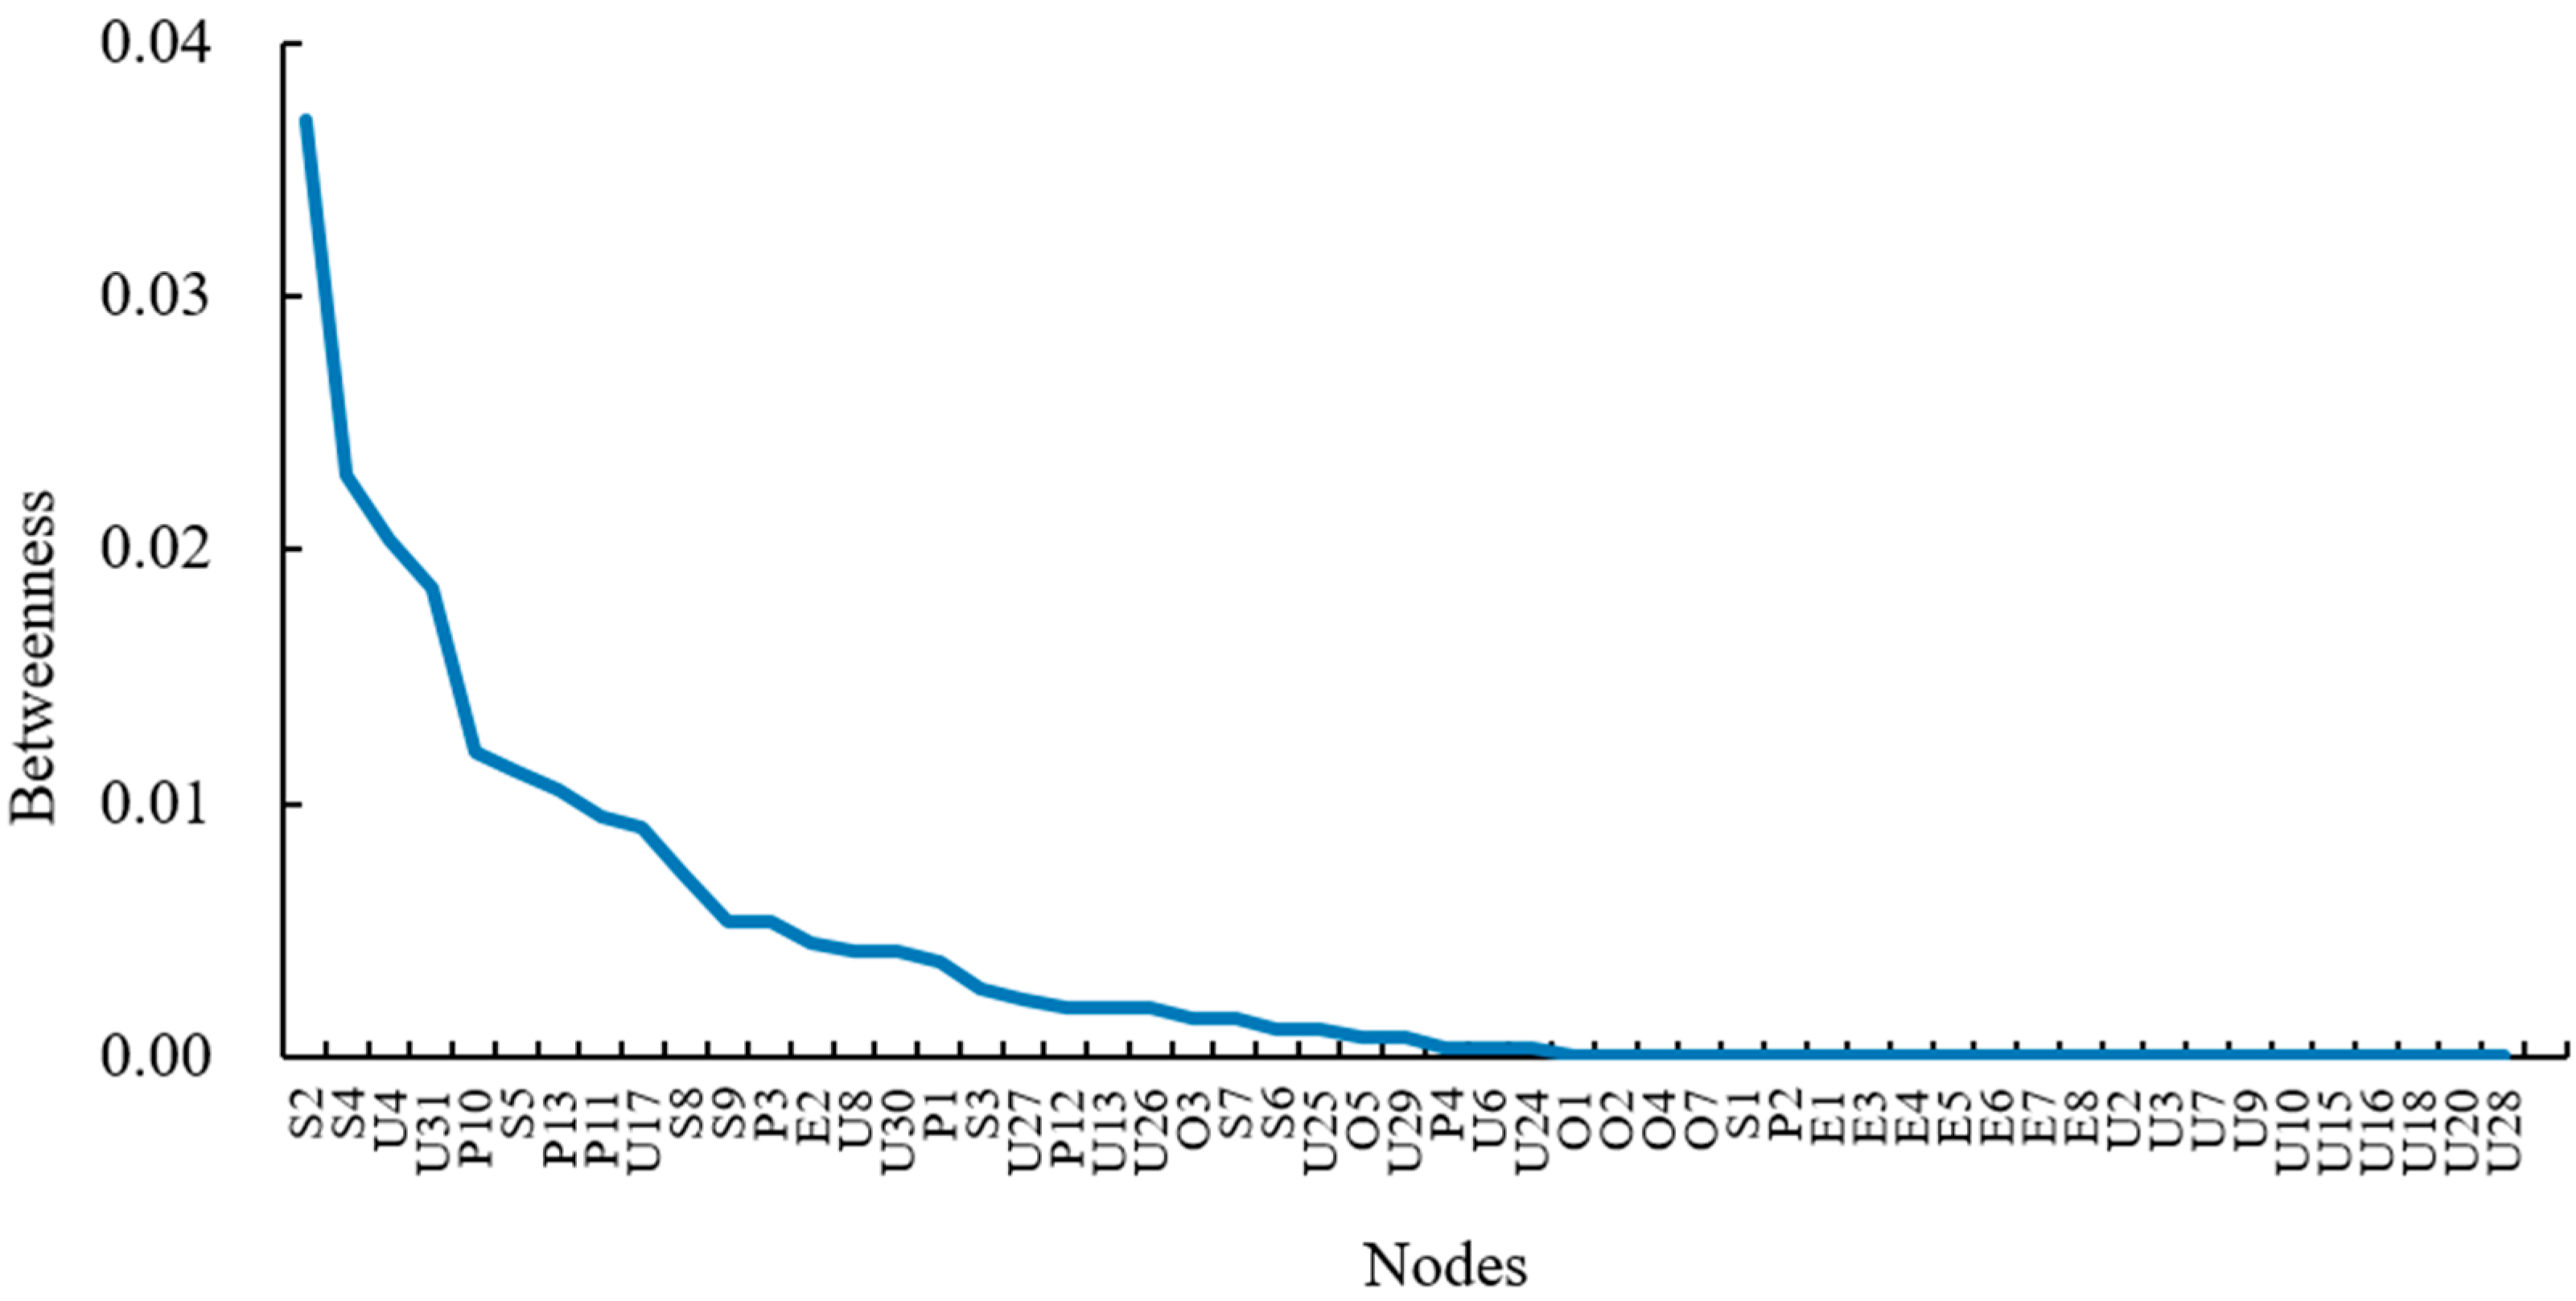
4.2. Network Topology Feature Analysis

(1) Degree
The degree of a node in a complex network is one of the most important and fundamental features for analyzing the network topology. In the developed interaction network of seafarers’ unsafe acts and their influencing factors, the degree of a node is the number of seafarers’ unsafe acts and their influencing factors that directly connected to other seafarers’ unsafe acts and their influencing factors. The degree of a node reflects the direct influence of the node in the network, the more connections a node has, the greater the influence of that node in the network. The in-degree, out-degree, and total degree values of the nodes in the interaction network of seafarers’ unsafe acts and their influencing factors are shown in Figure 6.
It can be seen that the nodes with high in-degree values include failure to determine the risk (U31), failure to take effective collision avoidance action early (U25), and failure to make proper sound and light signals (U16), which are significantly influenced by adjacent nodes and may lead to serious consequences. In particular, failure to determine the risk (U31) has the largest in-degree with a value of 22, but the out-degree value is only 5, indicating that there are 22 seafarers’ unsafe acts and their influencing factors in the interaction network that can lead to seafarers’ failure to determine the risk. On the other hand, the nodes with high out-degree values include lack of supervision and guidance (S2), inadequate safety management (S4), and lack of standardization (O7), which have a higher direct impact on adjacent nodes. The nodes with the highest total degree values are failure to determine the risk (U31) and lack of supervision and guidance (S2) with a degree value of 27, followed by inadequate safety management (S4) and failure to maintain proper lookout (U17). These nodes with high total degree values are key nodes in the interaction network, and taking proactive prevention of these influencing factors and seafarers’ unsafe acts would effectively reduce the connectivity of the network. In addition, the average degree value of the network is 9.81, which indicates that each seafarers’ unsafe act/influencing factor in the network is closely related to 9.81 other seafarers’ unsafe acts/influencing factors on average, i.e., changes in each node in the interaction network would cause changes in an average of 9.81 nodes that have a direct effect relationship with that node.
(2) Average path length
The average path length of a network is the average of the shortest path lengths between all node pairs in the network. In the developed interaction network of seafarers’ unsafe acts and their influencing factors, the average path length indicates the risk propagation rate of seafarers’ unsafe acts and their influencing factors in the network. If the average path length of the network is shorter, it means that fewer intermediate nodes need to pass between nodes, indicating faster risk propagation rate of seafarers’ unsafe acts and their influencing factors in the network.
The average path length of the interaction network is 1.8048, which means that a change in any seafarers’ unsafe act/influencing factor in the network would cause a change in other seafarers’ unsafe act/influencing factor that is not adjacent to it by only 1.8048 steps on average. In addition, the diameter of the network is 5, which is the distance between the lack of supervision and guidance (S2) and insufficient utilization of bridge resources (P4), indicating that it takes at most 5 steps for any one seafarer’s unsafe act/influencing factor to affect another seafarer’s unsafe act/influencing factor in the interaction network.
(3) Clustering coefficient
The clustering coefficient refers to the ratio of the adjacent nodes of the nodes in the network that are also connected to each other. In the developed interaction network of seafarers’ unsafe acts and their influencing factors, the weighted clustering coefficient is used to reflect the aggregation of seafarers’ unsafe acts and their influencing factors, as shown in Figure 7.
The weighted clustering coefficient of lack of route plan review (S1), failure to correct mistakes (S8), device failure (E1), failure to perform safety duties during berthing (U6), drinking/alcoholism (U7), violation of operational procedures (U9), failure to exhibit proper light and shape (U15), and failure to follow the rules in restricted visibility (U28) is 1. The results indicate that once these seafarers’ unsafe acts or influencing factors change in the network, they are very likely to lead to chain reactions or even cause larger-scale catastrophes in the system, so it is necessary to strengthen the pre-control of these seafarers’ unsafe acts and influencing factors to reduce the chain reactions brought by them. The average weighted clustering coefficient of the interaction network is the average of the clustering coefficient of all the seafarers’ unsafe acts and their influencing factors, and its value is 0.6203, which indicates that the nodes in the network tend to surround the hub nodes with high clustering coefficient, and the risky interaction could be generated through fewer edges. In addition, the unweighted network clustering coefficient is 0.6042, which indicates that the relationship between seafarers’ unsafe acts and influencing factors in the network tends to be more clustered based on the effect of weighting.
(4) Betweenness
Betweenness is the number of times all shortest paths in the network pass through the node. In the developed interaction network of seafarers’ unsafe acts and their influencing factors, the betweenness can reflect the mediator role played by seafarers’ unsafe acts and their influencing factors in the risk propagation process. The higher the betweenness value of a node, the greater the role of the node as a mediator in the network. The betweenness centrality of nodes refers to the normalized betweenness of nodes, and the results are shown in Figure 8.
There are 23 nodes in the interaction network with a betweenness centrality of 0, indicating that these 23 nodes do not act as a mediator in the network. Lack of supervision and guidance (S2) has the largest value of betweenness centrality, about 0.0370, which indicates that the number of shortest paths through this node in the network is the largest. This is followed by the lack of safety management (S4) and insufficient manning on bridge (U4), with betweenness centrality values of 0.0230 and 0.0204, respectively.
In the interaction network, preventing the appearance of these seafarers’ unsafe acts and influencing factors would effectively increase the average path length and diameter of the network, reduce the connectivity between seafarers’ unsafe acts and influencing factors, and help reduce the risk propagation rate.

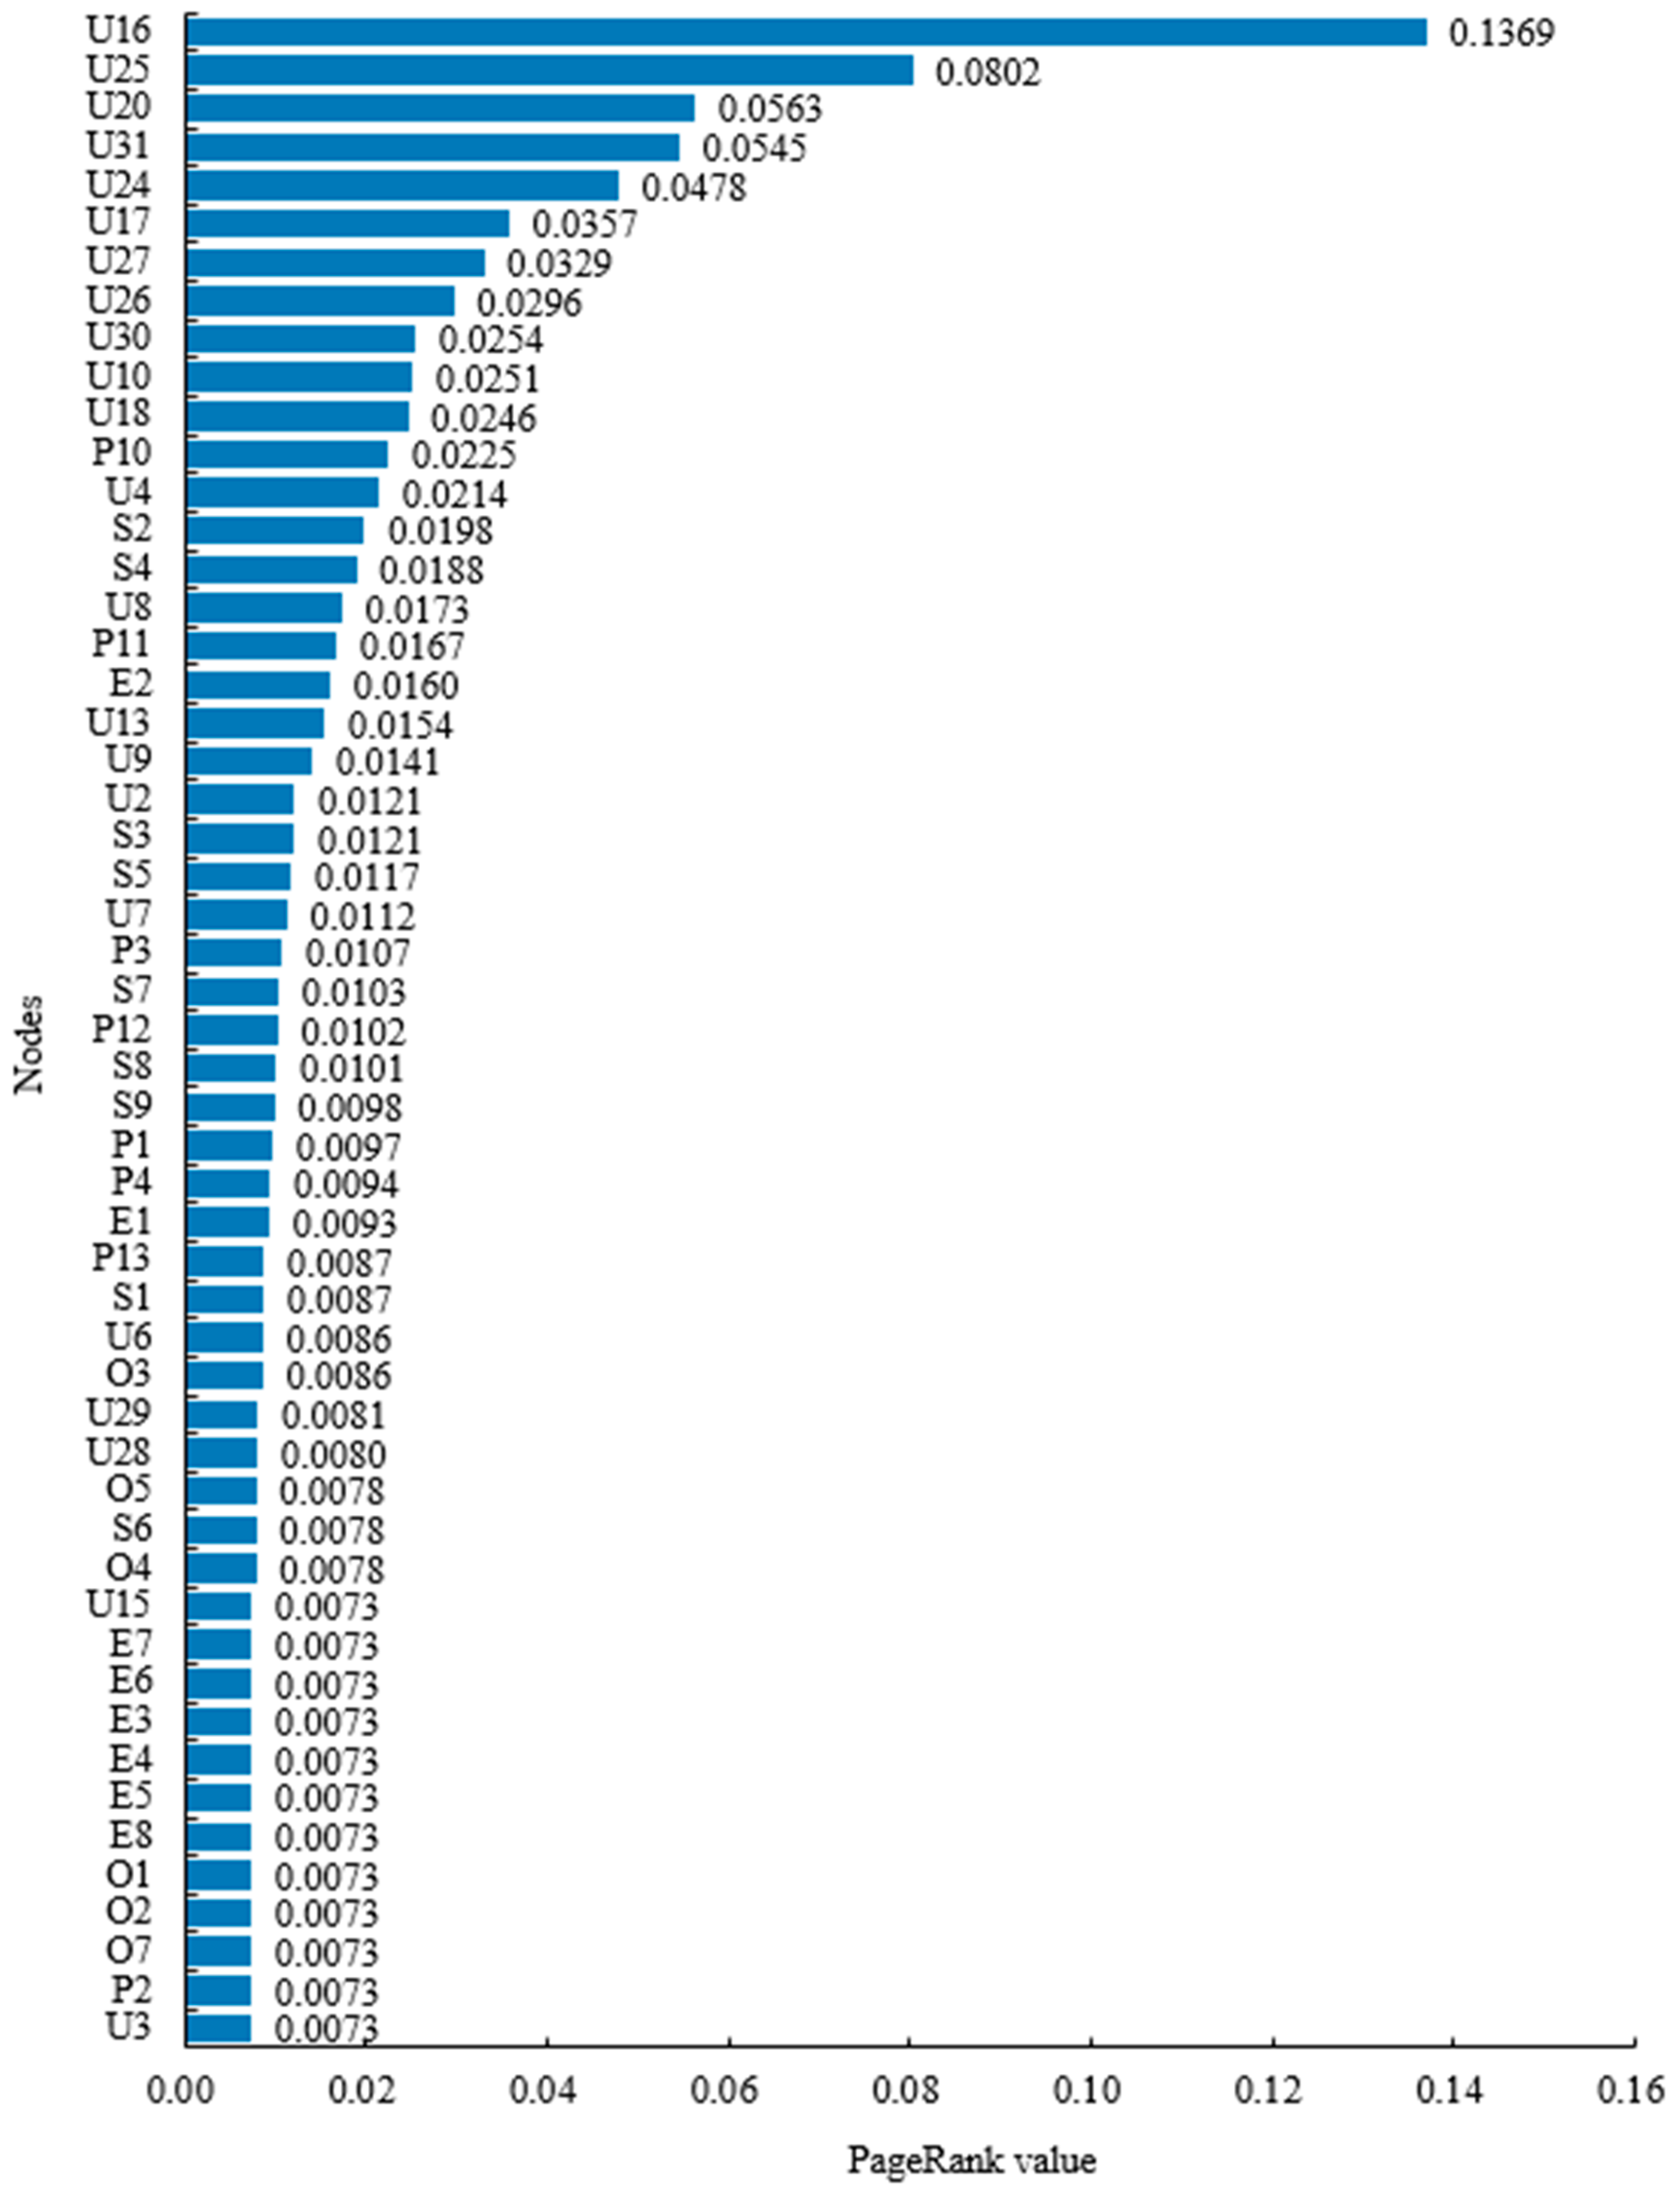
4.3. Node Criticality Analysis

The PageRank algorithm obtains the criticality of all the seafarers’ unsafe acts and their influencing factors in the developed interaction network, as shown in Figure 9. Table 3 lists the top 10 and bottom 10 important nodes in the network. Failure to make proper sound and light signals (U16) has the highest PageRank value, followed by failure to take effective collision avoidance action early (U25), and improper emergency response measures (U20). It can be seen that the top 10 nodes all belong to seafarers’ unsafe acts, which confirms that seafarers’ unsafe acts are the direct causes of maritime accidents, and effective control of seafarers’ unsafe acts with higher importance could interrupt the propagation of risks and thus reduce the occurrence of maritime accidents. On the other hand, most of the nodes in the bottom 10 are influencing factors, except for “Failure to keep navigational equipment in working state (U3)”, which belongs to seafarers’ unsafe acts. In addition, five of the remaining nine influencing factors are external environmental factors, which indicate that risk management of such external objective influencing factors may have little effect.

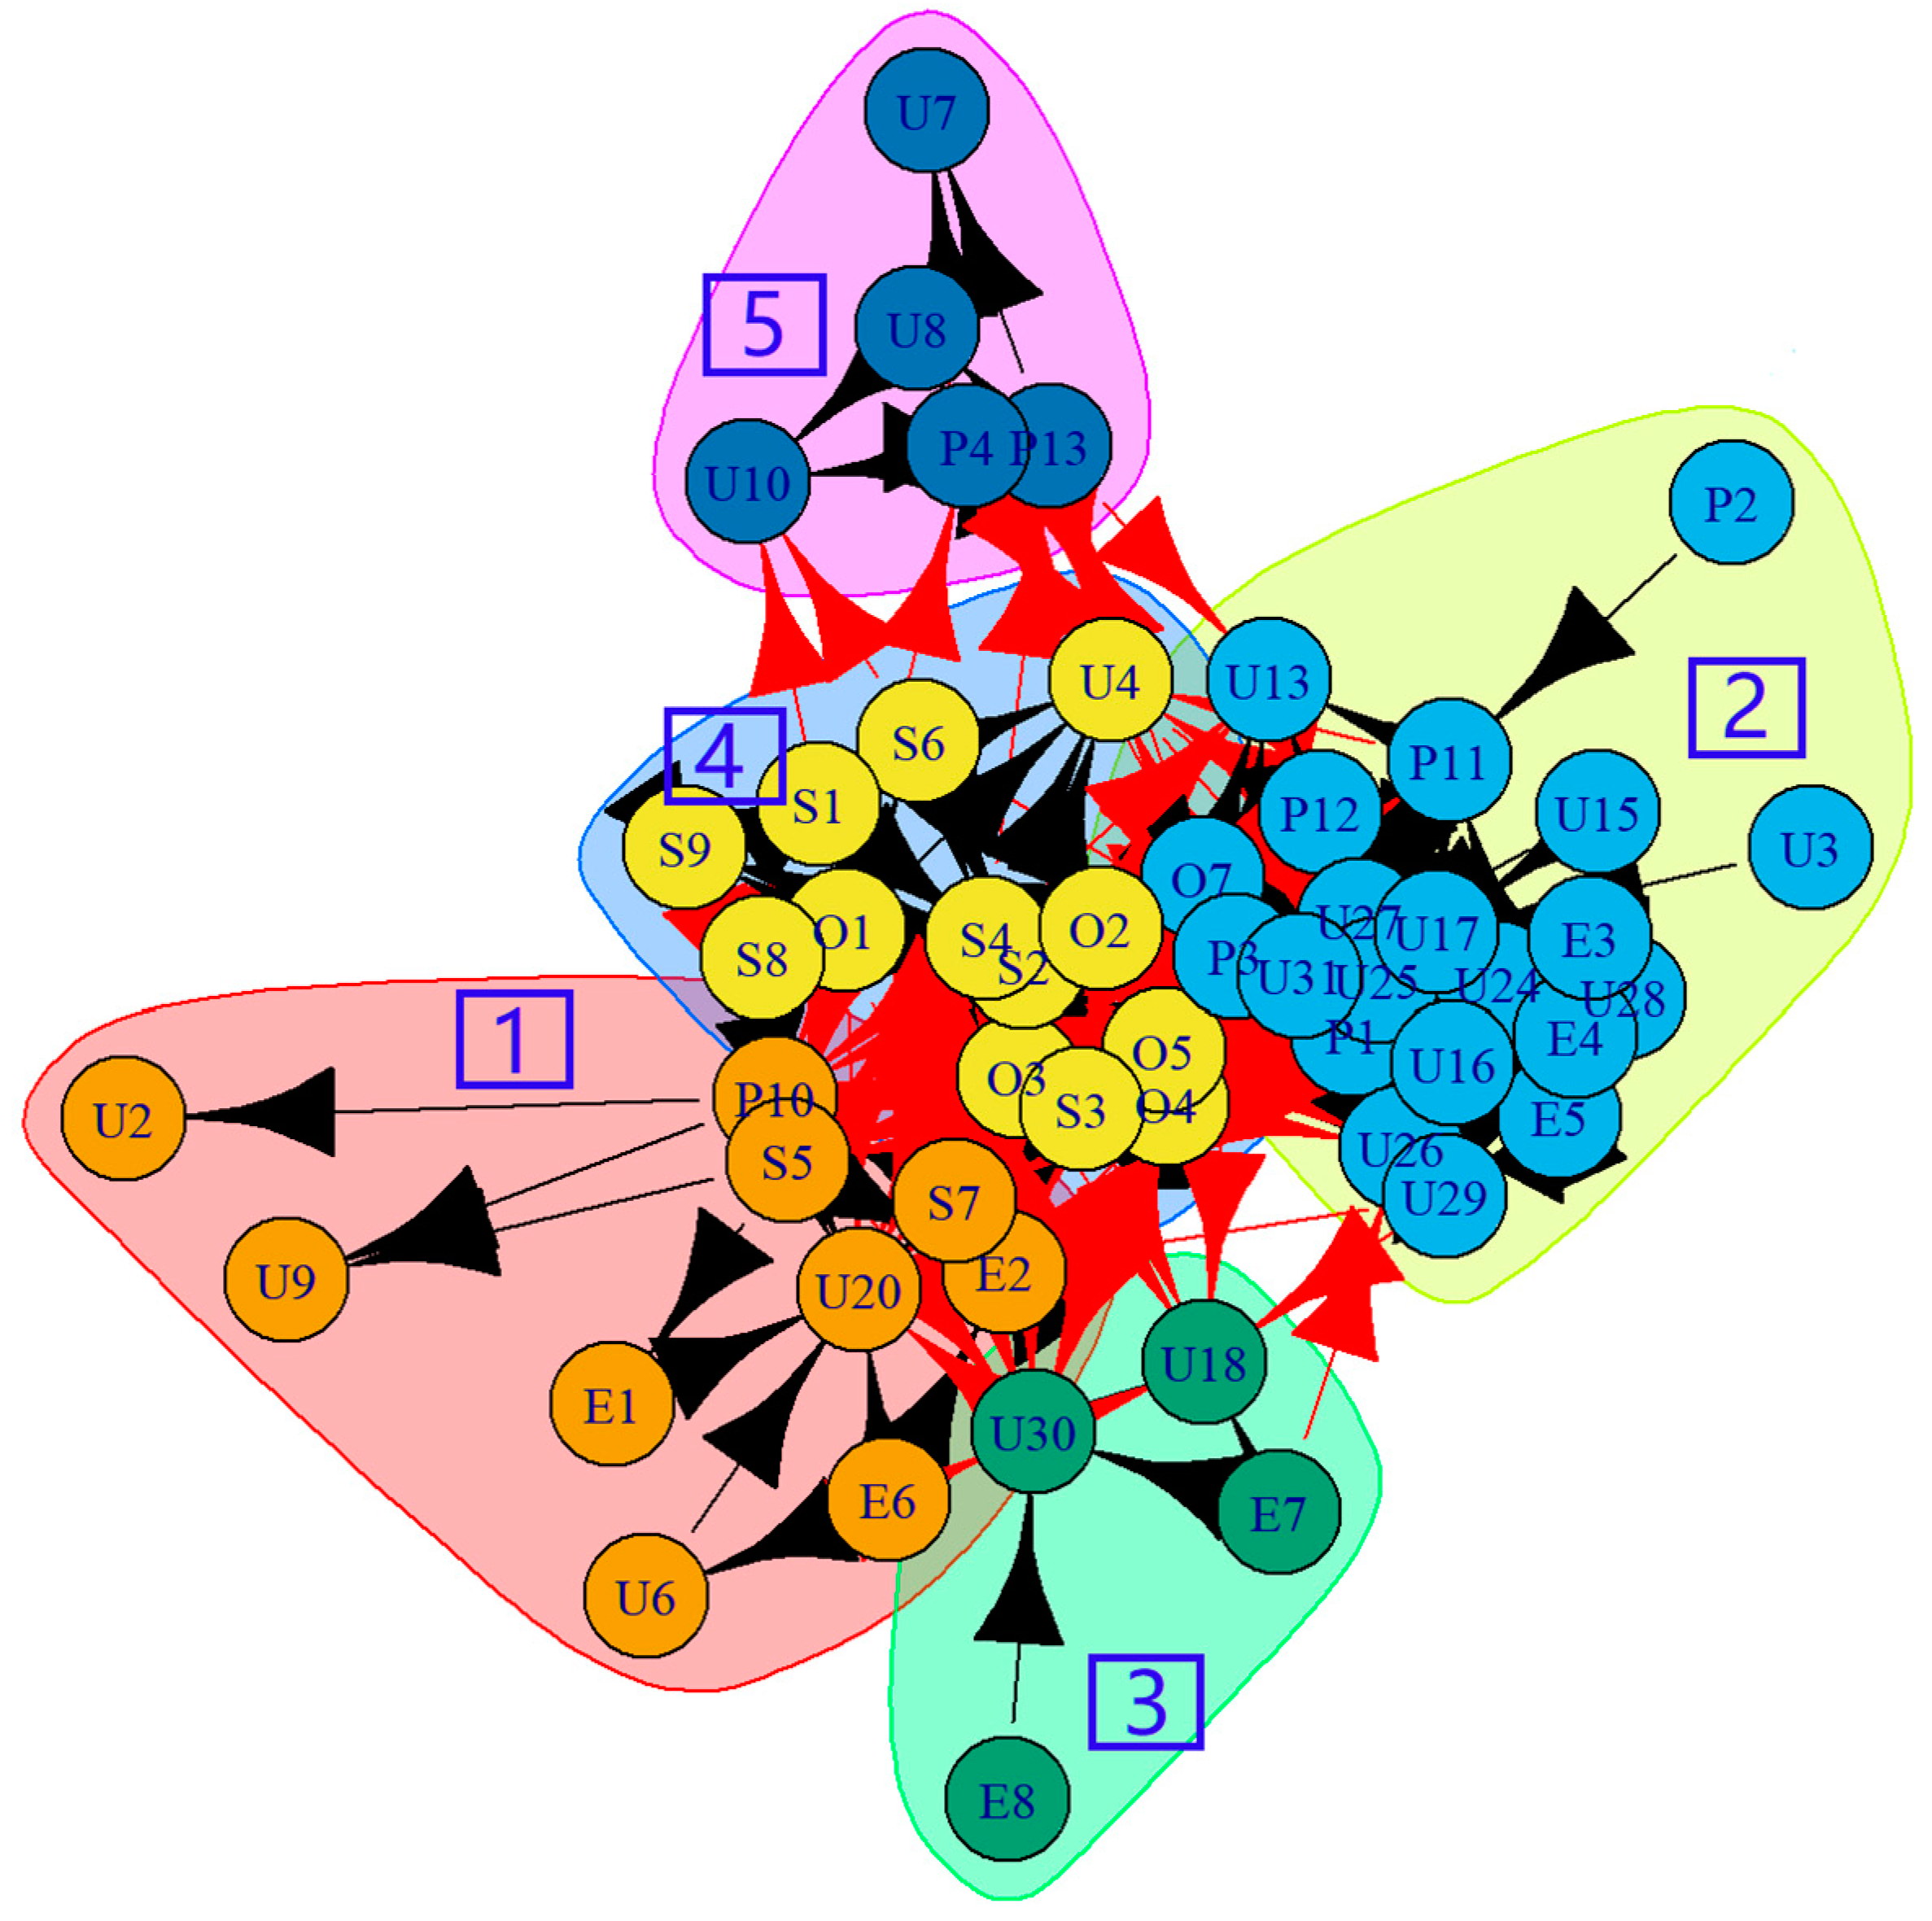
4.4. Community Detection

In the present study, a community detection method based on random walk strategy is utilized to extract communities from the developed interaction network of seafarers’ unsafe acts and their influencing factors, and to comprehensively explore the risk propagation patterns from a multidimensional perspective. In order to obtain a higher modularity value, after several trails, the modularity value (0.3631) is maximum and greater than 0.3 when the step length t of random walk is set to 4, which indicates that the community detection has obtained a good community structure. As shown in Figure 10, the interaction network of seafarers’ unsafe acts and their influencing factors is divided into five communities, and it should be noted that there are adjacent nodes between communities, which means that there is still the possibility of risk propagation between different communities, but their risk interactions are sparser compared with those within communities. To further explore the risk propagation patterns in the interaction network, this study conducts specific analysis for each of the five communities.
Community 1 includes 10 nodes of insufficient maintenance (S5), cargo defect (S7), lack of safety awareness (P10), device failure (E1), flooding (E2), strong wind and waves (E6), failure to use protective equipment (U2), failure to perform safety duties during berthing (U6), violation of operational procedures (U9), and improper emergency response measures (U20). The community involves four typical risk propagation paths of seafarers’ unsafe acts, as shown in Figure 11. The colored arrows refer to typical risk propagation paths. (1) Due to improper daily inspection and maintenance of the ship, sudden failure of device (rudder, main engine, etc.) during navigation operations, as well as poor safety awareness of the seafarers, etc., resulting in untimely and inappropriate emergency response measures, which eventually lead to ship accidents; (2) Under the effect of strong wind and waves, as well as ship’s being empty, fully loaded, overloaded and improperly cargo loaded. The ship deck is on the waves, and water enters inside the cabin, due to the seafarers’ poor safety awareness and other reasons. The seafarer goes to the main deck for side cabin operation without using safety ropes, wearing life jackets and other appropriate protective measures, and the emergency response measures are improper, which eventually have a greater possibility of leading to the personnel falling into the water and ship sinking accidents; (3) When the ship moored at berth, under the effect of strong wind and waves, the ship position is uncontrolled and may be dragging anchor, meanwhile, the seafarers do not fully perform the safety duties of berthing watch and make routine inspection of the ship, the seafarers fail to discover the current danger in time and do not take any emergency measures which may eventually lead to ship accidents; (4) Due to improper daily inspection and maintenance of the ship, as well as the weak safety awareness of the seafarers, the seafarers violate the operation procedures when carrying out fire operation, which tends to cause fire and explosion accidents.
Community 2 includes 21 nodes such as lack of standardization (O7), complex navigation environment (E3), busy traffic (E4), poor visibility (E5). The community involves the largest number of nodes, mainly including three risk propagation paths of seafarers’ unsafe acts, and has typical collision accident characteristics, as shown in Figure 12. The colored arrows refer to typical risk propagation paths. (1) When there are potential risks in the current environment, the relevant shore-based maritime authorities do not provide timely and accurate navigational guidance and poor ship-shore communication, resulting in the loss of seafarers’ situational awareness, meanwhile seafarers fail to make full use of navigational aids and maintain a proper lookout, thus failing to make a full evaluation of the current dangerous situation, thus causing the subsequent series of seafarers’ unsafe acts (U24, U25, U26, U27); (2) Due to the irregularity of the company’s operation rules and regulations, the seafarers do not keep the vigilance required by the special situation in the complex navigation environment or the busy traffic, and fail to establish effective cooperation and communication between ships and within the bridge team, which cause the seafarers to lose situational awareness of the current environment, distracts their attention, and failure to keep a regular lookout, thus, leading to the subsequent series of seafarers’ unsafe acts (U31, U24, U25, U26, U27); (3) The seafarers do not keep the AIS and other navigational aids in working condition, and do not follow the safety rules in restricted visibility, as well as the seafarers lose their situational awareness and do not maintain a proper lookout, so that they fail to make a full evaluation of the current dangerous situation, which leads to a subsequent series of seafarers’ unsafe acts (U16, U24, U25, U26).
Community 3 includes 4 nodes of tidal current effects (E7), external management (E8), failure to control the ship position (U18), and failure to determine the impact of environment on ship maneuvering (U30). The community involves two risk propagation paths of seafarers’ unsafe acts, and has typical contact accident characteristics, as shown in Figure 13. The colored arrows refer to typical risk propagation paths. (1) The current water is in high tide/low tide situation, the seafarers fail to fully evaluate the effect of current environment on ship maneuvering, and fail to control the ship’s position during the process of leaving berth, resulting in ship contact accidents; (2) Due to the defects in the management of external organizations such as wharf companies, the seafarers fail to fully evaluate the effect of the current environment on ship maneuvering and fail to control the ship’s position under the effect of tidal currents, resulting in ship contact accidents.
Community 4 includes 13 nodes such as insufficient device (O1), lack of operation certificate (O2), insufficient education and training (O3), and insufficient manning (O4). The community involves three risk propagation paths of seafarers’ unsafe acts, as shown in Figure 14. The colored arrows refer to typical risk propagation paths. (1) Insufficient device preparation of the ship, such as the lack of paper charts and charts not updated in time, leads to the omission of the seafarers in designing the route plan, which makes the route plan with potential danger, meanwhile, due to the insufficient safety education and training received by the seafarers, the lack of implementation of the safety management system on board ship and the lack of supervision and guidance, the captain does not strictly review the route plan, which tends to cause the seafarers’ unsafe acts, resulting in ship grounding accidents; (2) The ship is a inland ship, the seafarers on board have not been trained for sea navigation, the safety management system of the ship company has not been implemented on board. There is a lack of supervision and guidance, and the supervisors ignore the relevant regulations, which makes the inland ship navigate beyond the approved navigation area. In addition, the insufficient competence and manning of the seafarers, results in insufficient manning on the bridge, which eventually leads to ship accidents; (3) When the supervisors know the defects of the devices on board, due to the insufficient safety education and training received, as well as the failure to implement the safety management system of the shipping company on board, supervisors may ignore the possible risks of the current situation and fail to deal with the problem in time, which lay the groundwork for the emergence of seafarers’ unsafe acts.
Community 5 includes 5 nodes of fatigue (P13), insufficient utilization of bridge resources (P4), failure to check the course and position (OOW) (U10), drinking/alcoholism (U7), and OOW falls asleep on duty (U8). The community has typical ground accident characteristics, as shown in Figure 15. Seafarers are in a fatigued state and there may be alcoholism or drinking within 4 h before the watch (operation), and the alarm system such as BNWAS (Bridge Navigational Watch & Alarm System) is not fully utilized during the watch on the bridge, resulting in the OOW falling asleep on the bridge, thus, not checking the course and position as required, which eventually lead to the ship grounding accidents.

4.5. Results Discussion

The present study introduces association rule technique into complex network and develops a directed weighted network of seafarers’ unsafe acts and their influencing factors with 53 nodes and 260 edges, which has a high clustering coefficient (0.6203) and a short average path length (1.8048). The results show that the interaction network developed belongs to a typical small-world network, indicating that the network has great connectivity, and the connection between nodes has randomness and uncertainty, which leads to the fast and wide risk propagation of seafarers’ unsafe acts involved in maritime accidents. Meanwhile, certain seafarers’ unsafe acts and their influencing factors play an important role in the development of maritime accidents, and should be given focused control. The small-world nature of the network increases the difficulty of maritime safety risk management, and it is necessary to identify the nodes in the network that have high risk propagation ability and clarify the risk propagation path of typical seafarers’ unsafe acts.
Then, the weighted PageRank algorithm is used to clarify the criticality of seafarers’ unsafe acts and influencing factors in the network, and the results show that failure to make proper sound and light signals (U16) achieves the highest PageRank value, followed by failure to take effective collision avoidance action early (U25), and improper emergency response measures (U20). In addition, the top 10 nodes all belong to seafarers’ unsafe acts, indicating that effective control of unsafe acts with higher criticality would interrupt the propagation of risks and thereby reduce the occurrence of maritime accidents. Finally, based on the community detection method of random walk, 5 communities in the interaction network are identified and 13 typical risk propagation paths of seafarers’ unsafe acts are clarified. The results facilitate maritime stakeholders to understand the evolution mechanism of seafarers’ unsafe acts from a “complex system” perspective, and to develop safety management strategies for high-risk nodes, so as to improve maritime transportation safety.
The results of this study are consistent with previous studies. For example, all of the top 10 critical events in grounding accidents belong to contributing events, i.e., events that directly lead to the occurrence of ship grounding [30]. Similarly, the top 10 critical nodes in this study all belong to seafarers’ unsafe acts. However, Ma et al. [30] stated that “Deviated from the ships’ route” was the riskiest hazardous event. The reason for this difference may be the different types of maritime accident addressed. Additionally, Fan et al. [55] employed Bayesian network to model the interaction among maritime risk factors, and most probable explanation (MPE) was used to explore the most probable risky scenario. However, it is difficult to specify the risk propagation path, because its results may be changed by the introduction of irrelevant variables.

5. Conclusions

In the present study, inspired by the advantages and applications of directed complex network, association rules are integrated with complex network to develop the risk interaction network of seafarers’ unsafe acts. Based on complex network theory, the developed network is quantitatively analyzed, and the risk evolution characteristics and laws of seafarers’ unsafe acts are clarified. The main contributions of the present study are as follows:
(1)
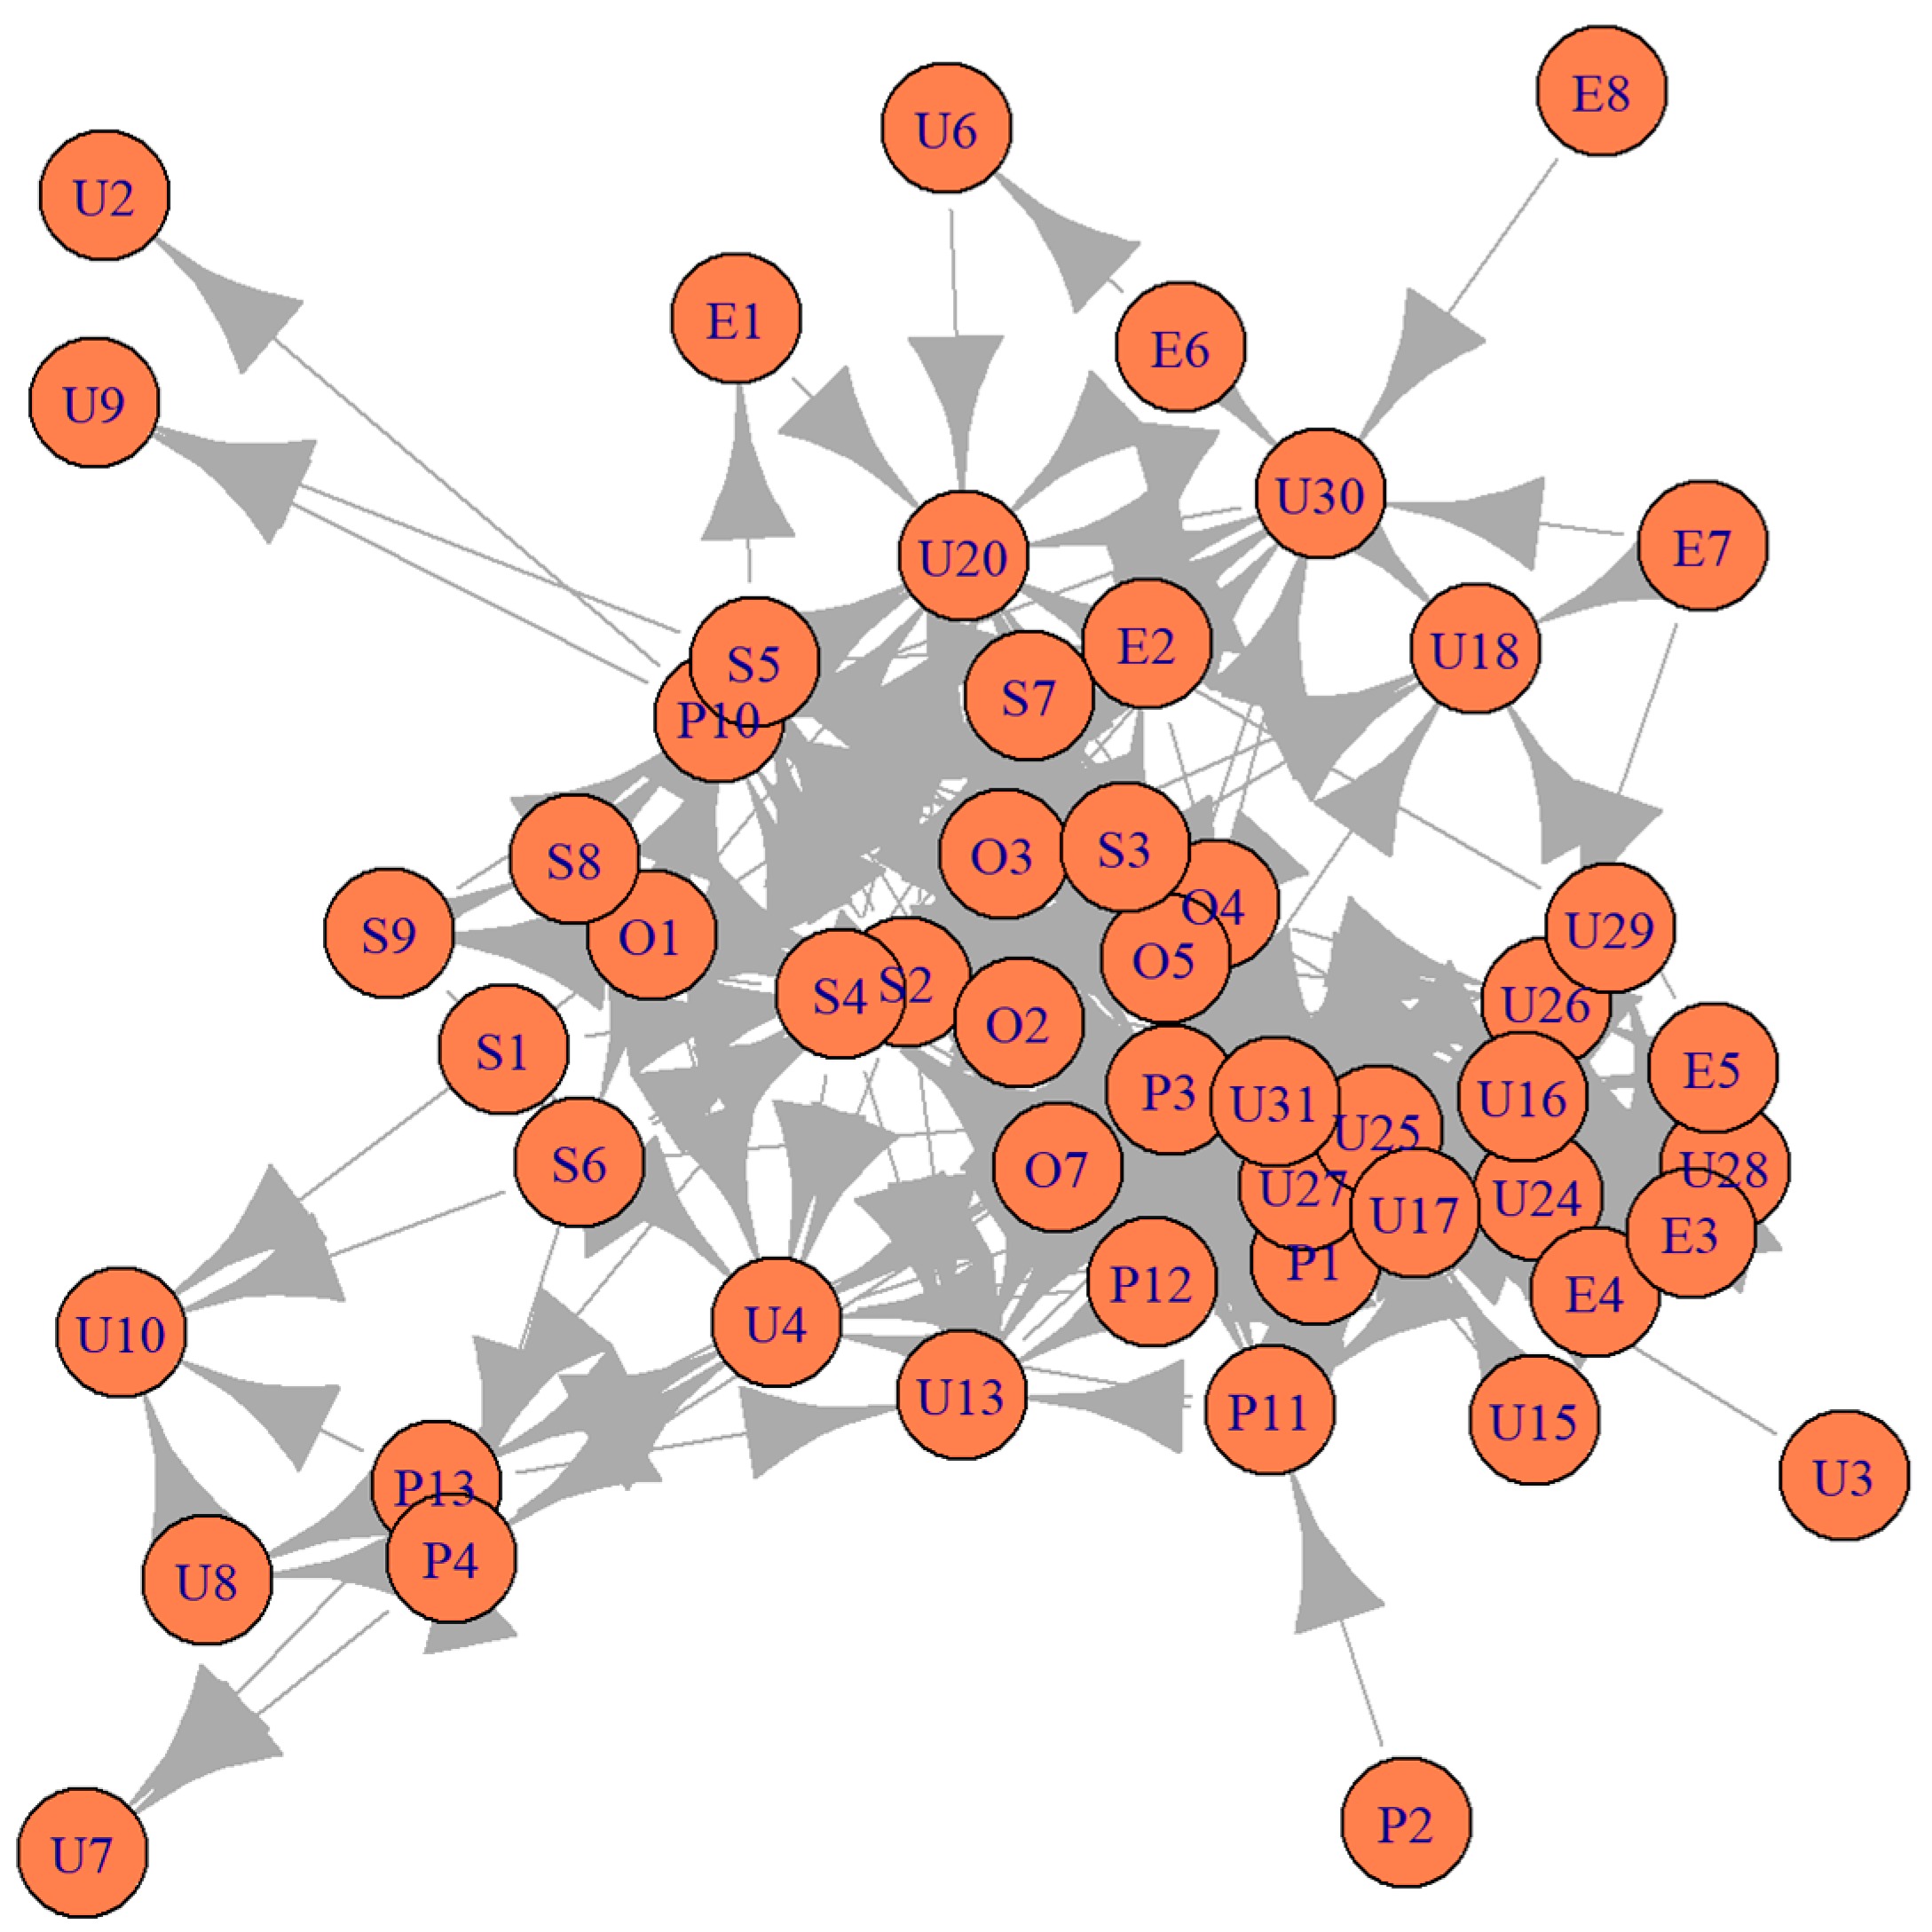
The present study introduces association rule into complex network and develops a directed weighted network of seafarers’ unsafe acts and their influencing factors with 53 nodes and 260 edges, which avoids the defect that the edge weights are over-reliant on expert experience in the development of traditional complex networks, providing a new way to investigate the risk interaction of seafarers’ unsafe acts involved in maritime accidents.
(2)
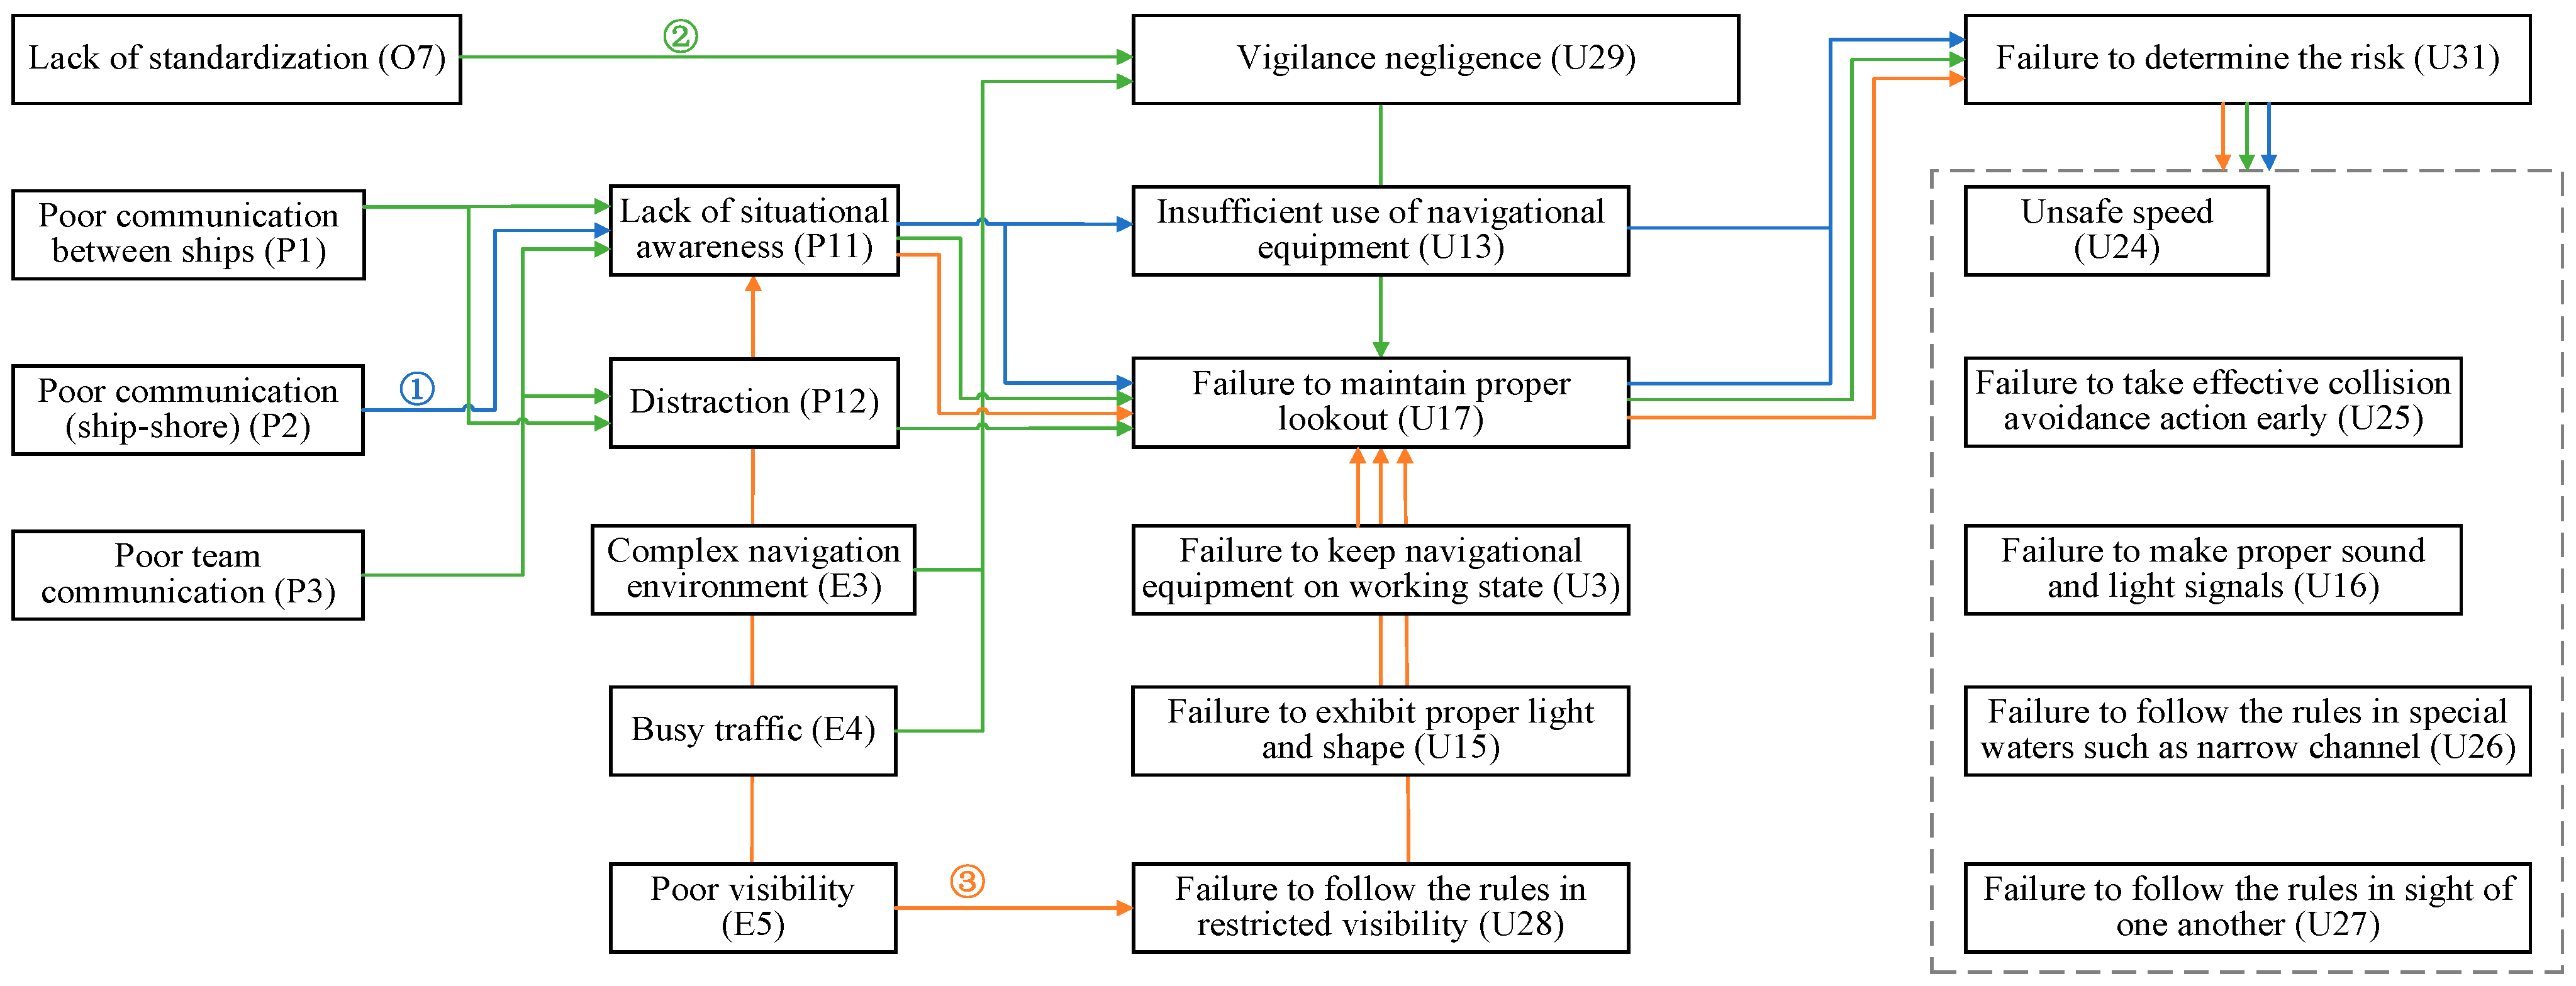
The risk propagation characteristics and paths of seafarers’ unsafe acts are identified and demonstrated, which could provide control priorities for interrupting the risk propagation of seafarers’ unsafe acts so as to improve maritime transportation safety.
Some limitations of the present study should be noted. Epistemic uncertainty in the initial data may affect the reliability of the results [56]. Maritime accident databases often suffer from data errors and missing data. Therefore, the present study selected accident reports issued by official maritime investigation authorities as research data, which have a certain degree of reliability. It is important to continue collecting and collating maritime accident reports, and mining new datasets may produce new research findings. Then, with the rapid development of emerging technologies such as big data and Internet of Things, ship intelligence has become an inevitable trend in the development of the shipping industry, and new seafarers’ unsafe acts and their influencing factors may appear in maritime transportation activities. Therefore, it is necessary to update the dataset of seafarers’ unsafe acts and their influencing factors in future research. Additionally, the combination of GISIS database, AIS data etc., with maritime accident investigation reports should be considered to further enrich the research data sources, which may generate interesting findings.

Author Contributions

Methodology, H.L.; Software, H.L.; Formal analysis, H.L.; Resources, X.M.; Writing—original draft, H.L.; Supervision, X.M. All authors have read and agreed to the published version of the manuscript.

Funding

The authors gratefully acknowledge the financial support provided by the National Key Research and Development Program of China (grand No. 2019YFB1600602).

Institutional Review Board Statement

Not applicable.

Informed Consent Statement

Not applicable.

Data Availability Statement

The raw data supporting the conclusions of this article will be made available by the authors on request.

Conflicts of Interest

The authors declare no conflict of interest.

References

  1. Gan, L.; Ye, B.; Huang, Z.; Xu, Y.; Chen, Q.; Shu, Y. Knowledge graph construction based on ship collision accident reports to improve maritime traffic safety. Ocean Coast. Manag. 2023, 240, 106660. [Google Scholar] [CrossRef]
  2. Yang, J.; Ye, G.; Xiang, Q.; Kim, M.; Liu, Q.; Yue, H. Insights into the mechanism of construction workers’ unsafe behaviors from an individual perspective. Saf. Sci. 2021, 133, 105004. [Google Scholar] [CrossRef]
  3. Qiao, W.; Liu, Y.; Ma, X.; Liu, Y. Human factors analysis for maritime accidents based on a dynamic fuzzy bayesian network. Risk Anal. 2020, 40, 957–980. [Google Scholar] [CrossRef] [PubMed]
  4. Wróbel, K. Searching for the origins of the myth: 80% human error impact on maritime safety. Reliab. Eng. Syst. Saf. 2021, 216, 107942. [Google Scholar] [CrossRef]
  5. IMO. Casualty-Related Matters Reports on Marine Casualties and Incidents; MSC-MEPC.3/Circ.4/Rev.1. Available online: https://www.imo.org/en/OurWork/MSAS/Pages/Casualties.aspx (accessed on 8 March 2024).
  6. Zhou, X.; Ruan, X.; Wang, H.; Zhou, G. Exploring spatial patterns and environmental risk factors for global maritime accidents: A 20-year analysis. Ocean Eng. 2023, 286, 115628. [Google Scholar] [CrossRef]
  7. Ma, L.; Ma, X.; Lan, H.; Liu, Y.; Deng, W. A data-driven method for modeling human factors in maritime accidents by integrating DEMATEL and FCM based on HFACS: A case of ship collisions. Ocean Eng. 2022, 266, 112699. [Google Scholar] [CrossRef]
  8. Fu, S.; Goerlandt, F.; Xi, Y. Arctic shipping risk management: A bibliometric analysis and a systematic review of risk influencing factors of navigational accidents. Saf. Sci. 2021, 139, 105254. [Google Scholar] [CrossRef]
  9. Wang, Z.; Yin, J. Risk assessment of inland waterborne transportation using data mining. Marit. Policy Manag. 2020, 47, 633–648. [Google Scholar] [CrossRef]
  10. Wang, T.; Shu, Y. Willingness of students majoring in the navigation to work as seafarers in China. Ocean Coast. Manag. 2021, 211, 105765. [Google Scholar] [CrossRef]
  11. Deng, J.; Liu, S.; Shu, Y.; Hu, Y.; Xie, C.; Zeng, X. Risk evolution and prevention and control strategies of maritime accidents in China’s coastal areas based on complex network models. Ocean Coast. Manag. 2023, 237, 106527. [Google Scholar] [CrossRef]
  12. Graziano, A.; Teixeira, A.P.; Guedes Soares, C. Classification of human errors in grounding and collision accidents using the TRACEr taxonomy. Saf. Sci. 2016, 86, 245–257. [Google Scholar] [CrossRef]
  13. Ung, S.-T. Human error assessment of oil tanker grounding. Saf. Sci. 2018, 104, 16–28. [Google Scholar] [CrossRef]
  14. Ugurlu, H.; Cicek, I. Analysis and assessment of ship collision accidents using Fault Tree and Multiple Correspondence Analysis. Ocean Eng. 2022, 245, 110514. [Google Scholar] [CrossRef]
  15. Li, H.; Ren, X.; Yang, Z. Data-driven Bayesian network for risk analysis of global maritime accidents. Reliab. Eng. Syst. Saf. 2023, 230, 108938. [Google Scholar] [CrossRef]
  16. Cem Kuzu, A.; Akyuz, E.; Arslan, O. Application of Fuzzy Fault Tree Analysis (FFTA) to maritime industry: A risk analysing of ship mooring operation. Ocean Eng. 2019, 179, 128–134. [Google Scholar] [CrossRef]
  17. Ugurlu, O.; Yildiz, S.; Loughney, S.; Wang, J.; Kuntchulia, S.; Sharabidze, I. Analyzing Collision, Grounding, and Sinking Accidents Occurring in the Black Sea Utilizing HFACS and Bayesian Networks. Risk Anal. 2020, 40, 2610–2638. [Google Scholar] [CrossRef]
  18. Zhang, G.; Thai, V.V.; Law, A.W.; Yuen, K.F.; Loh, H.S.; Zhou, Q. Quantitative Risk Assessment of Seafarers’ Nonfatal Injuries Due to Occupational Accidents Based on Bayesian Network Modeling. Risk Anal. 2020, 40, 8–23. [Google Scholar] [CrossRef]
  19. Trucco, P.; Cagno, E.; Ruggeri, F.; Grande, O. A bayesian belief network modelling of organisational factors in risk analysis: A case study in maritime transportation. Reliab. Eng. Syst. Saf. 2008, 93, 845–856. [Google Scholar] [CrossRef]
  20. Deacon, T.; Amyotte, P.R.; Khan, F.I.; MacKinnon, S. A framework for human error analysis of offshore evacuations. Saf. Sci. 2013, 51, 319–327. [Google Scholar] [CrossRef]
  21. Liu, Z.; Ma, Q.; Cai, B.; Shi, X.; Zheng, C.; Liu, Y. Risk coupling analysis of subsea blowout accidents based on dynamic Bayesian network and NK model. Reliab. Eng. Syst. Saf. 2022, 218, 108160. [Google Scholar] [CrossRef]
  22. Huang, W.; Kou, X.; Zhang, Y.; Mi, R.; Yin, D.; Xiao, W.; Liu, Z. Operational failure analysis of high-speed electric multiple units: A Bayesian network-K2 algorithm-expectation maximization approach. Reliab. Eng. Syst. Saf. 2021, 205, 107250. [Google Scholar] [CrossRef]
  23. Lam, C.Y.; Tai, K. Network topological approach to modeling accident causations and characteristics: Analysis of railway incidents in Japan. Reliab. Eng. Syst. Saf. 2020, 193, 106626. [Google Scholar] [CrossRef]
  24. Liu, J.; Xu, Y.; Wang, L. Fault information mining with causal network for railway transportation system. Reliab. Eng. Syst. Saf. 2022, 220, 108281. [Google Scholar] [CrossRef]
  25. Qiu, Z.; Liu, Q.; Li, X.; Zhang, J.; Zhang, Y. Construction and analysis of a coal mine accident causation network based on text mining. Process Saf. Environ. Prot. 2021, 153, 320–328. [Google Scholar] [CrossRef]
  26. Wang, W.; Wang, Y.; Wang, G.; Li, M.; Jia, L. Identification of the critical accident causative factors in the urban rail transit system by complex network theory. Phys. A Stat. Mech. Its Appl. 2023, 610, 128404. [Google Scholar] [CrossRef]
  27. Duan, P.; Zhou, J.; Goh, Y.M. Spatial-temporal analysis of safety risks in trajectories of construction workers based on complex network theory. Adv. Eng. Inform. 2023, 56, 101990. [Google Scholar] [CrossRef]
  28. Ma, X.; Deng, W.; Qiao, W.; Luo, H. A novel methodology concentrating on risk propagation to conduct a risk analysis based on a directed complex network. Risk Anal. 2022, 42, 2800–2822. [Google Scholar] [CrossRef]
  29. Lan, H.; Ma, X.; Qiao, W.; Deng, W. Determining the critical risk factors for predicting the severity of ship collision accidents using a data-driven approach. Reliab. Eng. Syst. Saf. 2023, 230, 108934. [Google Scholar] [CrossRef]
  30. Ma, X.; Deng, W.; Qiao, W.; Lan, H. A methodology to quantify the risk propagation of hazardous events for ship grounding accidents based on directed CN. Reliab. Eng. Syst. Saf. 2022, 221, 108334. [Google Scholar] [CrossRef]
  31. Fu, L.; Wang, X.; Zhao, H.; Li, M. Interactions among safety risks in metro deep foundation pit projects: An association rule mining-based modeling framework. Reliab. Eng. Syst. Saf. 2022, 221, 108381. [Google Scholar] [CrossRef]
  32. Hong, J.; Tamakloe, R.; Park, D. Application of association rules mining algorithm for hazardous materials transportation crashes on expressway. Accid. Anal. Prev. 2020, 142, 105497. [Google Scholar] [CrossRef] [PubMed]
  33. Zhou, Y.; Li, C.; Ding, L.; Sekula, P.; Love, P.E.D.; Zhou, C. Combining association rules mining with complex networks to monitor coupled risks. Reliab. Eng. Syst. Saf. 2019, 186, 194–208. [Google Scholar] [CrossRef]
  34. Xu, R.; Luo, F. Risk prediction and early warning for air traffic controllers’ unsafe acts using association rule mining and random forest. Saf. Sci. 2021, 135, 105125. [Google Scholar] [CrossRef]
  35. Xu, C.; Bao, J.; Wang, C.; Liu, P. Association rule analysis of factors contributing to extraordinarily severe traffic crashes in China. J. Saf. Res. 2018, 67, 65–75. [Google Scholar] [CrossRef]
  36. Ma, X.; Lan, H.; Qiao, W.; Han, B.; He, H. On the causation correlation of maritime accidents based on data mining techniques. Proc. Inst. Mech. Eng. Part O J. Risk Reliab. 2022, 1–15. [Google Scholar] [CrossRef]
  37. Lan, H.; Ma, X.; Qiao, W.; Ma, L. On the causation of seafarers’ unsafe acts using grounded theory and association rule. Reliab. Eng. Syst. Saf. 2022, 223, 108498. [Google Scholar] [CrossRef]
  38. Lan, H.; Ma, X.; Ma, L.; Qiao, W. Pattern investigation of total loss maritime accidents based on association rule mining. Reliab. Eng. Syst. Saf. 2023, 229, 108893. [Google Scholar] [CrossRef]
  39. Chen, D.; Pei, Y.; Xia, Q. Research on human factors cause chain of ship accidents based on multidimensional association rules. Ocean Eng. 2020, 218, 107717. [Google Scholar] [CrossRef]
  40. Jia, X.; Zhang, D. Prediction of maritime logistics service risks applying soft set based association rule: An early warning model—ScienceDirect. Reliab. Eng. Syst. Saf. 2020, 207, 107339. [Google Scholar] [CrossRef]
  41. Das, S.; Dutta, A.; Jalayer, M.; Bibeka, A.; Wu, L. Factors influencing the patterns of wrong-way driving crashes on freeway exit ramps and median crossovers: Exploration using ‘Eclat’ association rules to promote safety. Int. J. Transp. Sci. Technol. 2018, 7, 114–123. [Google Scholar] [CrossRef]
  42. Cheng, Y.; Yu, W.; Li, Q. GA-based multi-level association rule mining approach for defect analysis in the construction industry. Autom. Constr. 2015, 51, 78–91. [Google Scholar] [CrossRef]
  43. Qiao, W.; Liu, Q.; Li, X.; Luo, X.; Wan, Y. Using data mining techniques to analyze the influencing factor of unsafe behaviors in Chinese underground coal mines. Resour. Policy 2018, 59, 210–216. [Google Scholar] [CrossRef]
  44. Barrat, A.; Barthelemy, M.; Pastor-Satorras, R.; Vespignani, A. The architecture of complex weighted networks. Proc. Natl. Acad. Sci. USA 2004, 101, 3747–3752. [Google Scholar] [CrossRef] [PubMed]
  45. Garas, A.; Schweitzer, F.; Havlin, S. A k-shell decomposition method for weighted networks. New J. Phys. 2012, 14, 083030. [Google Scholar] [CrossRef]
  46. Wang, Q.; Jia, G.; Jia, Y.; Song, W. A new approach for risk assessment of failure modes considering risk interaction and propagation effects. Reliab. Eng. Syst. Saf. 2021, 216, 108044. [Google Scholar] [CrossRef]
  47. Luo, S.; Wu, X.; Kao, B. Distributed PageRank computation with improved round complexities. Inf. Sci. 2022, 607, 109–125. [Google Scholar] [CrossRef]
  48. Wang, P.; Guo, Y.; Xu, Z.; Wang, W.; Chen, D. A novel approach of full state tendency measurement for complex systems based on information causality and PageRank: A case study of a hydropower generation system. Mech. Syst. Signal Process. 2023, 187, 109956. [Google Scholar] [CrossRef]
  49. Zhang, P.; Wang, T.; Yan, J. PageRank centrality and algorithms for weighted, directed networks. Phys. A Stat. Mech. Its Appl. 2022, 586, 126438. [Google Scholar] [CrossRef]
  50. Luo, M.; Xu, Y. Community detection via network node vector label propagation. Phys. A Stat. Mech. Its Appl. 2022, 593, 126931. [Google Scholar] [CrossRef]
  51. Sahu, S.; Rani, T.S. A neighbour-similarity based community discovery algorithm. Expert Syst. Appl. 2022, 206, 117822. [Google Scholar] [CrossRef]
  52. Pons, P.; Latapy, M. (Eds.) Computing Communities in Large Networks Using Random Walks; Springer: Berlin/Heidelberg, Germany, 2005; pp. 284–293. [Google Scholar]
  53. Yang, Z.; Algesheimer, R.; Tessone, C.J. A comparative analysis of community detection algorithms on artificial networks. Sci. Rep. 2016, 6, 30750. [Google Scholar] [CrossRef] [PubMed]
  54. Clauset, A.; Newman, M.E.J.; Moore, C. Finding community structure in very large networks. Phys. Rev. E 2004, 70, 066111. [Google Scholar] [CrossRef] [PubMed]
  55. Fan, S.; Blanco-Davis, E.; Yang, Z.; Zhang, J.; Yan, X. Incorporation of human factors into maritime accident analysis using a data-driven Bayesian network. Reliab. Eng. Syst. Saf. 2020, 203, 107070. [Google Scholar] [CrossRef]
  56. Zaitseva, E.; Levashenko, V.; Rabcan, J. A new method for analysis of Multi-State systems based on Multi-valued decision diagram under epistemic uncertainty. Reliab. Eng. Syst. Saf. 2023, 229, 108868. [Google Scholar] [CrossRef]
Figure 1. The process of risk interaction analysis based on the AR-CN method.
Applsci 14 02595 g001
Figure 2. The flowchart of Éclat algorithm.
Applsci 14 02595 g002
Figure 3. Mapping association rules to directed weighted network.
Applsci 14 02595 g003
Figure 4. Scatter plot of 260 association rules.
Applsci 14 02595 g004
Figure 5. Interaction network of seafarers’ unsafe acts and the influencing factors.
Applsci 14 02595 g005
Figure 6. Degree of the nodes.
Applsci 14 02595 g006
Figure 7. Clustering coefficient of the nodes.
Applsci 14 02595 g007
Figure 8. Betweenness centrality of the nodes.
Applsci 14 02595 g008
Figure 9. Ranking of the nodes’ PageRank value.
Applsci 14 02595 g009
Figure 10. Community detection results of the network.
Applsci 14 02595 g010
Figure 11. Schematic diagram of seafarers’ unsafe act risk interaction community 1.
Applsci 14 02595 g011
Figure 12. Schematic diagram of seafarers’ unsafe act risk interaction community 2.
Applsci 14 02595 g012
Figure 13. Schematic diagram of seafarers’ unsafe act risk interaction community 3.
Applsci 14 02595 g013
Figure 14. Schematic diagram of seafarers’ unsafe act risk interaction community 4.
Applsci 14 02595 g014
Figure 15. Schematic diagram of seafarers’ unsafe act risk interaction community 5.
Applsci 14 02595 g015
Table 1. Basic statistics of 476 maritime accident reports.
YearCollisionGroundingContactSinkingFire/Explosion
201158/11
201235/24
2013211/41
201484242
20154711645
20164115998
201739121043
201856161478
201928112313
202011/332
Total24093673937
Table 2. Descriptive statistics of the seafarers’ unsafe acts and their influencing factors.
CategoryVariableFrequencyCategoryVariableFrequency
Organizational influencesInsufficient device (O1)13.24%Seafarers’ unsafe actsInadequate handover (U1)1.68%
Lack of operation certificate (O2)2.73% Failure to use protective equipment (U2)2.94%
Insufficient education and training (O3)30.88% Failure to keep navigational equipment in working state (U3)2.31%
Insufficient manning (O4)15.97% Insufficient manning on bridge (U4)8.82%
Poor competence (O5)23.53% Failure to take safety measures in restricted visibility (U5)0.42%
Poor information transmission of the company (O6)1.05% Failure to perform safety duties during berthing (U6)3.36%
Lack of standardization (O7)12.39% Drinking/Alcoholism (U7)2.31%
Unsafe supervisionLack of route plan review (S1)1.89% OOW (officer on watch) falls asleep on duty (U8)4.20%
Lack of supervision and guidance (S2)29.41% Violation of operational procedures (U9)4.62%
Navigation beyond authorized areas (S3)6.09% Failure to check the course and position (OOW) (U10)5.04%
Inadequate safety management (S4)41.81% Failure to check the planned route in time (OOW) (U11)1.47%
Insufficient maintenance (S5)11.13% Steering error (duty sailor) (U12)0.42%
Inappropriate route plan (S6)4.20% Insufficient use of navigational equipment (U13)7.35%
Cargo defect (S7)5.25% Over-reliance on navigational equipment (U14)2.10%
Failure to correct mistakes (S8)2.73% Failure to exhibit proper light and shape (U15)2.10%
Ignore rules and regulations (S9)4.41% Failure to make proper sound and light signals (U16)9.24%
Precondition for unsafe actsPoor communication between ships (P1)13.03% Failure to maintain proper lookout (U17)48.32%
Poor communication (ship-shore) (P2)2.52% Failure to control the ship position (U18)13.03%
Poor team communication (P3)13.03% Improper selection of anchoring position (U19)1.68%
Insufficient utilization of bridge resources (P4)5.04% Improper emergency response measures (U20)16.81%
Inadequate preparation (P5)1.26% Ignore alarm signals or warnings (U21)0.42%
Poor physical condition (P6)0.42% Failure of seafarers to follow best practices (U22)1.26%
Poor emotional state (P7)1.26% Failure to execute the planned route (U23)1.89%
Stress (P8)0.21% Unsafe speed (U24)20.17%
Alcohol/Drugs (P9)1.05% Failure to take effective collision avoidance action early (U25)27.94%
Lack of safety awareness (P10)13.66% Failure to follow the rules in special waters such as narrow channel (U26)17.86%
Lack of situational awareness (P11)5.46% Failure to follow the rules in sight of one another (U27)21.22%
Distraction (P12)5.88% Failure to follow the rules in restricted visibility (U28)4.41%
Fatigue (P13)7.35% Vigilance negligence (U29)7.77%
Over-confidence (P14)0.84% Failure to determine the impact of environment on ship maneuvering (U30)11.13%
Environmental factorsDevice failure (E1)4.83% Failure to determine the risk (U31)31.09%
Flooding (E2)5.04%
Complex navigation environment (E3)22.48%
Busy traffic (E4)22.06%
Poor visibility (E5)16.81%
Strong wind and waves (E6)7.56%
Tidal current effects (E7)6.51%
External management (E8)3.57%
Table 3. Top 10 and bottom 10 nodes ranked in criticality.
The Top 10The Bottom 10
RankNodesPRRankNodesPR
1Failure to make proper sound and light signals (U16)0.136953Failure to keep navigational equipment on working state (U3)0.0073
2Failure to take effective collision avoidance action early (U25)0.080252Poor communication (ship-shore) (P2)0.0073
3Improper emergency response measures (U20)0.056351Lack of standardization (O7)0.0073
4Failure to determine the risk (U31)0.054550Lack of operation certificate (O2)0.0073
5Unsafe speed (U24)0.047849Insufficient device (O1)0.0073
6Failure to maintain proper lookout (U17)0.035748External management (E8)0.0073
7Failure to follow the rules in sight of one another (U27)0.032947Poor visibility (E5)0.0073
8Failure to follow the rules in special waters such as narrow channels (U26)0.029646Busy traffic (E4)0.0073
9Failure to determine the impact of environment on ship maneuvering (U30)0.025445Complex navigation environment (E3)0.0073
10Failure to check the course and position (OOW) (U10)0.025144Strong wind and waves (E6)0.0073
Disclaimer/Publisher’s Note: The statements, opinions and data contained in all publications are solely those of the individual author(s) and contributor(s) and not of MDPI and/or the editor(s). MDPI and/or the editor(s) disclaim responsibility for any injury to people or property resulting from any ideas, methods, instructions or products referred to in the content.

