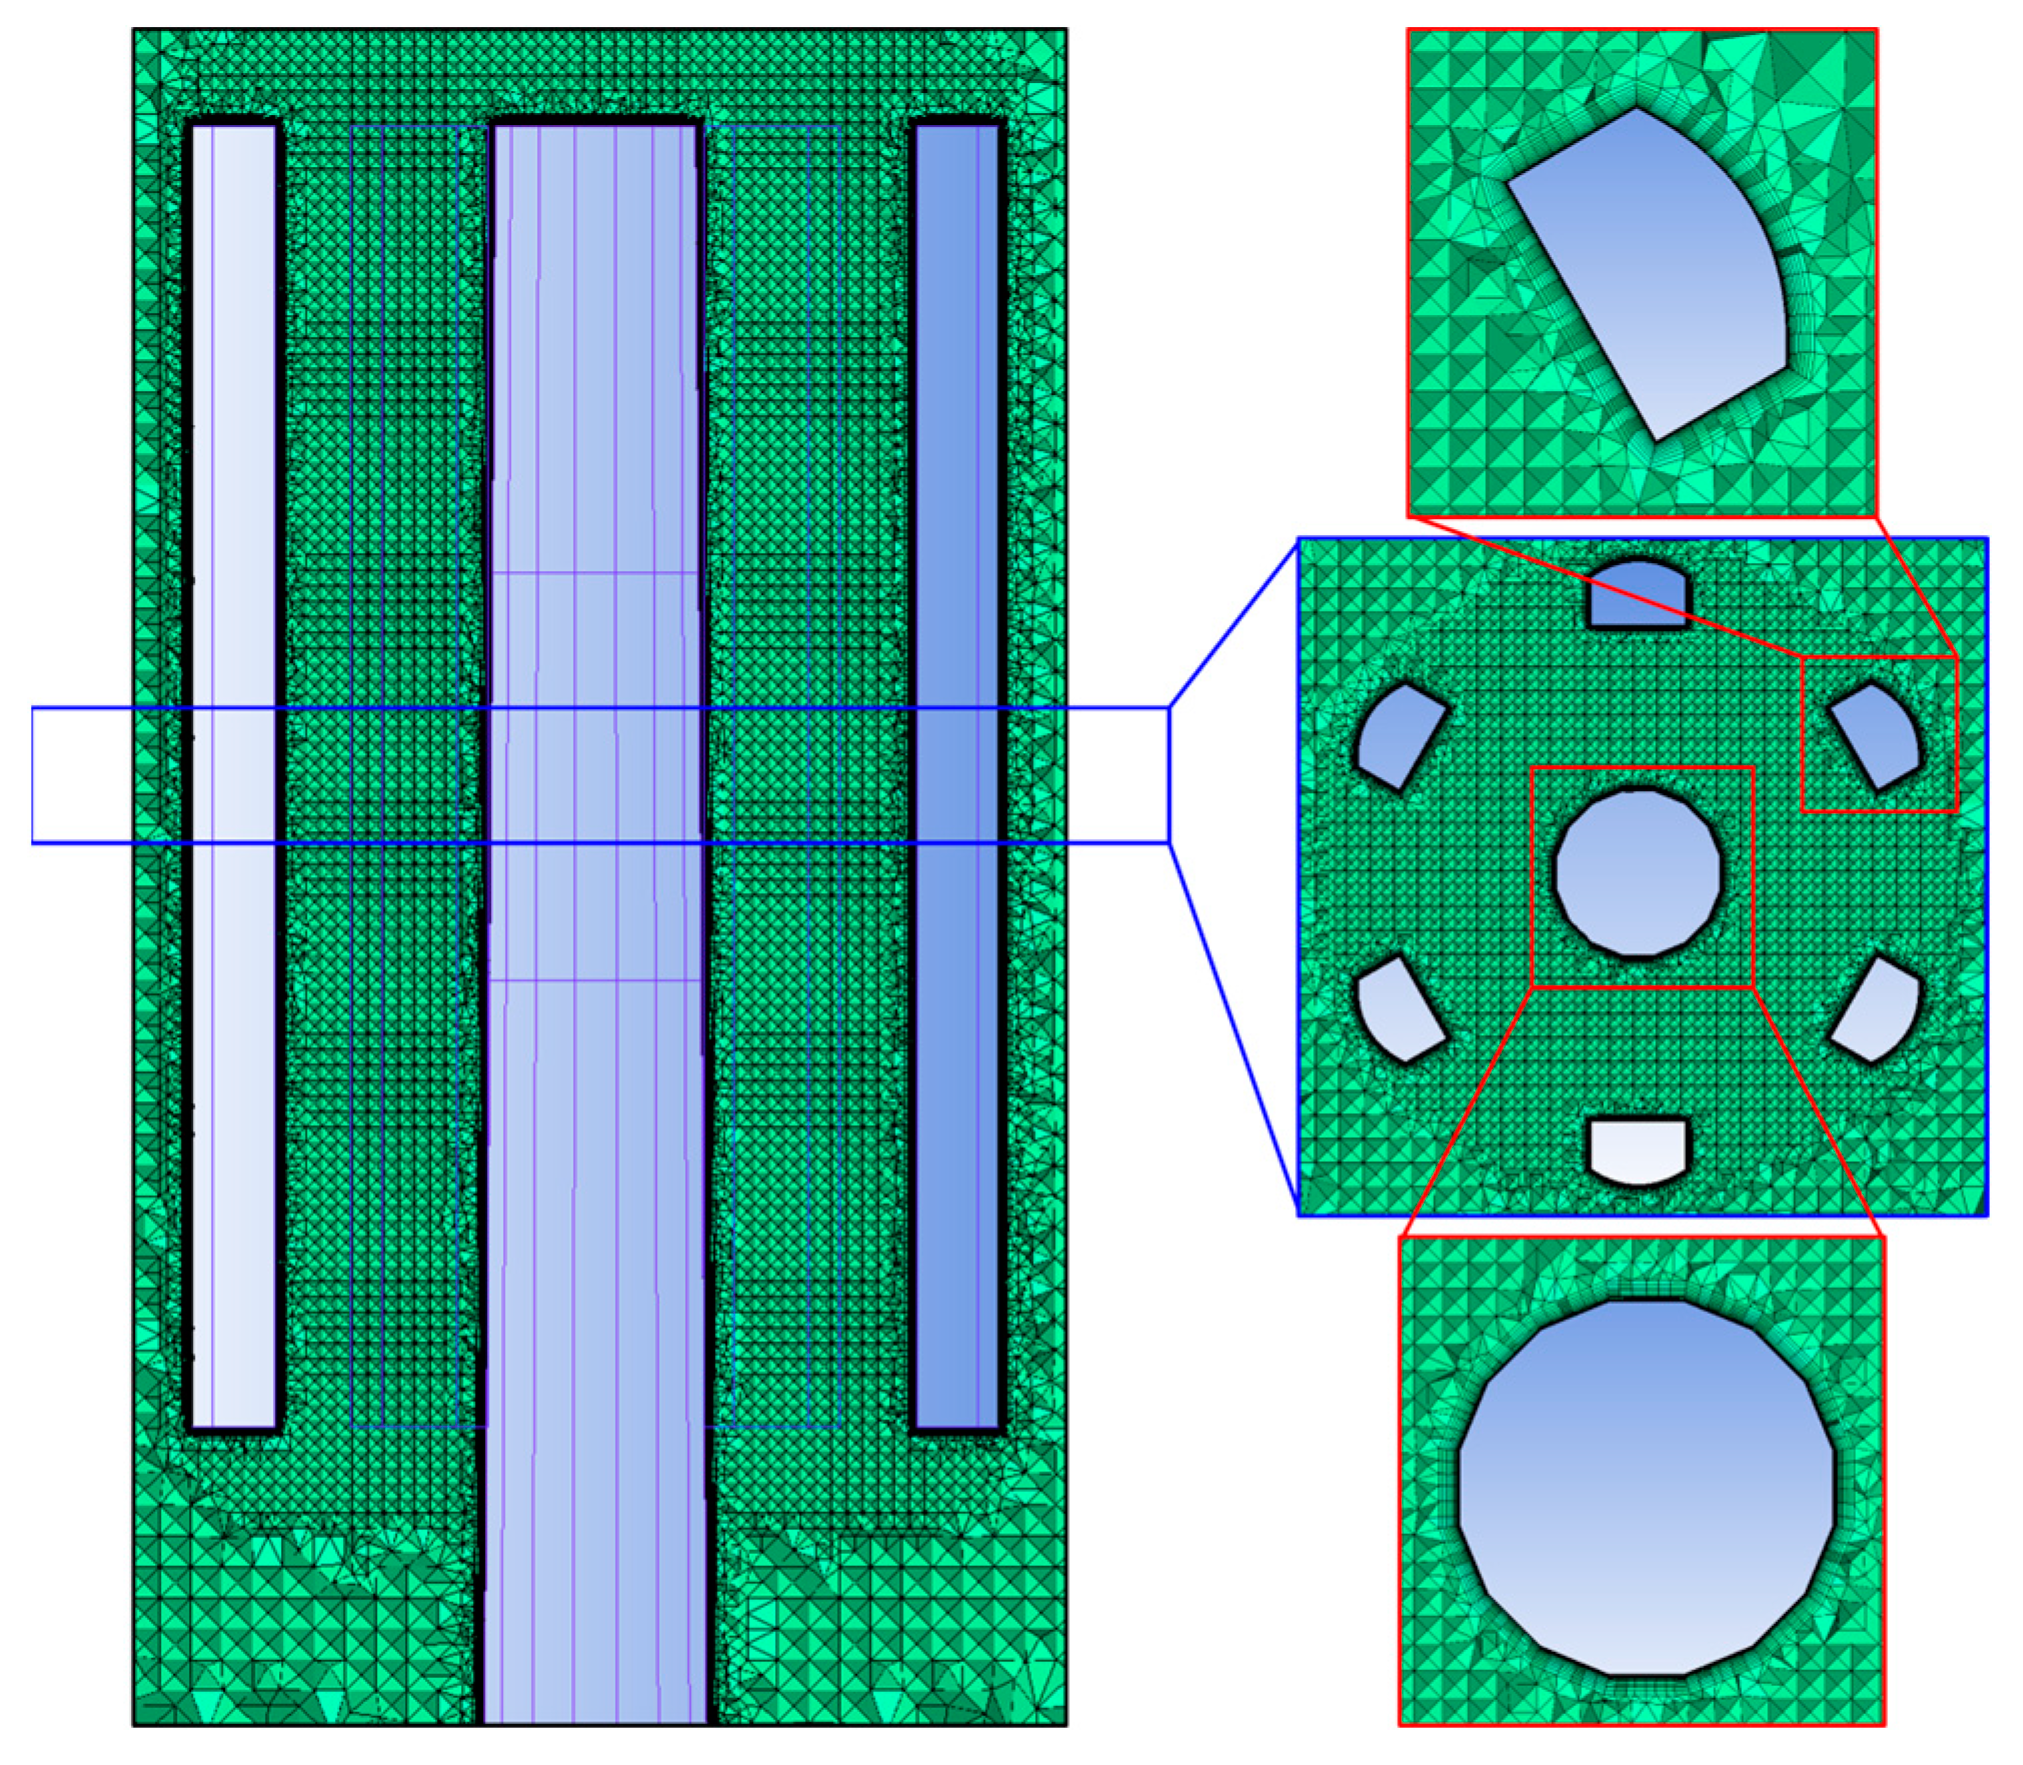
3.2. Impact of Antenna Arrangement Number and Arrangement Form on the Wind Load of Telecommunication Towers
When only one layer of telecommunication antennas is arranged on the tower, it is possible to have one to six antennas in this single layer. When arranging one, three, five, or six antennas, there is only one arrangement form. However, when arranging two or four antennas, there are multiple arrangement forms.
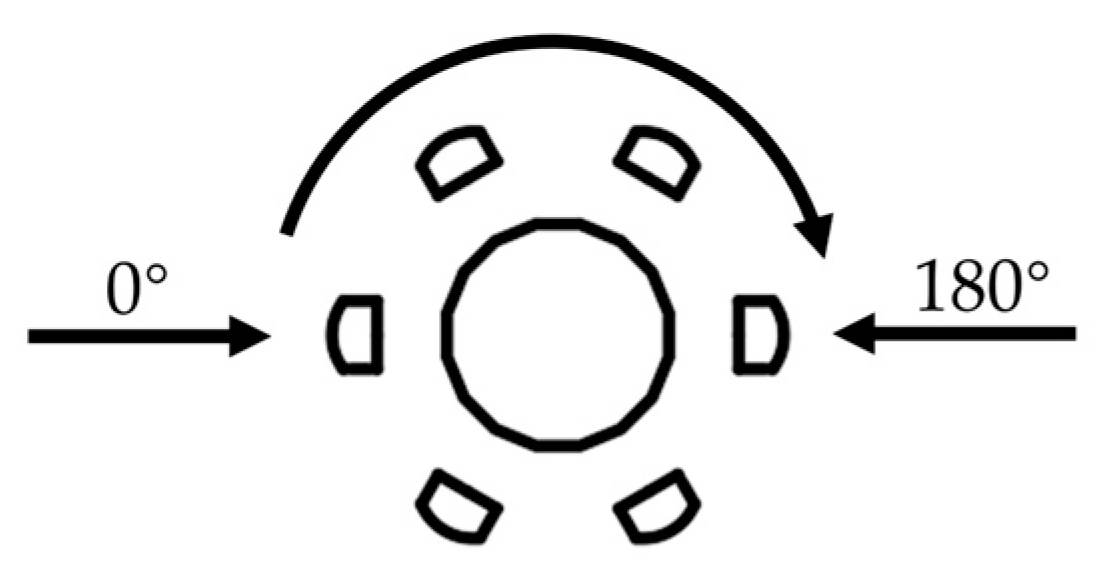
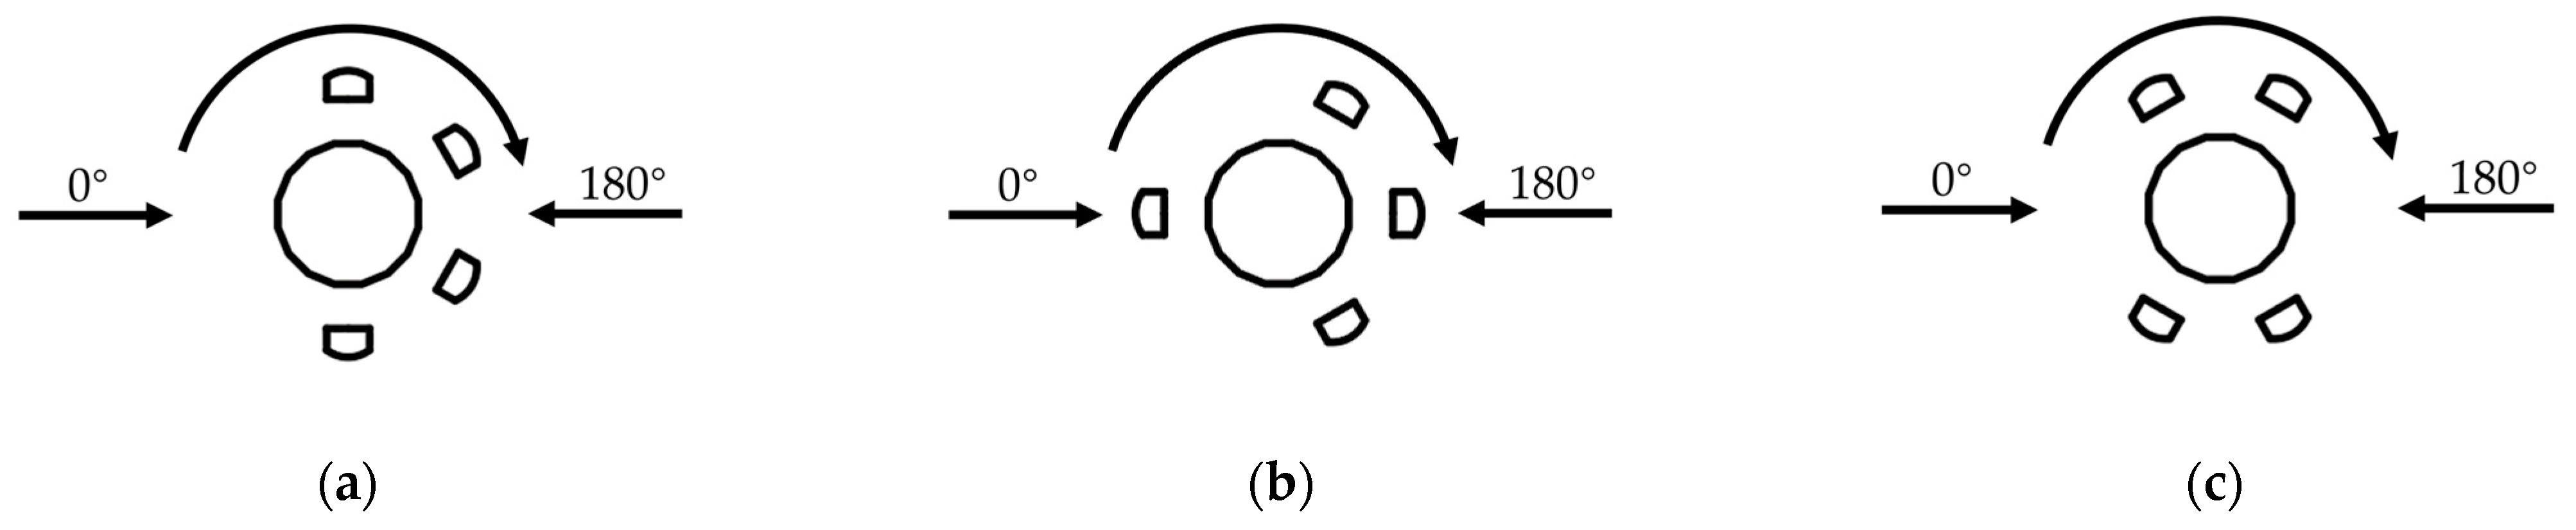
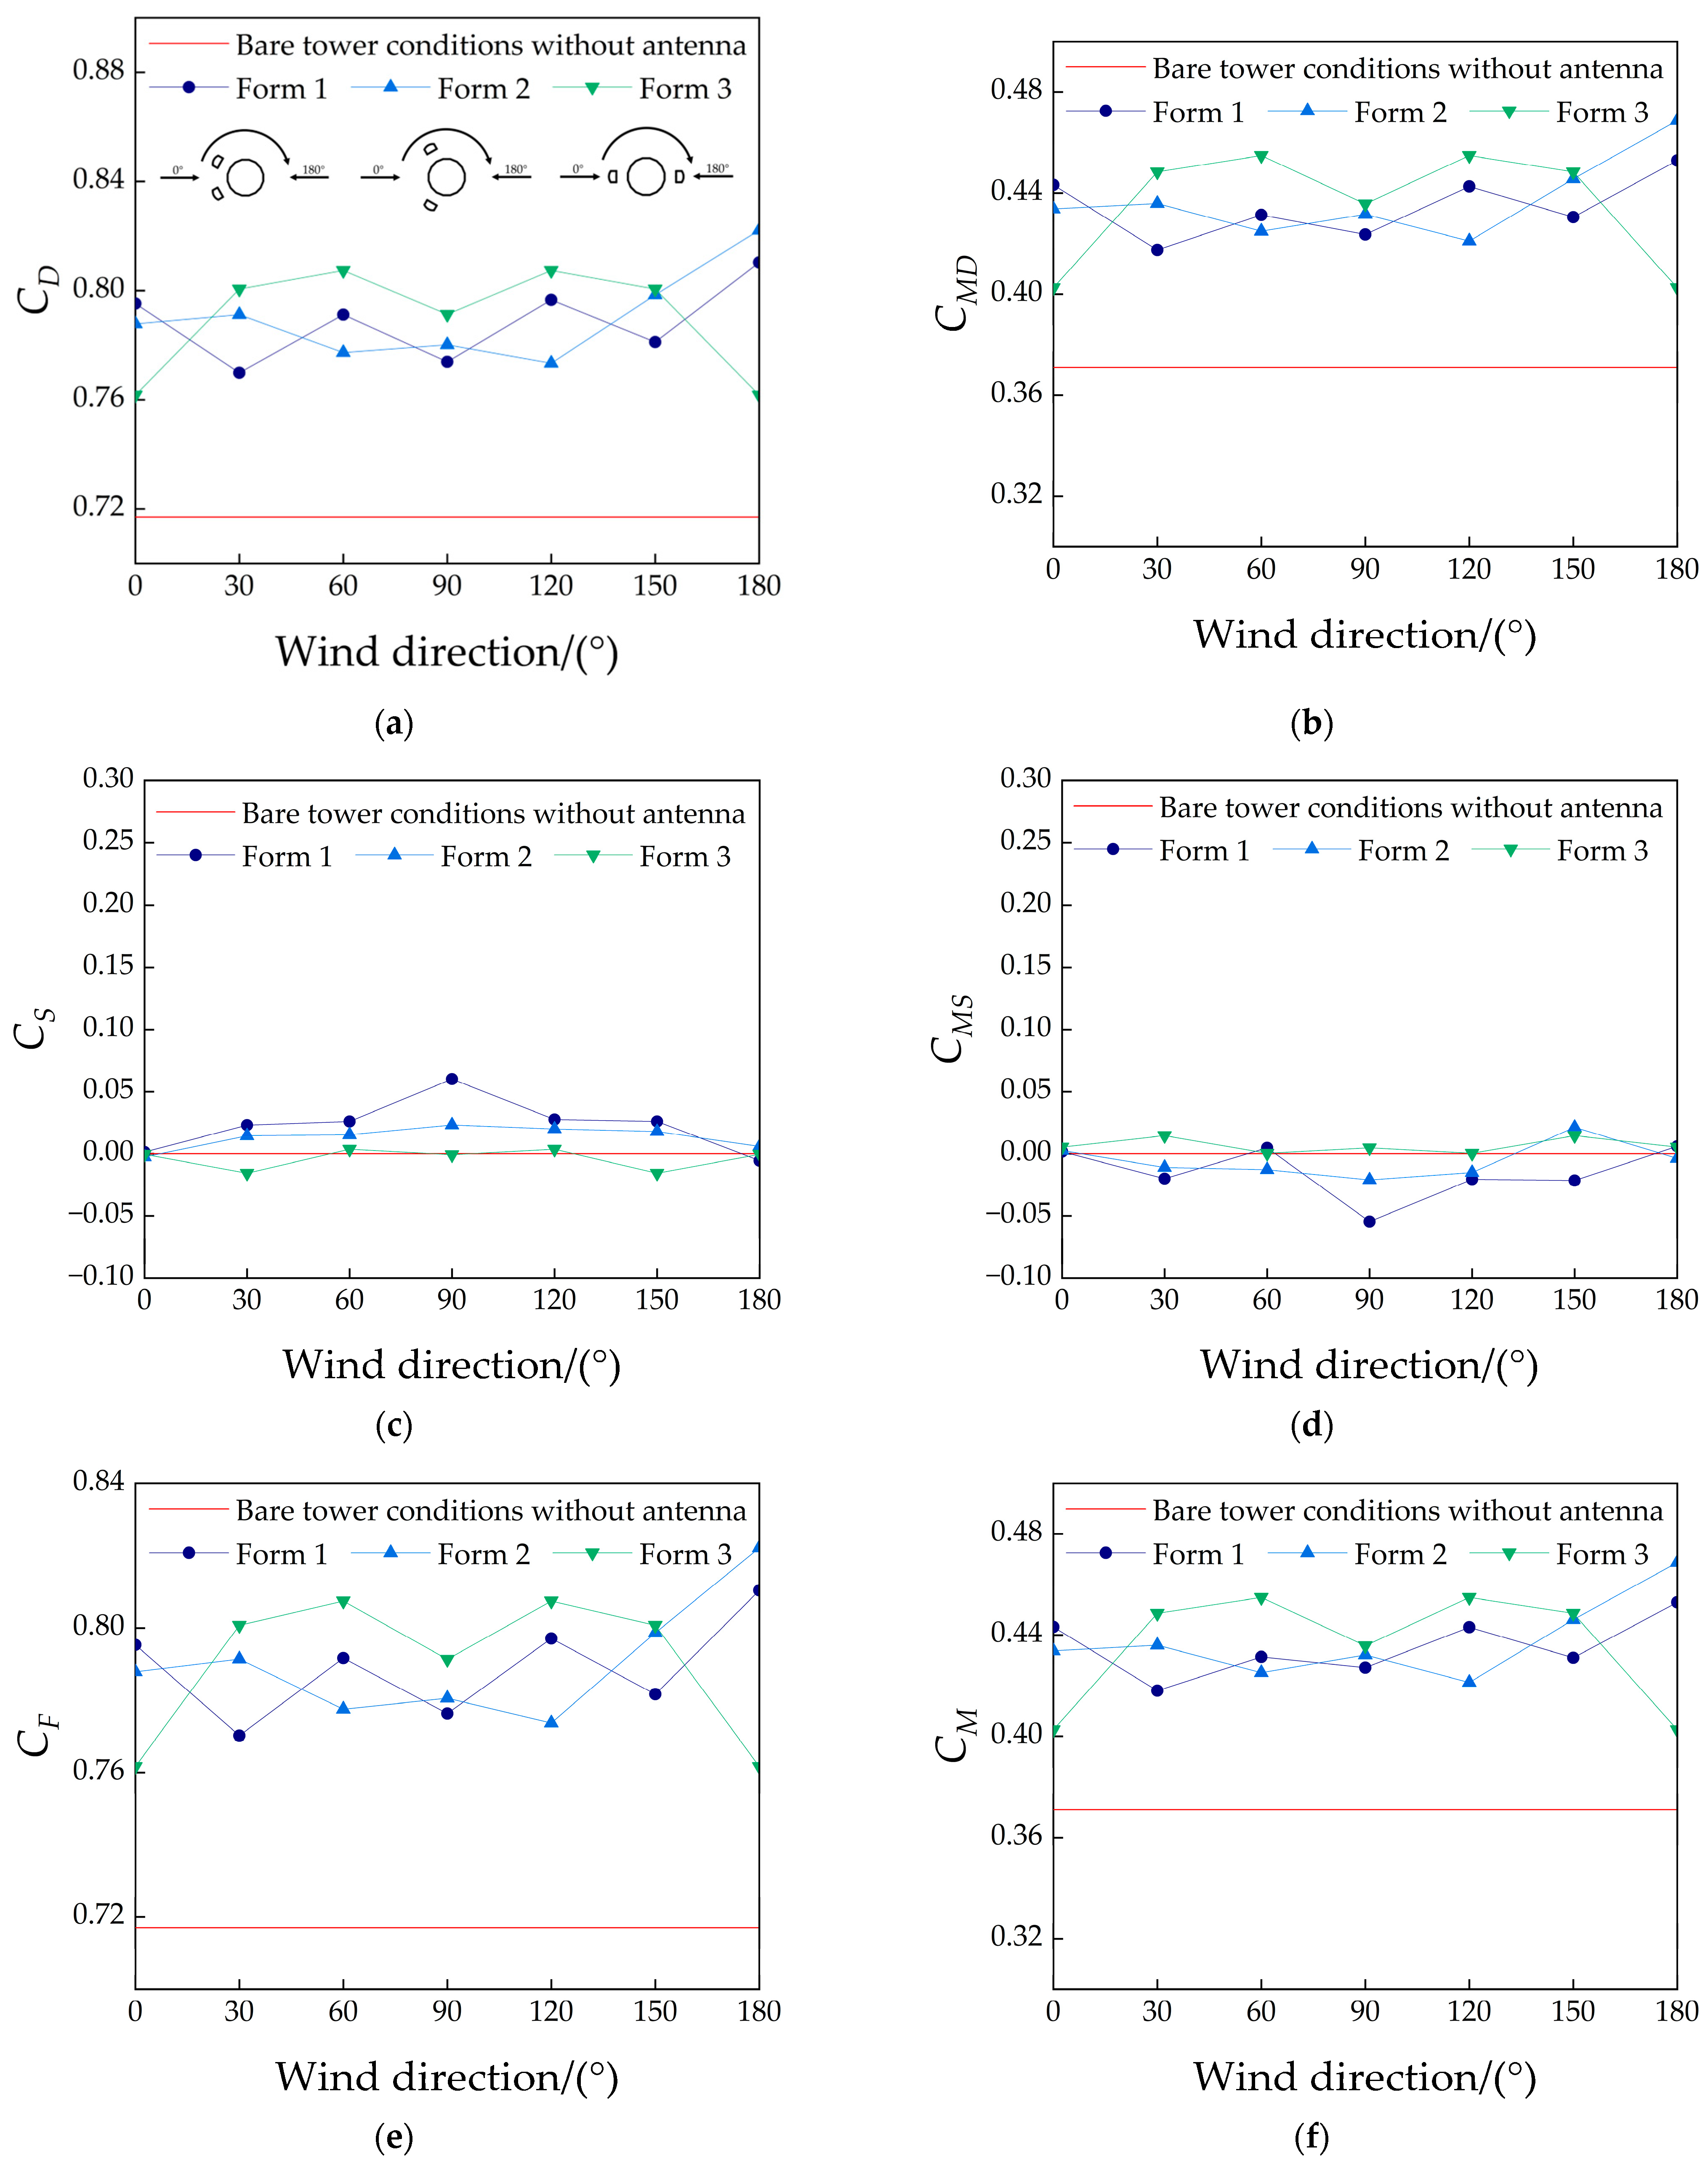
When arranging two antennas, there are three forms, as shown in
Figure 8. The wind load on the telecommunication tower as a function of the wind direction is shown in
Figure 11.
Figure 11a,b illustrate the drag coefficient and the windward base overturning moment coefficient of the telecommunication tower, respectively, while
Figure 11c,d present the lateral force coefficient and the crosswind base overturning moment coefficient, respectively. The drag coefficient and lateral force coefficient were combined to derive the overturning force coefficient for the telecommunication tower, as demonstrated in
Figure 11e. Similarly, the windward and crosswind base overturning moment coefficients were combined to yield the overturning moment coefficient for the telecommunication tower, as shown in
Figure 11f. From
Figure 11, it is evident that the lateral force coefficient and the crosswind base overturning moment coefficient are significantly smaller compared to the drag coefficient and the windward base overturning moment coefficient. Consequently, after combining, the values of the drag coefficient and the windward base overturning moment coefficient are very close to those of the overturning force coefficient and the overturning moment coefficient.
As shown in
Figure 11, it is evident that the arrangement form of the antennas significantly affects the wind load on the telecommunication tower. The poorer the symmetry after antenna arrangement, the greater the values of the lateral force coefficient and crosswind base overturning moment coefficient of the telecommunication tower. The distribution curves of the tower’s overturning force coefficient and overturning moment coefficient generally follow a similar trend. When two antennas are in arrangement form 1, both the overturning force coefficient and overturning moment coefficient of the tower exhibit a sawtooth pattern as the wind direction changes. When two antennas are in arrangement form 2, from 0° to 120° wind directions, the fluctuations in the overturning force coefficient and overturning moment coefficient curves are relatively mild, but they increase rapidly from 120° to 180°, reaching their maximum values at 180°. Compared to the bare tower condition without antennas, the overturning force coefficient and the overturning moment coefficient increased by 14.7% and 26.4%, respectively. When two antennas are in arrangement form 3, the tower’s overturning force coefficient and overturning moment coefficient reach their maximum values at wind directions of 60° and 120°, and for most wind directions, both coefficients are higher than those of the other two arrangement forms.
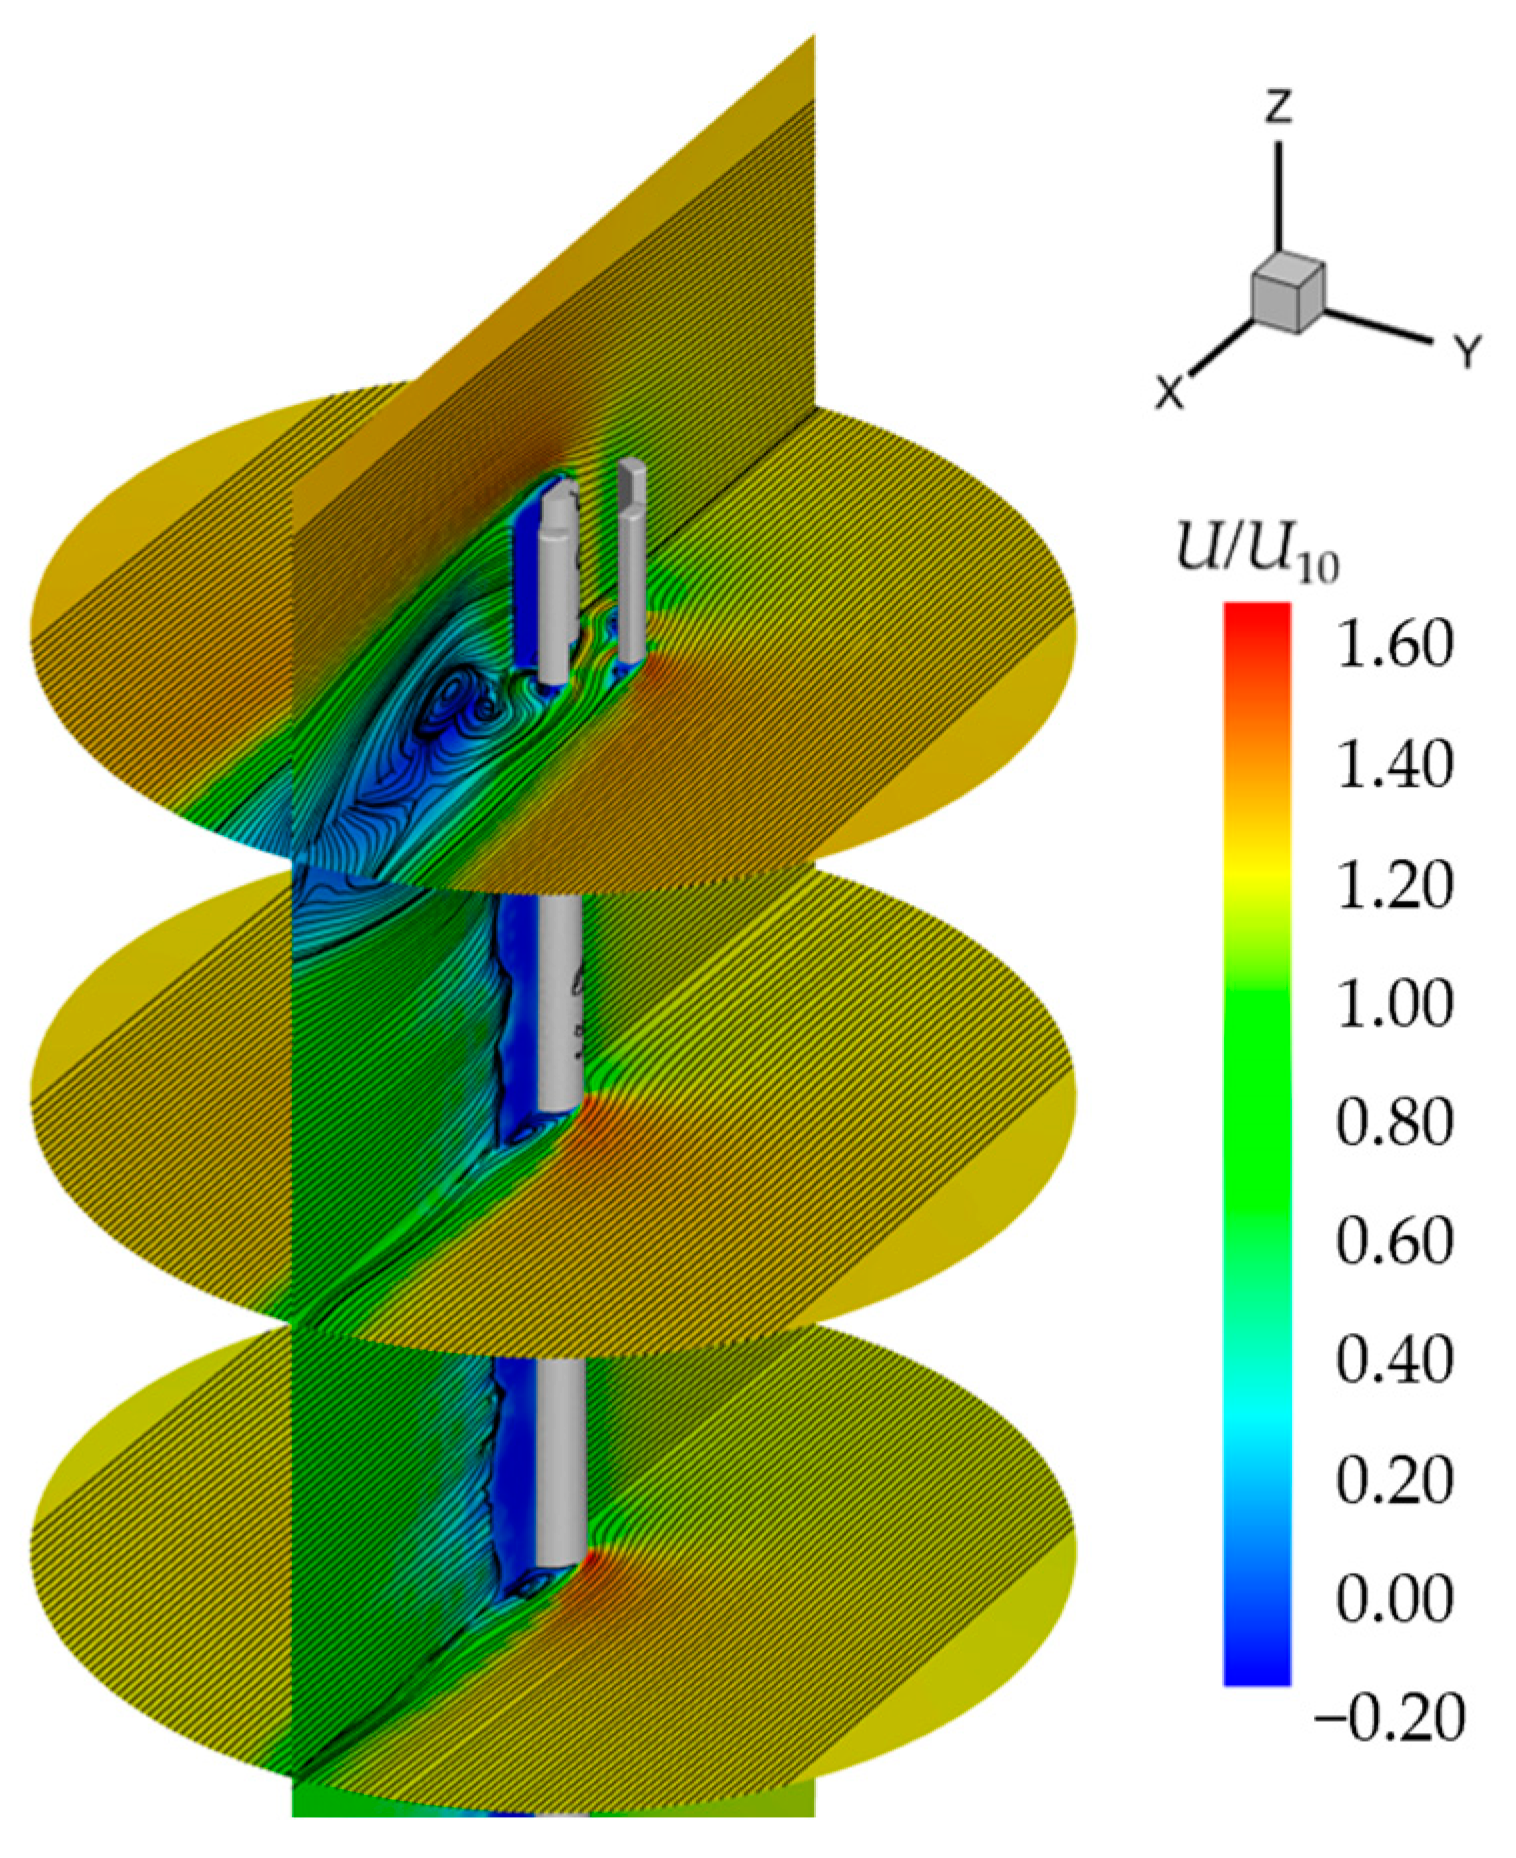
Figure 12 shows the flow fields at the mid-height cross-section of the antennas for three different arrangement forms when two antennas are arranged in a single layer. When the circular end of the antenna faces the wind, the wake region is small, resulting in a lower overturning force coefficient; when the flat end of the antenna faces the wind, the wake region noticeably enlarges, causing an increase in the overturning force coefficient.
When two antennas are arranged in form 1, as shown in
Figure 12a, within the 0° to 60° wind direction range, both antennas are located upstream of the tower cylinder, and with their circular ends facing the wind. The tower cylinder disrupts the wake and vortex formation area of the antennas. The upstream antenna significantly obstructs the inflow toward the tower cylinder, and its wake alters the characteristics of the flow, impacting the tower cylinder. At a 30° wind direction, relative to the inflow direction, one antenna is directly in front of the tower cylinder with a small gap, causing the antenna’s separation shear layer to attach to the downstream tower cylinder, significantly reducing the flow velocity in the gap and, thus, decreasing the overturning force coefficient on the telecommunication tower. At a 90° wind direction, relative to the inflow direction, one antenna is directly in front of the other, and due to the small gap, they are also in a shear layer reattachment state, resulting in a reduction of the overturning force coefficient on the tower. In the 120° to 180° wind direction range, the tower cylinder is upstream of the antennas, and with the flat end of the antennas facing the wind, the wake region enlarges significantly, leading to a greater overturning force coefficient. At a 150° wind direction, relative to the inflow direction, the tower cylinder is directly in front of one antenna, causing the tower cylinder’s separation shear layer to attach to the surface of the downstream antenna, resulting in a reduction of the overturning force coefficient on the tower. This is why the overturning force coefficient of the telecommunication tower varies in a sawtooth pattern with the wind direction. At a 180° wind direction, the presence of the two antennas causes the wall boundary layer separation point on the tower cylinder to move forward, increasing the overturning force coefficient; at the same time, the large windward angles of the flat ends of the antennas enlarge the wake region, further increasing the overturning force coefficient, thus significantly enhancing the overturning force coefficient on the telecommunication tower at a 180° wind direction.
When two antennas are arranged in form 2, as shown in
Figure 12b, within the 60° to 120° wind direction range, the blocking effect between the antennas and the tower cylinder, and between the antennas themselves, is significant, reducing the overturning force coefficient on the telecommunication tower. At a 180° wind direction, the interference effect between the antennas and the tower cylinder, and between the antennas themselves, is weaker, and with the flat end of the antennas facing the wind, the wake region enlarges significantly, resulting in the highest overturning force coefficient on the telecommunication tower at this wind direction.
When two antennas are arranged in form 3, as shown in
Figure 12c, at the 0° and 180° wind directions, relative to the inflow direction, the two antennas and the tower cylinder are in a serial arrangement, resulting in the strongest blocking effect among these three elements, significantly reducing the overturning force coefficient on the telecommunication tower. In the 30° to 150° wind direction range, compared to forms 1 and 2, the interference effect between the antennas and the tower cylinder, and between the antennas in form 3, is significantly weakened, thus the overturning force coefficient on the tower is higher than the other two arrangement forms.
For an arrangement of four antennas, there are three arrangement forms, as shown in
Figure 9, and the variation curve of the wind load on the telecommunication tower with the wind direction is shown in
Figure 13. When four antennas are in arrangement form 1, the tower’s overturning force coefficient and overturning moment coefficient are most sensitive to changes in the wind direction. At a 90° wind direction, both the overturning force coefficient and overturning moment coefficient of the tower significantly decrease, reaching their lowest values. When four antennas are in arrangement form 2, the tower’s overturning force coefficient and overturning moment coefficient significantly decrease at wind directions of 60° and 180°. When four antennas are in arrangement form 3, the variation curves of the tower’s overturning force coefficient and overturning moment coefficient with wind direction are relatively gentle, showing insensitivity to changes in the wind direction.
Figure 14 shows the flow fields at the mid-height cross-section of the antennas for three different arrangement forms when four antennas are arranged in a single layer. As shown in
Figure 14, with four antennas in arrangement form 1, at a 0° wind direction, the interference effects between the antennas and the tower cylinder, and between the antennas themselves, are weaker. Moreover, all four antennas have their flat ends facing the wind, significantly enlarging the wake region, which results in the highest overturning force coefficient on the telecommunication tower; at a 90° wind direction, relative to the inflow direction, two of the antennas and the tower cylinder are in a serial arrangement, and the remaining two antennas are also serially arranged, resulting in the strongest blocking effect and significantly reducing the overturning force coefficient on the telecommunication tower. When four antennas are in arrangement form 2, at the 0° and 180° wind directions, relative to the inflow direction, there are two antennas and the tower cylinder in a serial arrangement, but at the 180° wind direction, the remaining two antennas face the wind with their circular ends, significantly reducing the wake region and, thus, lowering the overturning force coefficient of the tower. At the 60° and 120° wind directions, there is one antenna and the tower cylinder in a serial arrangement, and another two antennas are also serially arranged, but at the 60° wind direction, one antenna is completely in the wake region of the tower cylinder, and the fourth antenna is facing the wind with its circular end, also significantly reducing the wake region, resulting in a decrease in the overturning force coefficient of the tower. When four antennas are in arrangement form 3, due to the better uniformity of the four antennas, the flow field around them changes less with wind direction, making the overturning force coefficient on the tower less sensitive to changes in the wind direction.
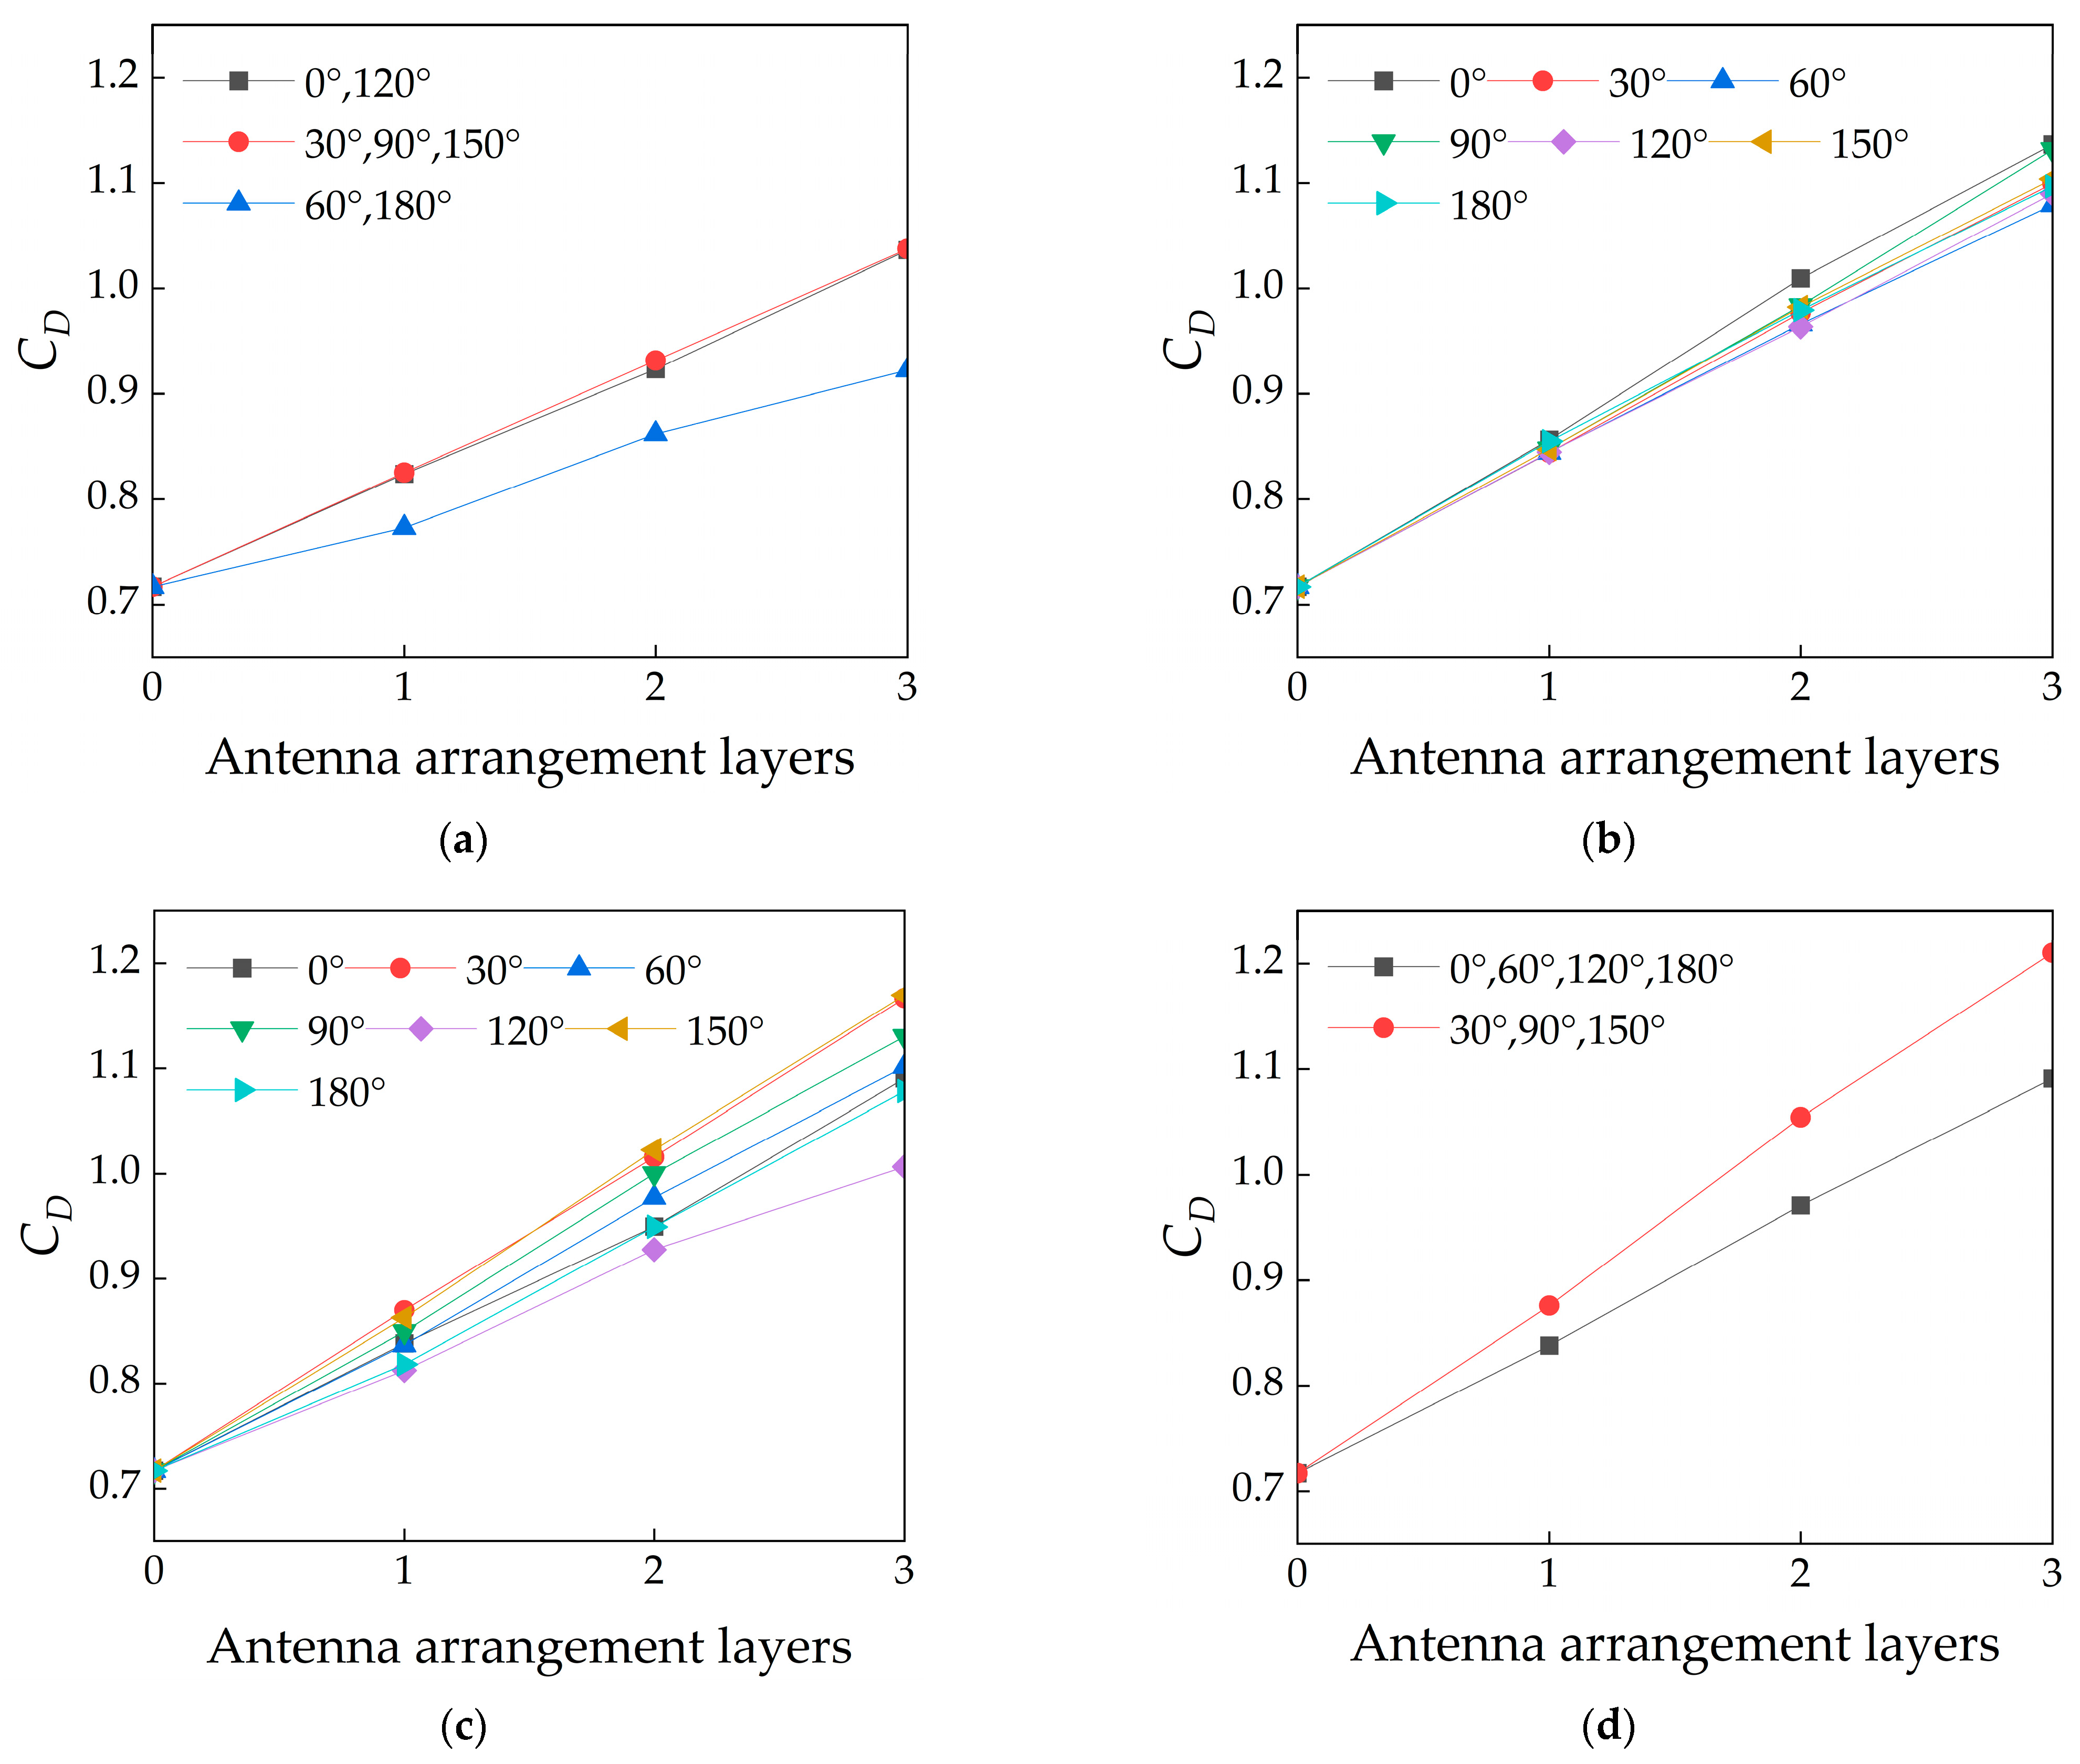
Figure 15 shows in detail the variation of the wind load on the telecommunication tower with the antenna arrangement number for a single layer arrangement under different wind directions, where the cases with two and four antennas display the maximum wind load coefficient values for different arrangement forms.
From
Figure 15, it can be seen that the values of the drag coefficient and the windward base overturning moment coefficient are always very close to those of the overturning force coefficient and the overturning moment coefficient. The lateral force coefficient and the crosswind base overturning moment coefficient of the telecommunication tower vary with the antenna arrangement number in a similar pattern and are very small in value, showing a trend of initially increasing and then decreasing as the antenna arrangement number increases. The maximum value is reached when two antennas are arranged at a 90° wind direction.
It is also clear that the sensitivity of the telecommunication tower’s overturning force coefficient to the wind direction varies with different antenna arrangement numbers. When a single antenna is used in the arrangement, the overturning force coefficient of the tower changes slightly within the 30° to 150° wind direction range and significantly decreases at the 0° and 180° wind directions, approaching the bare tower condition without antennas. When three antennas are used in the arrangement, the tower’s overturning force coefficient significantly decreases at the 60° and 180° wind directions, with the overturning force coefficient values being nearly equal at other wind directions. When five and six antennas are used in the arrangement, the variation curves of the tower’s overturning force coefficient with the wind direction are approximately sawtooth-shaped, but with five antennas, the coefficient is more sensitive to the wind direction, with a larger range of variation. Overall, when a single layer of antennas is arranged on the tower, the overturning force coefficient tends to increase with the antenna arrangement number, but the extent of the increase gradually diminishes as the antenna arrangement number increases. The pattern of change in the overturning moment coefficient of the telecommunication tower with the antenna arrangement number is basically consistent with that of the overturning force coefficient, but with an increase in the antenna arrangement number, the magnitude of increase in the overturning moment coefficient is about twice that of the overturning force coefficient.
3.3. Impact of the Antenna Arrangement Layers on the Wind Load of Telecommunication Towers
When two or three layers of antennas are arranged on the telecommunication tower, each layer can accommodate three to six antennas, with the total antenna arrangement number being 6 to 18.
Through a comparison with
Section 3.2, it was found that the rate of increase in the wind load with the antenna arrangement layers is significantly greater than with the antenna arrangement number.
Figure 16,
Figure 17,
Figure 18 and
Figure 19 illustrate the flow fields around the telecommunication tower under the arrangement forms associated with the maximum wind load when one layer of antennas with six antennas per layer is used, two layers with three antennas per layer, two layers with six antennas per layer, and three layers with four antennas per layer, respectively. When the total antenna arrangement number is the same, as shown in
Figure 16,
Figure 17,
Figure 18 and
Figure 19, it can be seen that the interference effect between the antennas arranged on different layers is weak. Increasing the antenna arrangement layers significantly enlarges the wake region, thereby substantially increasing the overturning force coefficient. Therefore, to reduce the wind load, it is advisable in practical engineering applications to increase the antenna arrangement number per layer, thereby reducing the antenna arrangement layers.
The distribution pattern of wind loads on the telecommunication tower is shown in
Figure 20,
Figure 21,
Figure 22,
Figure 23,
Figure 24 and
Figure 25, where the values for the case of four antennas per layer represent the maximum wind load coefficient values among the three arrangement forms. By comparing
Figure 20,
Figure 21,
Figure 22,
Figure 23,
Figure 24 and
Figure 25, it can be observed that when arranging multiple layers of antennas, the lateral force coefficient and the crosswind base overturning moment coefficient remain significantly smaller compared to the drag coefficient and the windward base overturning moment coefficient. Therefore, the values of the drag coefficient and the windward base overturning moment coefficient are very close to those of the overturning force coefficient and the overturning moment coefficient.
The absolute values of the lateral force coefficient and the crosswind base overturning moment coefficient of the telecommunication tower, as they vary with the antenna arrangement layers and wind direction, are shown in
Figure 22 and
Figure 23. Compared to the drag coefficient and windward base overturning moment coefficient, the lateral force coefficient and crosswind base overturning moment coefficient of the telecommunication tower are more sensitive to changes in the wind direction. They exhibit a greater range of growth rates with the increase in the antenna arrangement layers. As the symmetry of the antennas relative to the inflow wind direction improves, the values of the telecommunication tower’s lateral force coefficient and crosswind base overturning moment coefficient become lower. When arranging four antennas per layer, at wind directions of 0° and 180°, the symmetry is optimal, resulting in the smallest lateral force coefficient and crosswind base overturning moment coefficient at these wind directions, showing insensitivity to the increase in antenna arrangement layers. The absolute values of the tower’s lateral force coefficient and crosswind base overturning moment coefficient reach 0 to 0.115 and 0 to 0.093, respectively.
Moreover, as the antenna arrangement number per layer increases, the growth rate of the telecommunication tower’s lateral force coefficient and the crosswind base overturning moment coefficient with the antenna arrangement layers initially rises and then falls. The maximum growth rate occurs when there are four antennas per layer, and the minimum growth rate is observed with six antennas per layer.
As shown in
Figure 24, when the antenna arrangement number per layer is the same, the overturning force coefficient of the telecommunication tower approximately linearly increases with the increase in antenna arrangement layers. Moreover, as the antenna arrangement number per layer increases, the growth rate of the tower’s overturning force coefficient with the antenna arrangement layers also gradually increases.
When three antennas are arranged per layer, the rate of increase in the telecommunication tower’s overturning force coefficient with the antenna arrangement layers ranges from 7.0% to 15.2%. At the 0°, 30°, 90°, 120°, and 150° wind directions, the rate of increase in the telecommunication tower’s overturning force coefficient with the antenna arrangement layers is very close, significantly higher than at the 60° and 180° wind directions, i.e., approximately 1.5 times higher; when four antennas are arranged per layer, the rate of increase ranges from 11.7% to 19.5%; with five antennas per layer, the range is 8.5% to 21.4%, which is the most sensitive to the wind direction, reaching the maximum values at either the 30° or 150° wind direction; and with six antennas per layer, the rate of increase in the telecommunication tower’s overturning force coefficient ranges from 12.4% to 22.2%. At the 30°, 90°, and 150° wind directions, the rate of increase in the telecommunication tower’s overturning force coefficient with the antenna arrangement layers is very close, significantly higher than at the 0°, 60°, 120°, and 180° wind directions, i.e., approximately 1.3 times higher.
Figure 25 presents the variation curve of the overturning moment coefficient of the telecommunication tower in relation to the antenna arrangement layers and wind direction. From the figure, it is evident that when the antenna arrangement number per layer remains constant, the overturning moment coefficient of the telecommunication tower exhibits a nonlinear increase with additional antenna arrangement layers, which significantly differs from the trend observed in the overturning force coefficient. Moreover, as the antenna arrangement number per layer increases, the rate of increase in the telecommunication tower’s overturning moment coefficient with antenna arrangement layers also gradually increases, and is significantly greater than the rate of increase in the overturning force coefficient with antenna arrangement layers. As demonstrated, when three to six antennas are arranged per layer, the range of the growth rate of the overturning moment coefficient with antenna arrangement layers gradually elevates, specifically to 8.8% to 27.2%, 9.8% to 35.7%, 10.2% to 38.7%, and 10.8% to 41.0%, which is markedly higher than the growth rate of the overturning force coefficient with antenna arrangement layers.
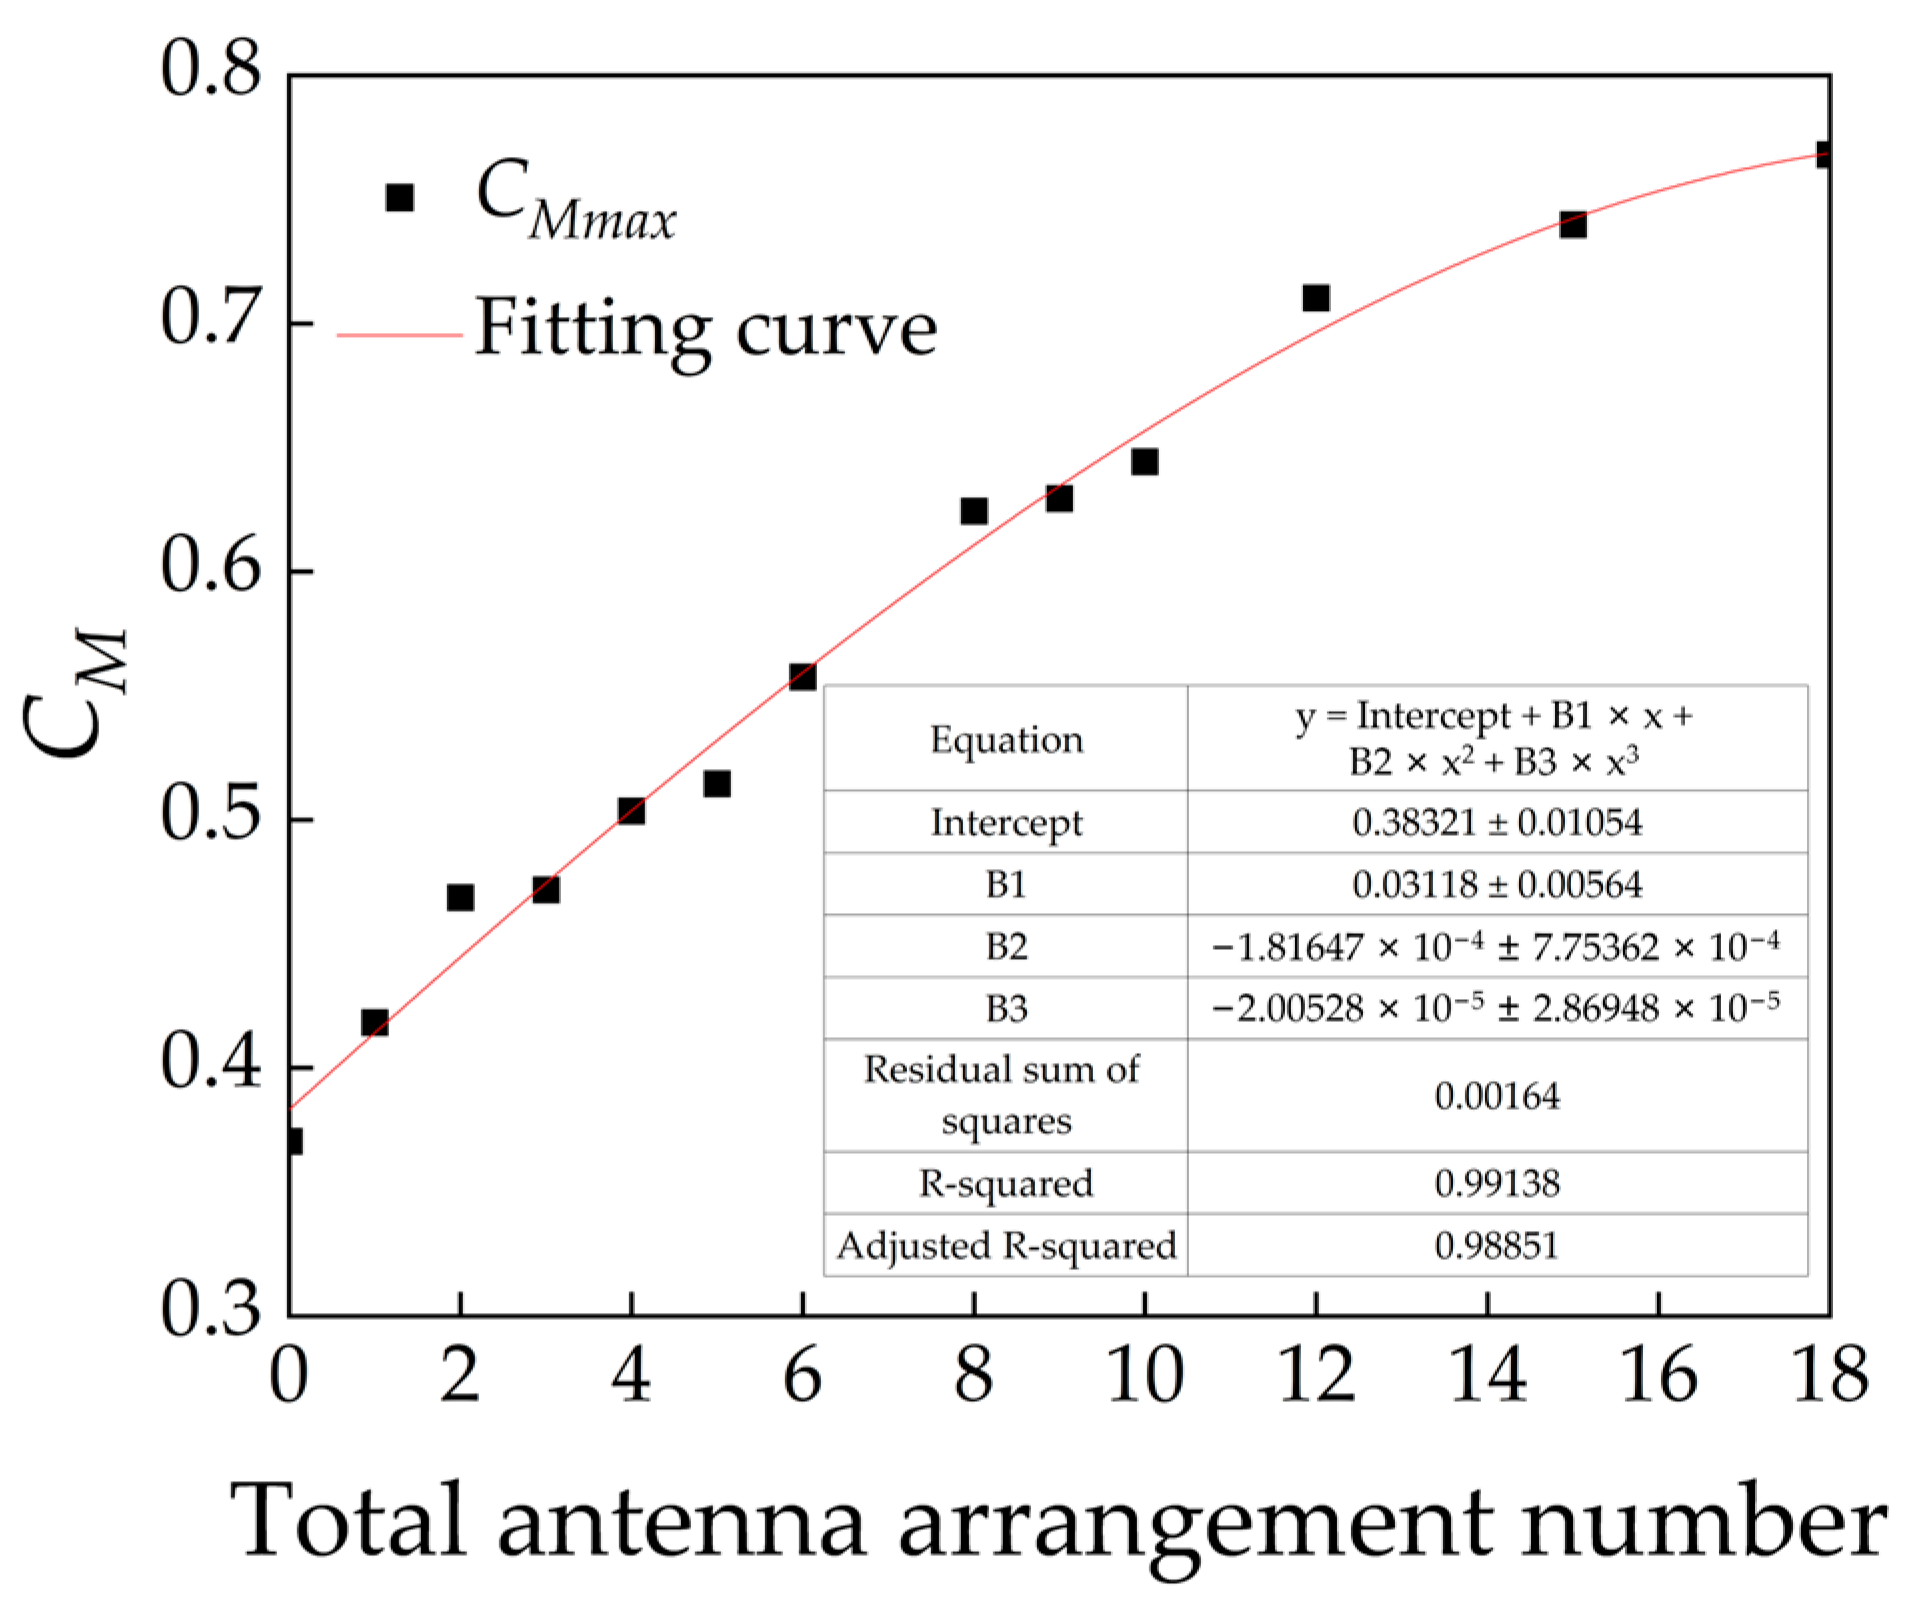
In order to further analyze the impact of the antenna arrangement layers on the wind load of the telecommunication tower, the maximum values of wind loads for all wind directions were used to eliminate the influence of wind direction, as shown in
Figure 26.
The values of the drag coefficient and the windward base overturning moment coefficient are very close to those of the overturning force coefficient and the overturning moment coefficient.
With the increase in the antenna arrangement layers, the lateral force coefficient and the crosswind base overturning moment coefficient of the telecommunication tower gradually increase. Moreover, the rate of increase in both coefficients with antenna arrangement layers is significantly influenced by the antenna arrangement number per layer, with the highest rate of increase when four antennas are arranged per layer, and the lowest when six antennas are arranged per layer.
The overturning force coefficient of the telecommunication tower increases approximately linearly with the increase in antenna arrangement layers, showing good consistency. Furthermore, the greater the antenna arrangement number per layer, the higher the rate of increase in the overturning force coefficient with antenna arrangement layers. Specifically, when four antennas are arranged per layer, the growth rate of the telecommunication tower’s overturning force coefficient with antenna arrangement layers is significantly higher than the case with three antennas per layer, but the difference narrows significantly compared to the cases with five or six antennas per layer.
As the antenna arrangement layers increase, the overturning moment coefficient of the tower also gradually increases, but the rate of increase gradually decreases. Similar to the overturning force coefficient, the rate of increase in the tower’s overturning moment coefficient with the antenna arrangement layers is significantly higher when four antennas are arranged per layer compared to the case with three antennas per layer, but the gap narrows significantly when compared to cases with five and six antennas per layer.
Figure 27 shows the flow field around the telecommunication tower when six antennas are arranged per layer, with antenna arrangement layers varying from one to three. The figure reveals that the interference effect between antennas arranged on different layers is weak, which explains why the overturning force coefficient approximately exhibits a linear increase with antenna arrangement layers.


