1. Introduction
First and foremost, it is crucial to understand the seismic context in which the analysed structures are located. This region is characterised by significant seismic activity due to its location in a high seismic risk zone [
1]. Seismic zones, such as the one covering the study area, are subject to tectonic movements that can have devastating effects on buildings if proper design and construction measures to withstand them are not taken [
2].
A notable example of seismic vulnerability in the region is the earthquake that occurred in the city of Lorca (southeast Iberian Peninsula) in 2011, which caused extensive damage to numerous structures and buildings [
3,
4,
5,
6]. This seismic event not only highlighted the importance of seismic resistance in building design but also served as a reminder of the need to fully evaluate and understand structural behaviour under extreme events [
7,
8].
In addition to the Lorca case, it is relevant to consider the possibility of future earthquakes in the region. In the province of Huelva (southwest Iberian Peninsula), there have been several earthquakes of considerable magnitude in the last century [
9,
10]. The peak ground acceleration for Huelva has indeed increased in recent years [
11]. Although none of them reached the magnitude of the 2011 Lorca earthquake, this seismic event also raises concerns about structural safety and the need to develop effective strategies for seismic risk assessment and mitigation [
12]. Therefore, it is essential to investigate and compare different methods of evaluating seismic response to ensure adequate protection of structures in earthquake-prone areas. In the recent history of the province of Huelva, the most devastating earthquake was the Lisbon earthquake (1755), with a magnitude ranging from 8.2 to 9.2 degrees [
13,
14].
This devastating effect could be avoided in the future by using an appropriate structural typology, calculation models that adequately model the earthquake and the consideration of an accelerogram from a safety perspective. The analysis of seismic vulnerability at the urban scale, which allows risk analysis and quantification of expected losses, is also a suitable strategy [
15].
In the context of the usual typologies of the case study site, reinforced concrete is the most common material for buildings in Huelva. Several existing buildings were designed to outdated seismic codes, so some have been retrofitted to correct connections, material properties and other deficiencies. Selected strategies exist to address the problem, such as elasto-plastic dissipative bracing (EPDB) to provide supplementary stiffness and energy dissipation in the main frame of resistance [
16]. Non-linear static procedures are increasingly being used in the design and seismic assessment of infrastructure such as bridges and are often considered as an alternative to dynamic nonlinear analysis [
17]. The NCSP-07 standard for seismic analysis of bridges in Spain permits the use of non-linear static procedures but only as a supplement to dynamic analysis [
18]. For high-rise buildings, modular steel buildings (MSB) are already available as a novel solution to improve seismic performance [
19]. For composite structures that do not dispense with concrete, the use of concrete-filled tubular steel composite columns (CFST) with ultra-high performance concrete (UHPC) slabs has shown good seismic performance [
20].
The ground motion characteristics have a significant effect on the seismic response, so its application in some areas of the Huelva coast with low load-bearing capacity would require specific analysis. In this context, a steel solution such as the PEC-Steel Spliced Frame Beam (SPSFB), which aims to maintain the advantages of the PEC beam while reducing steel consumption, could be a valid option [
21].
Among the methods for evaluating seismic response, pushover analysis has gained recognition as an effective tool for understanding the behaviour of structures under seismic loads [
22]. In combination with non-linear dynamic analysis, this approach allows for a gradual and nonlinear assessment of the structural load capacity, identifying critical points of weakness and predicting possible collapse patterns [
23].
By applying pushover analysis to the structure under study, a deeper understanding of its behaviour under different induced displacements at specific nodes can be obtained, providing valuable information for decision-making in designing and improving the seismic resistance of buildings [
24,
25,
26]. The modelling of the behaviour of plastic hinges, including their properties, becomes fundamental in the analysis. The plasticisation of the connections of the structural elements and the successive occurrence of plastic hinges will eventually lead to structural collapse. In modern modular structures, this problem has been successfully addressed. There is already a novel prefabricated beam-column connection decoupled by bending and shear with a replaceable artificial controllable plastic hinge (ACPH) [
27]. To connect the precast concrete members, there are solutions using a replaceable friction-type artificial plastic hinge (FAPH) to connect the structural members [
28].
For this study, elastic response spectrum and calculation accelerograms from the NCSE-02 and EC-8 standards will be considered. A damping ratio of 5% has been applied [
29] as a very common case in structural analysis. The comparative analysis considers a 25% damping ratio, indicating high ductility. Additionally, the accelerogram of the 2011 Lorca earthquake has been considered [
30,
31]. The NAD (National Application Document for Spain; UNE-EN 1998-1:2011 with its amendment UNE-EN 1998-1:2011/A1:2013) of EC-8 (2013) for Spain contains the values of the necessary parameters (Table AN/2) [
11] that fit well to the characteristics of the case study, with corresponding soil types [
32].
The main objective of this study is to carry out a comprehensive and comparative analysis of different methods for evaluating seismic response in structures, focusing on spectral modal analysis, non-linear dynamic analysis, and pushover analysis. Specifically, it seeks to compare the maximum displacements obtained through non-linear dynamic analysis and spectral modal analysis, considering the types of vibration modes deduced in modal analysis. The pushover analysis is implemented to verify the effect of relevant displacements on the structure. With the pushover analysis, the aim is to evaluate, especially in terms of the formation of plastic hinges, the possibility of collapse under the action of a specific earthquake.
2. Materials and Methods
2.1. Methodology
The process consists of three earthquake analyses using three methods: spectral modal analysis, non-linear dynamic analysis, and pushover analysis. These methods are integrated into a specific methodology that allows testing the effect of a particular earthquake, such as the 2011 Lorca earthquake, on a structure with a specific structural model. A previous eigenvalue analysis is mandatory for all three methods. The spectral modal analysis and non-linear dynamic analysis are used to determine the largest displacement, which is then used to check for the formation of plastic hinges using pushover analysis. To evaluate structural collapse, the demand and capacity curves for a spectral displacement with different time steps are considered. The process of plastic hinge formation is determined until it is predictably incompatible with the building’s stability. In
Figure 1, the flow chart with the applied methodology is shown.
The novelty of the methodology consists in the integration of three methods: spectral modal analysis, non-linear dynamic analysis and pushover analysis, where the first two are used in parallel and the third in series, as follows: for a defined site, the seismic response spectrum required by the regulations is used (NCSE-02). In parallel, a calculated accelerogram is used, which, in the case study, is that of the 2011 Lorca earthquake since it is the most unfavourable recent historical case in southern Spain [
30]. Between the two analyses, modal spectral and non-linear dynamic analysis, the maximum displacements obtained in the defined structural model are evaluated as the maximum displacement for a reference node. The pushover analysis is then applied [
22,
23,
24,
25,
26], applying progressive loads that produce a displacement of the reference node that is at least equal to the largest of the two displacements obtained in the modal spectral analysis and the non-linear dynamic analysis. The formation of plastic hinges for this displacement is studied. Finally, the loads are increased, generating larger displacements, until the collapse of the structure is observed.
2.2. Structural Model
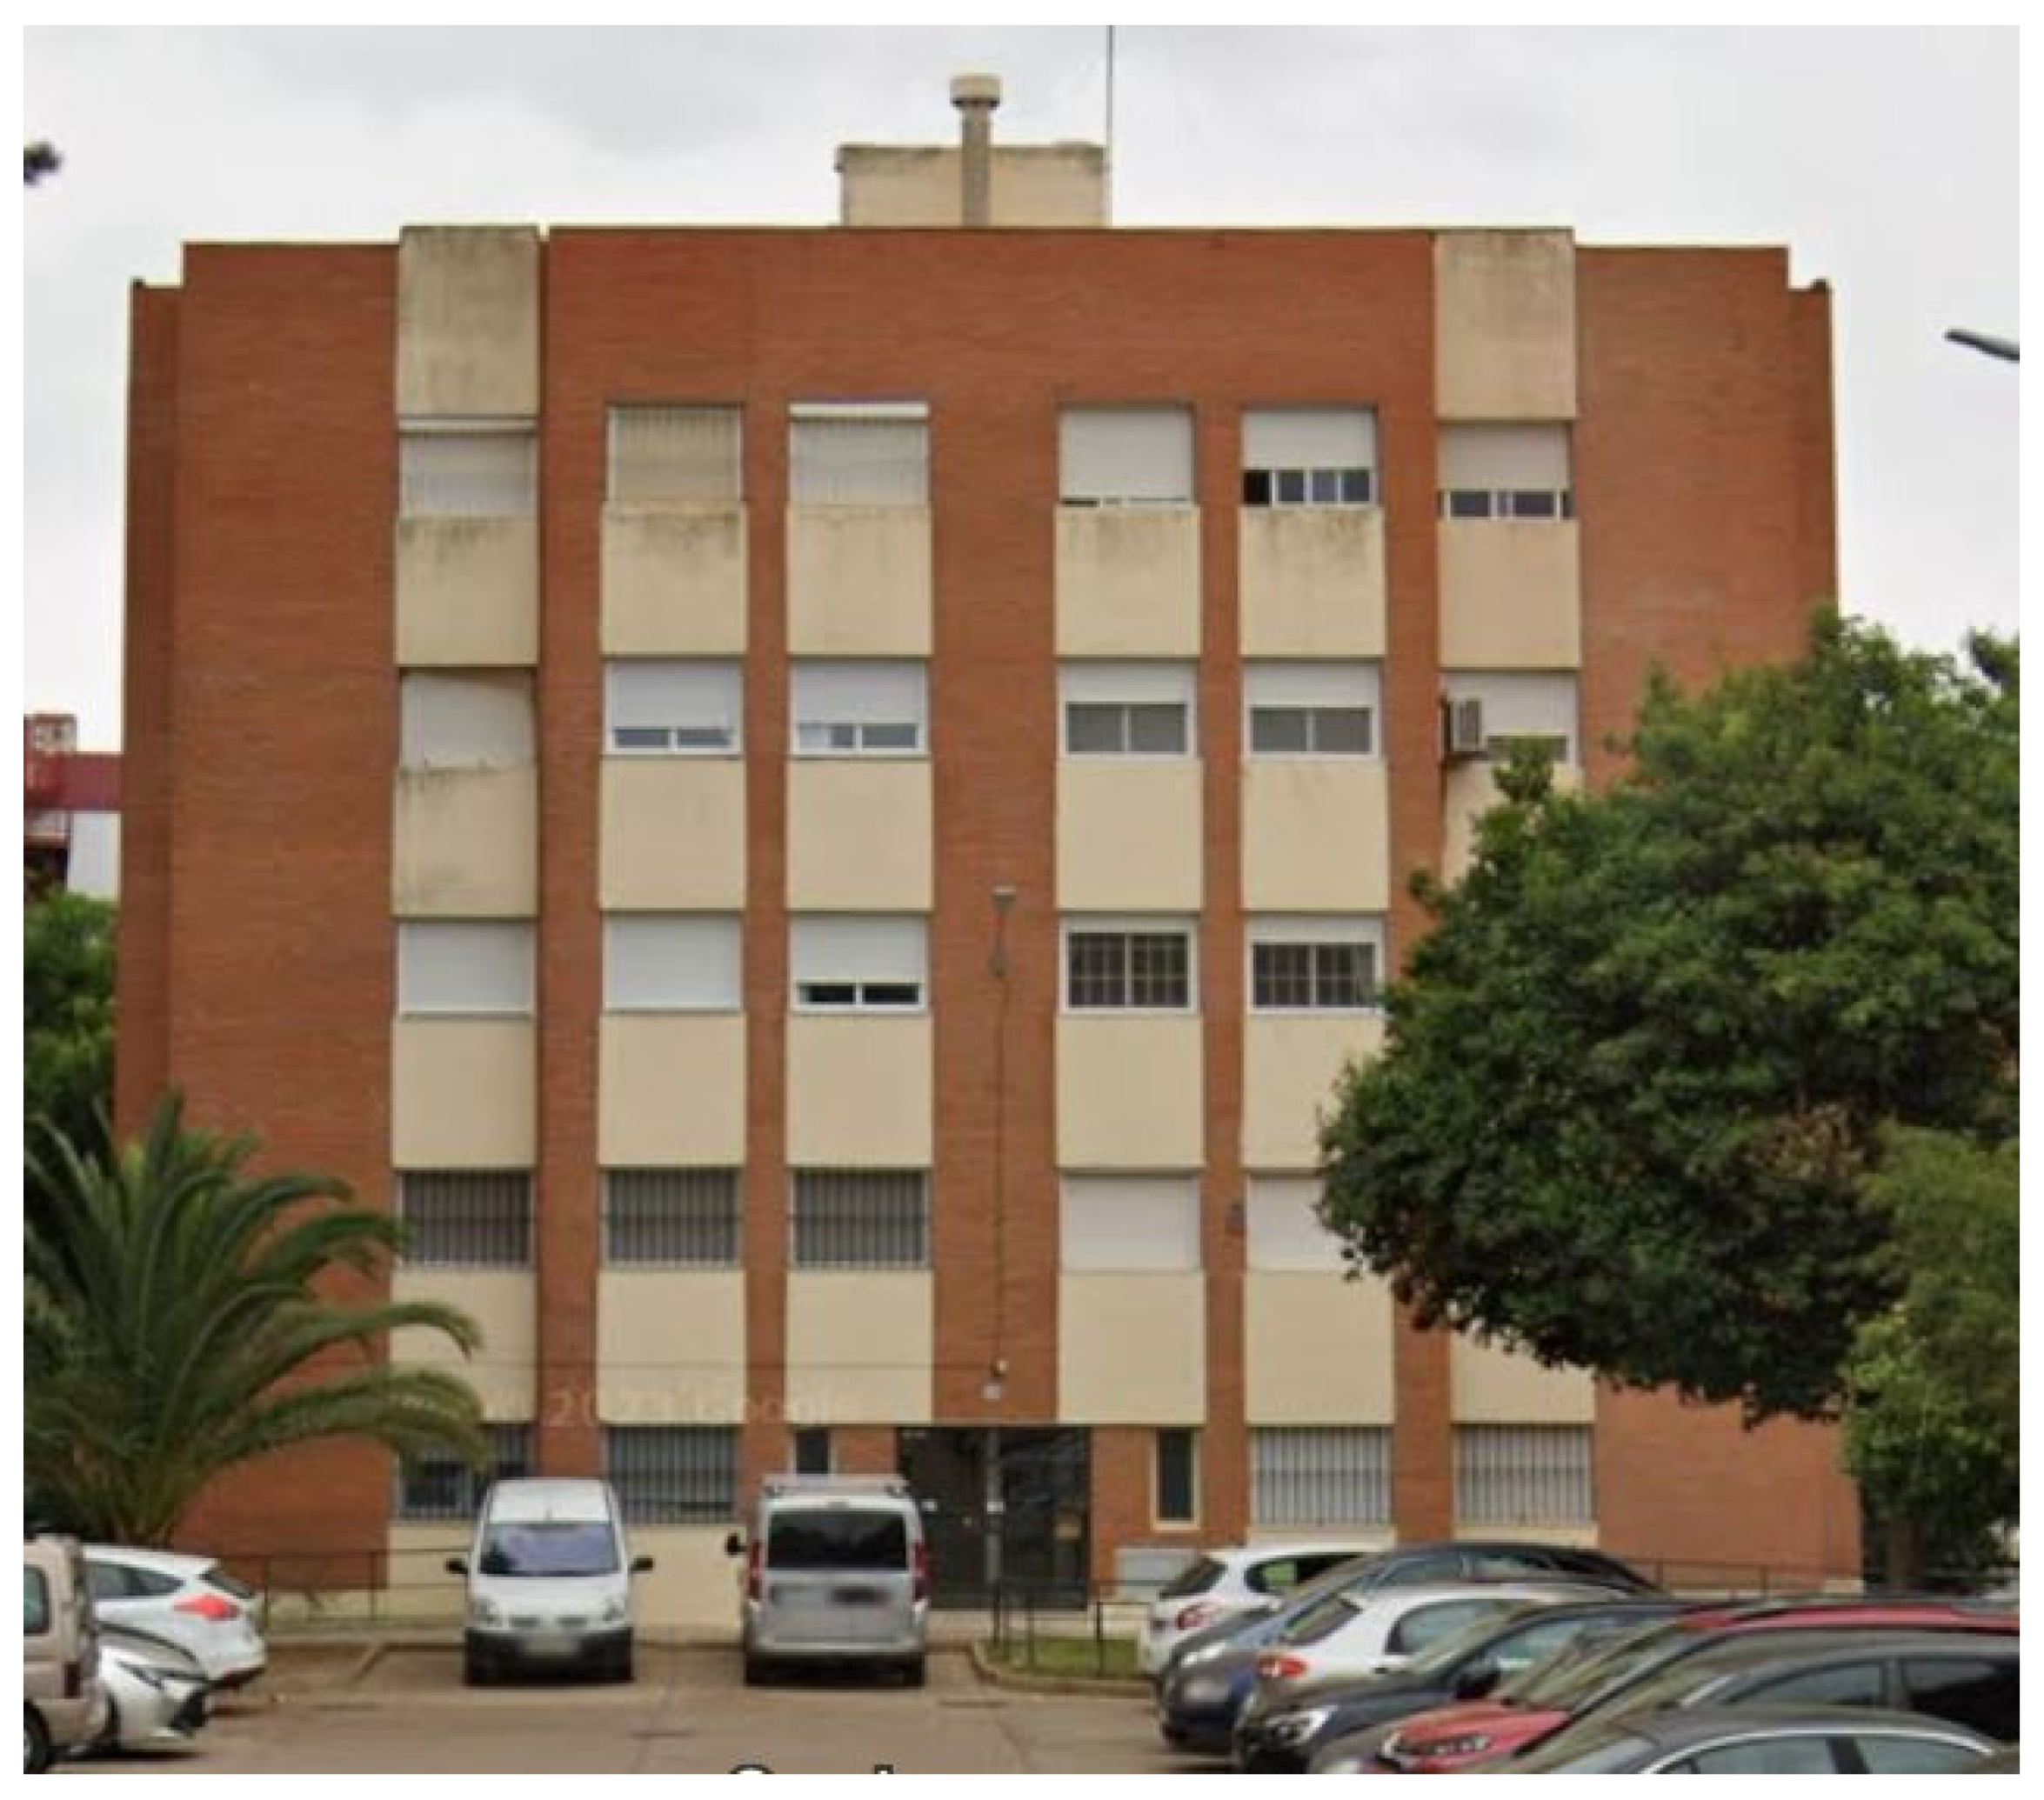
A three-dimensional finite element structure model was employed to carry out all the analyses conducted in this study. For this case study, a real building located in the Santa Marta neighbourhood of the city of Huelva (Spain) was used, and its facade can be seen in
Figure 2. The construction is made of reinforced concrete with prefabricated prestressed joists for the slabs, dating back to the late 1970s, and ceramic vaults with a compression layer and welded mesh to improve load distribution. Many of these buildings lack false ceilings, and the floor-to-floor height is not exactly 3 m but slightly less. The considered building has undergone various renovations, some of which are significant in the structure. In particular, the structure designed for Huelva, in accordance with the referenced regulations, has been considered. Specifically, it complies with the seismic standard with the peak ground acceleration values of the NCSE-02 in force until 2013.
For the model under study, the following characteristics have been considered, which imply adaptations in accordance with the NCSE-02 for dynamic calculations:
- -
Main facade measure 20 m long and lateral facade measure 13 m long. A standalone building without constructions on the sides but close to other buildings for wind action purposes (Type III with respect to [
11]).
- -
Height per floor of 3 m with a total of 15 m (5 floors including the ground floor). Symmetric stiffness per floor (in X and Y), similar between floors, is assumed for modelling purposes.
- -
The distribution pattern of beams and columns is shown in
Figure 3.
- -
It is assumed that the facade and interior pillars are similar. The facade pillars, despite bearing less load from the slab, must support the heavy brick wall visible from the exterior. The model includes their weight, along with the interior partitioning and flooring, in the constant slab self-weight for all panels.
- -
It is assumed that all beams are similar; the difference in spans in these is a maximum of 1 m. The resulting spans are 4 m and 5 m maximum, depending on the layout of the structure in the plan.
- -
It is assumed that the sections and reinforcement of beams are the same throughout the structure (45 × 60 cm).
- -
It is assumed that the sections and reinforcement of pillars are the same throughout the structure (60 × 60 cm). The basal pillars impose shear and longitudinal reinforcement, but also in some checks, the top floor pillars due to bending impose conditions on longitudinal reinforcement.
- -
The slab is modelled using a 30 cm thick one-way slab with joists spaced 50 cm apart and a weight of 0.5 kN/m. The same spacing between joists is maintained for all panels, with their orientation aligned along the Y-axis. The total slab area per floor is 260 m2.
- -
Projections on facades, access to the roof, and other building details are not included. The building has structural symmetry in X and Y (not in reality, because the central pillars of the last two rows are divided into two to make room for the stairs and the elevator).
- -
For static load purposes, a walkable terrace will be assumed.
- -
For seismic load purposes, it will be assumed that the building has its main facade aligned in the east-west direction. The entrance faces south and is assumed to be perfectly aligned in that direction.
- -
For geotechnical purposes, it is considered to be located in the upper parts of Huelva, on granular material. The foundation is of the shallow type.
- -
The damping of any structure depends on the vibration modes. However, the hypothesis that all modes respond with the same damping ratio is adopted, which is set at 5% for the structure.
- -
For steel reinforcements, the recommendations of the Eurocode (EN-04) [
33] have been considered.
The minimum strength of reinforced concrete currently permitted is H-25. However, it is known that these buildings were constructed with concrete equivalent to today’s H-17.5, typical of older, more lax regulations. The concrete sections were not very ductile, with large edges in the beams and not very much reinforcement. When these buildings were refurbished, attempts were made to bring them up to current regulations with various reinforcements. These reinforcements were not taken into account.
For modelling the behaviour of the fibre, and of interest for the formation of plastic hinges, an elasto-plastic model from the “Japan Concrete Standard Specification Model”, was used because of its suitability for studying the seismic performance of structures. A hysteretic-type model was used for the concrete [
34]. The fibre behaviour of steel bars was modelled using a bilinear elastic model [
11,
33].
In
Figure 3, it is shown the finite element discretised model, the result of previous considerations. The discretisation has been carried out with finite elements of 1 m per structural element. The reference node, both for the comparative analysis and for the displacement imposition in the pushover analysis, is the central node of the floor slab of the top floor (highlighted in red in
Figure 3).
Determining the natural vibration frequency of a building, which depends on its stiffness, distribution, and total mass, requires the consideration of self-weight and other loads, both structural and non-structural, in this dynamic analysis. For these and other loads, the Spanish regulation CTE-DB-SE-AE [
35] has been considered. For the geotechnical characteristics of the soils, values from local geotechnical studies and the Spanish regulation CTE-DB-SE-C [
32] have been considered.
2.3. Response Spectrum Analysis
This method is based on the combination of the excitations of each vibration mode of the structure. The response spectrum with the parameters from the previous section is used. With this method, maximum displacements in X and Y for seismic loading are analysed using the Finite Element Moment (FEM) defined in the structural model. Once the response spectrum type is defined, different loads are assigned. The contribution of each vibration mode must be considered for each case (X or Y axis). The NCSE-02 standard specifies that at least all modes with periods greater than TA must be considered. The response spectrum characteristic period TA is dependent on the contribution coefficient (K) and the geotechnical characteristics of the ground. It is determined in accordance with NCSE-02. According to modal analysis, the structural model with FEM ultimately employed the first six modes to ensure movement of at least 93% of the mass. Regarding the combination rule of the results for different modes, generally, the maximum response is not aggregable through arithmetic summation. The square root of the sum of squares rule, which is a geometric sum, was used.
The different modes of vibration, are affected by the adopted damping ratio. This value is theoretically not constant, it varies according to the mode of vibration, mass and stiffness. If the mass and stiffness of the structure are maintained, it can be taken as constant. The modes of vibration which move most of the mass will be affected by the adopted damping ratio, but will vary according to the considered axis X or Y.
The influence of ductility on the modification of the seismic response spectrum has a significant influence on the response of the structure according to the spectral superposition model. As can be seen, the difference in ductility is the most evident. A structure with higher ductility will have a higher damping and, therefore, better earthquake behaviour. Deformations will be smaller, and stresses will be lower. Additionally, the ductile behaviour of the structure will be varied to check its effect on displacements. Ductility will be varied through the elastic response spectrum. Regarding ductility, it can be varied either according to the option allowed by NCSE-02, which defines a ductility behaviour coefficient (μ) that affects the components of the acceleration vector, depending on the vibration mode and degree of freedom, or as in the present analysis, affecting ductility by varying the viscous damping ratio (χ).
In the model implementation, a seismic response spectrum according to the location, NCSE-02 standard, and current Eurocodes applied in Spain [
29] will be adopted. The site parameters, corresponding to the design of the current structure for a residential building of the considered type, are
ac/g = 0.10 m/s
2 and a contribution coefficient
K = 1.3 [
35]. The current required value for the structure at the considered location is
ac/g = 0.13 m/s
2 [
11]. However, the structure was not renovated according to this value, so the previous value was considered.
It was determined that the spectrum parameters for spectral modal analysis are
TA = 0.208 s,
TB = 0.832 s, and
TD = 2 s (in accordance with [
32]), where
TA and
TB are the characteristic response periods of the structure, and
TD is the value that defines the start of the response spectrum range in which displacement begins to be constant. It is defined by the Eurocode EC-8(2004) [
36]. Load combination was carried out according to a concrete structure in compliance with the Spanish structural code standard (CE) that implements Eurocode recommendations [
32,
35]. Particular attention was paid to the superposition of accidental actions, including the seismic effect.
2.4. Non-Linear Dynamic Analysis
Unlike spectral modal analysis, in this case, although it is also a dynamic method, both linear and nonlinear behaviour of the structure can be considered. The first thing established is the value of the time increment (ΔT) to evaluate the temporal response. This time increment is called the time step. This value should not be confused with the time interval set in the measurement of an analytical accelerogram. By chance, the time step coincides with the time interval of the accelerogram of the 2011 Lorca earthquake that has been used, but they are different concepts. For the choice of the time step, a ΔT = 0.005 s has been adopted, which is an approximate value of 1/20 of the highest frequency of the studied periods—in this case, the first 6: (1/20)·8.6447 = 0.0057 ≈ 0.005 s. It is necessary to set the time it takes to enter the load and how long the load will last. 2.5 s has been adopted as the total load entry time—a short time that can generate dynamic overload, and 50 s as the load duration time. The load duration time must be at least longer than the duration of the accelerogram—in this case, that of the 2011 Lorca earthquake, from which the most important 35 s are extracted. Then, more time is added than the analysis period lasts, as the structure will continue to vibrate even after the earthquake ends—for a certain time.
For this analysis, the accelerogram of the 2011 Lorca earthquake has been used [
31]. The complete accelerogram has been available, although the analysis has focused on the most important time part, the 20 s, with the highest acceleration values, both in the north-south and east-west directions. Checking the Mercalli scale [
37], according to the accelerogram with proper treatment, it corresponds to VIII on that scale, coinciding with some publications on the subject [
38]. The time interval of this accelerogram is 0.005 s. The north-south direction is by far the one that presented the highest acceleration. There are significant differences. The north-south direction is by far the one with the highest acceleration. It is also the one that produces the highest stress and displacement results.
2.5. Pushover Analysis
The incremental pushover analysis is one of the techniques used to assess seismic action on structures [
22,
23]. Unlike the previous methods, such as modal spectral and non-linear dynamic analysis, which typically do not delve deeply into local aspects of the structure, pushover analysis is more oriented towards studying potential local damage, overall behaviour, or collapse of the structure. While modal spectral analysis allows for obtaining displacements and stresses, pushover analysis is more suitable for studying the formation of plastic hinges. It is essentially a static method, albeit nonlinear. This method is included in Spanish regulations as well as in the Eurocode [
11,
33]. The synthetic process is as follows: the structure is analysed under constant gravitational loads and horizontally applied loads that progressively increase, representing a seismic action component. Nonlinear mechanical behaviour due to material properties and geometric nonlinearity due to second-order effects must be considered in this method. According to Spanish regulations, this procedure should be used as a complement to the previous methods, not independently. The increment steps (nstep) adopted is 100. The P-delta effect has been considered [
39]. For the formation of plastic hinges in beams and columns, a skeleton curve has been adopted in accordance with the Eurocode 8 standard (EC8). The summarized objectives include (i) estimation of plastic hinges, (ii) estimation of subsequent displacements, and (iii) determination of demand and capacity curves (horizontal elastic spectrum type for type B terrain has been used in accordance with EC8).
3. Results and Discussion
3.1. Spectral Modal Analysis
After the eigenvalue analysis, the main vibration modes were determined, which can be seen in
Table 1.
Six main modes are identified, covering 93% of the total moving mass. Specifically, modes one on the
X-axis and two on the
Y-axis are of particular interest. These findings show the importance of these modes in structural analysis, highlighting their relevance for the accurate understanding and prediction of the dynamic behaviour of buildings, i.e.,
Figure 4.
After performing the modal analysis, a modal superposition was carried out, as previously discussed in the materials and methods section. For a viscous damping ratio of 5%, displacement values were obtained, both in the
X-axis, as shown in
Figure 5A and in the
Y-axis, as shown in
Figure 6A. On the
X-axis, the highest displacement occurred on the roof surface, with a value of 1.9452 cm, and for the
Y-axis, it was 1.9142 cm.
For a high ductility (25%), the obtained values were: for X = 1.1232 cm (
Figure 5B), and for Y = 1.1053 cm (
Figure 6B).
The most notable difference in the presented results lies in ductility. A structure with higher ductility will exhibit superior damping, resulting in more efficient behaviour during seismic events. In this regard, displacements will be reduced.
3.2. Non-Linear Dynamic Analysis Application
In the non-linear dynamic analysis, after applying the accelerogram corresponding to the 2011 Lorca earthquake, significant displacements were generated, as shown in
Figure 7. In the
X-axis (
Figure 7A), a displacement of 2.55 cm was recorded, exceeding the results obtained in the previous non-linear dynamic analysis. Similarly, in the
Y-axis (
Figure 7B), a notable deformation of 5.22 cm was observed, being a considerably high value.
The Lorca earthquake, characterised by its highest accelerations in the north-south direction, represents the so-called strong direction of the event, with striking results. In this direction, a displacement exceeding 5 cm is observed, highlighting the magnitude of the phenomenon.
Regarding the stresses, when analysing the Y direction, which corresponds to the strong direction of the earthquake, as illustrated in
Figure 8, significant loads and tensions generated by the seismic event can be appreciated.
The basal pillars record flexural moment values exceeding 771 kN·m. Regarding the shear stress in the Z direction, it is depicted in
Figure 9, illustrating the non-linear dynamic analysis of the discretised FEM during the Lorca earthquake in the north-south direction, focusing on the shear moment in Z.
The shears in the basal pillars reach approximately 392 kN. Based on the results presented, the shear stresses in the basal columns and the bending moments in the central columns are key factors influencing the seismic response of structures during high-intensity earthquakes. The shear and longitudinal reinforcement is imposed by the basal columns. Reinforced concrete structures are expected to suffer severe damage, although this will depend on the type of stress and location in the structure. Bending moments in the central columns can contribute to facilitating a failure of global stability by buckling in the structure. In addition, the P-delta effect can have an adverse effect by facilitating the formation of plastic hinges [
39].
Regarding the flexural moment in the Z direction, it is depicted in
Figure 10, showing the non-linear dynamic analysis of the discretised FEM during the Lorca earthquake in the north-south direction, focusing on the flexure in Z.
The flexural moments in the central pillars reach approximately 1322 kN·m. This notably high value is significant for a pillar within a building of this height.
3.3. Pushover Analysis
To carry out the pushover analysis, first, the reference node is fixed, as illustrated in
Figure 3. Then, the direction of displacement is established, which varies depending on the considered action. It is crucial to use enough time for the analysis, 100 in this case. Additionally, the vibration mode corresponding to the specified direction is selected. As the assigned loads increase at each time step, the formation of plastic hinges in the FEM is observed. Upon solving the case, the relevant results are obtained.
For this analysis, a pushover based on the results obtained from earlier analyses is performed. It was determined that the maximum displacement, according to the non-linear dynamic analysis of the Lorca earthquake, was 5.22 cm. In the inverse approach employed, a sufficiently large displacement was applied to evaluate the gradual formation of plastic hinges. In the present case, a displacement of 25 cm was imposed for time step 100. However, it was observed that by step 22, approximately 100 plastic hinges had already formed (
Figure 11A), spanning across all floors of the building.
With the presence of over 100 plastic hinges, it is difficult not to contemplate the imminent collapse of the structure. The impact of an earthquake like that of Lorca on the analysed structure would have been devastating. The pushover analysis, as observed, offers numerous possibilities. It allows for the progressive formation of plastic hinges to be detected as loads increase at each time step. Additionally, it provides valuable information about structural stresses. For example, even after the structure is assumed to have collapsed, in step 63, numerous plasticisations are evident (
Figure 11B).
In step 63, collapse seems inevitable. The entire structure is fully yielded, with the bases of the pillars affected and plastic hinges collapsed between floors 2 and 3. However, there is doubt as to whether the structure would have reached this point without collapsing previously. It is worth noting that this step corresponds to an imposed deformation of 15.75 cm.
3.4. Comparison of the Three Methods
This section presents a comparative analysis of three methods. It is important to consider the suitability of each method for different purposes. The response spectrum is commonly used in the design phase, while nonlinear dynamic analysis and pushover analysis are used for verification purposes. An integrated approach, as described in
Section 2.1, can also be used with the aforementioned nuances.
Each of the three methods has applications in various contexts, each with its advantages and disadvantages. The advantages and disadvantages of spectral modal analysis, non-linear dynamic analysis, and pushover analysis differ in terms of computational cost, precision, and applicability. These terms should be understood as the calculation time using the same structural model, equipment and software tool; the adequacy of the model’s response to reality; and the ease or difficulty of applying the model and/or accessing the necessary information. Therefore, in no case should one method be discarded or preferred over another, as each has its own context of suitability. Although absolute terms cannot be established due to variability in computer tools, structures, types of FEM discretisation, required precision, imposed time steps, and other factors, it is possible to identify some relative advantages and disadvantages for the same site and structure:
- -
Spectral modal analysis does not require the availability of an accelerogram, allowing for analysis using an elastic response spectrum. However, certain site parameters, such as maximum ground acceleration, among others, need to be known.
- -
Spectral modal analysis has lower computational cost compared to non-linear dynamic analysis and pushover analysis. However, in terms of precision, its results may be more limited.
- -
Non-linear dynamic analysis offers a precise dynamic representation of the structure, which is ideal for vibration studies and dynamic responses. However, it typically requires higher computational cost and the availability of suitable accelerograms, as well as an appropriate time interval to increase precision.
- -
Pushover analysis allows for nonlinear analysis of the structure, accurately detecting the formation of plastic hinges under imposed displacement. It is crucial to have an adequate number of time steps for a maximum imposed displacement and, therefore, achieve the desired precision.
- -
The results obtained for spectral modal analysis (with a 5% damping ratio and high ductility) and non-linear dynamic analysis for the 2011 Lorca earthquake are presented in
Table 2, corresponding to the reference node.
All analysed methods (spectral modal, non-linear dynamic analysis, and pushover analysis) require prior eigenvalue analysis to obtain the vibration modes of the structure, which is essential for successfully and accurately conducting subsequent analyses.
4. Conclusions
The use of different structural analysis methods, such as modal spectral analysis, non-linear dynamic analysis, and pushover analysis, provides a comprehensive understanding of the structure’s behaviour under seismic loads. Eigenvalue analysis is essential for all subsequent analyses, including pushover analysis. The choice of time step, both for non-linear dynamic analysis and pushover analysis, significantly impacts the accuracy of the results.
Modal spectral analysis offers an efficient alternative in terms of computational resources, although input parameters must be carefully considered to obtain consistent and representative results. Without computational limitations, however, truly dynamic methods, such as non-linear dynamic analysis analysis, are preferred.
The application of the pushover analysis allows for the evaluation of the structure’s nonlinear behaviour. Furthermore, it provides detailed information on the formation of plastic hinges and potential collapse. All of this is modelled by imposing cumulative displacement for different time steps.
For the specific case analysed, it is concluded that the studied structure would be vulnerable to a seismic event like the 2011 Lorca earthquake, with a maximum deformation at the reference node of 5.22 cm, emphasising the need to implement appropriate reinforcement measures and seismic design to enhance its resistance and responsiveness to such events. To accurately detect this collapse, an analysis integrating pushover analysis with previous spectral and non-linear dynamic analyses has been implemented. The practical implications of this research could be useful for other case studies. The presence of numerous buildings designed with outdated seismic codes suggests the need for a structural review. In such cases, it is advisable to incorporate the three analysed methods.


 ,
, 


