Article

Impact of Latency on QoE, Performance, and Collaboration in Interactive Multi-User Virtual Reality

1
IDLab, Department of Information Technology (INTEC), Ghent University-imec, 9052 Ghent, Belgium
2
eMedia Research Lab, Department of Electrical Engineering (ESAT), KU Leuven, 3000 Leuven, Belgium
3
Huawei Technologies, 80992 München, Germany
*
Author to whom correspondence should be addressed.
Appl. Sci. 2024, 14(6), 2290; https://doi.org/10.3390/app14062290
Submission received: 29 January 2024 / Revised: 4 March 2024 / Accepted: 6 March 2024 / Published: 8 March 2024
(This article belongs to the Special Issue Virtual Reality and Human-Computer Interaction)

Abstract

:
Interactive, multi-user experiences are meant to define the present and future of Virtual Reality (VR). Such immersive experiences will typically consist of remote collaborations where content is streamed and/or synchronized over a network connection. Thus, real-time collaboration will be key. In this light, the responsiveness of the system and the network will define the overall experience. As such, understanding the effect of network distortions, especially related to time delay, on end-user’s perception (in terms of Quality-of-Experience (QoE)), performance, and collaboration becomes crucial. The existing literature, however, has mostly focused on network requirements from a system point-of-view, where the key performance parameters are only provided in the form of Quality-of-Service (QoS) parameters (such as end-to-end latency). However, the translation of these network impairments to the end-user experience is often omitted. The purpose of this paper is to fill the gap by providing a thorough investigation of the impact of latency on the perception of users while performing collaborative tasks in multi-user VR. To this end, an experimental framework was designed, developed, and tested. It is based on a multi-device synchronizing architecture, enabling two simultaneous users to work together in a gamified virtual environment. The developed test environment also allows for the identification of the most prominent network requirements and objective analysis for each traffic link. To experimentally investigate the impact of latency on user perception, a user study was conducted. Participants were paired and asked to perform the collaborative task under different latency-prone scenarios. The results show that users are able to easily distinguish between distorted and non-distorted network configurations. However, making a distinction between different manifestations of latency is much less straightforward. Moreover, factors such as the user’s role in the experience and the required task, and the level of interactivity and movement have an important influence on the subjective level of perception, the strength of the user’s preferences, and the occurrence of cybersickness. In contrast, no significant differences in objective metrics, such as system performance and user completion time were observed. These results can support the creation of collective QoE metrics that model the group as a whole rather than each individual separately. As such, this work provides an important step to dynamically counteract any drops in group dynamics and performance by means of smart interventions in the transmission system and/or virtual environment.

1. Introduction

Multi-user, collaborative Virtual Reality (VR) has the potential to shape the next generation of collaborative applications. Due to its immersive and interactive nature, it is already applied in a number of societal and economical sectors, such as gaming and entertainment, industry [1], (mental) healthcare [2], and VR training [3]. These collaborative immersive experiences typically incorporate elements of skill acquisition, team building, exploration, entertainment, etc. Moreover, due to its virtual essence, it can be easily employed in cases where the real-life counterpart is either too dangerous, too expensive, too time-consuming, or too difficult to realize.
In its most common configuration, a collaborative multi-user VR experience consists of a minimum of two users wearing a pair of head-mounted displays (HMDs) connected to a remote (virtual) environment. There they can collaborate to perform a certain task. The content is streamed and/or synchronized over the network. This means that the performance and satisfaction of the participants will be highly dependent on the quality of the network they are connected to. In fact, the dynamicity of the network can result in distortions, such as delay, stalling, visual artifacts, and desynchronizations, which may affect the end-user’s experience, interactivity, performance, and collaboration in unexpected ways [4,5]. However, the impact of networks on the performance and experience of users of a collaborative VR setting remains largely unexplored [6].
Related work on collaborative VR has, in most cases, focused on pure server-client architectures (e.g., Furion [7], Flare [8]), where all content is rendered on the server-side, after which the resulting video stream is sent over the network to the client. These often result in stringent network requirements (Table 1), such as downlink throughputs of 400 to 600 Mbps [9], latency in the 5–20 ms range [9,10], and below 15 ms round-trip times (RTTs) [11]. Other architectural solutions exist though, in which the server is used more as a mediator for the transportation of synchronization messages between virtual environments being rendered locally at the client, therefore putting much lower pressure on the network [12]. In addition, the motivation for these reported requirements in relation to the end-user’s perception, performance, and well-being is often limited.
The existing literature that tries to address this problem is mainly focused on standard, uniform latency (i.e., delaying every network packet with a certain amount of time) [4,5,13,14,15,16]. However, burst latency (in which the communication channel becomes saturated and is, therefore, blocked for a given time interval) is at least as common as traditional latency when it comes to typical multi-user VR traffic. Nevertheless, it is rarely reported in the literature, especially in the context of multi-user applications. This context is important though, given existing research on user perception in multi-user VR. This seems to point to the fact that multi-user environments tend to induce a higher latency threshold when it comes to user acceptance than is the case for single-user systems. The latter seems to be especially true when a clear gamification and/or collaborative aspect is tied to the experience. Therefore, it would be a valuable addition to the literature to extend these studies beyond uniform latency as well as to broaden subjective evaluations to other aspects than only user perception and acceptance, such as user performance, collaboration, subjective time perception, and cybersickness.
To fill the gap, this work aims to provide a thorough investigation of the effects of latency on the performance and perception of users of collaborative VR. Starting from the lessons learned from our previous work [12], an experimental framework for multi-user collaborative VR was designed and developed. This framework enables two simultaneous users to work together in a gamified, collaborative VR environment. In it, the two users are put in charge of baking a pizza in a virtual kitchen. To this end, a sequence of tasks (e.g., passing of objects, utilizing virtual tools, pressing buttons) must be completed collaboratively to successfully reach the final objective. This use case has been designed such that it incorporates the three main task types in collaborative VR, following the taxonomy of Pérez et al. [17]: deliberation, exploration, and manipulation. In addition, the framework allows for controlling different network-related parameters in the ongoing experience. For this work, we focused the analysis on latency (average and burst) due to its strong impact on interactivity. The impact analysis was performed by means of both objective as well as subjective measurements. On the one hand, the framework enables the identification of the most prominent network requirements to enable such a system and to objectively analyse the user performance. On the other hand, a user study is conducted evaluating the influence of uniform and burst latency on end-user Quality-of-Experience (QoE) (i.e., perception of latency, jerkiness, and de-synchronizations), performance and collaboration, subjective time perception, and the occurrence of cybersickness in a multi-user virtual environment. The results show that users are able to easily distinguish between distorted and non-distorted network configurations, but that making a distinction between different types of distortions is much less straightforward. This suggests that for multi-user VR systems too a perception threshold for both latency and burst seems to exist, which will need additional refinement through further experimentation. Furthermore, the user’s role in the experience and its tasks, interactivity, and movement are shown to have an important influence on their subjective opinions. As such, gaining more in-depth understanding of the influence of these contextual factors would help VR designers and content providers to objectively and in (near) real-time monitor and counteract occasional drops in end-user QoE.
The remainder of this paper is structured as follows: Section 2 provides an overview of relevant related research on (multi-user) VR systems. In Section 3, the architecture of the adopted system is discussed and the experimental methodology is presented. Section 4 gives an overview of the obtained results in terms of objective system performance and user testing results. Finally, Section 5 provides a brief overview of the main conclusions of this work.

2. Related Work

In this section, an overview is provided of relevant studies regarding the influence of network latency on user experience and performance in immersive media. As studies on multi-user experiences are still scarce in the literature, especially with respect to VR, a set of relevant single-user systems will be discussed first. Afterwards, the connection with multi-user systems is considered. Please note that all mentions of the Mean Opinion Score (MOS) refer to a 1–5 scale, with 1 the lowest- and 5 the highest-rated experience.

2.1. Single-User Experiences

Waltemate et al. [18] provided a systematic evaluation of different levels of delay across a variety of perceptual and motor tasks during full-body action inside a Cave Automatic Virtual Environment (CAVE). To this end, participants were presented with their virtual mirror image, which responded to their actions with delays ranging from 45 to 350 ms. The impact of these delays on motor performance, sense of agency, sense of body ownership, and simultaneity of perception was measured. In addition, interaction effects between these variables were analyzed to identify possible dependencies. The results showed that motor performance and simultaneity perception were affected by latency above 75 ms. In addition, it was observed that the sense of agency and body ownership never broke down completely despite significant delays. However, they started declining at a latency higher than 125 ms, and deteriorated for a latency greater than 300 ms. Interestingly, participants perceptually inferred the presence of delays more from their motor error in the task than from the actual level of delay. Whether or not participants notice a delay in a virtual environment might, therefore, depend on the motor task and their performance rather than on the actual delay. Although not directly related to network distortions, this study, therefore, provides interesting insights in subjective delay perception in virtual environments.
Caserman et al. [19] explored the effect of increased end-to-end latency in immersive single-user VR applications. To this end, three tasks were developed: (1) a searching task in which the user had to find circular targets (platforms), spawned on the ground in one of three corridors; (2) a reaching task where a user needed to touch a cube appearing in a virtual scene; and (3) an embodiment task in which users had to observe themselves in a virtual mirror. The three tasks were used to study the influence of latency on cybersickness, user performance (completion time and error rate), and the sense of body ownership, respectively. The results showed that an end-to-end latency above 63 ms induced significant cybersickness symptoms. In addition, user performance decreased with increasing delay, and with end-to-end latency above 69 ms, the users needed significantly longer to complete the task. The results also showed that end-to-end latency affected body ownership significantly later, namely, not until 101 ms.
Brunnström et al. [20] presented a VR simulator of a forestry crane used for loading logs onto a truck. In their study, the authors focused specifically on the effects of latency on the subjective experience, with regards both to delays in the crane control interface as well as the lag in the visual scene rendered in the head-mounted display (HMD). To this end, a subjective study was performed in which the delay to the display update and to the joystick signals was controlled. The results showed significant effects on comfort quality and immersion quality for higher display delay (30 ms), but a very small impact of joystick delay. Furthermore, the display delay exerted a strong influence on the occurrence of cybersickness, causing test subjects to decide not to continue with the complete experiments. This was shown to be connected especially to the longer added display delays (≥20 ms).
In a follow-up study, similar results were observed, as a strong effect of latency in the display update and a significant negative effect of 800 ms added delay on latency in the hand controller were found. The results on cybersickness showed significantly higher scores after the experiment compared to before the experiment, although a majority of the participants reported experiencing only minor symptoms. Some test subjects ceased the test before finishing due to their symptoms, particularly due to the added latency in the display update.
Concannon et al. [21] sought to understand the impact of network delay on a user’s QoE whilst interacting with a VR application. To this end, a virtual environment was created in which the user interacted with a virtual representation of a Fanuc injection molding machine. To evaluate QoE, a user study with a between-subjects design was performed in which the participants had to carry out a basic, beginner-level operation task on the Fanuc in a virtual reality environment under both subjective and objective evaluation. The results suggested that although the participants experienced a mild drop in QoE as a result of network delay, they tolerated delays up to 3000 ms with no significant deterioration in the perceived usability of the virtual environment.
Finally, Larsson et al. [22] evaluated the effects of RTT and packet loss on user QoE in a streamed VR game. To this end, the game Serious Sam VR: The Last Hope was chosen for use in a user study. A total of 28 different network conditions with varying values of RTT and packet loss were evaluated. The subjective results suggested that RTTs of 75 ms and below yielded a good user MOS, while RTTs up to 175 ms gave an acceptable MOS of 3. A packet loss of 6% and below gave a good user MOS, while 12% and above resulted in unacceptable MOS degradation.
Roth et al. [23] investigated whether latency tolerances for modern, off-the-shelf VR systems were similar to those for more outdated hardware and software. In addition, they researched the effect of increasing and decreasing the latency on such tolerances. To this end, participants were positioned in a virtual environment consisting of a sparsely furnished model of the lab space where the experiment took place. In it, the participants sat in a swiveling desk chair and were asked to rotate themselves side-to-side in time with the tone of a digital metronome set to 50 BPM. Five levels of latency were investigated, ranging from 0 to 4 frames (0–44 ms). Users were asked to indicate whether or not they believed artificial latency was introduced in the scene. The results showed that the relative difficulty of detecting latency increased up until a certain point (18.81 ms) only to decrease again when the artificially induced latency was pushed higher.

2.2. Multi-User Experiences

Vlahovic et al. [4] presented a user study on the effects of network latency on user experience (QoE, willingness to continue, and performance) in a first person shooter VR multiplayer game. Their results showed that user experience for the chosen game began to suffer in cases of latency greater than approx. 100 ms (round trip time between client and server).
Kojic et al. [5] investigated how different levels of delay influenced overall QoE in VR multiplayer ‘exergames’ (exercising and gaming). Their experimental setup consisted of a VR application coupled with a rowing ergometer, allowing races between the user and an artificially created opponent that followed the player with a similar speed, keeping the race tight. To investigate the influence of the delay on both the user’s and opponent’s side, three levels of network delay were introduced (30 ms, 100 ms, and 500 ms), mixed fully with the different conditions. After each session, participants rated the perceived flow, sense of presence, and the degree to which they noticed the delay in their or the opponent’s system. Interestingly, the results showed different perceptions of the delay and QoE depending on the user’s own delay. The participants perceived the opponent’s player as being delayed even if only the player itself had a network delay, along with a significantly lower rating of QoE only when their delay was high. Regarding the perception of their own delay, only for the 500 ms case was a strong impact on QoE recorded.
Venkatraman et al. [13] presented a 3DTI tele-rehabilitation system in which two collaborators needed to keep a balancing bar as horizontal as possible while doing bicep curls with the hand holding it. They used this environment, among other things, to perform a user study to evaluate the effect of induced latency on the task completion time, the number of corrections, and the consistency between the two user environments. Their results showed that each of the three measurements increased with increasing latency. They identified the operating range of the system, i.e., the range of latency for which the system offered acceptable QoE, for the visual aspect to be 0–130 ms.
Kusonose et al. [14] presented a haptic-enabled two-user networked air hockey game. A subjective user study was performed to assess the influence of network latency on perceived interactivity and quality. Their results showed that both deteriorated more seriously with increasing latency. Nevertheless, the impact on quality was observed to be more severe with their corresponding MOS, dropping below 3 for a 100 ms delay, even in the most optimal scenario.
Sithu et al. [15] carry out a QoE assessment of operability and fairness between players in a two-player networked real-time balloon-bursting game. To this end, latency was varied from 0 to 500 ms for both players. Their results showed that the operability mainly depended on the level of network delay, with subjective scores dropping below 3 for all cases for a latency of 300 ms and beyond. It is important to note, however, that the context of the game, i.e., soft vs. hard and small vs. standard balloons, played an important role in this. The differences between the best- and worst-appreciated balloon type often exceeded a full point on the 1–5 MOS scale.
Roberts et al. [24] compared the true end-to-end latency across an immersive virtual environment and a video conference link. This was realized by filming the movements of a participant and their remote representation through synchronised cameras. They recorded a mean end-to-end delay of 605 ms from the contemporary to the traditional immersive display and a delay of 414 ms the other way around.
Becher et al. [16] investigated the negative effects of network latency in immersive collaborative environments by conducting a user study to assess its impact on user performance. To this end, a cooperative game was designed in which users had to place bicolored cubes into their specific destinations. An element of visual and verbal information change was added as users could only see the cube colors of their collaborators. Each pair of users played four playthroughs of the game, each time with a different latency configuration (0 ms, 150 ms, 300 ms, 450 ms). The results showed that high end-to-end latency between two VR clients had adverse effects on user performance, mutual understanding between collaborators, and perceived workload. For feelings of co-presence, however, no significant correlation with the network latency was observed.

2.3. Conclusions from literature

As can be seen from the above sections, a clear distinction can be made between what is considered an acceptable amount of latency in a VR system depending on whether a single-user or multi-user system is considered. Although values around 100 ms are often reported, these are shown to be more of an upper bound for single-user experiences when the set of related studies is surveyed. The opposite is true for multi-user systems though, with multiple studies indicating a latency between 300 to 500 ms to be acceptable from a subjective point-of-view. Note that the latter mainly refers to user perception and acceptance as other objective and subjective dimensions, such as user performance, measurements of presence, simultaneity, and cybersickness lead to other boundaries with regard to subjective evaluation. Unfortunately, few investigations have yet been completed to concurrently assess, evaluate, and compare these aspects in a single study. As such, the multi-user aspect of VR seems to make end-users somewhat more accepting of latency impairments. From the presented research, this also seems to relate to the presence of a gamification and/or collaborative aspect to the use case [5,15,16], as other use cases tend to show more stringent requirements [19,20].
In addition, it is also worth noting that all the studies mentioned primarily focus on traditional latency, i.e., delaying every network packet with a certain amount of time. However, burst latency (in which the communication channel becomes saturated and, therefore, blocked for a given time interval) is another common network distortion besides traditional latency that often arises in multi-user VR traffic.
Taking the above observations into consideration, we believe, therefore, that this work represents a valuable contribution to the existing literature by providing an experimental study evaluating the influence of uniform and burst latency on the end-user QoE (i.e., perception of latency, jerkiness, and de-synchronizations), performance and collaboration, subjective time perception, and the occurrence of cybersickness in a gamified, multi-user collaborative virtual environment.

3. Materials and Methods

This section first discusses the system architecture. Then, the experimental methodology that was followed in terms of the use case and testing procedure is described.

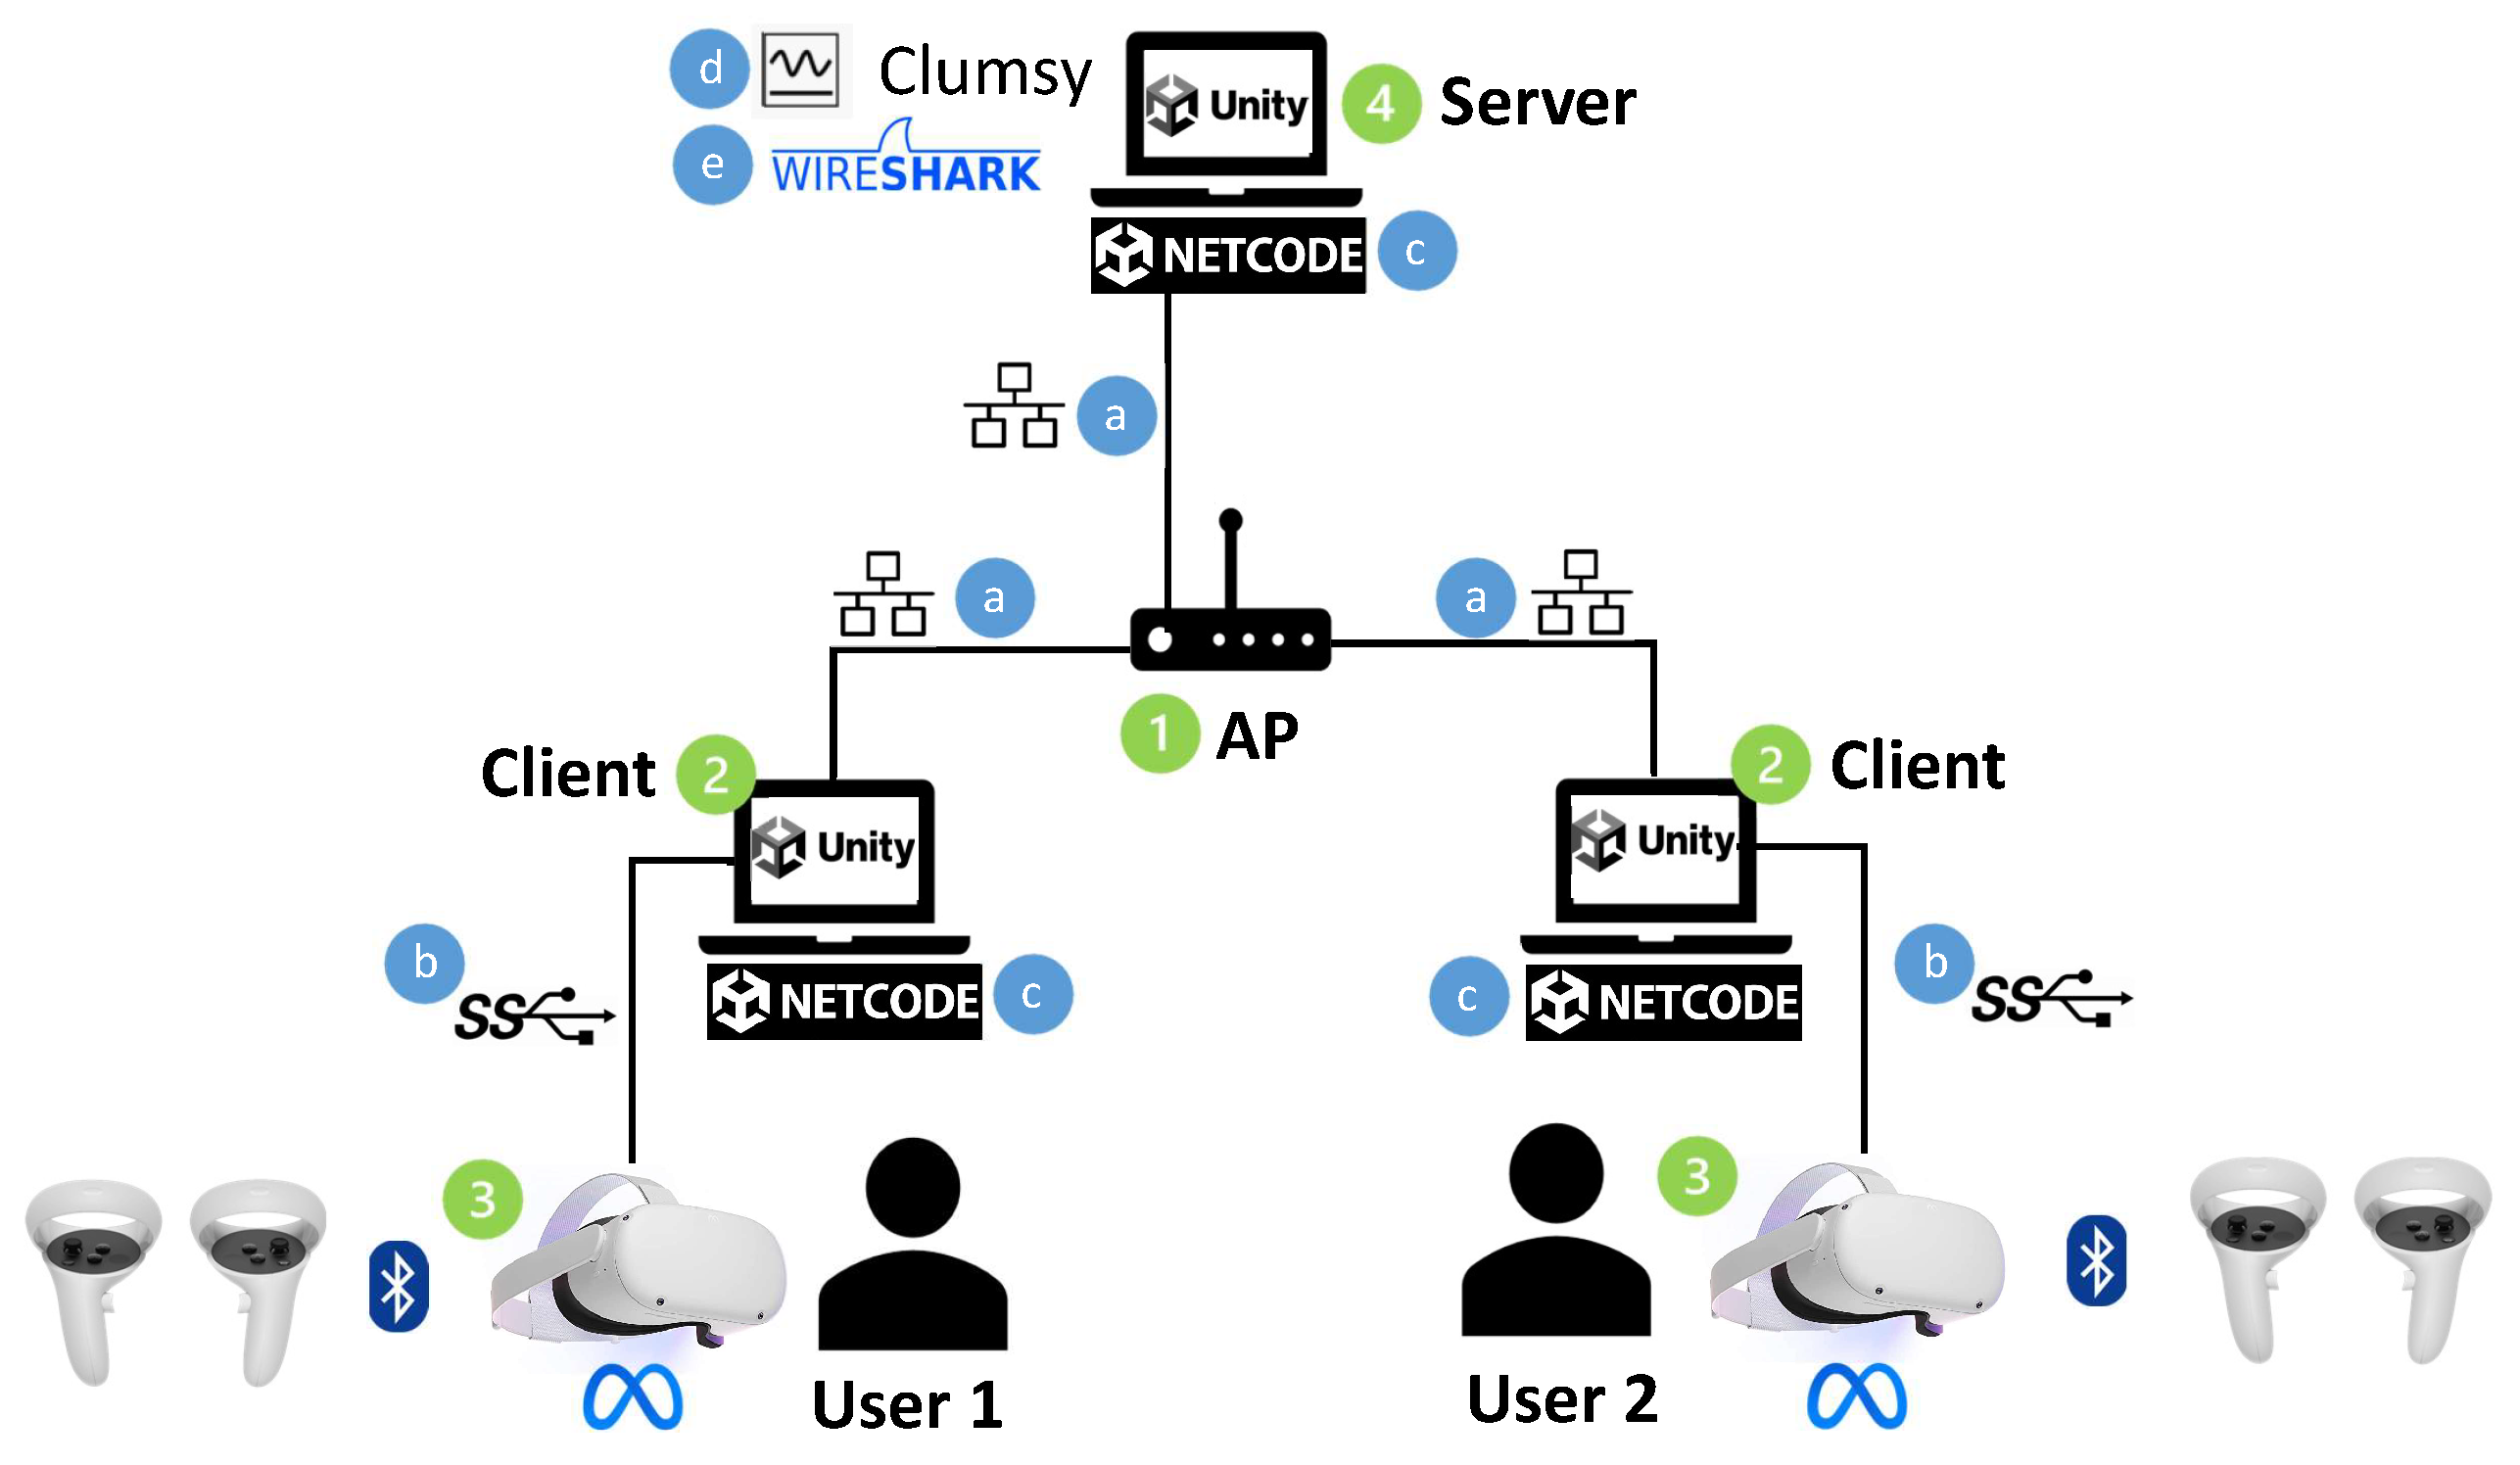
3.1. System Architecture

Figure 1 indicates the testbed architecture. The most important specifications of each component are summarized in Table 2. The architecture consists of two clients (2) and a server (4). The clients are two laptops (2) hosting a Unity environment in version 2021.3.17f1. These laptops are HP ZBook Studio 16 inch G9 Mobile Workstation PCs with 32 GB of RAM, a 12th Gen Intel(R) Core(TM) i7-12800H@2.4GHz CPU, and an NVIDIA GeForce RTX 3070 Ti@1.48 GHz Laptop GPU with 8 GB GDDR6 memory. The latter, i.e., the NVIDIA GPU, is required to enable communication and rendering to the Meta Quest 2 VR Headset (3). The server (4) is a Corsair Graphite 380T Portable Mini ITX with 16 GB of RAM, a 4th Gen Intel(R) Core(TM) i7-4790 @3.6 GHz CPU, and an NVIDIA GeForce GTX 980 Ti with 6 GB GDDR5 memory. The content inside the two client-side Unity environments (2) is synchronized, i.e., kept identical, via an additional Unity-instance running on this server (4), which is connected via a LAN over Ethernet (a) through a local access point (AP), being the DIR-809 D-Link AC750 dual band router (1). The Netcode for GameObjects (NGO)-package (c), specifically designed for Unity, is used to handle the networking aspect. This package provides networking capabilities to GameObject and MonoBehavior workflows and is interoperable with many low-level transports. Clumsy (d) is used for in depth in-going and out-going network control. It enables introducing artificial lag, packet drop, burst behavior, out-of-order and duplicate delivery, and tampering. Wireshark (e) runs on the server for further analysis of the network behavior. This is performed by logging the timestamp, the source and destination addresses, and the protocol and size of all incoming and outgoing network packets on the server-client Ethernet links (a). Note that as the measuring points for both incoming and outgoing traffic are situated on the server side, any artificial latency or burst being added to the system will cause outgoing, downlink traffic (server-to-client) to be stalled before transmission, while incoming, uplink traffic (client-to-server) is stalled after reception but before processing.
Afterwards, the corresponding log files are exported to .csv for further analysis in Python. Note that the Wireshark traces are made publicly available for each session, as indicated in the Data Availability Statement at the end of this paper.
Each of the users is provided with a Meta Quest 2 VR Head-Mounted Display (HMD) (3) to portray the visuals of the virtual environment to the users. This HMD, produced by Meta, runs the Android OS, and provides 6DoF tracking with an LCD resolution of 1832×, 1920 pixels per eye, and a refresh rate up to 120 Hz. It has 6 GB of RAM, a Qualcomm Snapdragon XR2 processor consisting of four Kyro 585 Silver@1.8 GHz, three Kyro 585 Gold@2.42 GHz and one Kyro 585 Prime@3.2 GHz CPU core and an Adreno 650@0.67 GHz GPU (1.2 TFLOPS). Its movement tracking is provided by a combination of sensors and cameras on the outside of the HMD. The integrated sensors are inertial measurement units (IMUs) that use an accelerometer, a gyroscope, and a magnetometer to track the position, velocity, and rotation of the HMD, which, combined with Simultaneous Localization And Mapping (SLAM) and Light Detection and Ranging (LiDAR), result in full 6DoF tracking. The Quest 2 is connected to the gaming laptop (2) by means of a USB 3.0 connection (b) provided by a specific Oculus Quest Link cable to maximize the available throughput (5 Gbps). This connection is used to stream the rendered Unity viewport to the headset and to send user movement (controllers and 6DoF movement of the HMD) back to the engine for updating the virtual environment.
This virtual environment is designed and implemented using the Unity engine. Unity was chosen because of its wide-ranging functionalities essential for creating VR environments, including a rich asset store. Unity’s capability in physics simulation, including the precise emulation of gravity effects and collision dynamics, plays a pivotal role in creating an engaging virtual environment which it was aimed for. As such, it is a popular choice in multiple VR studies [5,7,11,12]. In this Unity configuration, the tick rate was set to 60. This parameter specifies that the system processes incoming data and renders the virtual environment at a rate of 60 frames per second, corresponding to frame updates approximately every 16 milliseconds. This rate seems sufficient since the developed game does not necessitate rapid movement responses. In addition, 60 fps is considered to be a sufficiently large frame rate for VR experiences not to influence end-user perception [7,10,25]. Moreover, the object transform interpolation was activated for each object whose position and orientation are shared across the network, following the default configuration of Unity NGO. This entails a gradual transition of objects to their server-reported positions over time, rather than immediate and abrupt adjustments. Employing this technique, or similar ones that are common in game development, enhances user experience by ensuring smoothness. This approach helped prevent the introduction of negative bias towards the game quality, thereby allowing us to assess the impact of network disruptions in a manner akin to real-world experiences. In addition, to guarantee the synchronization of environments between users, an authoritative server model was adopted, as advised by the Unity NGO documentation, to regulate the transformations and orientations of objects. This framework ensures that any modifications within the game’s environment must receive prior verification and authorization by the server upon a client’s request. Following such validation, the server broadcasts the approval of the changes to all clients, thereby preserving uniformity among users.

3.2. Experimental Methodology

This section describes the experimental methodology followed in this study. First, a description of the adopted use case is provided. Next, the independent variables are discussed, followed by an overview of the objective and subjective evaluation methodology. Finally, the experimental flow is presented.

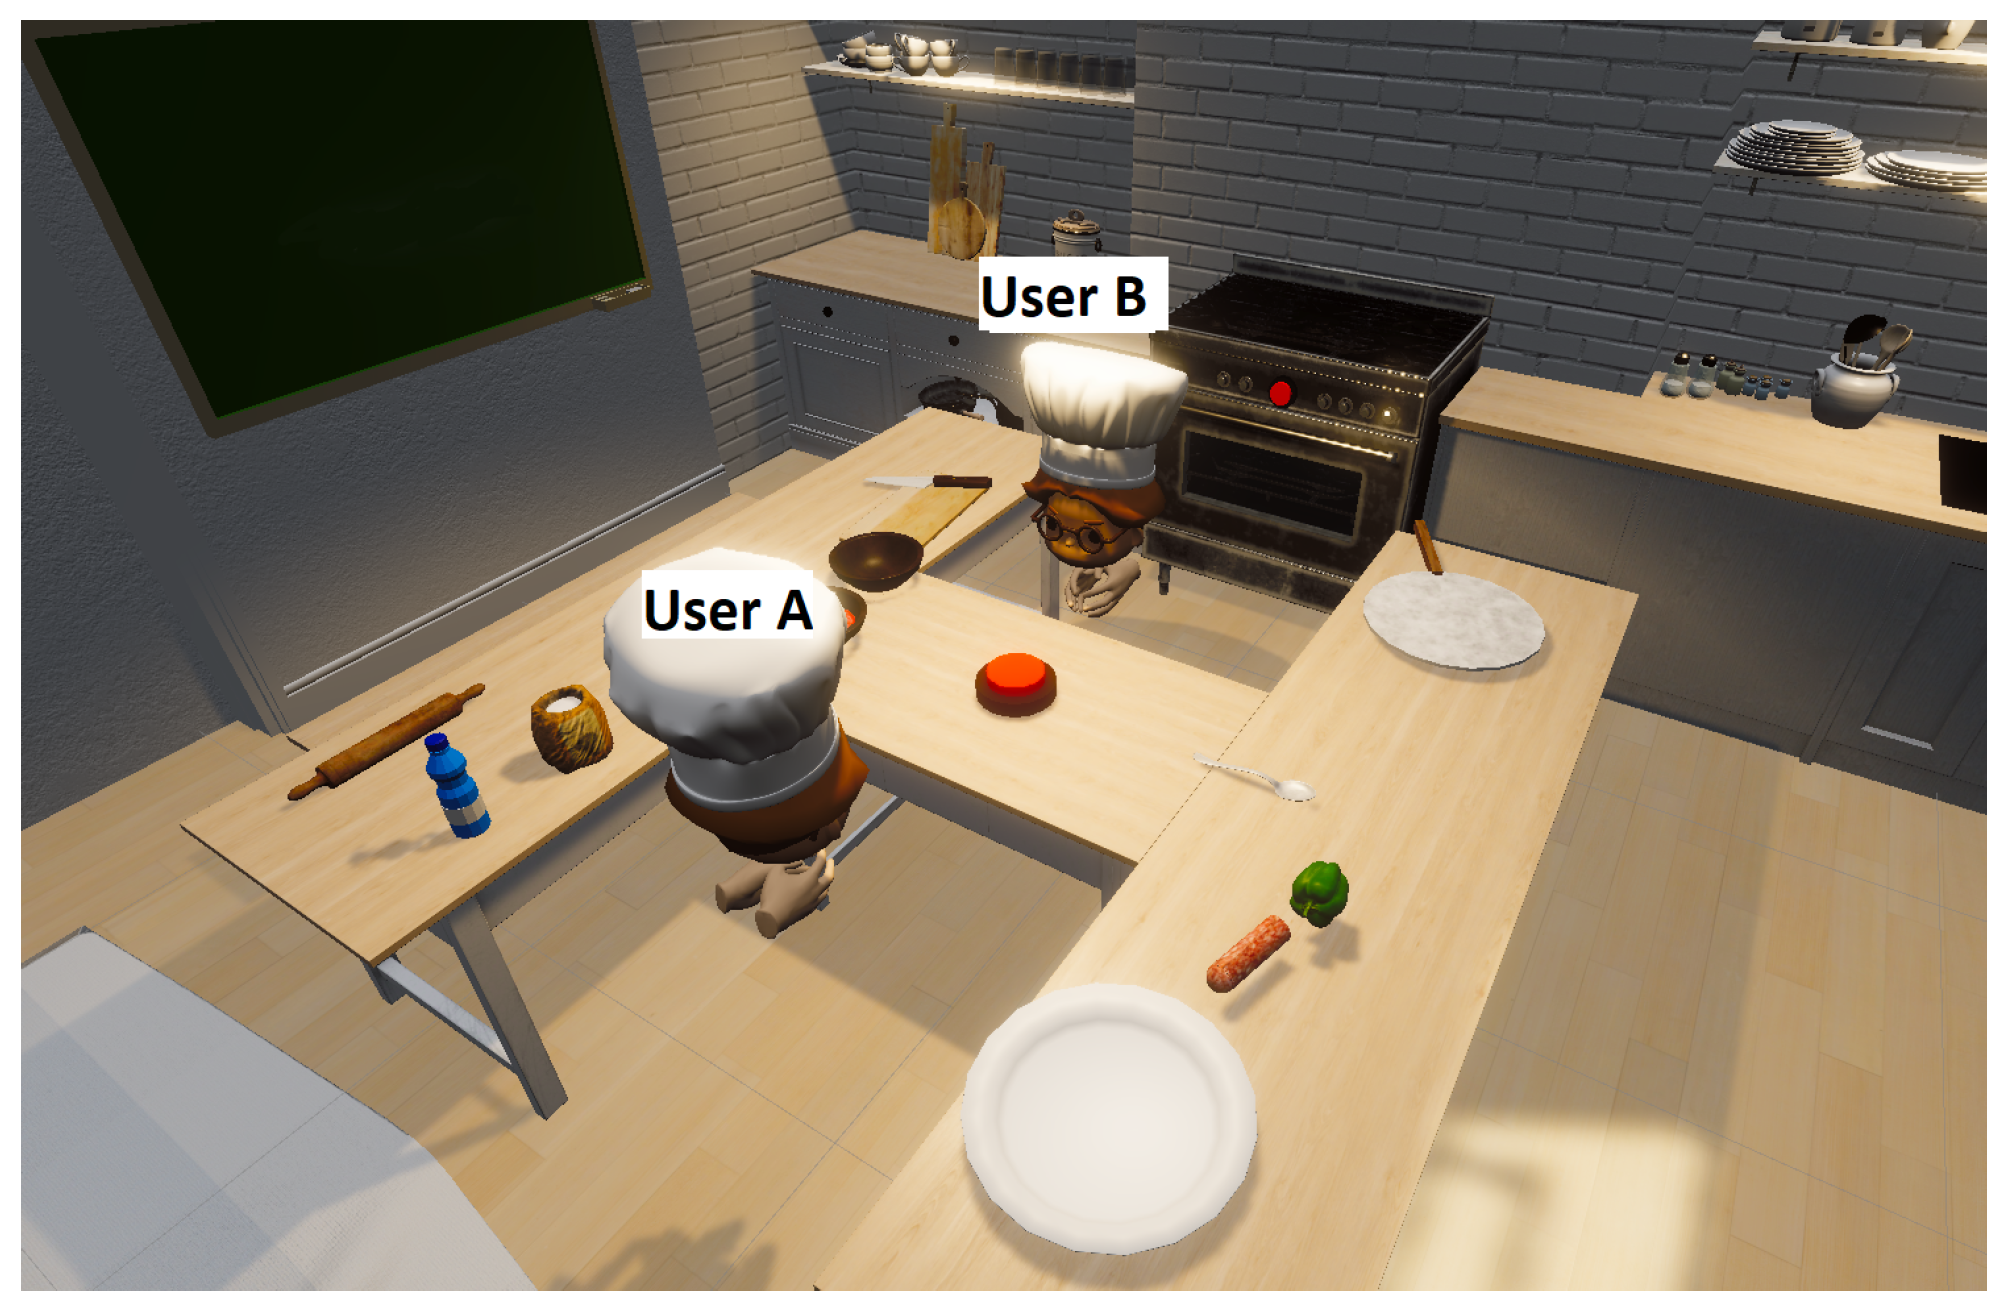
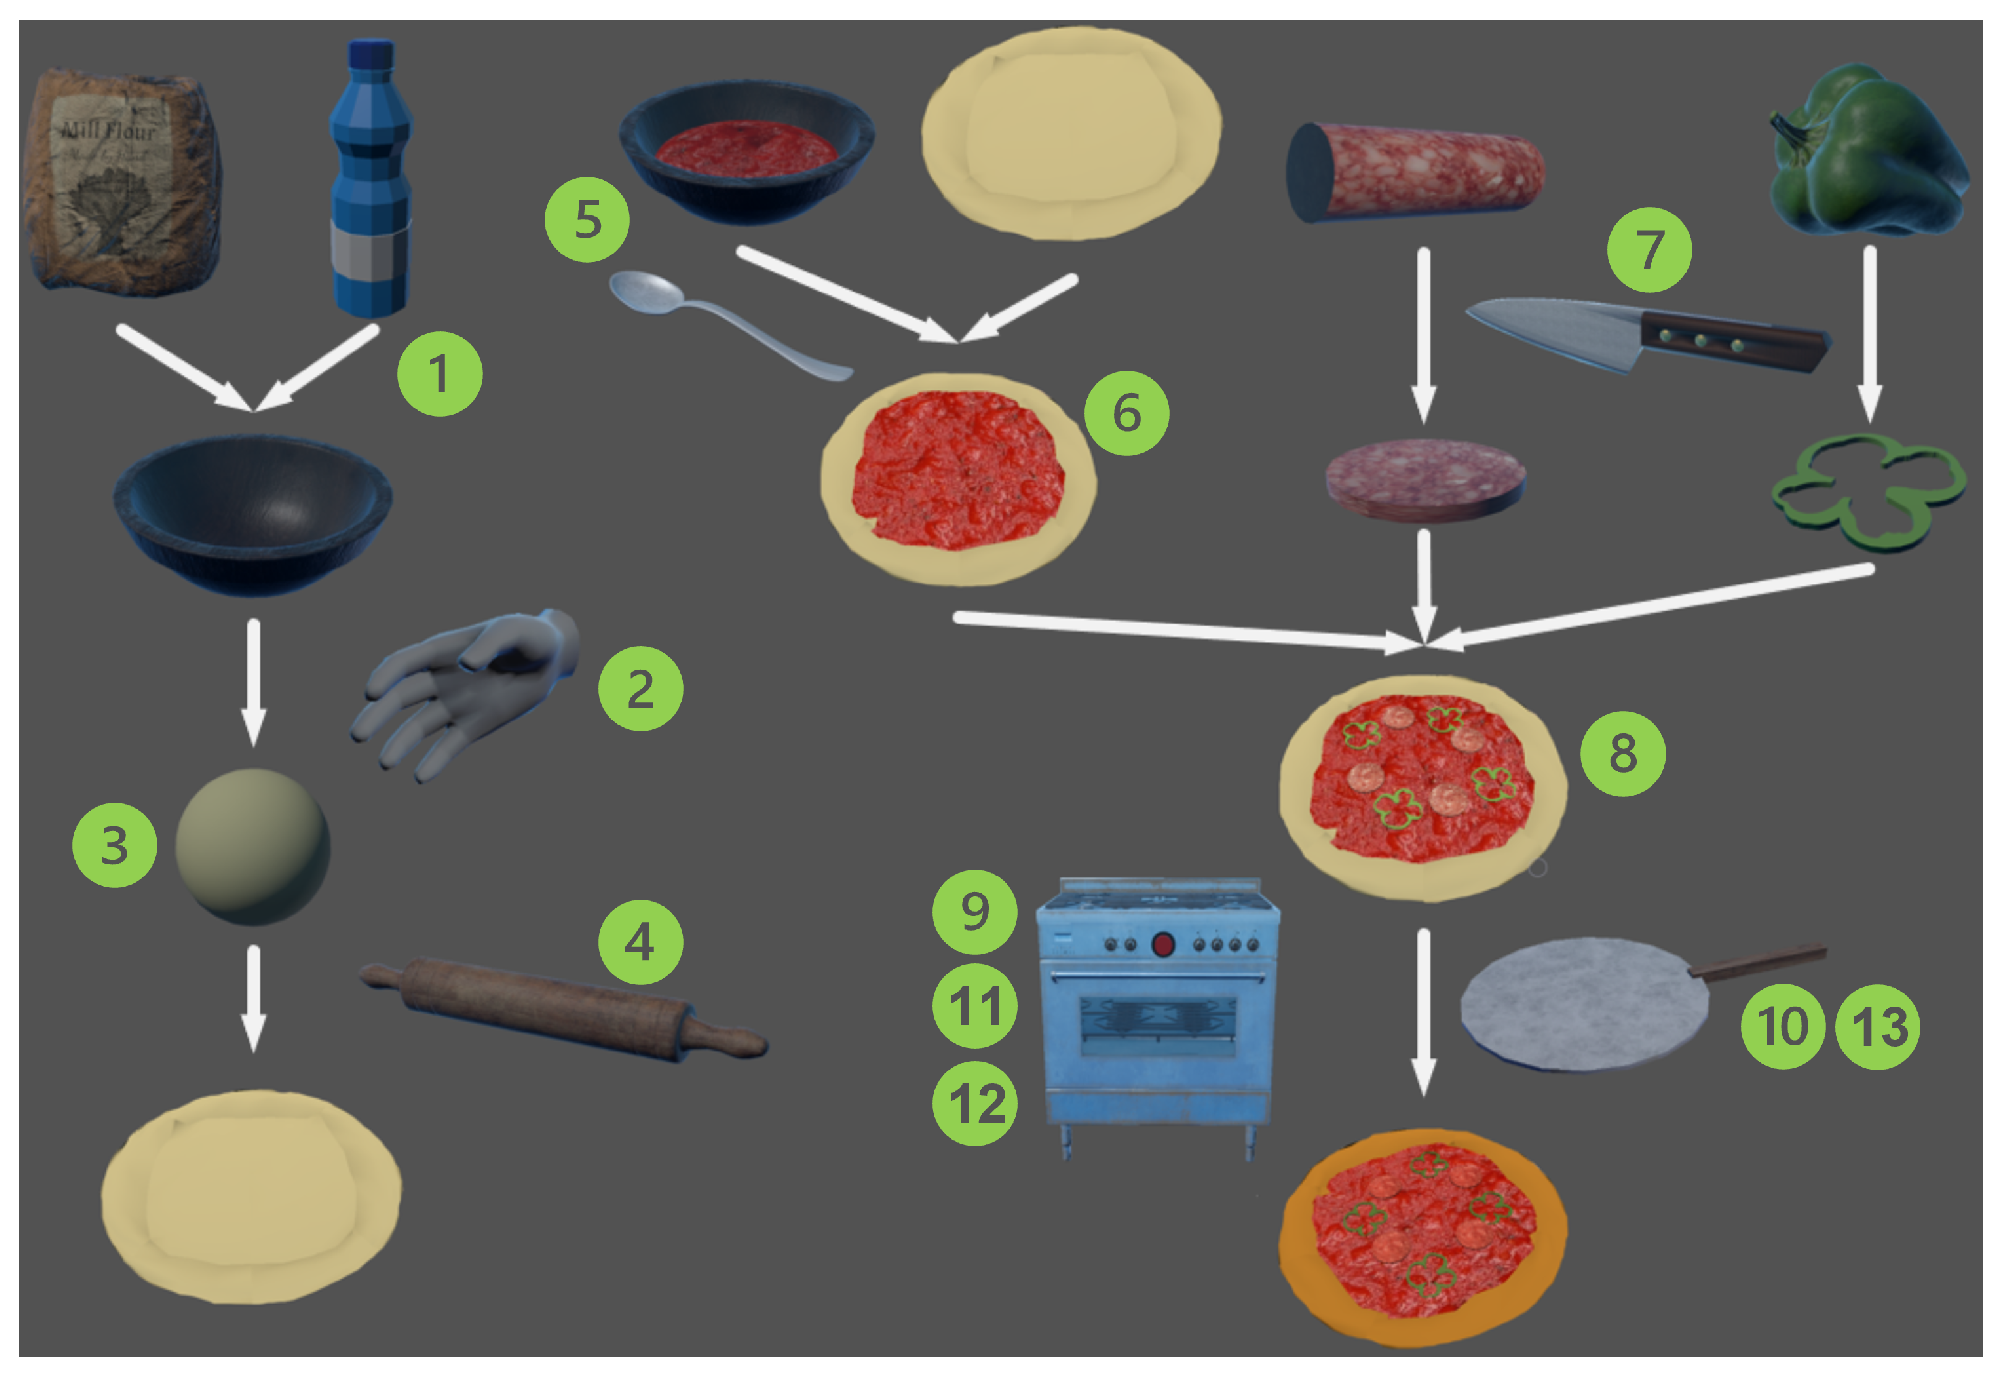
3.2.1. Use Case Description

A collaborative two-user VR task is designed to be used as a proof-of-concept for the presented system. It consists of collaboratively baking a pizza together in a virtual kitchen. Figure 2 shows the kitchen layout. The tables are arranged in an “H” shape to divide the users. All the necessary ingredients are placed on the tables, which are positioned such that both users must pass ingredients to each other to complete the task. This requires close collaboration between the two users. Moreover, the virtual kitchen is equipped with an oven that is easily accessible to one of the users to bake the pizza. Since creating a pizza is a step-by-step process, a blackboard is attached to a wall in the virtual environment to inform the participants of what task to perform next. The cooking process is shown as a diagram in Figure 3 and consists of the steps listed below. Note that the virtual environment is constructed in such a way that neither of the users can access all the necessary utensils on their own, such that hand-over of objects is a key requirement for successful completion of the task.
  • Add water and flour to a bowl. To this end, both water and flour should be handed over from User A to User B.
  • User B kneads the mixture until a ball of dough appears.
  • User B places the ball of dough on the shown indicator.
  • User A picks up the rolling pin and passes it over. User B holds it with two hands and spreads out the dough.
  • User B passes the spoon to User A. Afterwards, User A dips the spoon in the bowl filled with tomato sauce.
  • User A spreads the tomato sauce on the pizza. Once the spoon is empty, it should be refilled by dipping it in the bowl once again. User A keeps on adding tomato sauce until the pizza is fully covered.
  • User B uses the knife to cut four pieces of the sausage and four pieces of the bell pepper on the chopping board. To enable this, User A passes both the sausage and the pepper to User B.
  • User B places the four pieces of each topping on the pizza.
  • User B opens the oven by pressing the button.
  • User A passes the pizza shovel to User B. User B uses it to pick up the pizza and place it in the oven.
  • User B closes the oven.
  • Once the pizza is baked, User B opens the oven.
  • User B removes the pizza from the oven with the pizza shovel and passes it to User A. User A places it on the plate.
Note that the use case was chosen to include an element of gamification and a certain level of joy in order to avoid any bias due to user boredom after multiple playthroughs. As cooking games are widely regarded as enjoyable (e.g., “Overcooked!” (https://en.wikipedia.org/wiki/Overcooked, accessed on 5 March 2024)), we believe this requirement is fulfilled. In addition, it is important to include an element of collaboration, as was discussed in Section 2.3. To this end, the use case has been designed such that the three main task types in collaborative VR, following the taxonomy of Pérez et al. [17], are present. These include deliberation (conversations between peers, normally oriented to achieve a common goal), exploration (exploration of the environment and identification of objects following indications), and manipulation (interaction with system elements and manipulation of physical objects). Deliberation is intrinsically present as the use case cannot be completed successfully without appropriate communication between collaborators. Exploration is required to identify and find the correct objects (flour, water, bowl…) in the virtual environment. Manipulation, finally, is present as specific actions need to be performed on objects, including passing them between collaborators, to successfully complete the aforementioned tasks.

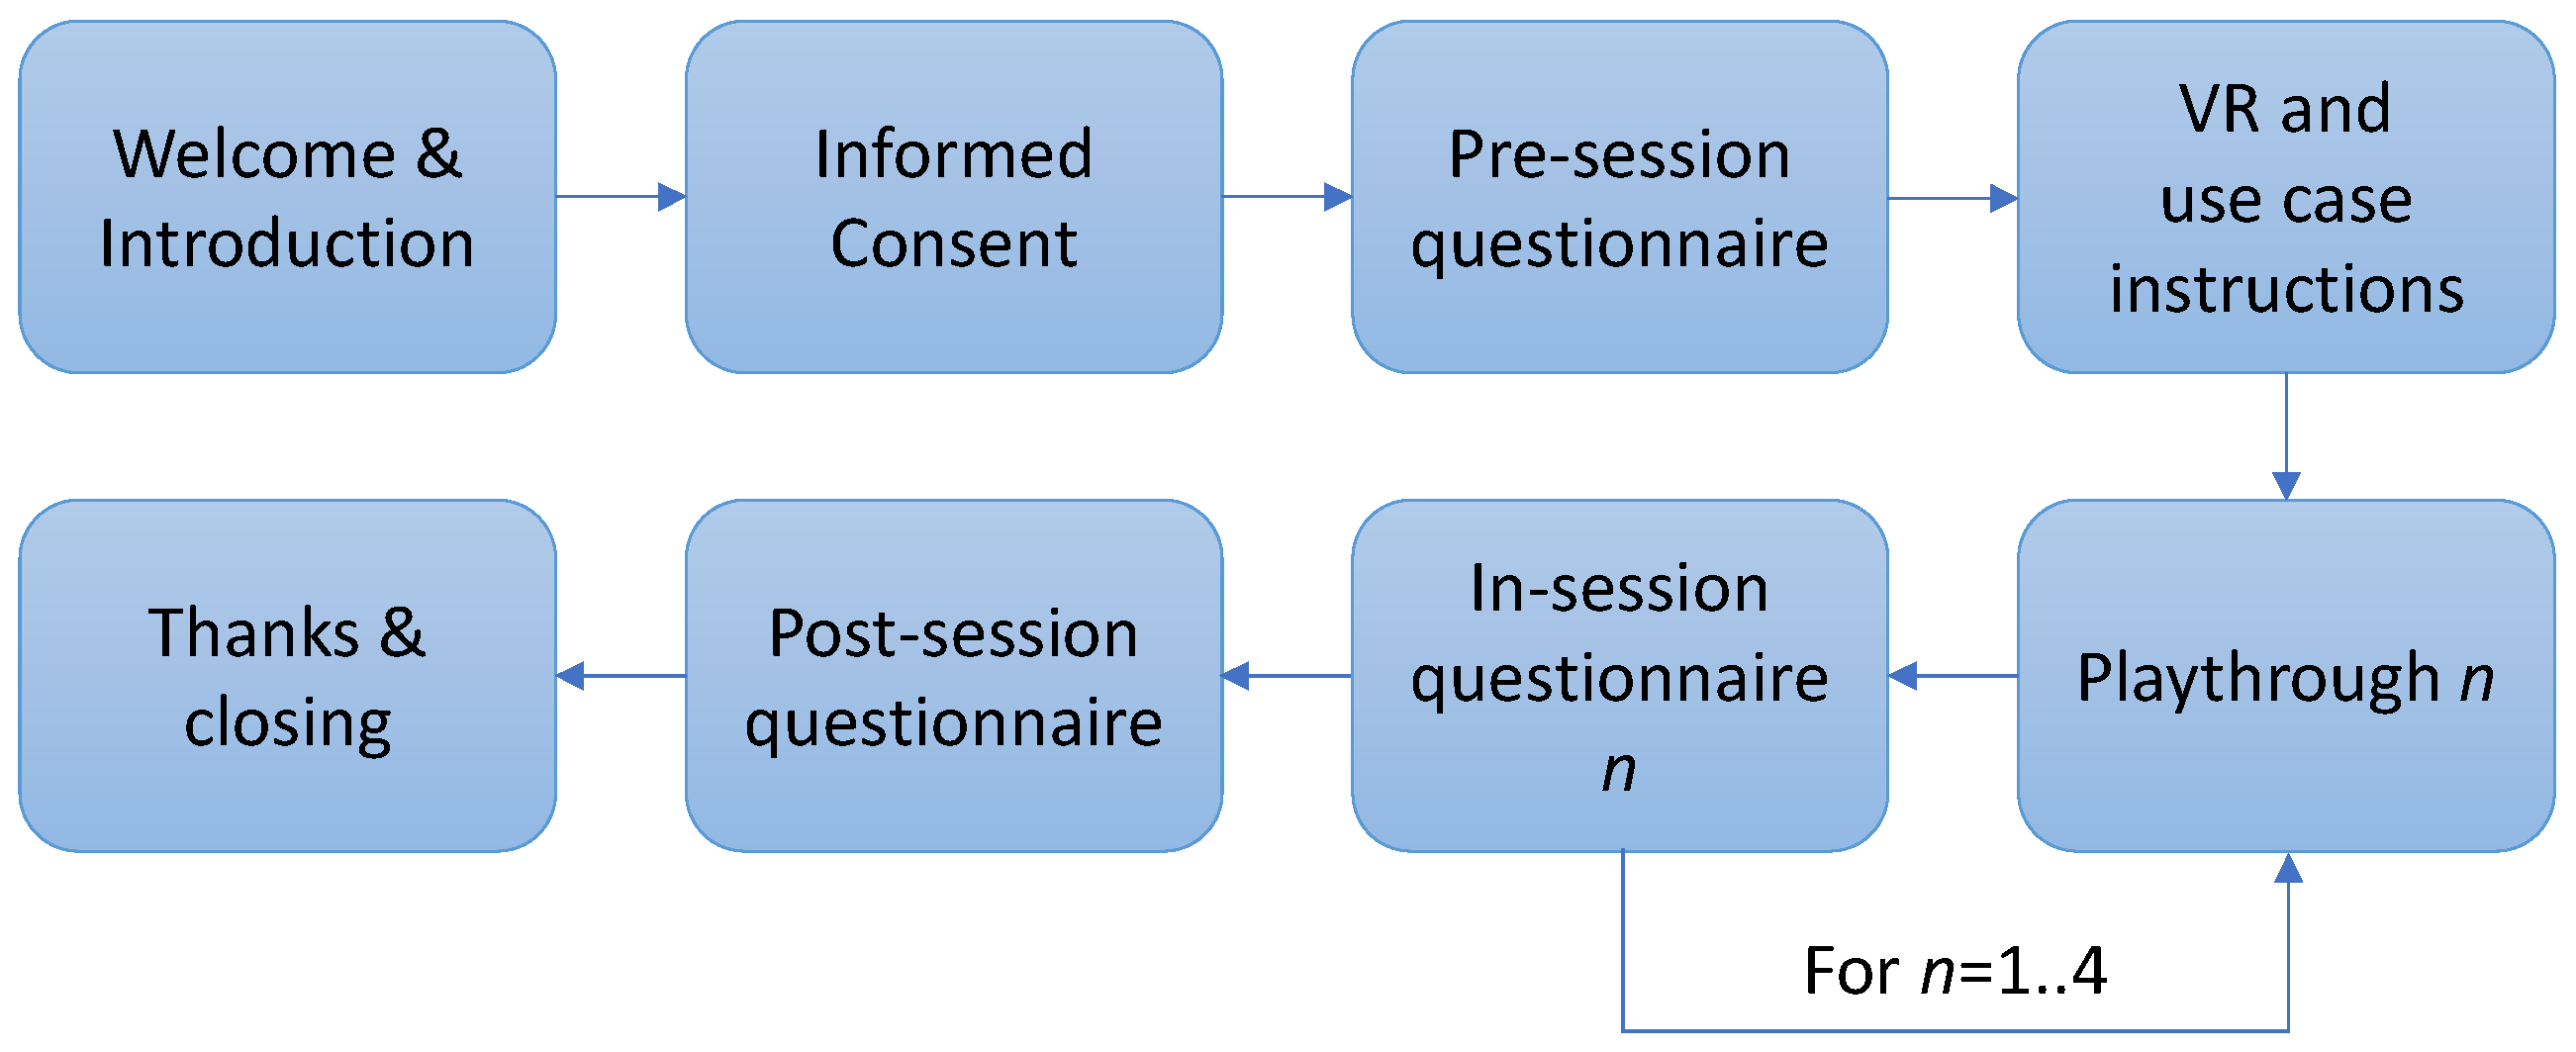
3.2.2. Testing Procedure

Figure 4 shows the multiple steps of the testing procedure of one experimental session. Note that two users participate concurrently during a single session, and that participants are assigned randomly to the pairs. First, participants are welcomed and given a brief introduction on the main purpose and organization of the experiment. In addition, they are presented with a written informed consent form in which they are asked for permission to collect and process their anonymized data and for their personal information, such as age and gender, to be used in the study. Additionally, participants are notified about the possibility of experiencing cybersickness. Furthermore, they are informed on their rights regarding the possibility to withdraw from the study at any given time and on the access to, correction, and deletion of their collected data. Next, participants are asked to complete a pre-session questionnaire, which asks about gender, age, and prior experience with VR, and subjective evaluations in general. They are also asked to assess their own technological proficiency and to fill in a prior baseline Virtual Reality Sickness Questionnaire (VRSQ) (developed and validated by Kim et al. [26]). In addition, the participants are tested for correct color vision using the Ishihara tests [27]. Afterwards, subjects are given a brief oral instruction session on the use of VR (headset, boundaries, controllers…) and the actual use case. Participants are offered the possibility to ask questions in case anything is unclear, which are answered accordingly.
Then, the actual experimental session takes place following a within-subjects design. It consists of four consecutive playthroughs, where each round consists of a different network condition (A to D). The order of these testing rounds for each session is determined using a balanced Latin square design to avoid any bias due to ordering and learning effects (Table 3). Note that participants are intentionally kept unaware of the particular scenario configurations and ordering. After each round, participants are requested to remove the headset and fill in the in-session questions. Here, participants are asked to give an estimation of the playthrough time in seconds, as well as to fill in an additional VRSQ to estimate the influence of the network configuration on inducing cybersickness effects. Furthermore, they are asked to what extent they noticed any latency or jerkiness (the observable result of burst traffic in a networked VR system), as well as to what extent these interfered with physical object interaction in the system and collaboration between participants. Participants are also asked to rate the assumed spatial and temporal synchrony between their own view and the view of the collaborator and to rate the difficulty of the task given the current network conditions. All these questions are rated on a 5-point Likert scale.
After the four experimental rounds, subjects were requested to fill in a short post-session questionnaire as well. Here, subjects were asked to rank the four playthroughs based on level of sickness inducement and optimality of the network conditions. Table 4 provides an overview of the different subjective evaluations and their timing within the experimental session. Once the post-session questionnaire was finished, subjects were thanked for their participation before closing the session.

4. Results and Discussion

The following sections discuss the experimental results obtained from this study. First, a brief description of the independent variables and an overview of the participants are provided. Next, an objective system performance analysis is given. In the last section, the subjective results are discussed in terms of the perception of the network, the completion time, the subjective perception, and the occurrence of cybersickness symptoms.

4.1. Independent Variables

Two objective network variables are controlled during the study: latency and burst. Latency, on the one hand, introduces an artificial end-to-end delay between the sending and the delivery of each network packet. This results in delayed synchronization between the actions of one user and the observation of these actions by their collaborator. Values of 0 ms and 500 ms are considered in this study. Burst, on the other hand, introduces a certain probability of blocking traffic for a given time frame, after which all data are sent in a single batch. As such, burst network traffic is emulated. In this study, the burst probability is fixed at 50%, meaning that every packet has a 50% chance of being stalled for a pre-configured time interval. The time intervals being considered are 0 ms and 500 ms. The value of 500 ms was determined based on the works of Vlahovic et al. [4] and Kojic et al. [5] Vlahovic et al. [4], on the one hand, explored the effects of network latency on user experience in a multiplayer VR game. An average MOS above 4 (on a 1–5 scale) was obtained on addition of 300 ms of latency. In addition, 80% of users indicated they were willing to continue playing with a delay of 300 ms in place. As such, this shows that higher latency values are required to really challenge user QoE in multi-user VR. Kojic et al. [5], on the other hand, performed a similar study on the effects of latency in a multi-user VR exergame. Their results showed QoE scores dropped to an average MOS of 2.5 when the user’s personal latency reached 500 ms; this shows that user experience drops sharply within small intervals of increasing latency. Furthermore, end-to-end latencies of 400–600 ms have been shown to occur in real scenarios [24]. Therefore, in order not to surpass the edge on playability while remaining consistent with possible real-life occurrences, we decided not to push this further and to identify 500 ms of latency as an interesting value that sufficiently challenges the end-user QoE. The 50% blocking change was empirically determined to optimize the trade-off between providing a distortion in the system that was strong enough to be observable by human subjects while still allowing for sufficient playability of the experience in order to collect relevant results. In addition, the number of scenarios was intentionally kept limited in order to realize a within-subject experimental design within an acceptable attention span. As such, a total of four possible scenarios was obtained, as illustrated in Table 5. Note that, as Clumsy runs on the server-side, downlink packets (i.e., server-to-client) are stalled before transmission, while uplink traffic (client-to-server) is stalled after reception at the server (but before processing).

4.2. Participants

Participants were recruited on a voluntary basis. They were mainly gathered from academia. Volunteers from the scientific staff were gathered through a mailing list. An announcement was made in a WhatsApp group for Ph.D. students and a call was made through a Teams channel to attract masters’ students. Other inclusion criteria included passing the Ishihara test, which all participants did, and having sufficient English proficiency to understand and interpret the instructions, provide informed consent, and complete questionnaires. All participants were offered a chance of winning an online shopping voucher as an incentive. A total of 20 subjects participated in the study, divided over 10 sessions of two subjects each. Participant ages varied between 22 and 47 with a median of 27.5 and an average of 28.4. A total of 30% of participants identified as female and 70% as male. A total of 65% of the participants were of European/White ethnicity, 20% Middle-Eastern, and 15% Asian. A total of 55% of participants had a background in computer science, 35% in electronics, 5% in mathematics, and 5% in ecology. A total of 15% of the participants indicated that they had never used VR before, while 65% had used it once. Totals of 15% and 5% of participants indicated they were quite or very experienced with VR, respectively. A total of 15% of participants assessed their own technological proficiency as low, 30% as medium, and 55% as high.

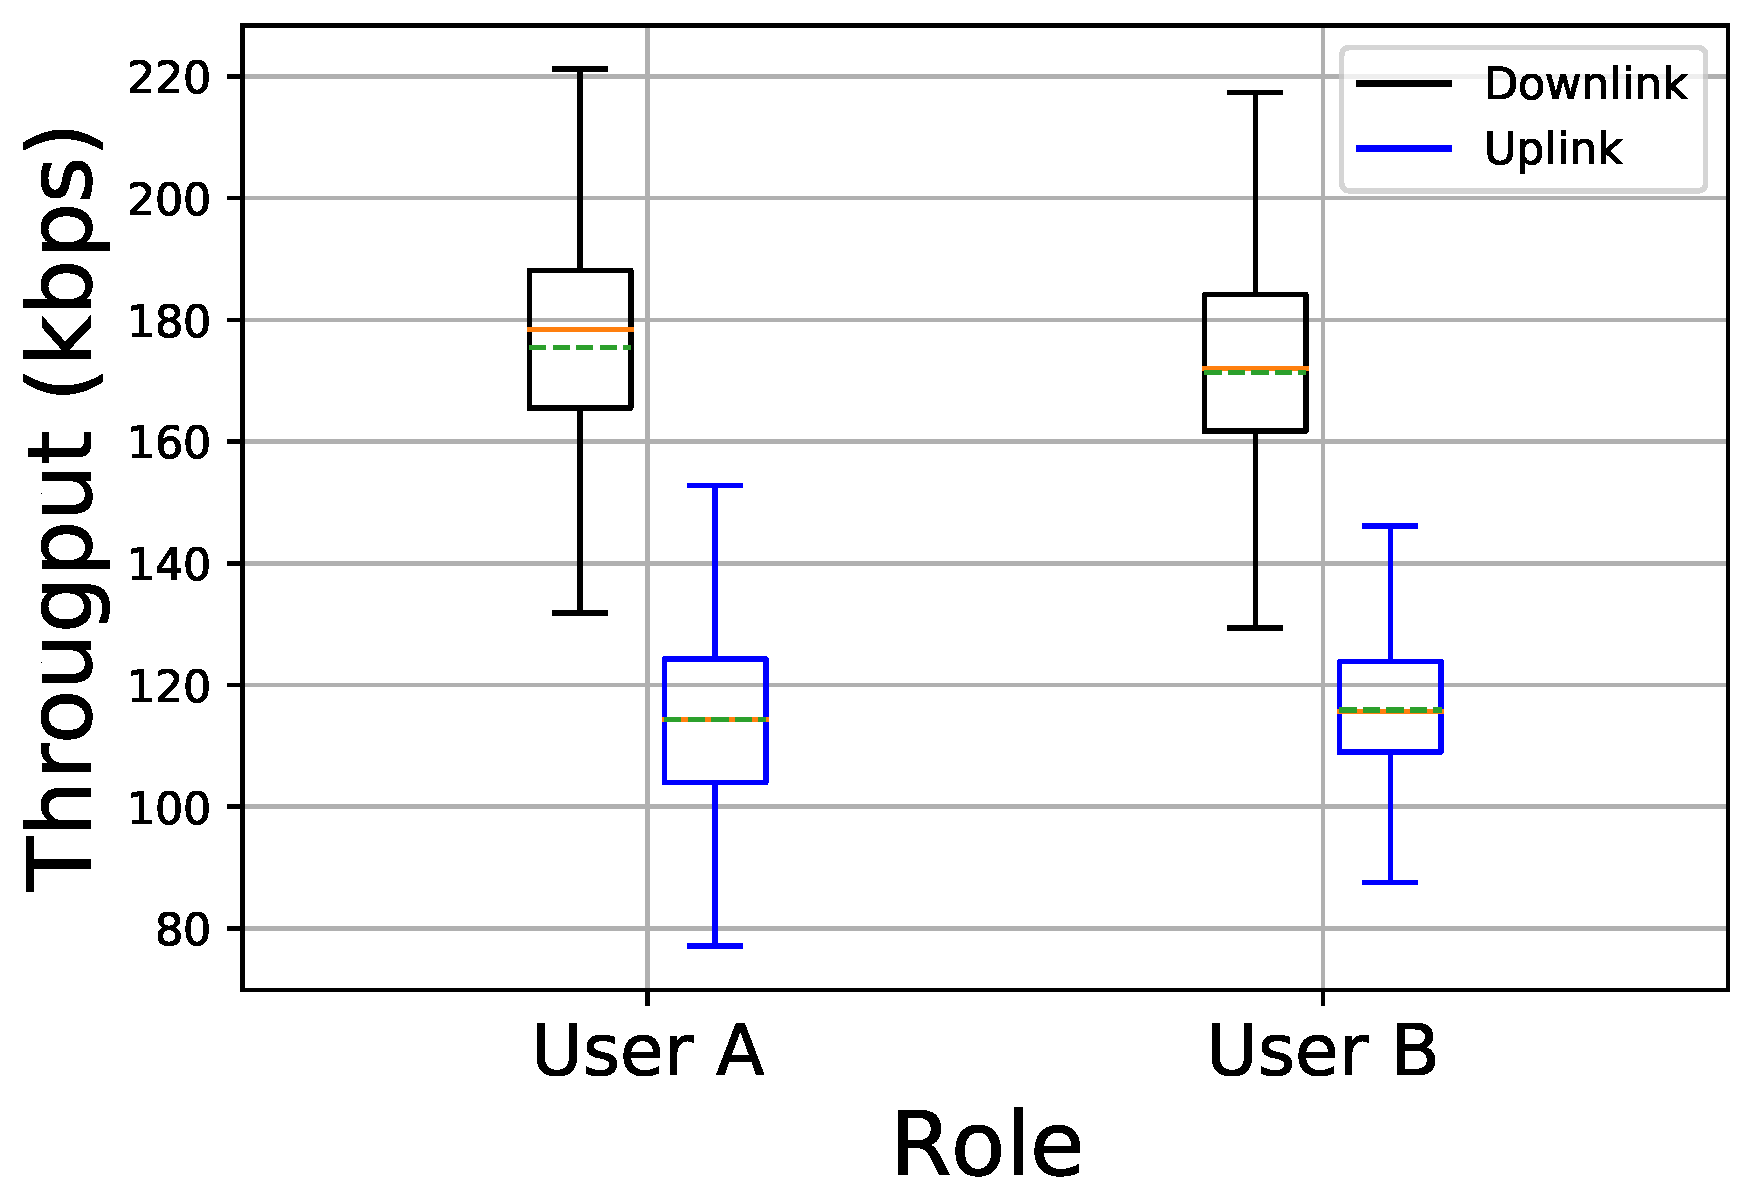
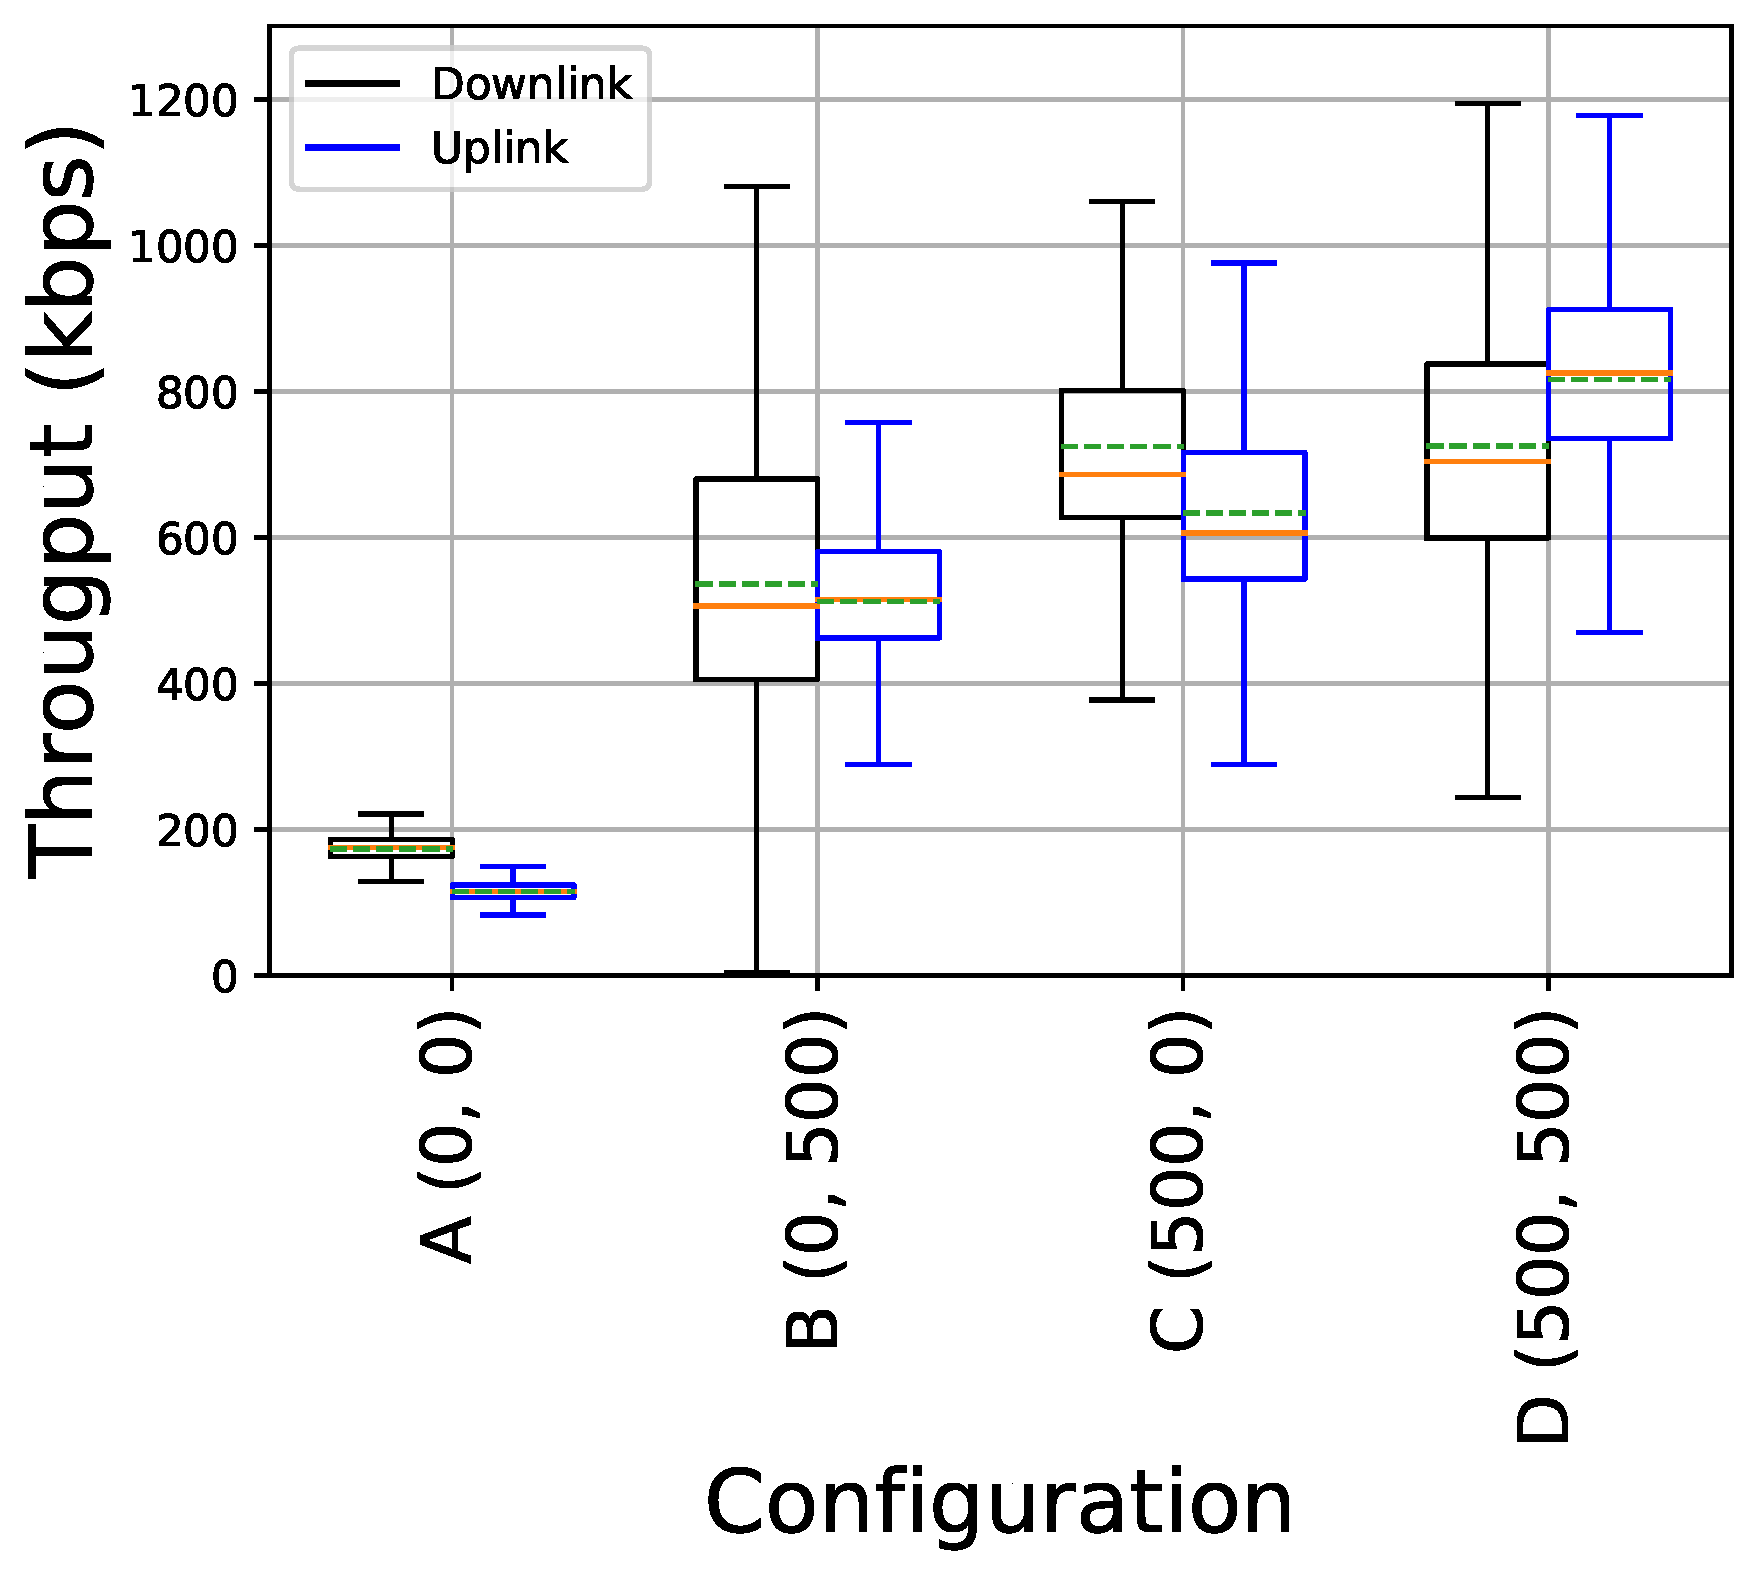
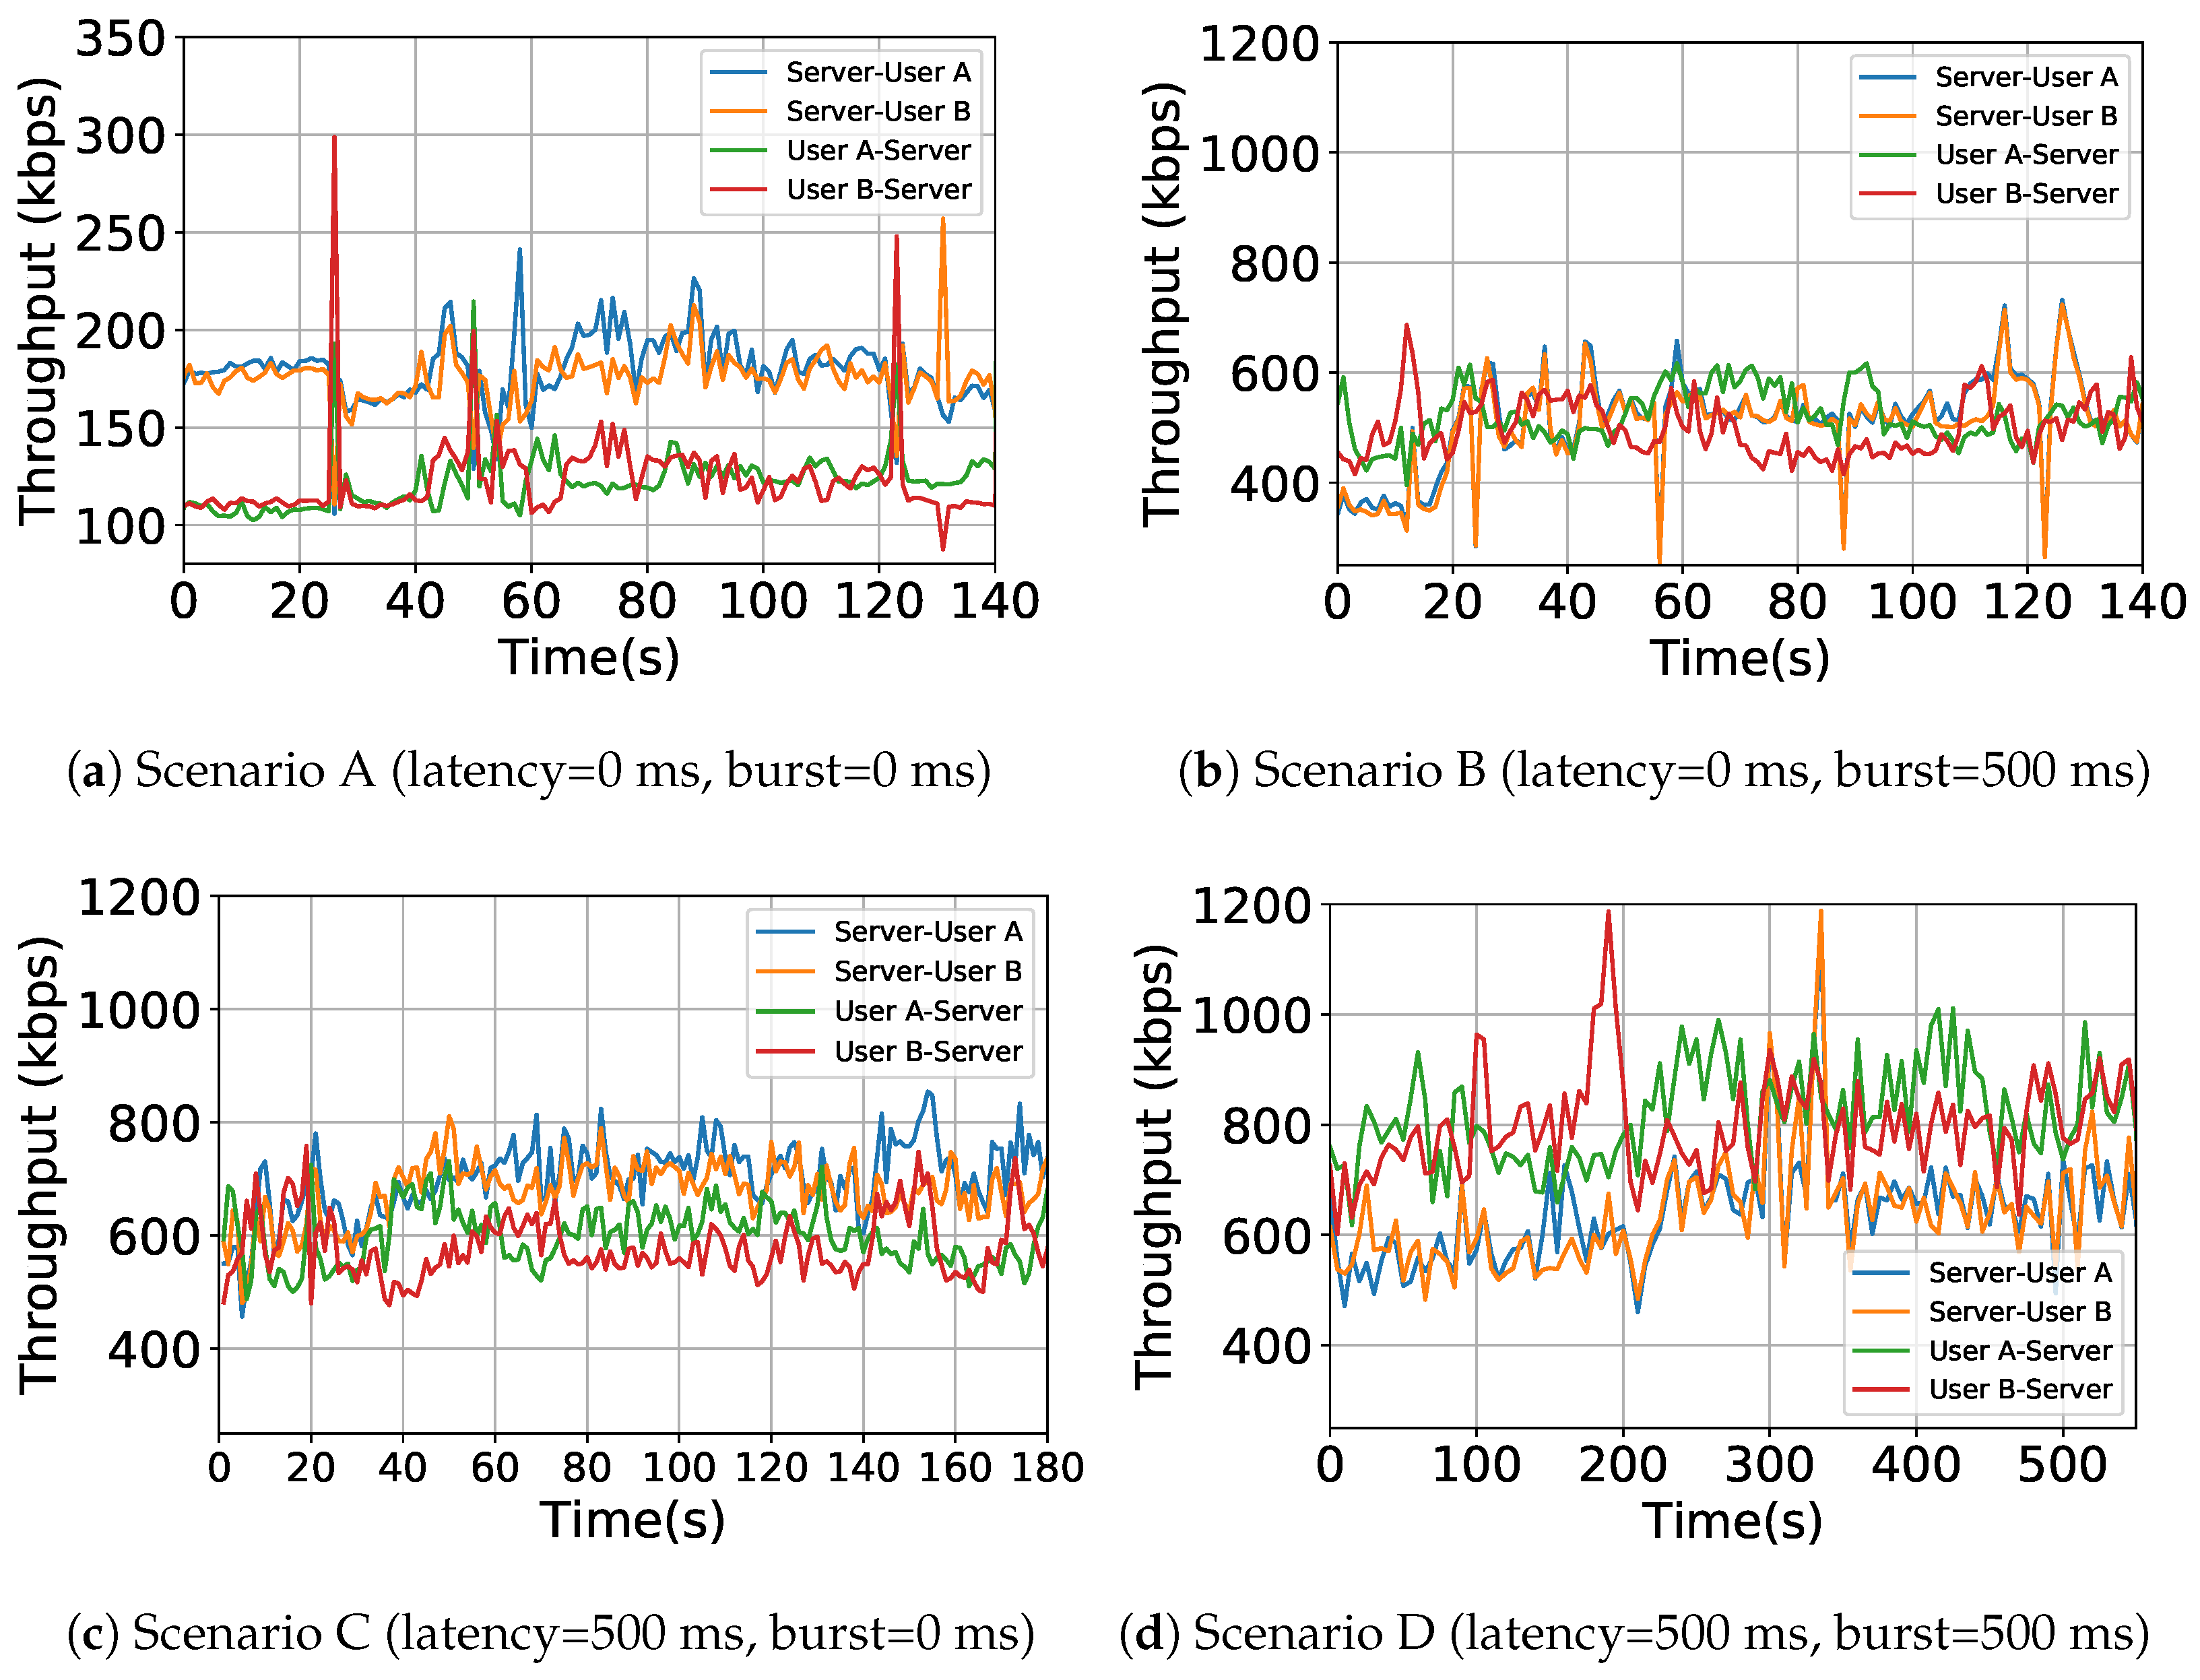
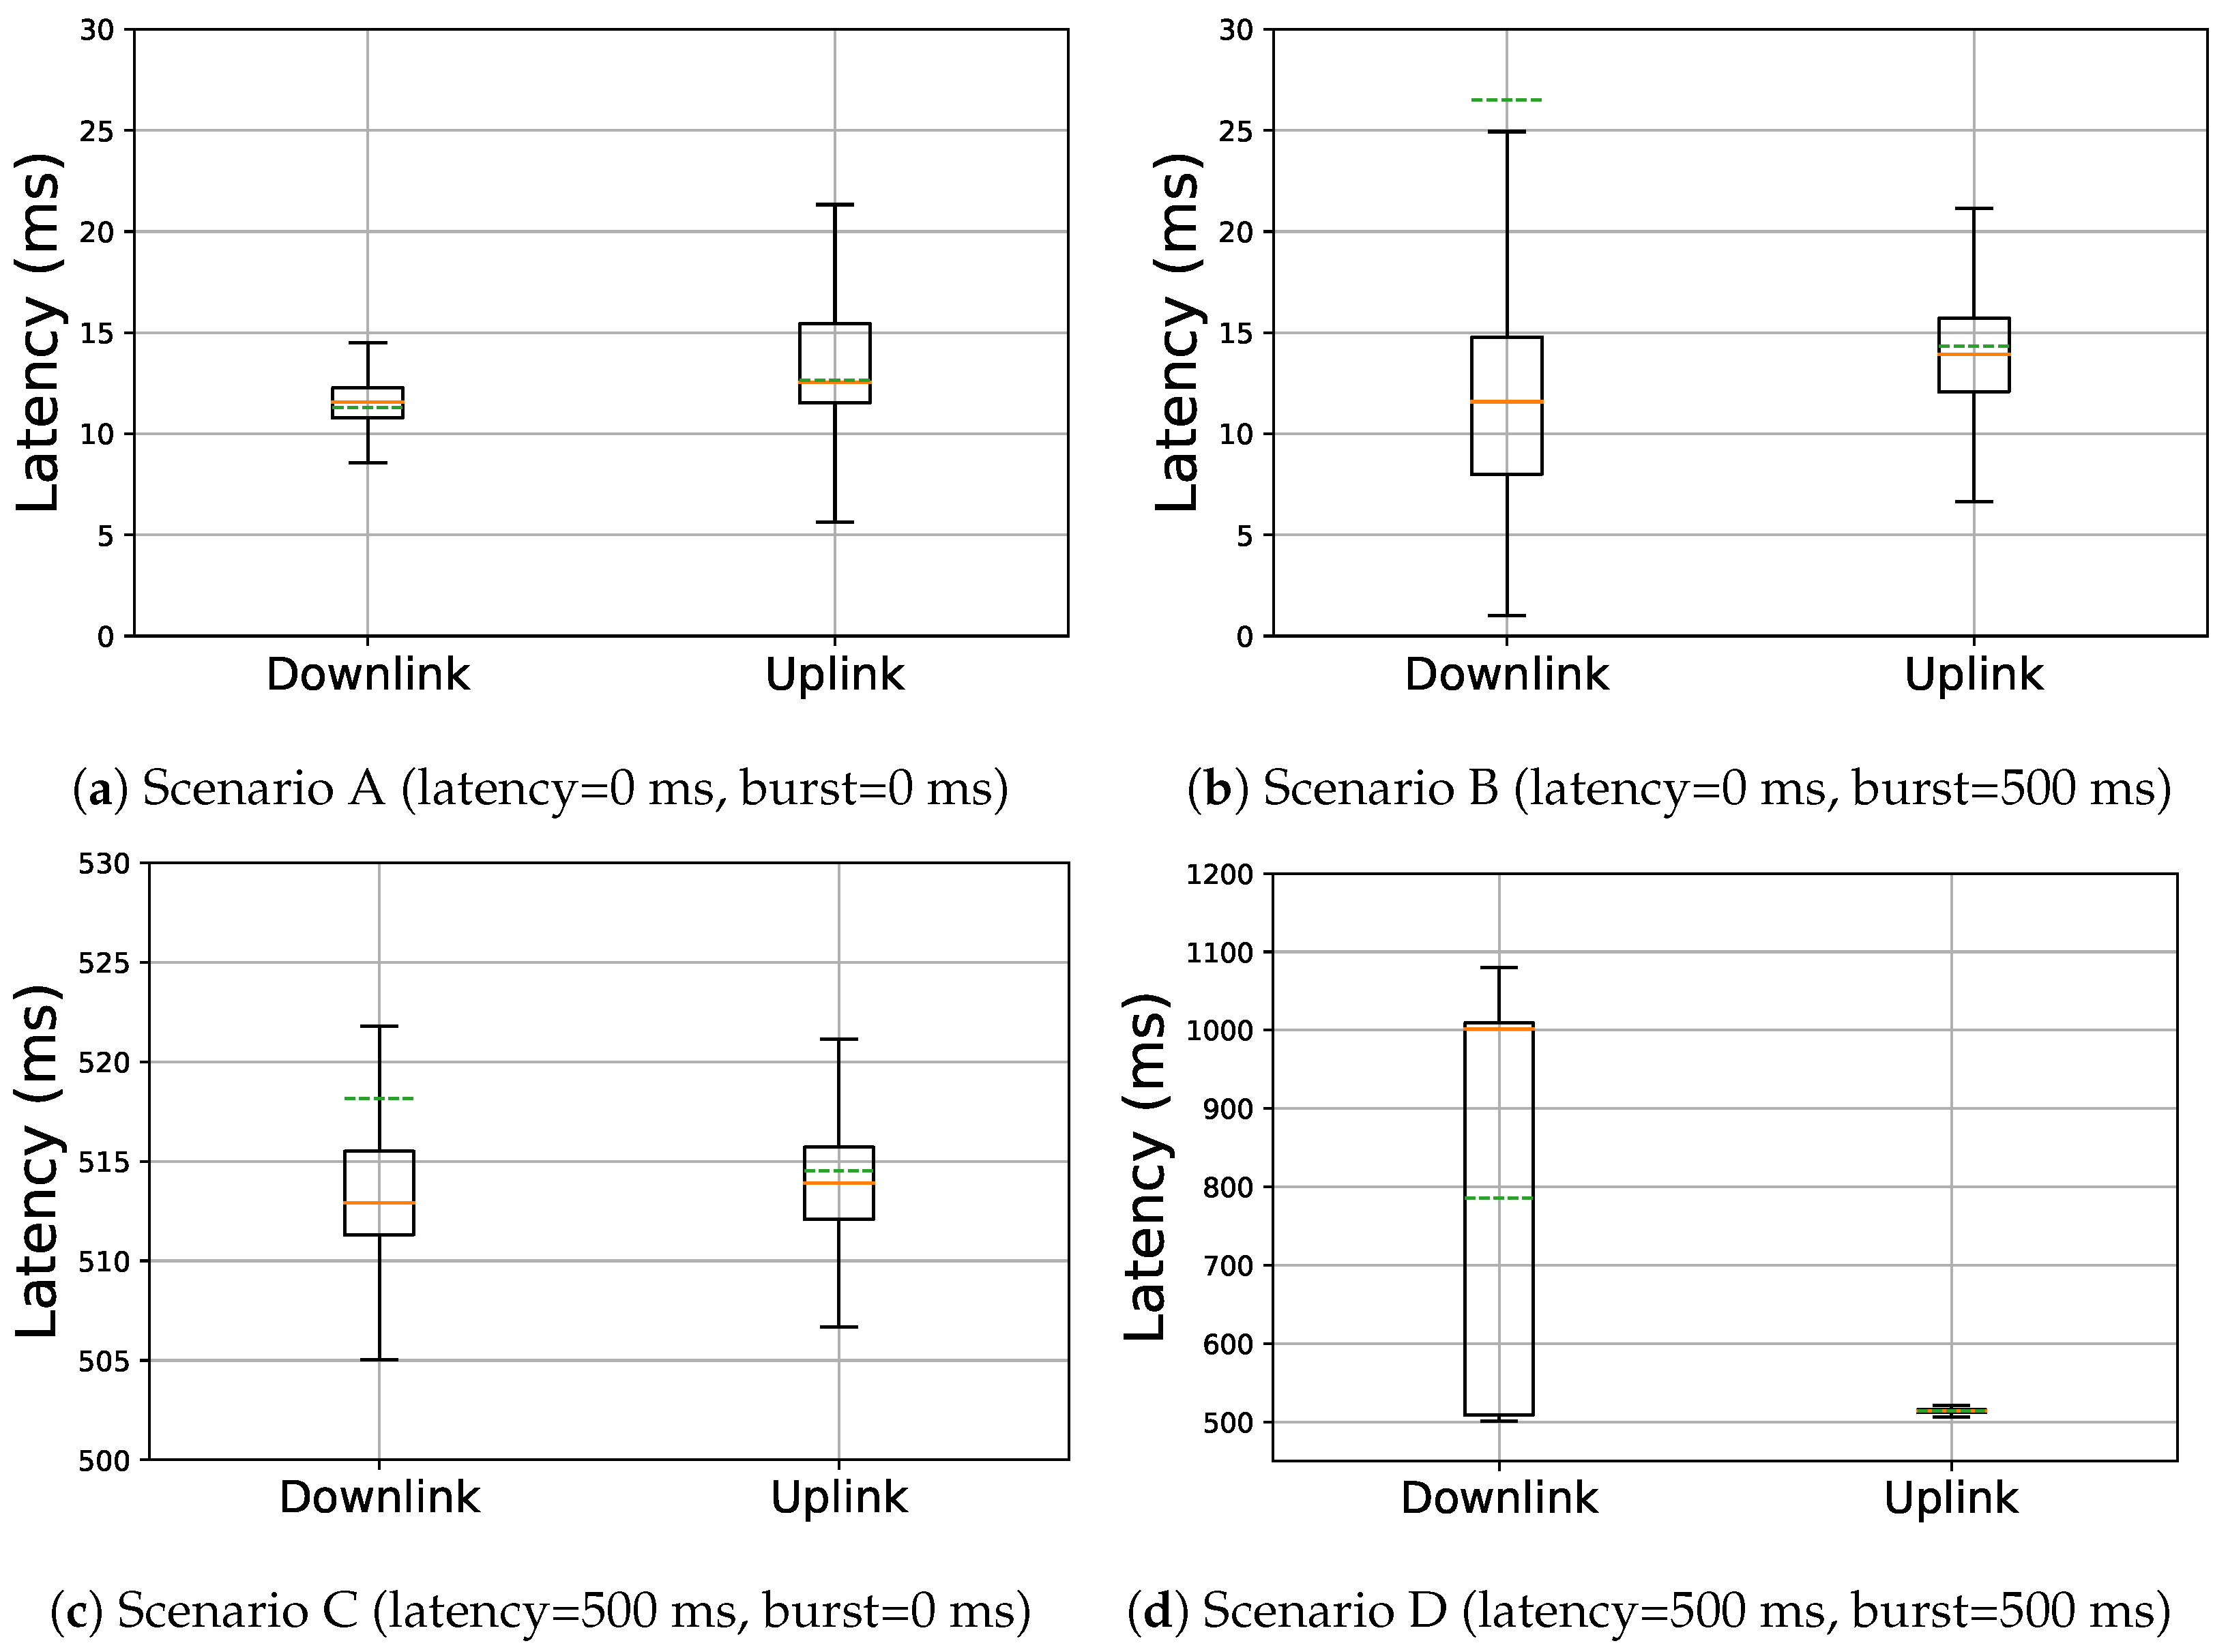
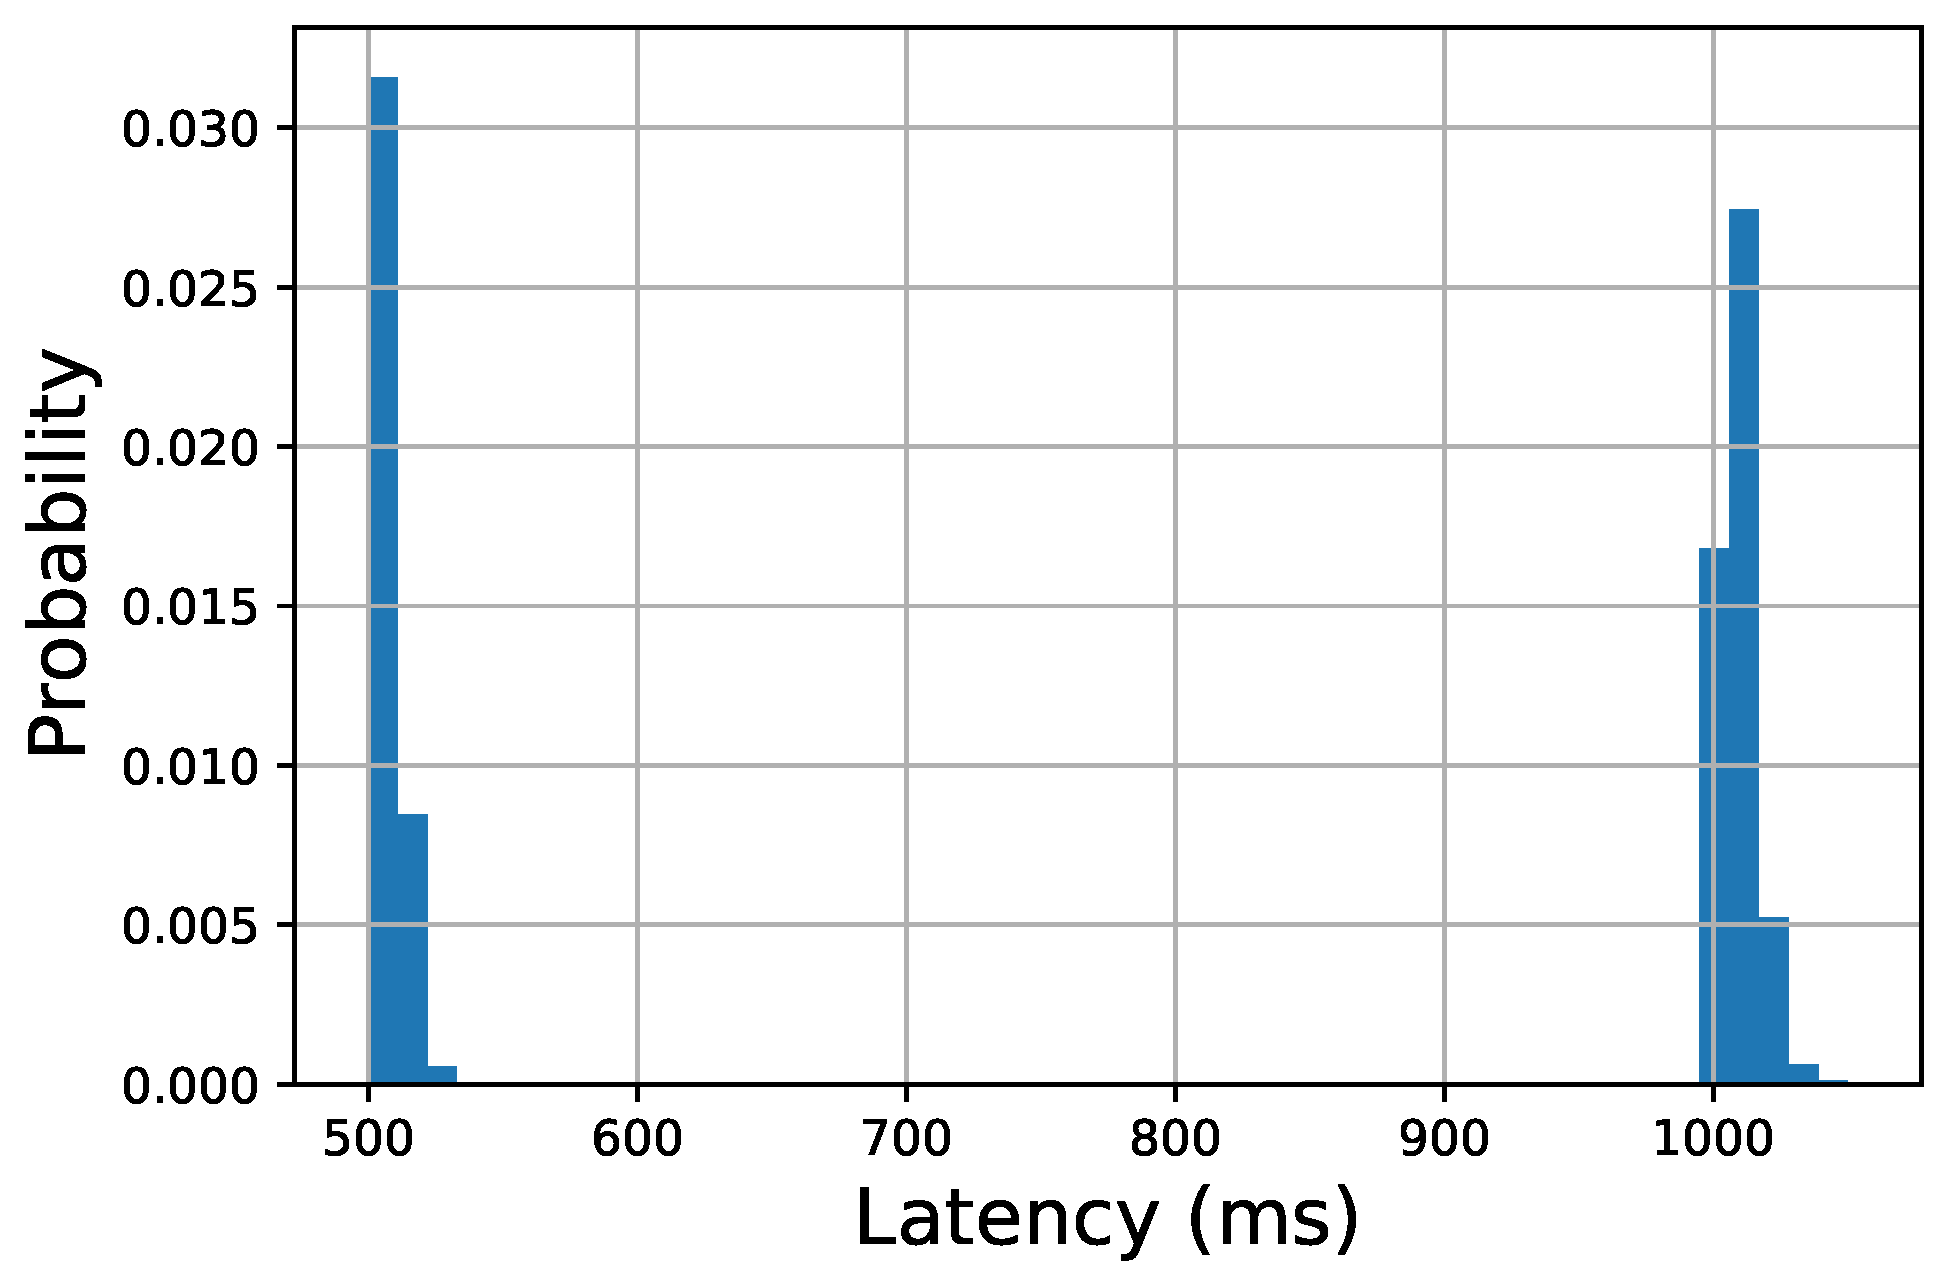
4.3. Objective System Performance

In Figure 5, the downlink and uplink throughput distributions of the unconstrained system (configuration A) are displayed. One can see that similar, more or less normally distributed, requirements were obtained for both user roles. This finding also holds for the other configurations, where no significant differences in throughput between user roles were found. However, for configuration A, a difference can be seen between downlink and uplink. The former requires around 180 kbps, on average, while the latter is limited to ± 120 kbps. Note that these throughput requirements are substantially lower in comparison with VR streaming scenarios in which all graphical content processing is performed at the server side, after which the complete virtual environment is streamed to the client. Here, in contrast, graphical processing is performed locally on the client, such that only synchronization traffic is required between both clients, resulting in substantially lower throughput. Nevertheless, throughputs in the impaired scenarios B–D were shown to be four to five times higher than the unimpaired scenario A, as can be seen from Figure 6, in which the downlink and uplink distributions for each of the four configurations are shown (averaged over both user roles). The reason for this is that Unity NetCode makes use of the UDP-based Unity Transfer Protocol (UTP) which, in contrast to traditional UDP, implements some robustness mechanisms, such as acknowledgements, packet re-ordering, and data re-transmission. The latter, in particular, results in severe overhead in case of (heavily) impaired networks. In addition, it is also worth mentioning that the difference between uplink and downlink is less pronounced in scenario B and even inverted for scenario D. These are the two configurations where artificial burst is introduced. The reason for this is that the burst emulation is implemented on the server-side by blocking both incoming and outgoing traffic for 500 ms with a 50% change. As such, a lot of re-transmissions will be initiated from the client side as acknowledgements are not received within time, causing the uplink traffic to increase.
By way of illustration, Figure 7 shows the evolution of the system’s throughput over time for a randomly selected session. From Figure 7a, one can once again observe the similarity in behavior between both user roles and the difference in throughput between uplink and downlink. In addition, some large but narrow peaks can be observed on the uplink, such as the ones around seconds 25 and 120. These correspond to events with a high number of vertex manipulations (e.g., spreading sauce) and, as a result, an increased quantity of synchronization information to be sent. A similar difference between uplink and downlink can be observed in Figure 7c, albeit with higher absolute throughput, as discussed earlier. From Figure 7b,d, we can once again notice how the uplink throughput is leveling (B) and even surpassing (D) for the downlink throughput as a result of the injected burst. As explained before, this behavioral difference between uplink and downlink stems from the server-side implementation of the burst impairment. A lot of re-transmissions will be initiated from the client side as acknowledgements are not received within time, causing the uplink to increase. However, while on the server-side outgoing traffic is blocked before transmission, this behavior is not observed on the downlink. Also notice that the high throughput peaks (up to 1.2 Mbps) at computationally heavy moments of the experience with a lot of synchronization messages (e.g., sauce spreading), which, given the network constraints, results in a high number of re-transmissions as well.
Figure 8 shows the latency distributions for each link in each of the four network configurations. In Figure 8a, the distributions of the unconstrained system are shown, indicating average latency of 11.3 ms and 12.6 ms for downlink and uplink, respectively. In addition, the spread in the uplink is shown to be somewhat larger than is the case for the downlink. Similar behavior can be observed for scenario B (Figure 8b), albeit with a larger spread of the distribution on the downlink. This is because every packet has a 50% chance of being blocked for 500 ms at the server before effectively being sent due to the burst implementation. A lot of these packets will be effectively resent within 500 ms (as each re-transmission has an equal 50% change of not being blocked), therefore resulting in a limited increase in the average latency. For a limited portion of the packets though, no successful re-transmission will take place within this interval, therefore effectively resulting in a 500 ms latency, causing the distribution to stretch. Furthermore, this also explains the positive skewness in the data, which can be noticed from the difference between the median and the average. As the uplink packets are only blocked on entering the server, this phenomenon is not observed here. Scenario C (Figure 8c) shows similar behavior as scenario A, albeit shifted with the artificially added 500 ms of latency. In addition, an increased spread and positive skewness of the downlink distribution can once again be observed due to re-transmissions in the traffic. For scenario D (Figure 8d), rather binary behavior is observed. For the uplink, one can notice a similar distribution as in scenario C. On the downlink, however, a much wider and skewed distribution can be seen, with a median of 1002.0 ms and an average of 786.1 ms. This is because the combination of the 500 ms burst and latency in one system shapes the latency in a bi-modal distribution, as can be seen from Figure 9. In contrast to scenario B, none of the re-transmissions resulting from the 50% blocking chance will arrive in time, as every packet by default experiences a 500 ms latency. As such, around half of the packets will not be affected due to the burst, resulting in ± 500 ms latency, while the other half suffers from an additional 500 ms delay due to the burst. As such, the latter totals to a latency of around 1000 ms, therefore effectively creating two distinct modes in the distribution. Due to the server-side implementation of burst, as explained before, this behavior is not observed on the uplink.

4.4. Subjective Results

In this section, the results for the subjective perception of network distortions are first discussed. Next, the completion time, subjective time perception, and cybersickness occurrence are analyzed.

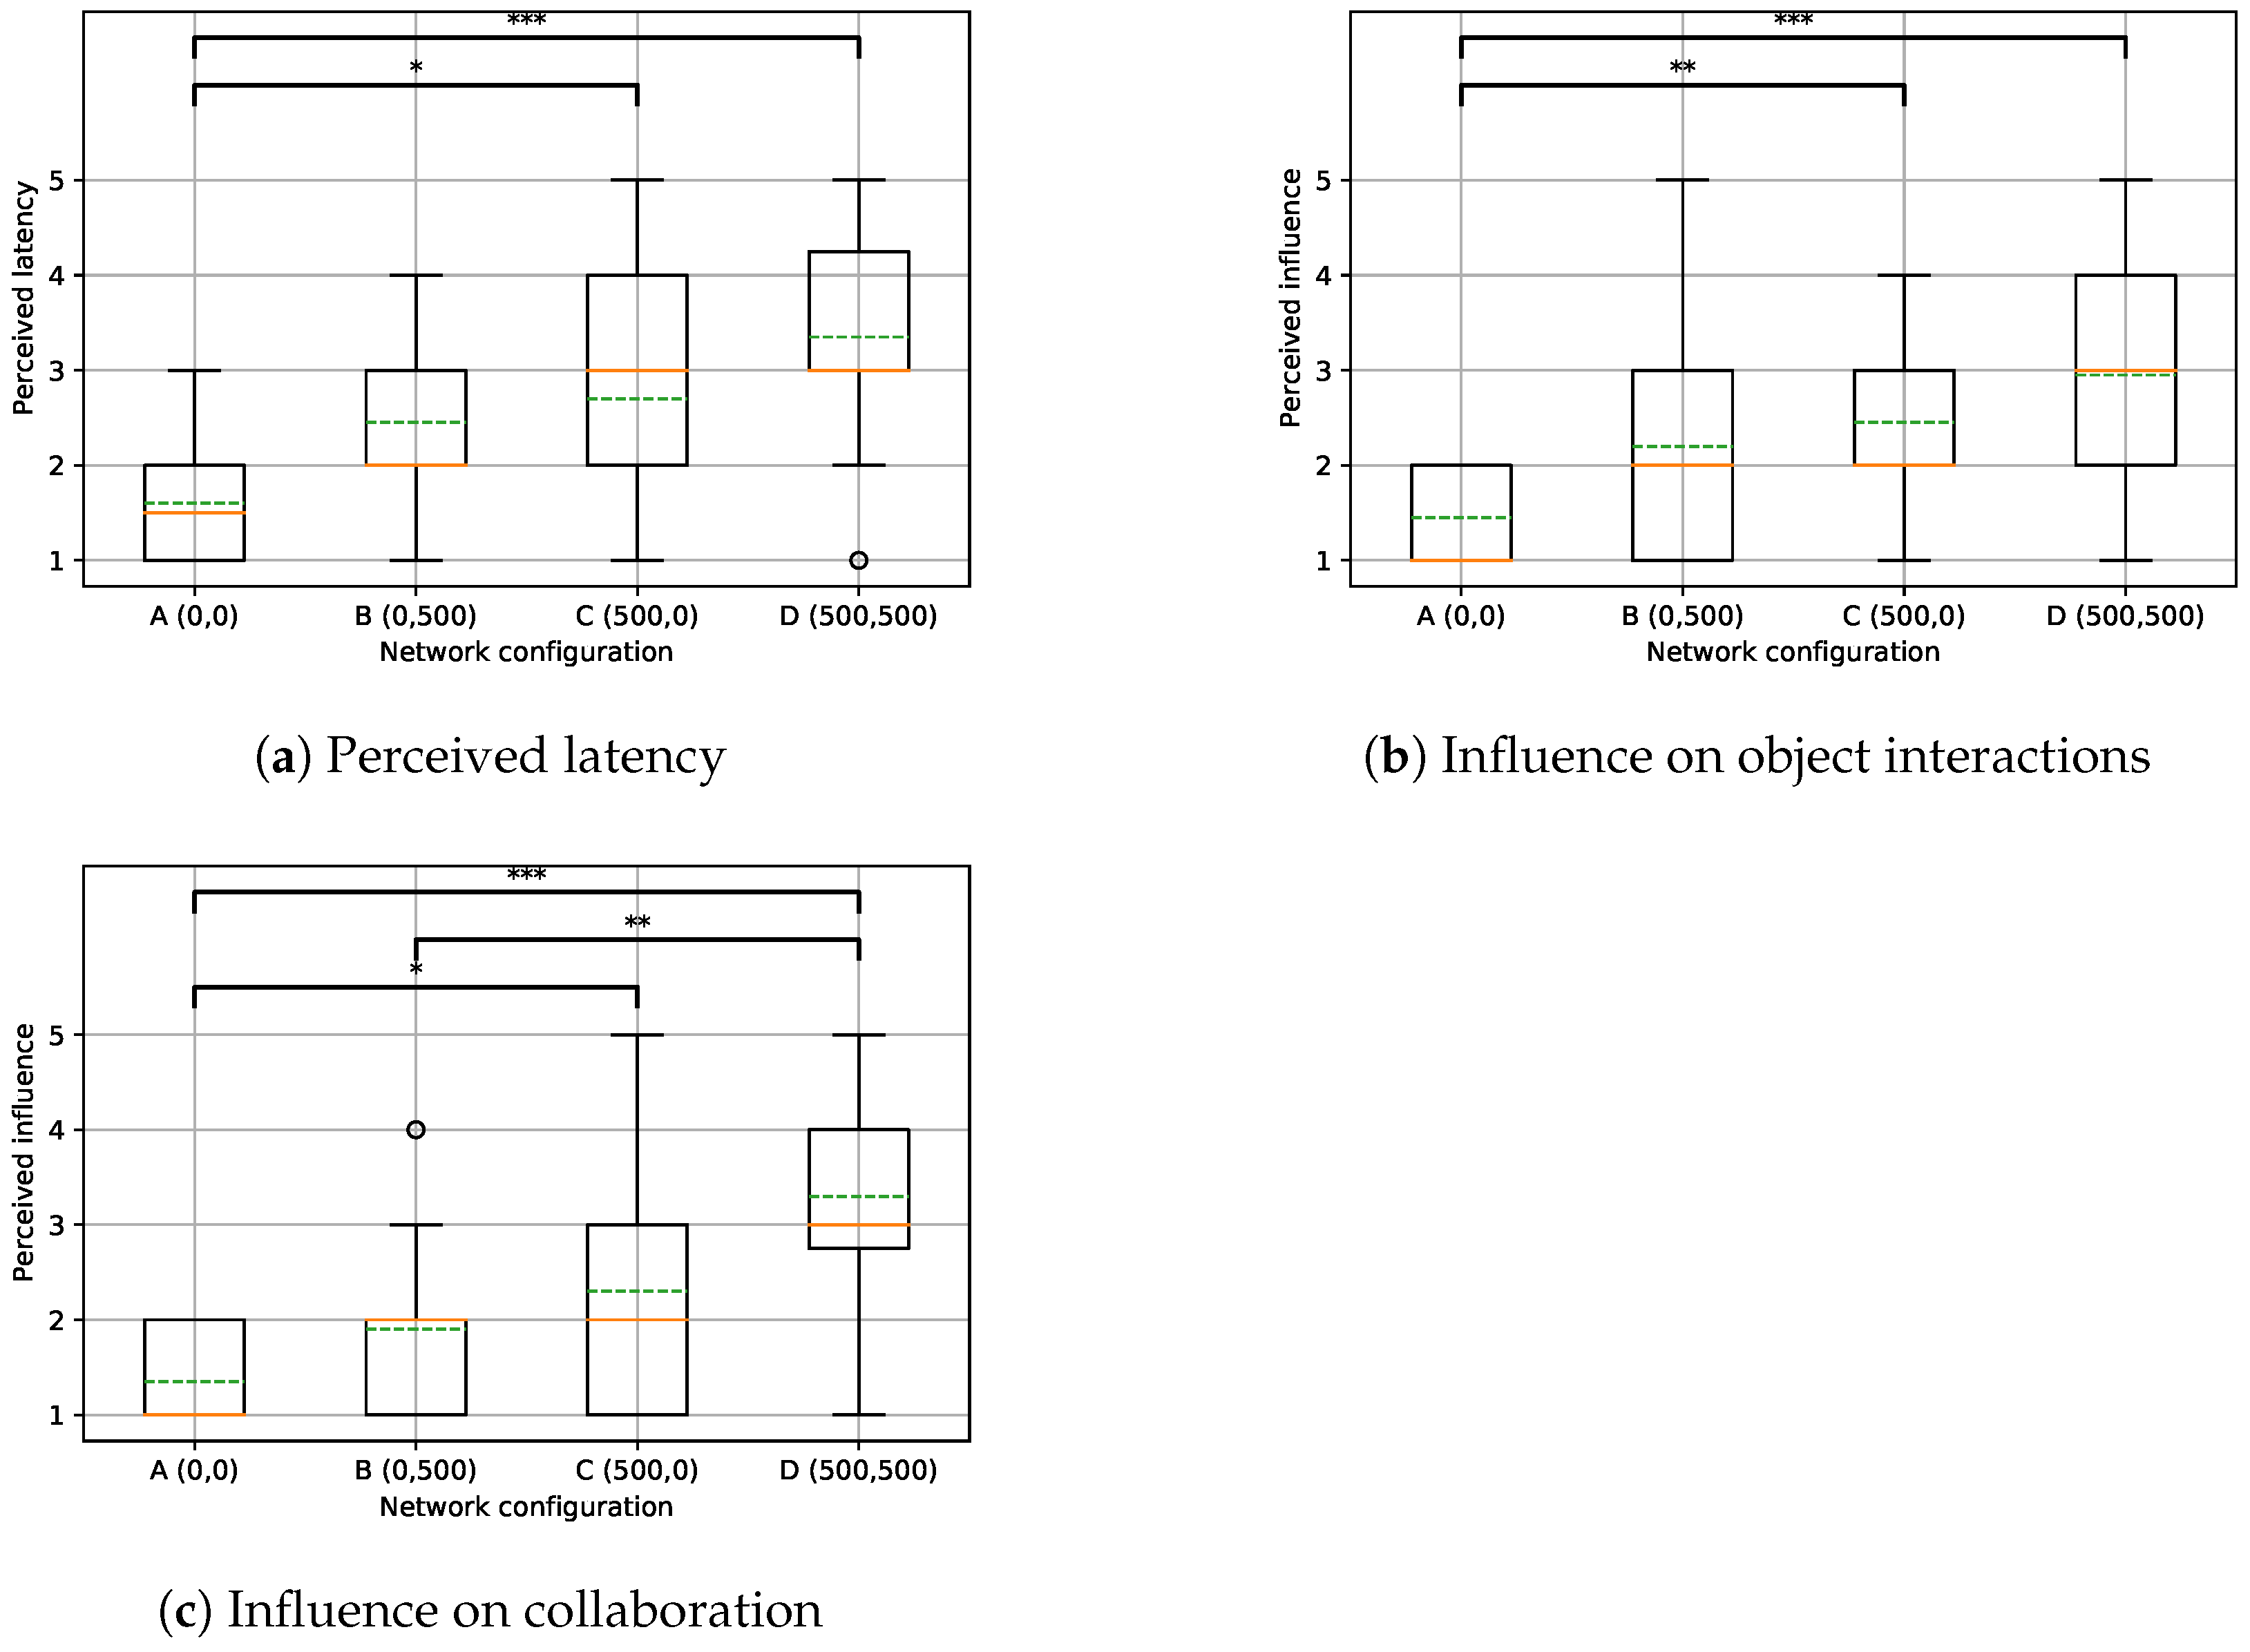
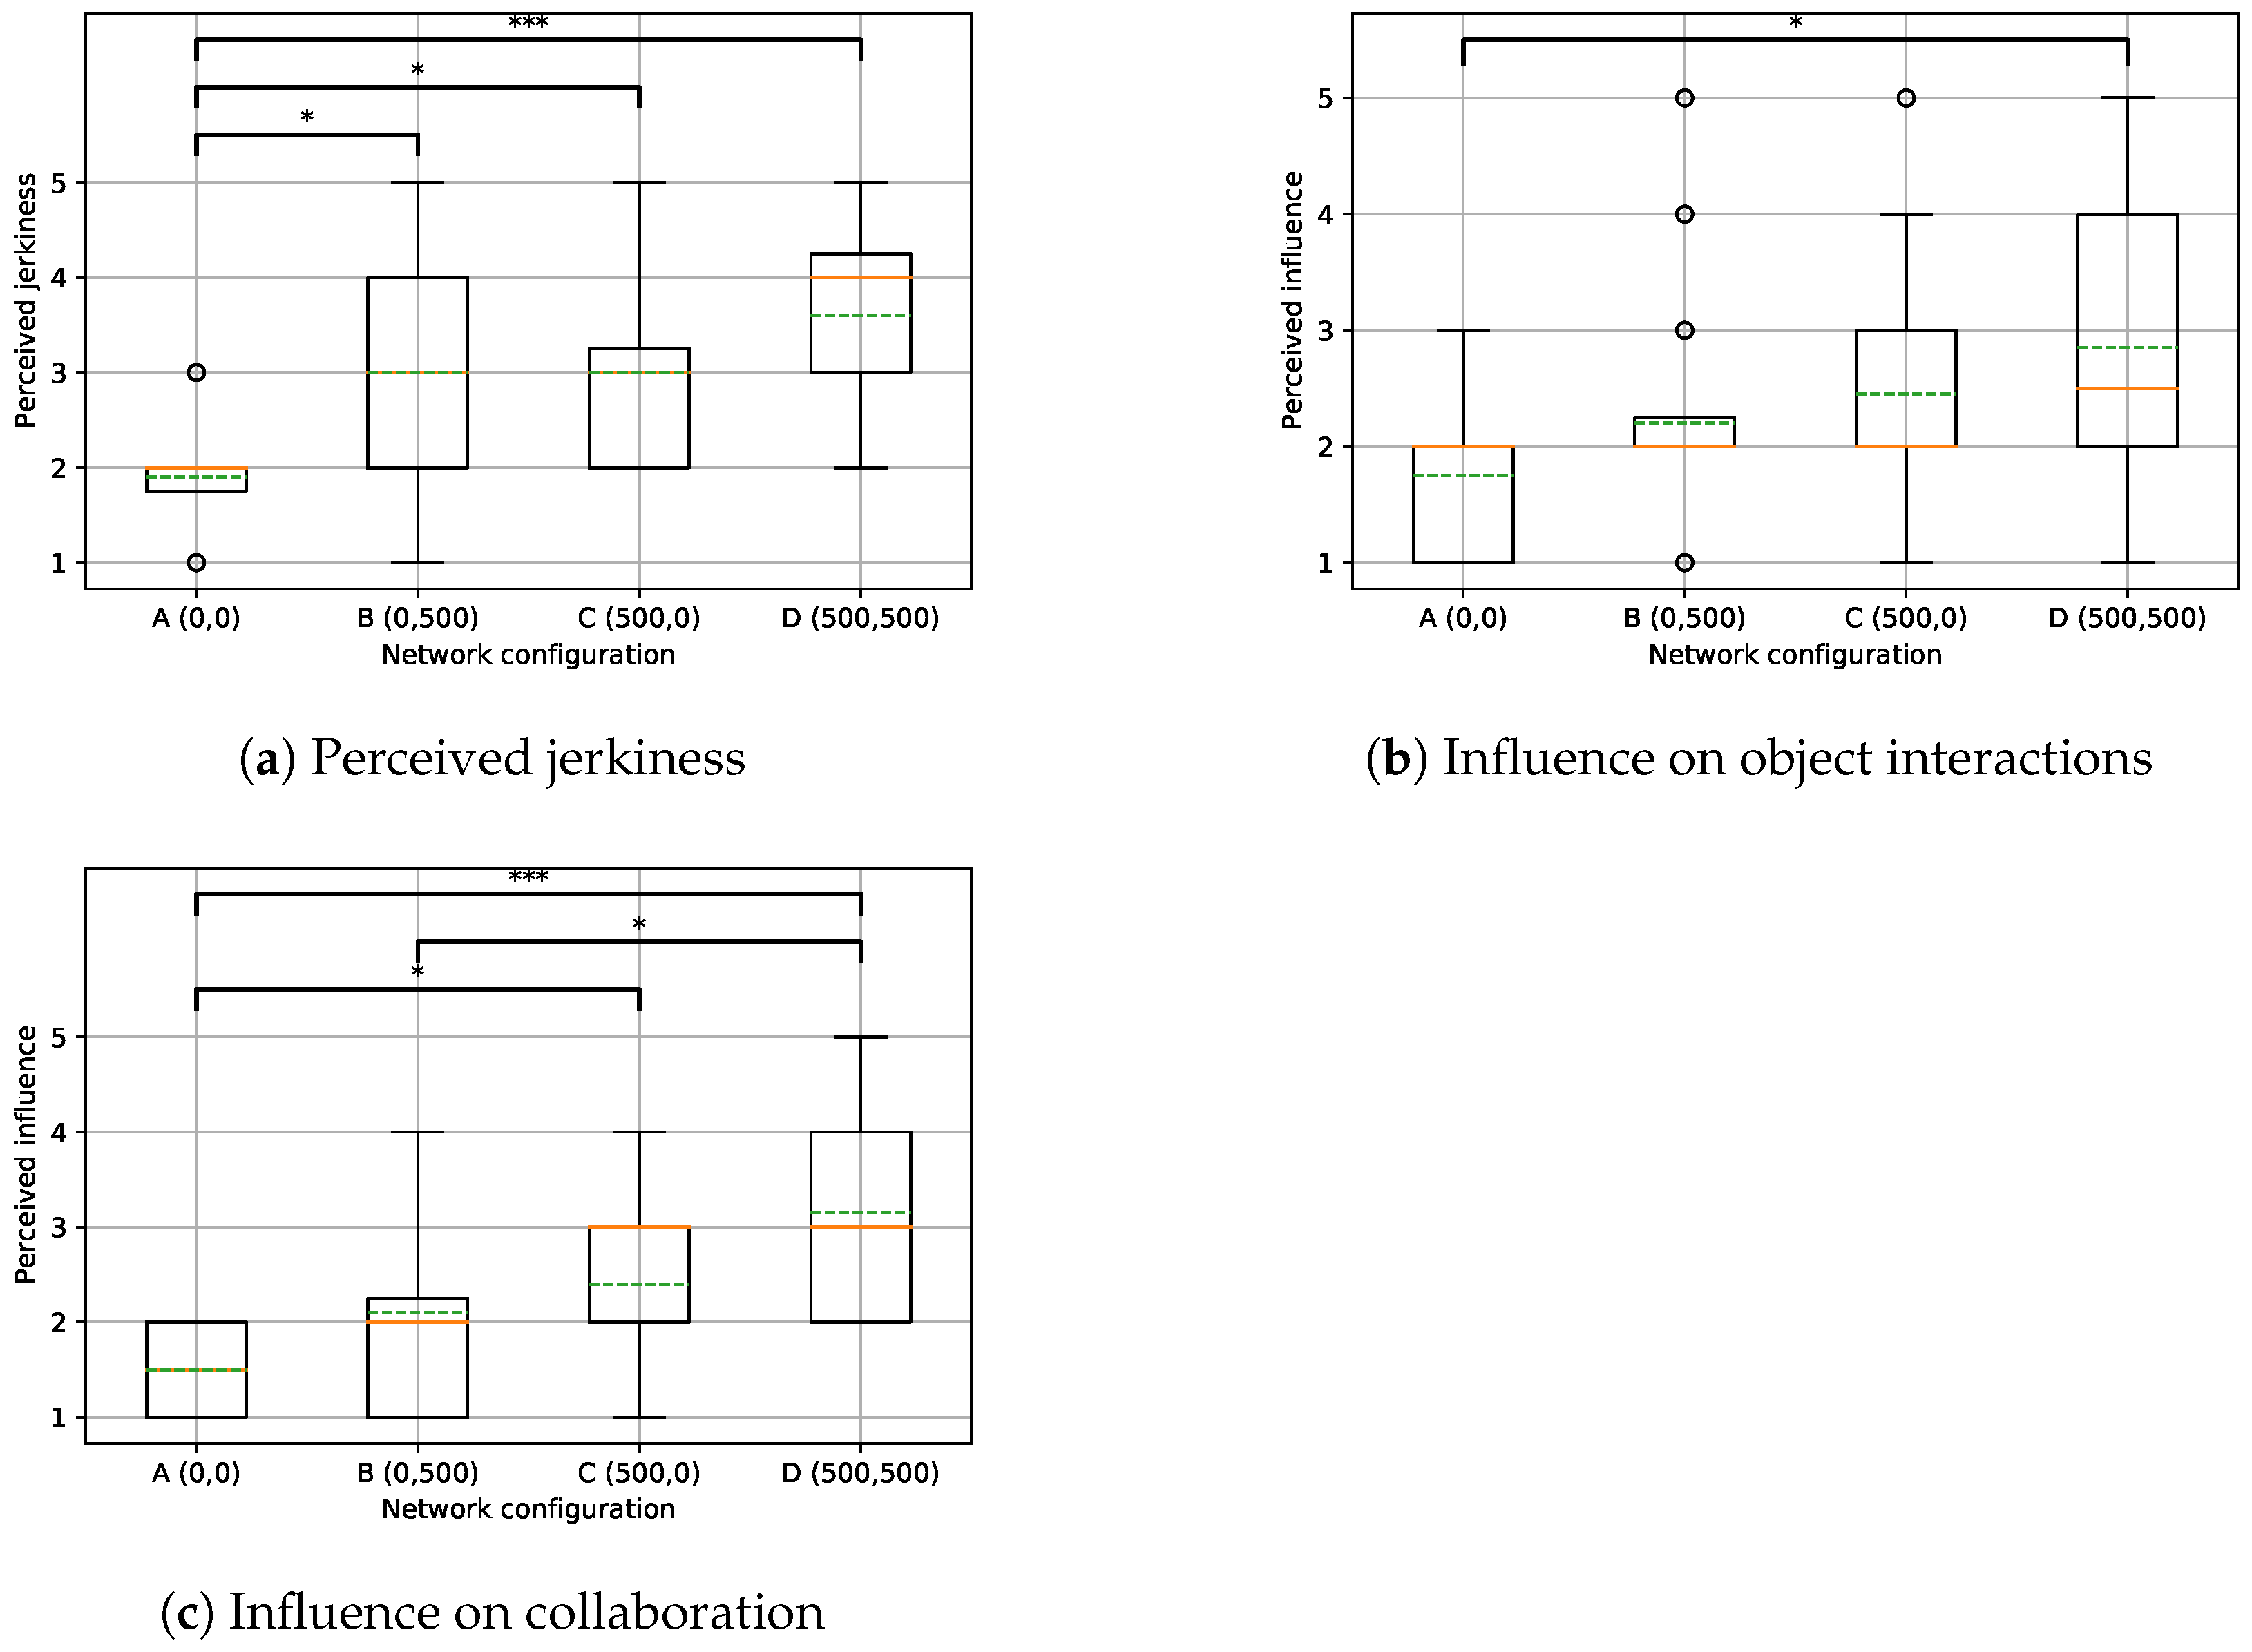
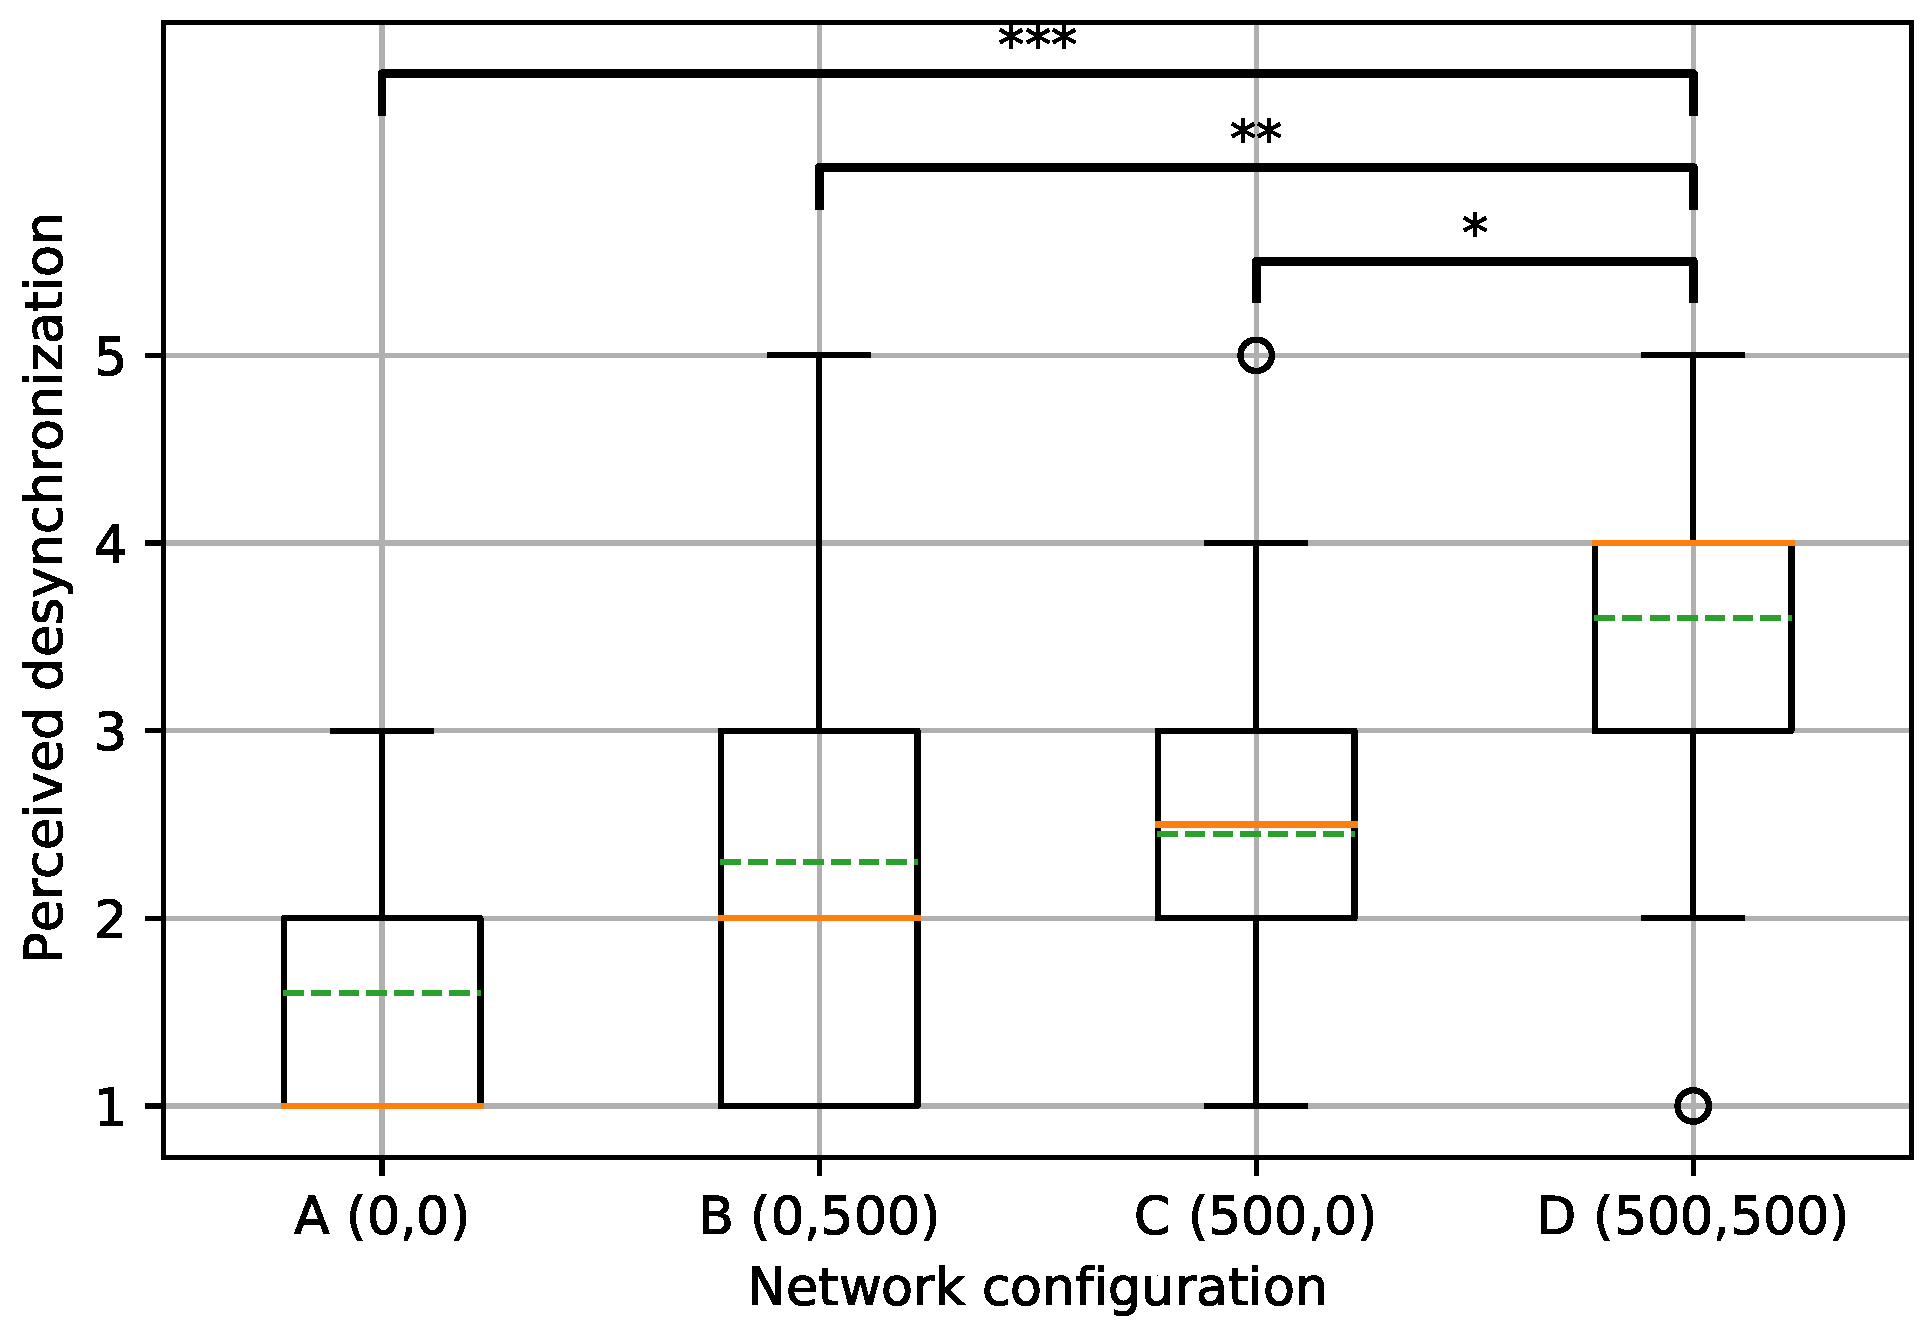
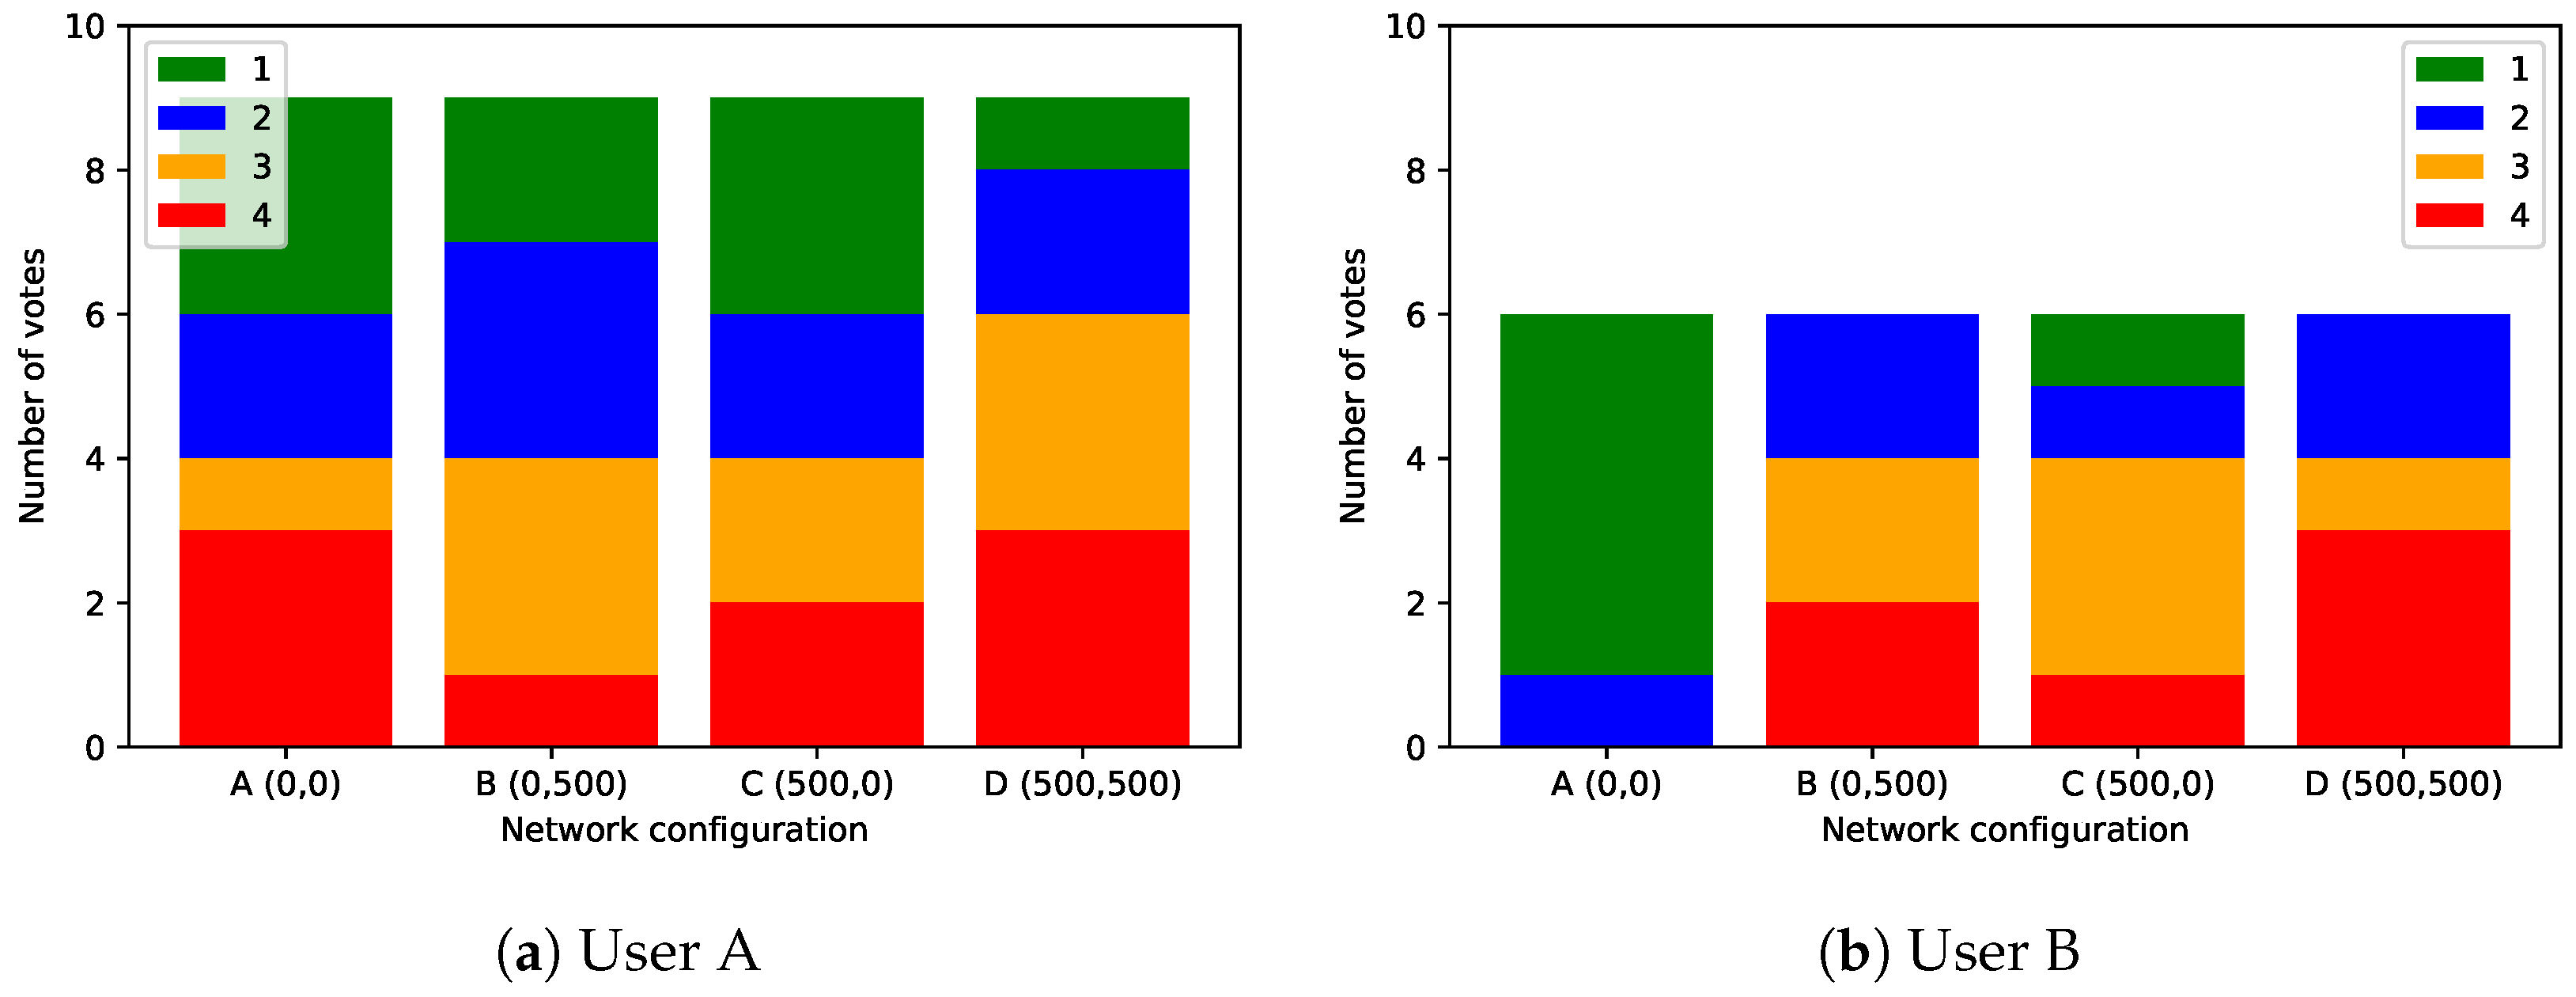
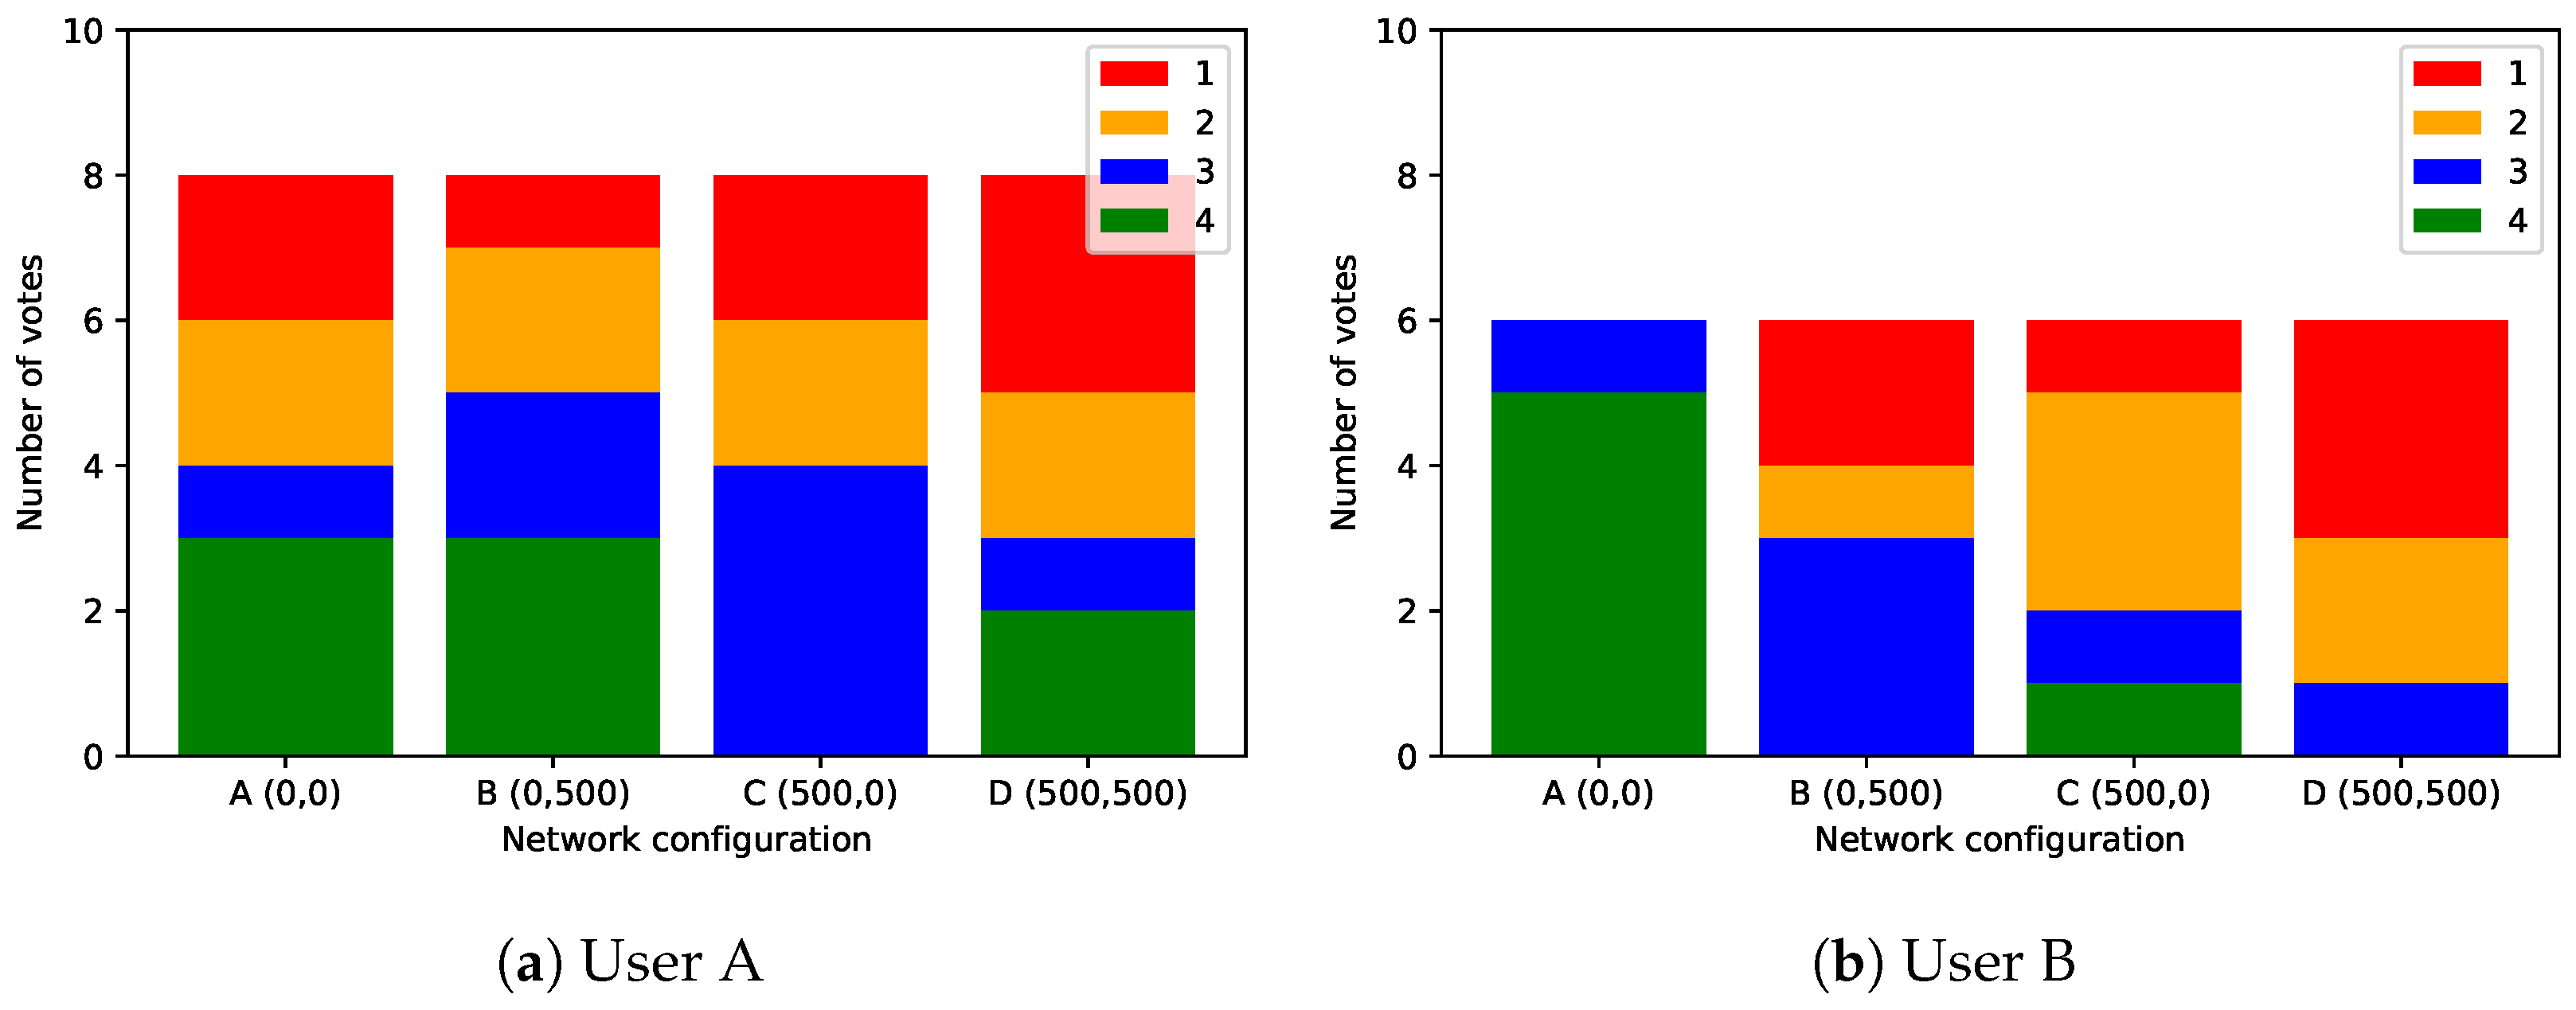
4.4.1. Perception of the Network

(1) Latency: Figure 10 illustrates the subjective perception of latency in the system (“Did you notice latency in the system?”) in terms of the obtained distributions on a 1-to-5 Likert scale. Figure 10a illustrates to what extent subjects perceived latency in each of the four scenarios. A Friedman test for ordinal data was performed between the four scenarios to reveal any significant differences in the data. As the test indicated significance ( p < 0.001 ), a pair-wise Dunn–Bonferroni post hoc test was applied. This showed significant differences between scenarios A (no distortions) and C (latency) ( p < 0.05 ) and between A and D (latency and burst) ( p < 0.001 ). Note that this also implies that no significant difference was observed in perceived latency between scenarios B (burst) and C (latency), which is remarkable as only scenario C effectively contains latency. One possible explanation is that subjects do not have sufficient knowledge and/or expertise (despite the pre-session explanation) to distinguish between different impairment types and their manifestations in VR, with confusion between latency and jerkiness (i.e., the visual representation of burst) as a result. A second explanation is that scenarios B (burst) and C (latency), despite their distortions, are still playable and immersive enough such that the distinctions between both types of impairments are often overlooked. As such, subjects do have an intuition about the system being impaired but cannot really put their finger on the exact cause of the observed distortions.
Figure 10b,c illustrate how participants assess the influence of the perceived latency on the interaction with virtual objects (“To what extent did the latency (if any) interfere with the physical interaction with objects inside the virtual environment?”) and the collaboration with another participant (“To what extent did the latency (if any) interfere with the physical interaction with your collaborator inside the virtual environment?”), respectively. Here as well, Friedman tests were performed (both p < 0.001 ), followed by pair-wise Dunn–Bonferroni post hoc tests. Once again, the same observation can be made with regard to scenarios B (burst) and C (latency). As such, it can be concluded that the perceived latency in the system and its influence on interactions in the system are in line with each other, independent of whether object or collaborator interactions are considered.
(2) Burst: Figure 11 shows a similar analysis in terms of the perception of jerkiness (i.e., the visual manifestation of burst) in the system. As can be noticed from Figure 11a, only significant differences (Friedman, p < 0.001 ) in perception were observed between configuration A (the non-distorted experience) and each of the distorted counterparts (post hoc Dunn–Bonferroni test, p < 0.05 , p < 0.05 , p < 0.001 with B, C and D, respectively.). No mutually significant differences were observed between the distorted scenarios B (burst), C (latency), and D (burst + latency). This is remarkable, as scenario C does not include any burst impairments in contrast to scenarios B and D. This again supports the hypothesis that users are able to detect distortions in the system but are unable to distinguish between actual distortion types. Furthermore, it is also worth mentioning that the difference in perception between both user roles approaches significance (Mann–Whitney U, p = 0.092 ) for scenario B (burst), with user A showing higher jerkiness perception (median = 4) than User B (median = 2). This could be explained by User A spending more time observing User B then the other way around, as User B had a more intense task schedule and often had to turn away from User A to operate the oven. One would expect a similar observation in scenario D (burst + latency), however, which was found not to be the case (Mann–Whitney U, p = 0.458 ). In Figure 11c, indicating the perceived influence of jerkiness on collaboration, significant differences (Friedman, p < 0.001 ) were observed between scenario D (burst + latency) and scenarios A (no distortion) (Dunn–Bonferroni post hoc, p < 0.001 ) and B (burst) (Dunn–Bonferroni post hoc, p < 0.05 ). This is remarkable for scenario B (burst), which objectively speaking has the same amount of burst in the system as scenario D (burst + latency). As such, it seems that subjects grade the influence of given distortions based more on the accumulation of impairments (scenario D) rather than the actual amount of jerkiness in the system. Objectively speaking, this can be explained by the fact that the combination of burst and latency in scenario D can push latency up to 1000 ms half of the time, as was explained in Section 4.3. Subjectively, it is also possible that the presence of one impairment (latency) raises the awareness of other impairments in the system, making subjects more aware of jerkiness distortions in scenario D (burst + latency) than in scenario B (burst). This is in line with the observations regarding the perceived influence of jerkiness on object interaction (Figure 11b), in which a significant difference (Friedman, p < 0.05 ) between scenarios A (no distortions) and D (burst + latency) (Dunn–Bonferroni post hoc, p < 0.05 ) was observed. In addition, no statistical differences were observed between C (latency) and D (burst + latency), despite their objective difference in burst.
(3) Synchronization: Figure 12 shows the extent to which participants perceived synchronization (either spatial or temporal) between their own view of the virtual environment and that of their collaborator, e.g., based on oral communication during collaboration (“To what extent do you believe your collaborator and you had a synchronized view of the virtual environment?”). Strongly significant differences (Friedman, p < 0.001 ) were observed between scenario D (burst + latency) and each of the other scenarios (Dunn–Bonferroni post hoc, p < 0.001 , p < 0.01 and p < 0.05 for A, B, and D, respectively). Therefore, it seems that mainly the combination of both latency and burst seems to amplify subjects’ susceptibility to environment de-synchronizations between collaborators. Based on the weak significance between A (no distortions) and C (latency) (Dunn–Bonferroni post hoc, p = 0.064 ), one could argue that latency is the most prominent driving factor behind this observation. This makes sense, as latency is a distortion constantly present during interactions, allowing for easier observation of de-synchronizations, in contrast to the behavior of burst which catches up with reality within specific time frames.
(4) User preferences: Post-session, we asked users to rank the four scenarios (“Please order the network conditions of the playthroughs from most (1) to least (4) optimal to complete the given task.”), without revealing the actual configuration, from the most (1) to least (4) optimal network configuration to complete the given task (Figure 13). The preference towards the undistorted scenario A was clear for user role B, with five out of six users (four subjects did not fill in or incorrectly filled in the post-session questionnaire and were, therefore, excluded) ranking it as most optimal and one out of six putting it in second rank. This was not reflected in the ranks of user role A, however, where a much more mixed view was observed. Only three out of nine users (one subject was excluded) ranked it in first place, while the same number of subjects even considered it as the worst scenario. Less consensus existed for the other three scenarios for both roles, again supporting the claim that distinguishing between latency, burst, or the combination of both was not straightforward. However, one can still observe a more convinced assessment from User B with half of the users ranking configurations C (latency) and D (burst + latency) in third and fourth place, respectively. In addition, distorted scenarios were selected only once as the most optimal one (configuration C). This is in contrast to User A, where all of the ranks were distributed more or less equally over the configurations, indicating that these users were experiencing much more difficulties in distinguishing between the configurations. One can assume that the nature and level of interactivity of the particular user role and its assigned tasks played an important role in this. As user B had to rotate more in the virtual environment (i.e., for operating the oven) and had more tasks and interactions to fulfill, they can be considered to have been more prone to distortions in the system than was the case for User A.
(5) Task difficulty: The inability to make a distinction between distorted scenarios is also reflected in responses to the in-session question regarding the difficulty of the task given the current configuration (“How difficult would you rate this task in the given network conditions?”), as shown in Figure 14. Here as well, significant differences (Friedman, p < 0.001 ) were observed between scenarios A (no distortions)-B (burst) (Dunn–Bonferroni post hoc, p < 0.05 ) and A (no distortions)-D (burst + latency) (Dunn–Bonferroni post hoc, p < 0.001 ), while the difference between A (no distortions) and C (burst) approached significance (Dunn–Bonferroni post hoc, p = 0.631 ). No pairwise significant differences were observed between any of the other scenarios, neither were there any significant differences in difficulty perception between user roles.

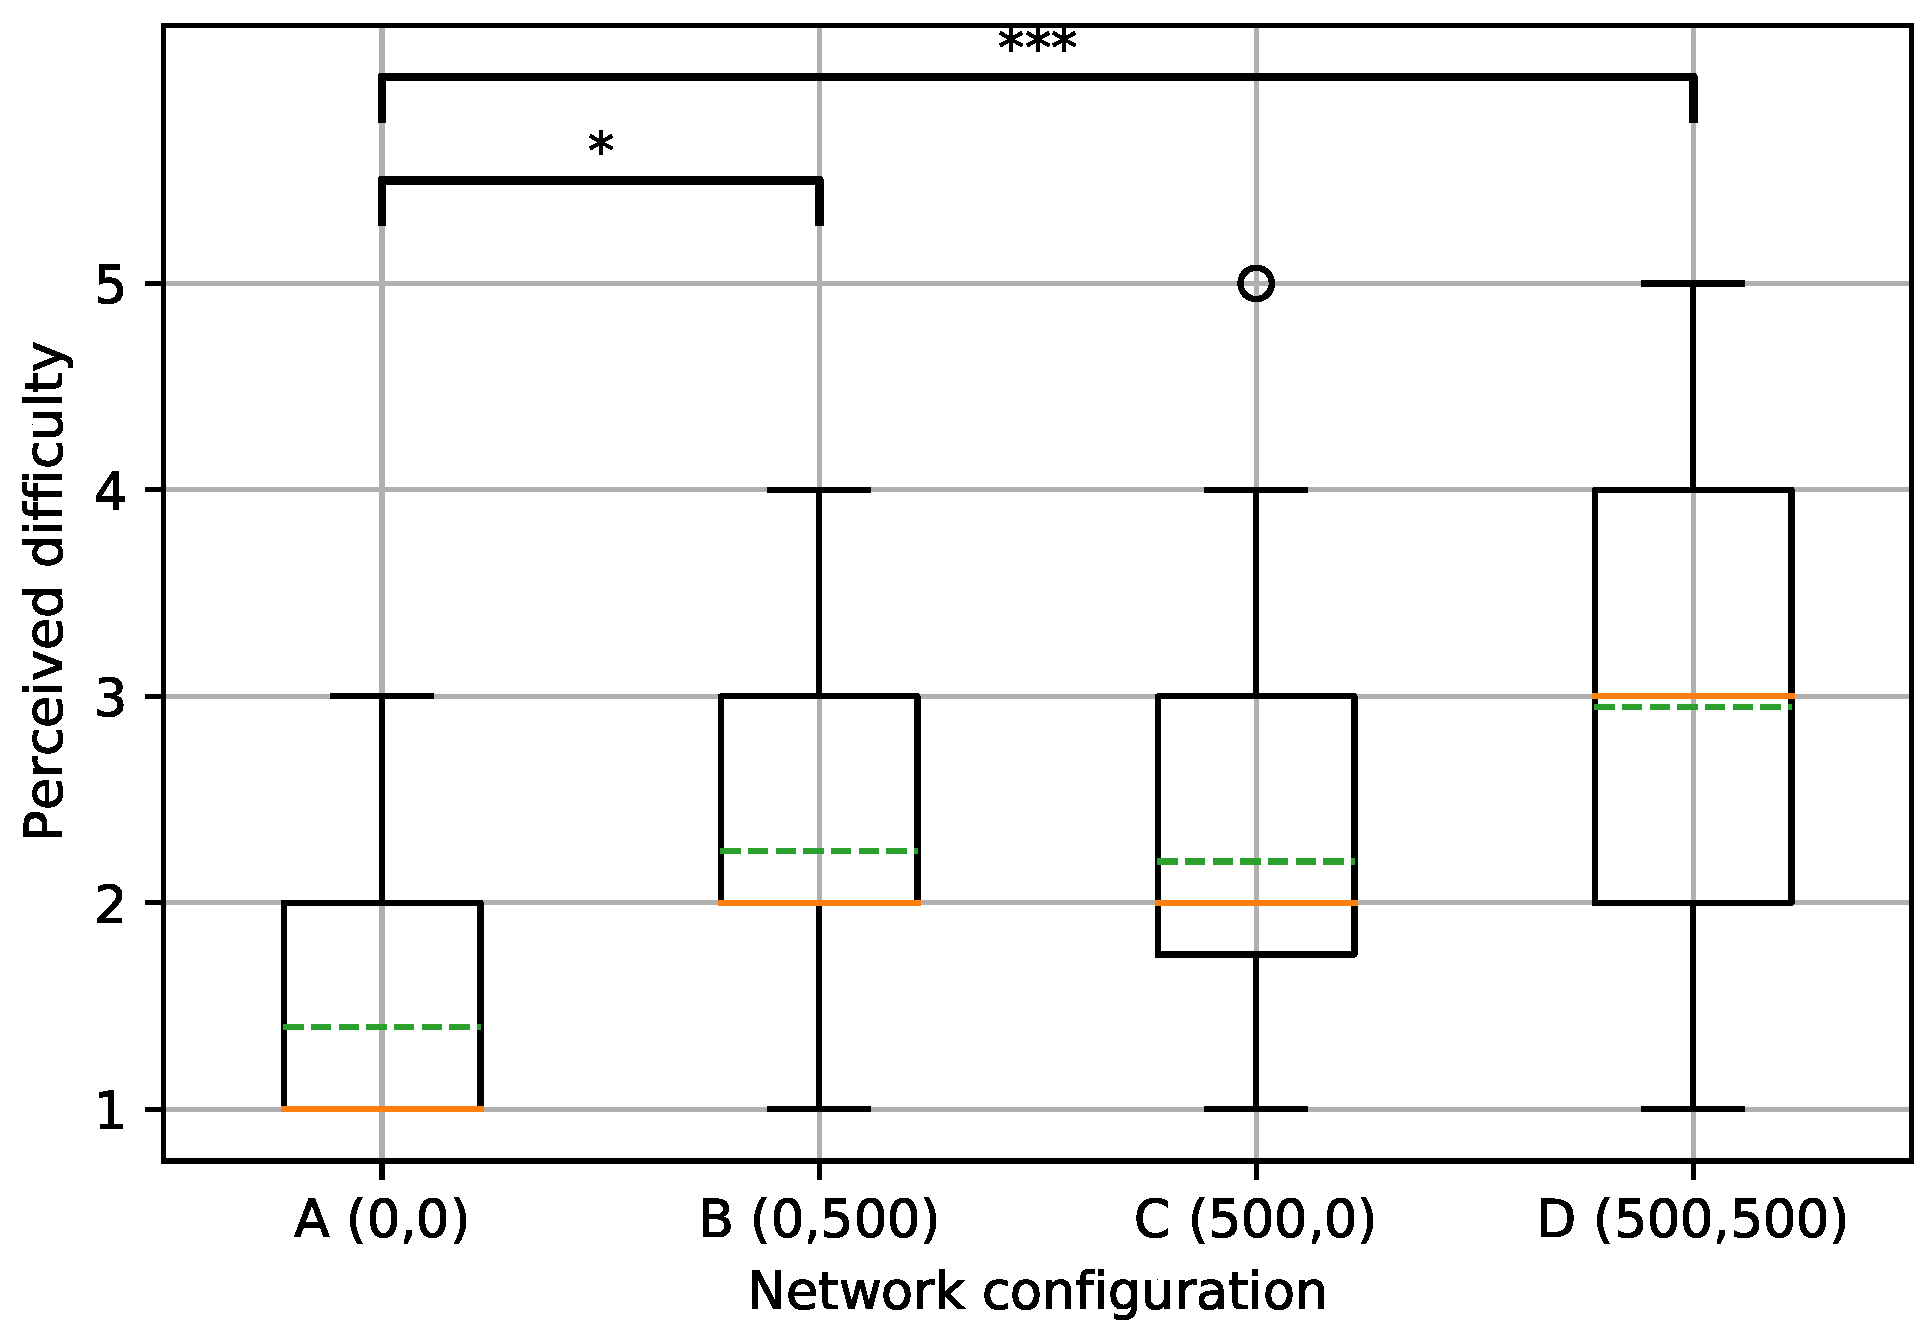
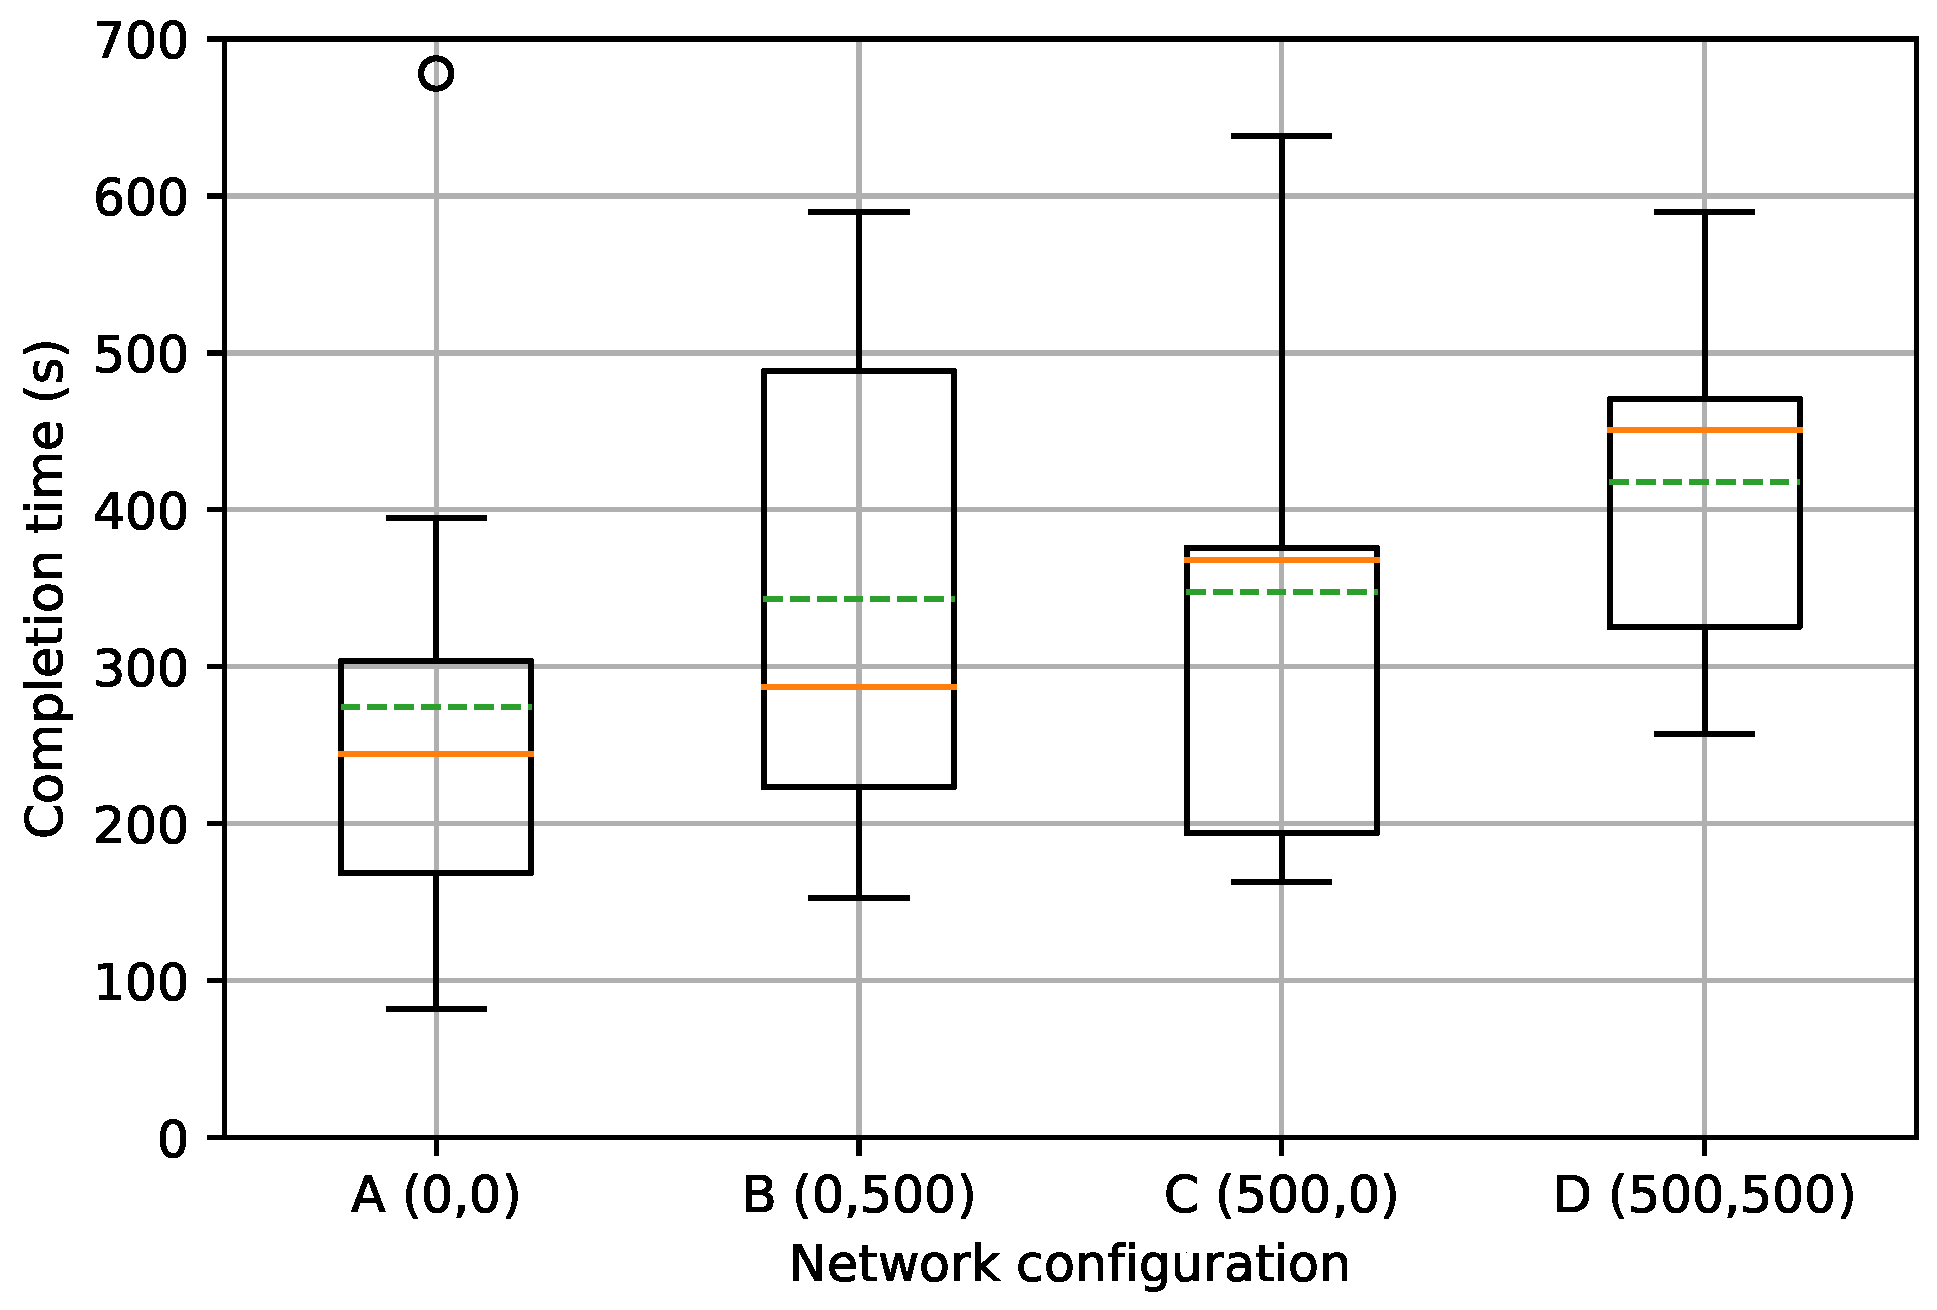
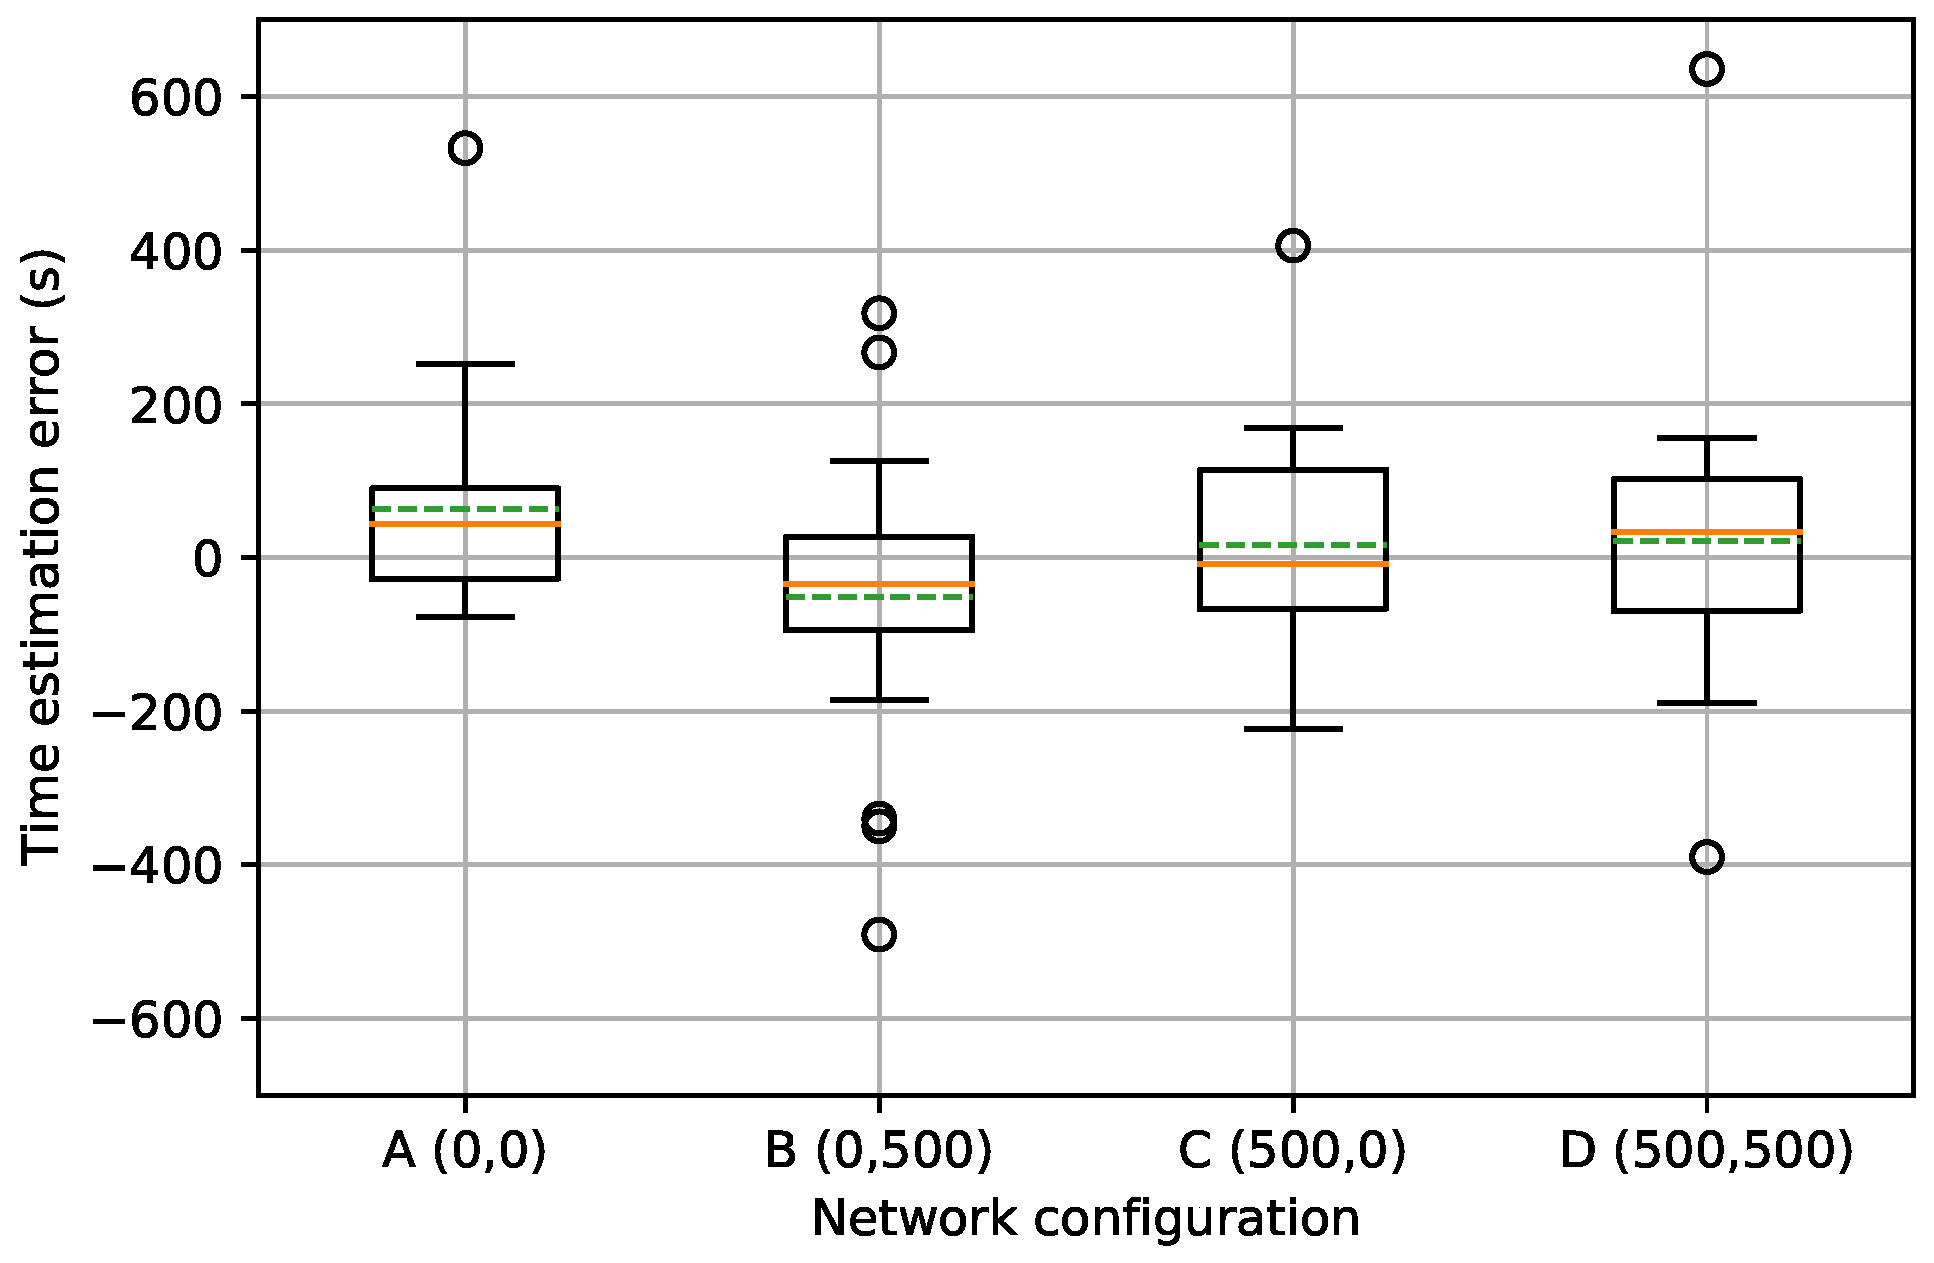
4.4.2. Completion Time and Subjective Time Perception

(1) Completion time: Figure 15 shows the distribution of completion times for each of the four network configurations. No significant differences were found (Repeated Measures Analysis of Variance (ANOVA): p = 0.136 ). This is an interesting finding as it indicates that, despite the clear differences in perception between scenarios as discussed in the previous section, this is not reflected in objective player performance. As such, it shows that participants have the ability to overcome the perceived distortions in order to complete the given task. Furthermore, it is also worth mentioning that the distribution of scenario C (latency) shows a strong positive skewness, in contrast to the more or less symmetrical distributions of the other scenarios. This indicates that, while the majority of the pairs were able to overcome the latency effects, performance was heavily affected by latency effects for a minority of them. This can be explained by the observed desynchronization between collaborators in the case of latency, as discussed earlier, for which one can assume that a minority of participants had severe issues handling these.
(2) Subjective time perception: Figure 16 shows the distribution of the difference between the estimated and the actual duration of the playthrough. No significant differences were found between the scenarios (Repeated Measures ANOVA: p = 0.368 ). However, it is worth mentioning that scenario A (no distortions) is the only network configuration for which the deviation from zero approaches significance (One-sample t-test: p = 0.055 ). In other words, there is weakly significant evidence that participants are consistently over-estimating the duration of the playthrough when immersed in scenario A (no distortions). This is a counter-intuitive observation. On the one hand, over-estimation of time duration has been shown to relate to a lack of immersion into the environment or engagement with the task at hand [28,29]. Increasing levels of distortion, on the other hand, are also known to decrease the degree of immersion and/or engagement. As such, one would expect this effect to be observed in scenario D (burst + latency) rather than scenario A (no distortions). The longer time perception could also be increased by a higher level of cybersickness [30]. However, no significant difference in cybersickness occurrence could be found in this study, as will be further discussed in Section 4.4.3. Research with respect to other influence factors in this regard, such as the multi-user context, is currently scarce in the literature. As such, deriving a coherent explanation for this observation is an interesting direction for further research.

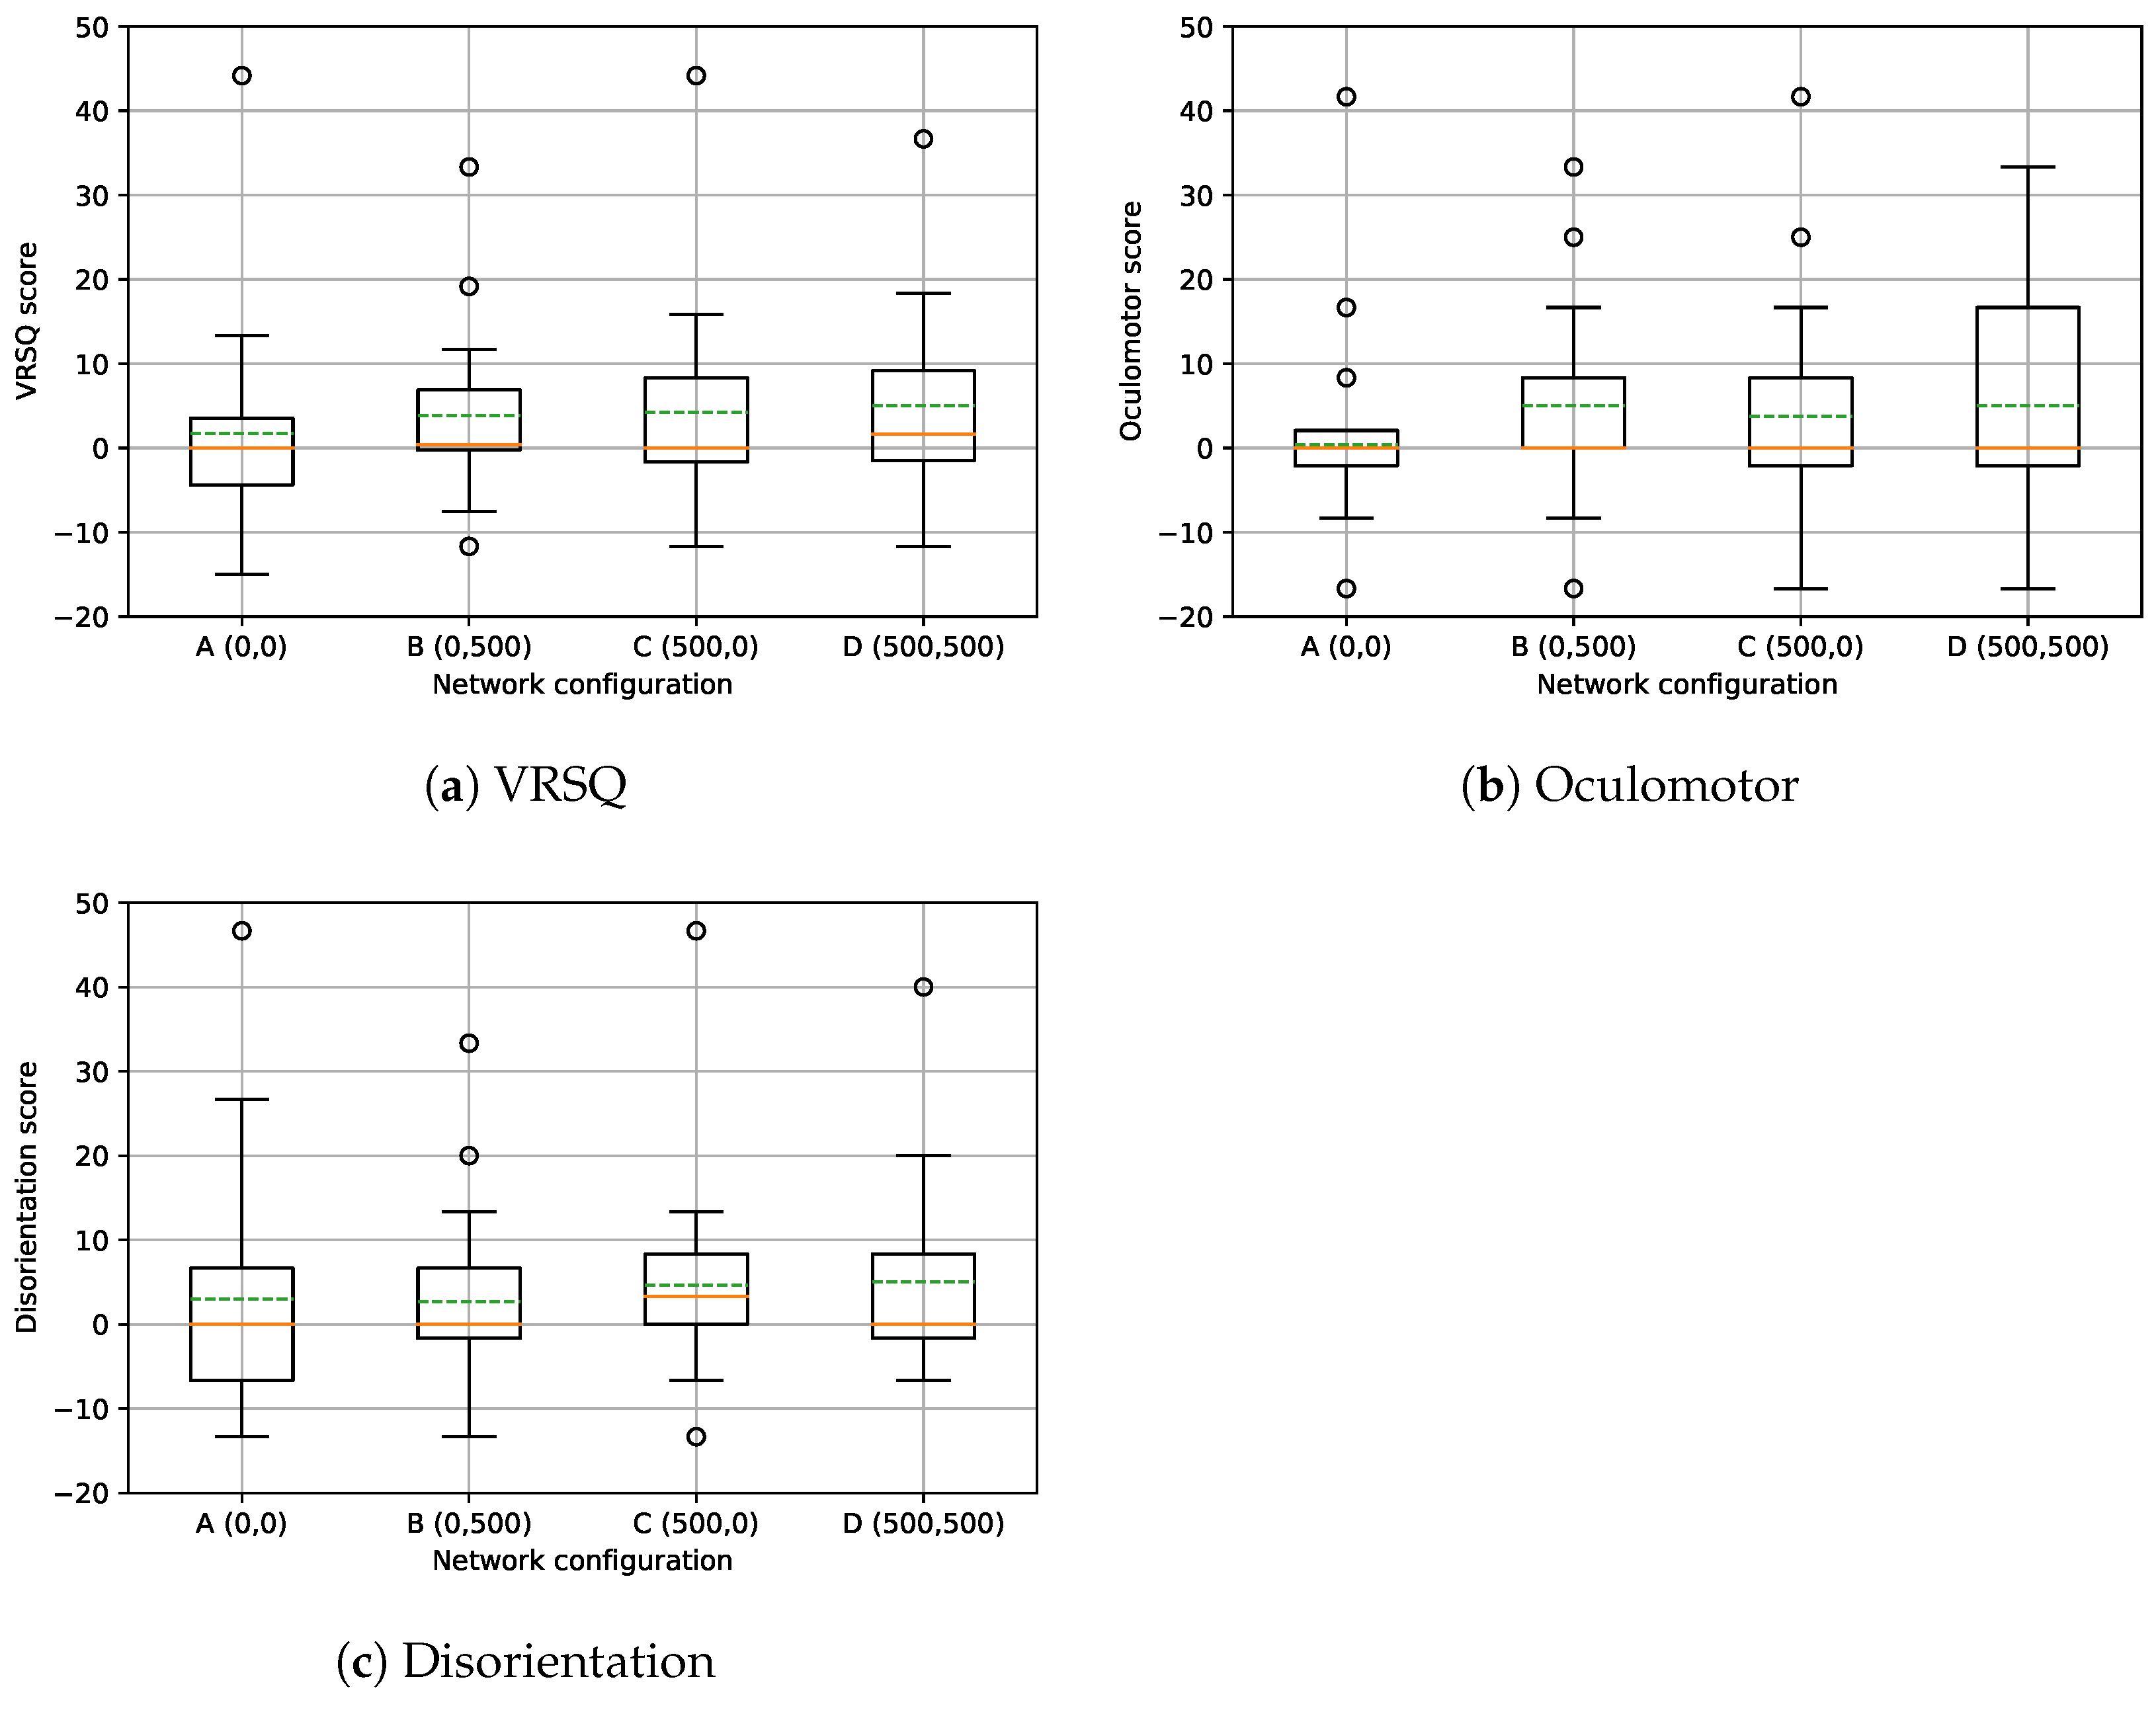
4.4.3. Cybersickness

Figure 17 shows the distribution of the cybersickness scores for each scenario, calculated as the difference with the pre-session baseline VRSQ. Figure 17a shows the VRSQ score, while Figure 17b,c show the sub-scales relating to oculomotor and disorientation symptoms, respectively. No significant differences were found between the four scenarios for VRSQ, oculomotor or disorientation (Friedman: p = 0.219 , p = 0.223 and p = 0.645 , respectively). For each of the three, however, scenario D (burst + latency) approaches significance regarding its difference from 0 (Wilcoxon signed rank test, p = 0.084 ; p = 0.081 and p = 0.061 , respectively). As such, this indicates a weakly significant increase in cybersickness symptoms with respect to the baseline questionnaire. As configuration B (burst) also shows a p-value of p = 0.097 (Wilcoxon signed rank test) regarding oculomotor symptoms, burst effects inducing oculomotor symptoms seem to be the main representation of cybersickness in this experience. It is also interesting to note that scenarios A (no distortions) and B (burst) show a weakly significant higher occurrence of disorientation symptoms for User B compared to User A (Mann–Whitney U, p = 0.090 and p = 0.116 for A and B, respectively). A possible explanation is the fact that User B has to rotate more in the environment as they have to perform actions both at the table and the oven (which are oriented opposite to each other), therefore making this user role more susceptible to disorientation with regard to the real, physical world. However, as this difference is shown to be less pronounced for scenarios C (latency) and D (burst + latency), it seems that the presence of latency in the system is counteracting this phenomenon to some extent. As the feeling of presence inside a virtual environment is known to be correlated with the probability of cybersickness occurrence, one can assume that latency has a greater effect on the degradation of presence in multi-user VR than is the case for burst. Additional research is required, however, to confirm this assumption. Nevertheless, both burst and latency are shown to play a role with respect to cybersickness—on the one hand, burst is shown to be the main inducer of oculomotor effects, while on the other hand, latency is shown to counteract feelings of disorientation.
In Figure 18, the results of the post-session question are shown in which users were asked to rank the four scenarios, without revealing the actual configuration, from most (1) to least (4) sickness-inducing (“Please order the playthroughs from most (1) to least (4) sickness-inducing”). Similar to Figure 13, a clear preference towards scenario A (no distortions) can be observed for User B, with five out of six subjects (four subjects did not fill in or incorrectly filled in the post-session questions) considering it as the least cybersickness-inducing scenario. For user role A, though, four out of eight participants (two subjects were excluded) considered scenario A (no distortions) to be the most or second to most cybersickness-inducing scenario.The same observation can be made for configuration D. Five out of six subjects with user role B considered configuration D (burst + latency) to be at least one of the two worst scenarios regarding cybersickness, and none of the subjects considered it to be the best. For user role A, though, three out of eight subjects assessed scenario D (burst + latency) to be the least or second to least cybersickness-inducing scenario. Similar observations can be made for scenarios B (burst) and C (latency). Once again, we hypothesize that this is a direct result of the nature and interactivity of the particular role at hand. As User B’s tasks induce more movement and interaction, they become more prone to cybersickness. This occurs in both a direct matter (due to the additional movement) and an indirect matter as the increased awareness of network distortions (Section 4.4.1) also alters the risk of cybersickness occurrence.

5. Conclusions

In this work, we have presented a networked multi-user and multi-device collaborative VR, which enables two simultaneous users to work together in a virtual environment to bake a virtual pizza. To this end, a multi-device server-based synchronizing architecture was presented and the most prominent network parameters (latency and throughput) were analysed. In addition, the results of a user study, evaluating the influence of multiple network distortions on end-user perception, performance and collaboration, subjective time perception, and the occurrence of cybersickness, were presented. The results show that users were able to easily distinguish between distorted and non-distorted network configurations, but that making a distinction between different types of distortions was much less straightforward. This suggests that for multi-user VR systems too a perception threshold for both latency and burst seems to exist. Nevertheless, the combination of both latency and burst has important repercussions in some cases, which may have both an objective and subjective underlying cause. As such, additional experiments to further explore the evaluation space and identify these perception thresholds are required and are, therefore, envisioned as an interesting direction for further research.
Moreover, the user’s role in the experience and their tasks, interactivity, and movement were shown to have an important influence on the subjective level of perception, the strength of preferences, and the occurrence of cybersickness symptoms, despite the absence of notable differences in the objective system and user performance. It would also be interesting to conduct additional, in-depth experiments in order to craft objective metrics of interactivity in VR and to investigate their relationship to subjective quality, time perception, and cybersickness with respect to the context of the task and use case at hand. As such, these objective metrics could be taken into account by VR designers to objectively, and optionally in real-time, monitor network and end-user characteristics and their influence on each other. Over time, this should lead to the creation of collective perception metrics that model the QoE of the group as a whole rather than at the individual level. This would create the possibility of dynamically counteracting any (expected) drops in group dynamics and performance by means of smart interventions in the transmission system and/or virtual environment.
Some limitations of the presented study need to be mentioned. First of all, the pool of test subjects exhibits a bias towards academic environments, scientific backgrounds, and technological proficiency. Although the majority of the subjects indicated that they had little prior experience with VR, it is not implausible that the aforementioned factors exerted an influence on the obtained results. It is recommended, therefore, that further validation is undertaken to derive conclusions based on a more heterogeneous pool of test subjects.
In addition, the required pace and movement from the end-user perspective is limited to the current collaborative use case. As different levels of interaction and movement could also affect end-user perception and valuation, repetition of the conducted evaluation in a more fast-paced environment with different interpretations of the user roles is desirable to gain more understanding of the influence of these contextual factors.

Author Contributions

Conceptualization, all authors; methodology, S.V.D., J.S. and M.T.V.; software, S.V.D. and J.S.; validation, S.V.D. and J.S.; formal analysis, S.V.D.; investigation, S.V.D. and J.S.; resources, S.V.D., J.S., F.D.T. and M.T.V.; data curation, S.V.D. and J.S.; writing—original draft preparation, S.V.D.; writing—review and editing, all authors; visualization, S.V.D. and J.S.; supervision, F.D.T. and M.T.V.; project administration, F.D.T. and M.T.V.; funding acquisition, S.V.D., S.S., Q.W., R.T., F.D.T. and M.T.V. All authors have read and agreed to the published version of the manuscript.

Funding

Sam Van Damme is funded by the Research Foundation Flanders (FWO) (Brussels, Belgium), grant number 1SB1822N. This research is also partially funded by the FWO WaveVR project, grant number G034322N.

Data Availability Statement

The Unity platform described in this work is accessible via https://github.com/mj-sam/CVR_cooking.git, (accessed on 5 March 2024). The data relating to user completion times, subjective evaluations, and Wireshark traces are publicly available at https://cloud.ilabt.imec.be/index.php/s/3gbZjbcZiK2F3Bg (accessed on 5 March 2024).

Acknowledgments

The authors wish to acknowledge the contributions of Violeta Mediavilla and Fangio Van de Velde, who have assisted in the development of the framework discussed in this paper.

Conflicts of Interest

Authors Susanna Schwarzmann, Qing Wei, and Riccardo Trivisonno are employed by the company Huawei Technologies, Germany. The remaining authors declare that the research was conducted in the absence of any commercial or financial relationships that could be construed as a potential conflict of interest.

References

  1. Damiani, L.; Demartini, M.; Guizzi, G.; Revetria, R.; Tonelli, F. Augmented and virtual reality applications in industrial systems: A qualitative review towards the industry 4.0 era. IFAC-PapersOnLine 2018, 51, 624–630. [Google Scholar] [CrossRef]
  2. Riva, G. Virtual Reality in Psychotherapy: Review. Cyberpsychol. Behav. 2005, 8, 220–230. [Google Scholar] [CrossRef] [PubMed]
  3. Xie, B.; Liu, H.; Alghofaili, R.; Zhang, Y.; Jiang, Y.; Lobo, F.D.; Li, C.; Li, W.; Huang, H.; Akdere, M.; et al. A Review on Virtual Reality Skill Training Applications. Front. Virtual Real. 2021, 2, 645153. [Google Scholar] [CrossRef]
  4. Vlahovic, S.; Suznjevic, M.; Skorin-Kapov, L. The Impact of Network Latency on Gaming QoE for an FPS VR Game. In Proceedings of the 2019 Eleventh International Conference on Quality of Multimedia Experience (QoMEX), Berlin, Germany, 5–7 June 2019; pp. 1–3. [Google Scholar] [CrossRef]
  5. Kojic, T.; Schmidt, S.; Möller, S.; Voigt-Antons, J.N. Influence of Network Delay in Virtual Reality Multiplayer Exergames: Who is actually delayed? In Proceedings of the 2019 Eleventh International Conference on Quality of Multimedia Experience (QoMEX), Berlin, Germany, 5–7 June 2019; pp. 1–3. [Google Scholar] [CrossRef]
  6. Unnikrishnan Radhakrishnan, K.K.; Chinello, F. A systematic review of immersive virtual reality for industrial skills training. Behav. Inf. Technol. 2021, 40, 1310–1339. [Google Scholar] [CrossRef]
  7. Lai, Z.; Hu, Y.C.; Cui, Y.; Sun, L.; Dai, N. Furion: Engineering High-Quality Immersive Virtual Reality on Today’s Mobile Devices. In Proceedings of the MobiCom’17: 23rd Annual International Conference on Mobile Computing and Networking, Snowbird, UT, USA, 16–20 October 2017; pp. 409–421. [Google Scholar] [CrossRef]
  8. Qian, F.; Han, B.; Xiao, Q.; Gopalakrishnan, V. Flare: Practical Viewport-Adaptive 360-Degree Video Streaming for Mobile Devices. In Proceedings of the MobiCom’18: 24th Annual International Conference on Mobile Computing and Networking, New Delhi, India, 29 October 2018–2 November 2018; pp. 99–114. [Google Scholar] [CrossRef]
  9. Ruan, J.; Xie, D. Networked VR: State of the Art, Solutions, and Challenges. Electronics 2021, 10, 166. [Google Scholar] [CrossRef]
  10. Guo, F.; Yu, F.R.; Zhang, H.; Ji, H.; Leung, V.C.M.; Li, X. An Adaptive Wireless Virtual Reality Framework in Future Wireless Networks: A Distributed Learning Approach. IEEE Trans. Veh. Technol. 2020, 69, 8514–8528. [Google Scholar] [CrossRef]
  11. Elvezio, C.; Ling, F.; Liu, J.S.; Feiner, S. Collaborative Virtual Reality for Low-Latency Interaction. In Proceedings of the UIST’18 Adjunct: 31st Annual ACM Symposium on User Interface Software and Technology, Berlin, Germany, 14 October 2018; pp. 179–181. [Google Scholar] [CrossRef]
  12. Van Damme, S.; Van de Velde, F.; Sameri, M.J.; De Turck, F.; Vega, M.T. A Haptic-Enabled, Distributed and Networked Immersive System for Multi-User Collaborative Virtual Reality. In Proceedings of the IXR’23: 2nd International Workshop on Interactive EXtended Reality, Ottawa, ON, Canada, 29 October 2023; pp. 11–19. [Google Scholar] [CrossRef]
  13. Venkatraman, K.; Raghuraman, S.; Tian, Y.; Prabhakaran, B.; Nahrstedt, K.; Annaswamy, T. Quantifying and Improving User Quality of Experience in Immersive Tele-Rehabilitation. In Proceedings of the 2014 IEEE International Symposium on Multimedia, Taichung, Taiwan, 10–12 December 2014; pp. 207–214. [Google Scholar] [CrossRef]
  14. Kusunose, Y.; Ishibashi, Y.; Fukushima, N.; Sugawara, S. QoE assessment in networked air hockey game with haptic media. In Proceedings of the 2010 9th Annual Workshop on Network and Systems Support for Games, Taipei, Taiwan, 16–17 November 2010; pp. 1–2. [Google Scholar] [CrossRef]
  15. Sithu, M.; Ishibashi, Y.; Huang, P.; Fukushima, N. QoE assessment of operability and fairness for soft objects in networked real-time game with haptic sense. In Proceedings of the 2015 21st Asia-Pacific Conference on Communications (APCC), Kyoto, Japan, 14–16 October 2015; pp. 570–574. [Google Scholar] [CrossRef]
  16. Becher, A.; Angerer, J.; Grauschopf, T. Negative effects of network latencies in immersive collaborative virtual environments. Virtual Real. 2020, 24, 369–383. [Google Scholar] [CrossRef]
  17. Pérez, P.; Gonzalez-Sosa, E.; Gutiérrez, J.; García, N. Emerging Immersive Communication Systems: Overview, Taxonomy, and Good Practices for QoE Assessment. Front. Signal Process. 2022, 2, 917684. [Google Scholar] [CrossRef]
  18. Waltemate, T.; Senna, I.; Hülsmann, F.; Rohde, M.; Kopp, S.; Ernst, M.; Botsch, M. The Impact of Latency on Perceptual Judgments and Motor Performance in Closed-Loop Interaction in Virtual Reality. In Proceedings of the VRST’16: 22nd ACM Conference on Virtual Reality Software and Technology, Munich, Germany, 2–4 November 2016; pp. 27–35. [Google Scholar] [CrossRef]
  19. Caserman, P.; Martinussen, M.; Göbel, S. Effects of End-to-end Latency on User Experience and Performance in Immersive Virtual Reality Applications. In Proceedings of the Entertainment Computing and Serious Games, Arequipa, Peru, 11–15 November 2019; van der Spek, E., Göbel, S., Do, E.Y.L., Clua, E., Baalsrud Hauge, J., Eds.; Springer: Cham, Switzerland, 2019; pp. 57–69. [Google Scholar]
  20. Brunnström, K.; Sjöström, M.; Imran, M.; Pettersson, M.; Johanson, M. Quality of Experience for a Virtual Reality Simulator. In Proceedings of the IS and T International Symposium on Electronic Imaging Science and Technology 2018, Burlingame, CA, USA, 28 January–1 February 2018. [Google Scholar]
  21. Concannon, D. Evaluating the Impact of Network Delay on User Quality of Experience of an Interactive Virtual Reality Industry 4.0 Application. Ph.D. Thesis, Athlone Institute of Technology, Athlone, Ireland, 2020. [Google Scholar]
  22. Larsson, S. Subjective Tests for Quality of Experience in Streamed Virtual Reality Games. Ph.D. Thesis, Luleå University of Technology, Luleå, Sweden, 2023. [Google Scholar]
  23. Roth, C.; Luckett, E.; Jones, J.A. Latency Detection and Illusion in a Head-Worn Virtual Environment. In Proceedings of the 2020 IEEE Conference on Virtual Reality and 3D User Interfaces Abstracts and Workshops (VRW), Atlanta, GA, USA, 22–26 March 2020; pp. 215–218. [Google Scholar] [CrossRef]
  24. Roberts, D.; Duckworth, T.; Moore, C.; Wolff, R.; O’Hare, J. Comparing the End to End Latency of an Immersive Collaborative Environment and a Video Conference. In Proceedings of the 2009 13th IEEE/ACM International Symposium on Distributed Simulation and Real Time Applications, Singapore, 25–28 October 2009; pp. 89–94. [Google Scholar] [CrossRef]
  25. Wu, S.; Chen, X.; Fu, J.; Chen, Z. Efficient VR Video Representation and Quality Assessment. J. Vis. Commun. Image Represent. 2018, 57, 107–117. [Google Scholar] [CrossRef]
  26. Kim, H.K.; Park, J.; Choi, Y.; Choe, M. Virtual reality sickness questionnaire (VRSQ): Motion sickness measurement index in a virtual reality environment. Appl. Ergon. 2018, 69, 66–73. [Google Scholar] [CrossRef] [PubMed]
  27. Clark, J.H. The Ishihara Test for Color Blindness. Am. J. Physiol. Opt. 1924, 5, 269–276. [Google Scholar]
  28. Csikszentmihalyi, M. Play and Intrinsic Rewards. In Flow and the Foundations of Positive Psychology: The Collected Works of Mihaly Csikszentmihalyi; Springer: Dordrecht, The Netherlands, 2014; pp. 135–153. [Google Scholar] [CrossRef]
  29. Agarwal, R.; Karahanna, E. Time Flies When You’re Having Fun: Cognitive Absorption and Beliefs about Information Technology Usage. MIS Q. 2000, 24, 665–694. [Google Scholar] [CrossRef]
  30. Lugrin, J.L.; Unruh, F.; Landeck, M.; Lamour, Y.; Latoschik, M.E.; Vogeley, K.; Wittmann, M. Experiencing Waiting Time in Virtual Reality. In Proceedings of the VRST’19: 25th ACM Symposium on Virtual Reality Software and Technology, Parramatta, NSW, Australia, 12–15 November 2019. [Google Scholar] [CrossRef]
Figure 1. Schematic overview of the system architecture. Numbers 1–4 indicate hardware components, while letters a–e indicate transport protocols and software components.
Applsci 14 02290 g001
Figure 2. The virtual environment at the start of the experience.
Applsci 14 02290 g002
Figure 3. Schematic overview of the multiple steps to be taken during the collaborative task. These are numbered 1–13 in the order they need to be performed as discussed above. Arrows indicate object transformations, e.g., combining water and flour to a ball of dough in (1).
Applsci 14 02290 g003
Figure 4. Schematic overview of the experimental flow of a single experimental session.
Applsci 14 02290 g004
Figure 5. Distributions of the measured downlink and uplink throughput, over all playthroughs, for both user roles in configuration A (0,0). The full orange line indicates the median, the green dotted line the mean.
Applsci 14 02290 g005
Figure 6. Distributions of the measured downlink and uplink throughput, over all playthroughs, for each network configuration. The full orange line indicates the median, the green dotted line the mean.
Applsci 14 02290 g006
Figure 7. Evolution of the obtained throughput over time, for each link and each network configuration, of a randomly selected session. Note the different y-scale of configuration A for readability.
Applsci 14 02290 g007
Figure 8. Distributions of the measured latency, over all playthroughs, for each link and each network configuration. The full orange line indicates the median, the green dotted line the mean.
Applsci 14 02290 g008
Figure 9. Histogram illustrating the bimodal nature of the latency distribution on the downlink in configuration D.
Applsci 14 02290 g009
Figure 10. Overview of the perceived latency in the system (a) and its assessed influence on object interaction (b) and collaboration (c), all on a 1-to-5 Likert scale, where a higher score indicates a more obvious presence/influence of latency. Significant differences are indicated as * ( p < 0.05 ), ** ( p < 0.01 ) and *** ( p < 0.001 ), respectively, as obtained from Friedman tests followed by Dunn–Bonferroni post hoc tests. The full orange line indicates the median, the green dotted line the mean. The bullets indicate outliers, which are defined as samples laying outside the interval [ Q 1 1.5 · IQR , Q 3 + 1.5 · IQR ] , with IQR the Interquartile Range defined as IQR = Q 3 Q 1 .
Applsci 14 02290 g010
Figure 11. Overview of the perceived jerkiness in the system (a) and its assessed influence on object interaction (b) and collaboration (c), all on a 1-to-5 Likert scale, where a higher score indicates a more obvious presence/influence of jerkiness. Significant differences are indicated as * ( p < 0.05 ), and *** ( p < 0.001 ), respectively, as obtained from Friedman tests followed by Dunn–Bonferroni post hoc tests. The full orange line indicates the median, the green dotted line the mean. The bullets indicate outliers, which are defined as samples laying outside the interval [ Q 1 1.5 · IQR , Q 3 + 1.5 · IQR ] , with IQR the Interquartile Range defined as IQR = Q 3 Q 1 .
Applsci 14 02290 g011
Figure 12. Perceived de-synchronization between the participants own view of the virtual environment and the one of their collaborator, on a 1-to-5 Likert scale, where a higher score indicates more obvious desynchronization. Significant differences are indicated as * ( p < 0.05 ), ** ( p < 0.01 ) and *** ( p < 0.001 ), respectively, as obtained from Friedman tests followed by Dunn–Bonferroni post hoc tests. The full orange line indicates the median, the green dotted line the mean. The bullets indicate outliers, which are defined as samples laying outside the interval [ Q 1 1.5 · IQR , Q 3 + 1.5 · IQR ] , with IQR the Interquartile Range defined as IQR = Q 3 Q 1 .
Applsci 14 02290 g012
Figure 13. Distribution of the different ranks assigned by subjects, split per user role, to each of the four scenarios with regard to the optimality of the network configuration (from most (1) to least (4)) to complete the given task. Note that some subjects did not fill in, or incorrectly filled in, the post-session questionnaire and are, therefore, excluded from these graphs.
Applsci 14 02290 g013
Figure 14. Overview of the perceived task difficulty for each of the four network configurations, on a 1-to-5 Likert scale, where a higher score indicates a higher perceived level of difficulty. Significant differences are indicated as * ( p < 0.05 ), and *** ( p < 0.001 ), respectively, as obtained from Friedman tests followed by Dunn–Bonferroni post hoc tests. The full orange line indicates the median, the green dotted line the mean. The bullets indicate outliers, which are defined as samples laying outside the interval [ Q 1 1.5 · IQR , Q 3 + 1.5 · IQR ] , with IQR the Interquartile Range defined as IQR = Q 3 Q 1 .
Applsci 14 02290 g014
Figure 15. Overview of the task completion time distributions for each of the four scenarios. The full orange line indicates the median, the green dotted line the mean. The bullets indicate outliers, which are defined as samples laying outside the interval [ Q 1 1.5 · IQR , Q 3 + 1.5 · IQR ] , with IQR the Interquartile Range defined as IQR = Q 3 Q 1 .
Applsci 14 02290 g015
Figure 16. Overview of the subjective time estimation errors (=time estimation − actual time) for each of the four scenarios. The full orange line indicates the median, the green dotted line the mean. The bullets indicate outliers, which are defined as samples laying outside the interval [ Q 1 1.5 · IQR , Q 3 + 1.5 · IQR ] , with IQR the Interquartile Range defined as IQR = Q 3 Q 1 .
Applsci 14 02290 g016
Figure 17. Overview of self-reported cybersickness occurrence for each of the four scenarios in terms of the general VRSQ (a) and the oculomotor (b) and disorientation (c) sub-scales. Higher scores indicate a higher occurrence of given symptoms. The full orange line indicates the median, the green dotted line the mean. The bullets indicate outliers, which are defined as samples laying outside the interval [ Q 1 1.5 · IQR , Q 3 + 1.5 · IQR ] , with IQR the Interquartile Range defined as IQR = Q 3 Q 1 .
Applsci 14 02290 g017
Figure 18. Distribution of the different ranks assigned by subjects to each of the four scenarios, split per user role, with regard to the level of cybersickness being induced (from most (1) to least (4)) for each scenario. Note that some subjects did not fill in or incorrectly filled in the post-session questionnaire and are, therefore, excluded from this graph.
Applsci 14 02290 g018
Table 1. Overview of the recommended thresholds with respect to throughput, latency, and RTT for multi-user VR as derived from the literature.
AspectDescriptionRecommended Threshold
Downlink server-client throughputThe required downlink throughput for six degrees-of-freedom (6DoF) server-based networked VR>[400–600] Mbps [9]
Downlink server-client latencyThe maximal downlink latency for 6DoF
server-based networked VR
<[5–20] ms [9]
<14 ms [10]
Client-to-client RTTThe allowed latency for effective user collaboration in VR. It is defined as the time needed for a client to update the server + the time needed for the server to update all other clients [11].<15 ms [11].
Table 2. Overview of the hardware and software components in the experimental setup and their most important specifications.
Nr.ComponentSpecifications
1Access PointDIR-809 D-Link AC750 Dual Band Router (D-Link Benelux, 5480 AA Schijndel, The Netherlands) 1
2Client• HP ZBook Studio 16 inch G9 Mobile Workstation PC
(HP Belgium BV, 1831 Diegem, Belgium) 2
• 32 GB RAM
• 12th Gen Intel(R) Core(TM) i7-12800H@2.4 GHz CPU
• NVIDIA GeForce RTX 3070 Ti@1.48 GHz Laptop GPU
(8 GB GDDR6)
• Unity 2021.3.17f1
3HMD• Meta Quest 2 VR Headset (Meta Platforms Technologies
Ireland Limited, Dublin 4, D04 X2K5, Ireland) 3
• Android
• 6DoF-tracking
• 1832 × 1920 resolution
• 120 GHz refresh rate
• Qualcomm Snapdragon XR2 processor
• 4 Kyro 585 Silver@1.8 GHz, 3 Kyro 585 Gold@2.42 GHz
and 1 Kyro 585 Prime@3.2 GHz CPU cores
• Adreno 650@0.67 GHz GPU (1.2 TFLOPS)
• IMU, SLAM, LiDAR
4Server• Corsair Graphite 380T Portable Mini ITX (Corsaire, 1311 XB
Almere, The Netherlands) 4
• 16 GB RAM
• 4th Gen Intel(R) Core(TM) i7-4790 @3.6 GHz CPU
• EVGA GeForce GTX 980 Ti GPU (6 GB GDDR5)
• Unity 2021.3.17f1
aUTP-cableLAN over Ethernet
bOculus Link Cable• USB 3.0
• 5 Gbps
cUnity networking softwareNGO-package 5
dNetwork control softwareClumsy 6
eNetwork analysis softwareWireshark 7
Table 3. Overview of the adopted Latin square ordering of testing conditions for subsequent user evaluation sessions to minimize learning and novelty bias. From session 5 onward, the first 4 orderings are repeated.
SessionPlaythrough 1Playthrough 2Playthrough 3Playthrough 4
1ABDC
2BCAD
3CDBA
4DACB
5, 6…Repeat order
Table 4. Overview of the timing and content of the subjective evaluations during a single experimental session.
TimingContent
Pre-session• Demographics (age, gender…)
• Prior experience with VR (Never-Once-Quite-Very)
• Self-assessed technological proficiency (Low-Medium-High)
• Baseline VRSQ [26]
• Ishihara tests [27]
In-session• Estimation of playthrough time (in sec.)
• VRSQ [26]
• Perceived latency, jerkiness + perceived influence on object interaction,
   collaboration (5-point Likert scale)
• Perceived spatial and temporal synchrony between collaborators (5-point
   Likert scale)
• Task difficulty (5-point Likert scale)
Post-session• Rank network configurations based on perceived network optimality
• Rank network configurations based on perceived cybersickness inducement
Table 5. Overview of the four scenarios considered in this research.
ScenarioLatency (ms)Burst (50% Chance, ms)
A00
B0500
C5000
D500500
Disclaimer/Publisher’s Note: The statements, opinions and data contained in all publications are solely those of the individual author(s) and contributor(s) and not of MDPI and/or the editor(s). MDPI and/or the editor(s) disclaim responsibility for any injury to people or property resulting from any ideas, methods, instructions or products referred to in the content.

