Article

Design of Control Elements in Virtual Reality—Investigation of Factors Influencing Operating Efficiency, User Experience, Presence, and Workload

1
Center for Ergonomics and Medical Engineering, FH Münster University of Applied Sciences, Bürgerkamp 3, 48565 Steinfurt, Germany
2
Institute of Psychology and Ergonomics, Technical University Berlin, Fasanenstraße 1, 10623 Berlin, Germany
*
Author to whom correspondence should be addressed.
Appl. Sci. 2023, 13(15), 8668; https://doi.org/10.3390/app13158668
Submission received: 21 June 2023 / Revised: 22 July 2023 / Accepted: 24 July 2023 / Published: 27 July 2023
(This article belongs to the Special Issue Virtual Reality and Human-Computer Interaction)

Abstract

:
Virtual reality (VR) enables prototypes of devices to be evaluated in a simulation of a future usage environment. A disadvantage is the insufficient feedback design during the interaction with prototypes. In this study, we investigated how virtual control elements in VR must be designed to compensate for the lack of feedback. Therefore, 35 participants performed VR tasks using a virtual joystick and virtual rotary control. According to the design of experiments method, 12 factors, such as haptic feedback, sensitivity, size, and shape, were systematically varied. The control accuracy, task time, user experience, presence, and mental workload were recorded. The effect of a factor on the recorded parameters was examined using multifactorial ANOVA. Linear regression was used to calculate the mathematical models between the factors and parameters. These models were used to calculate the optimal design of the control elements in the VR. For rotary control, eight factors had a significant influence on the recorded parameters. There were seven factors for the joystick. With mathematical models, optimized control element designs for VR were calculated for the first time. These findings can help to better adapt prototypes and human–machine interfaces to different modalities in VR.

1. Introduction

Touch screens, rotary controls, and joysticks are part of modern human–machine interfaces (HMIs) in industrial contexts. They are often integrated into complex HMIs and used to control cranes, drilling rigs, agricultural machines, or medical devices [1,2,3,4,5,6]. The development of complex HMIs is ideally conducted according to a user-centered design process [7]. The focus of this process is on the user requirements. Based on these requirements, prototypes are developed, tested by the users, optimized, and retested [8]. Several prototypes must be developed for this iterative process. However, the production of prototypes is expensive and time-consuming [9]. Companies are increasingly using virtual prototypes to reduce the number of prototypes that need to be manufactured [10,11].
Virtual reality (VR) technology offers the possibility of visualizing and experiencing virtual prototypes in high detail. Users can test and evaluate prototypes by simulating a later usage environment [12]. The first studies showed that the evaluation of prototypes in VR is comparable to the evaluation of real prototypes [13,14,15,16,17,18,19]. In the industrial context, however, completely virtual prototypes are hardly used for user tests because the lack of haptic feedback limits the evaluation, in particular [19,20]. Therefore, virtual prototypes are often evaluated in mixed-reality environments [21,22,23,24]. In this case, the virtual environment is mixed with real control elements.
However, completely virtual prototypes are useful, particularly in the early stages of development. Different HMI concepts can be evaluated without the need to manufacture real control elements. In addition, test participants can evaluate new prototypes independent of their location. Many studies and textbooks exist on the design of real control elements to achieve high control accuracy and user satisfaction [25,26,27,28,29,30,31,32,33,34,35,36,37,38,39]. Table 1 shows, for example, the recommended value ranges for the optimal haptic value impression of rotary controls according to Anguelov [40], as well as recommendations for safe operation according to Schmidtke and Jastrzebska-Fraczek [30].
The table shows that an important parameter in the design of rotary controls is the torque that the user must apply to switch from one position to another. This torque cannot be simulated using VR. Consequently, the user lacks an important feedback component. This may lead to reductions in positioning accuracy and speed, which can decrease performance and user acceptance. Force feedback is also an important feedback source for joysticks. The user feels resistance when moving the joystick and can therefore better control the deflection [31,41,42,43].
To adapt HMIs in VR to different modalities, customized interaction types are often used, such as laser pointers, additional virtual menus, or input devices such as tablets [44,45,46,47,48,49,50]. Many studies have focused on the optimal human–computer interaction for specific applications in VR, for example, games [51], desktop navigation [52], or learning tasks [53]. However, to evaluate new prototypes in VR, the control elements and the way of interaction should match the later reality as closely as possible. Hardware solutions, such as data gloves and haptic devices, that are intended to enable natural interaction in VR are still very expensive and require extensive setup time [54]. To be able to interact with VR content as naturally as possible, studies have already been conducted on realistic grasping in VR [55,56]. However, there is a lack of studies investigating how control elements (joysticks, rotary controls, etc.) can be adapted to VR so that they can be operated well by users. In addition, there is a lack of studies investigating the influence of different control element parameters such as size, shape or type of feedback on subjective parameters such as user experience or workload. Therefore, in this study, we investigated how rotary controls and joysticks must be designed in VR to perform positioning tasks as quickly and precisely as possible. In addition, we will investigate parameters that influence user experience, presence, and mental workload, and how the control elements can be optimized with regard to these criteria.

2. Materials and Methods

Figure 1 shows the methodological approach in this study. The individual steps are explained in the following sections.

2.1. Experimental Setup and Design

2.1.1. Identification of Relevant Control Element Parameters

To investigate how the control elements can be adapted to VR, a workshop with drillers and experts in usability and VR identified factors that could influence positioning accuracy, time required for positioning tasks, user experience, and workload. Drillers control the drilling process on offshore rigs and are experts in operating joysticks and rotary controls. Table 2 lists the identified factors that were examined in this study. In addition, the experts defined value ranges in which the factors vary.
The angular resolution factor describes the sensitivity of the rotary control. With an angular resolution of 5°/value (−), the rotary control must be turned by 5° such that the value displayed on the screen changes by 1. The inclination of the control element describes the angle between the control element and table (refer to Figure 2: inclination 0°). Rotary controls with knurling, without knurling (cylinder), and with toggles were tested. In addition, the diameter of the control elements was varied.
The maximum deflection angle was varied to examine the joystick. For example, the joystick could be deflected forward or backward by a maximum of 45° (+) from the zero position (perpendicular to the table). The factor max. positioning speed describes the maximum possible rate of change in the maximum deflection of the joystick. The factor angular resolution describes the ratio of the deflection angle to the change in the displayed value of the bar graph. With a linear angular resolution (+), the change in the positioning value is proportional to the deflection angle. With a three-stage angular resolution (−), three angular ranges are defined, in which the change in the positioning value is the same.
A joystick with a vertical handle (cf. Figure 2. left) and a joystick with a horizontal handle, such as that used as an aircraft thrust lever, were tested. The size of the joystick was tested on three levels. In addition to the extreme values shown in Table 2, a medium size was tested (vertical: 23.5 cm; horizontal: 12 cm). In addition, the visual feedback was varied. Either the test person saw only a bar graph with the current positioning value (refer to Figure 2, top right) or a bar graph with the current rate of change in the positioning value (refer to Figure 2, top left).
For both control elements, we investigated whether haptic or acoustic feedback as well as the visualization of the hand influenced the operation of the control elements. For example, if the participant activated the joystick, the hand grasping the joystick was visualized in VR. If there was no visualization, the participant saw only the joystick and its deflection. If the value changed, the participant heard a click and/or felt the vibration of the controller.
It was investigated whether the design of the VR environment influenced the operation and especially the subjective evaluation of the control elements. In addition, the influence of the design of the VR controller on the operation was investigated. Valve Index controllers (+) have integrated sensors to detect hand and finger positions. This enables the control elements to be “grasped” similarly to reality. For HTC Vive (−) controllers, interaction is performed by moving the controller close to the control element and pressing the “trigger button” on its back. Images of the controllers used can be found in the Supplementary Material (refer to Figure S1).
The various control elements and the virtual environments were created in the Unity 2020.2.3f1 development environment (Unity Technologies, San Francisco, CA, USA) and coded in C# (Microsoft Corporation, Redmond, WA, USA). Visualization was performed using the Valve Index HMD (Valve Corporation, Bellevue, WA, USA) and a PC with an i7 processor and a GeForce GTX 1070 graphics card (NVIDIA Inc., Santa Clara, CA, USA). Figure 2 shows examples of the different factor characteristics listed in Table 2.

2.1.2. Design of Experiments

To investigate whether the factors listed in Table 2 influenced the positioning accuracy, time required for positioning tasks, user experience, presence, and workload, the different levels of the factors (e.g., 40 mm or 110 mm diameter) were varied and tested. Owing to the high number of factors, a classical experimental design where only one factor is varied (e.g., the diameter) and the other factors are kept constant would have led to an enormous experimental effort. Therefore, we used the design of experiments (DOE) method in this study. The DOE is a standardized methodology for the planning and statistical evaluation of experiments [57]. This methodology aims to learn as much as possible about the relationships between influencing factors and results with as little experimental effort as possible. The information obtained is statistically confirmed, and the effects of the input variables on the output are quantifiable [58]. In the DOE, several factors are varied simultaneously. The factors are varied according to a specific system (test design) such that the influence of a single factor can be statistically calculated [59].
In this study, a fractional factorial I-optimal response surface test design with 35 trials (joystick) and 32 trials (rotary control) was created using Design Expert 13 software (Stat-Ease, Minneapolis, MN, USA). In I-optimal designs, the algorithm selects points that minimize the integral of the prediction variance in the entire design space [60,61]. Table 3 lists an excerpt from the test design for the rotary control as an example. The levels of the factors listed in Table 2 were varied systematically. The complete test designs can be found in the Supplementary Material (cf. Tables S1 and S2).

2.2. Experimental Procedure

To examine the influence of the factors, test participants (n = 35; f: 14; m: 21; age: 24.7 ± 3.6 years) evaluated the different joysticks and rotary controls according to the test design in VR. Each test participant tested only one configuration of a control element. This means that the first test participant tested the configuration of run one and the second test participant tested the configuration of run two and so on (cf. Table 3). Each participant tested both a rotary control and a joystick in randomized order.
Of the 35 participants, 10 had no VR experience, 19 had little experience (less than 10 h), and 6 participants had more than 10 h of VR experience. The test participants had no previous work experience in the operation of control elements. All participants were enrolled in a bachelor’s or master’s degree program with a technical focus at the time of the study and stated that they used computers on a daily basis.
In VR, the participants viewed two screens. One screen showed a vertical bar graph on a scale from 0% to 100% when the joystick was examined. If the participant pulled the joystick towards themselves, the displayed value increased. When examining the rotary control, a screen showed a numerical display with a value between 0% and 100%. Clockwise rotation increased this value. Figure 3 shows the experimental setup used in VR.
The test participants sat on a height-adjustable chair with castors and were requested to adjust the seat height at the beginning of the test. This meant that the test participants did not have to adopt a predefined posture and could position themselves freely in relation to the virtual control elements.
At the beginning of each experiment, the test leader introduced the test participants to the respective VR controllers in a standardized manner. The test participants were shown how to grip and operate the control elements. Subsequently, the test participants were requested to set the maximum value of the scale with the control element.
After the introduction, the participants performed four tasks per control element (Table 4). The tasks were displayed on a separate screen in VR and performed sequentially by the test participants. Each participant performed all the tasks three times.

2.3. Evaluation Parameters

2.3.1. Time on Task

The time required to complete the task was measured. The measurement began when the test participant gripped the control element in the VR and ended when the required value was set.

2.3.2. Positioning Accuracy

The positioning accuracy was determined by counting the positioning errors and adding them. For example, if the test participant turned the rotary control in Task 1 and reached a value of 14 instead of 12, then returned to 11, and then to the required value of 12, three errors were noted.

2.3.3. Presence

Presence describes the feeling of being in a virtual world [62,63]. After completing the tasks, the test participants evaluated the control element used and the user test with regard to the perceived presence using the Slater–Usoh-Steed–Questionnaire (SUSQ) in a German-adapted version [64,65].

2.3.4. User Experience

User experience was measured using the User Experience Questionnaire (UEQ) [66]. The UEQ consists of 26 dual-pole items divided into the following six dimensions:
  • Attractiveness: describes the general impression of the product.
  • Perspicuity: describes the user’s feeling that interaction with a product is easy, predictable, and controllable.
  • Efficiency: describes how quickly and efficiently the user can use the product.
  • Dependability: describes the feeling of being in control of the system.
  • Stimulation: describes the user’s interest and enthusiasm for the product.
  • Novelty: describes whether product design is perceived as innovative or creative.
Participants rated the items using a seven-point Likert scale. Each box on the Likert scale was assigned a score between −3 and +3, where +3 corresponded to an adjective with positive connotation. The UEQ score of a dimension is the mean of its respective scores [67].

2.3.5. Perceived Workload

The NASA RAW-TLX by Hart and Staveland [68] consists of six items representing the dimensions of mental, physical, and temporal demands, as well as performance, effort, and frustration, on a 20-point scale. A German translation was used in this study [69].

2.4. Data Analysis

2.4.1. Identification of Significant Factors Influencing the Evaluation Parameters

The time required to complete the tasks and number of positioning errors per task were averaged over the three trials of the test participants. By means of multifactorial ANOVA (α = 0.05), it was analyzed for each factor (e.g., diameter of rotary control) whether the change in the factor (e.g., from 40 mm to 110 mm diameter) had a significant influence on an evaluation parameter (e.g., time on task). If a factor had a significant influence on an evaluation parameter, the mathematical relationship between the factor and evaluation parameter was calculated via linear regression. These equations were represented in a coded form. This means that the equations did not use numerical factor values, but −1 for the lower level and +1 for the upper level. In this representation, the relative effect of a factor can be determined by comparing factor coefficients. Statistical analyses and calculation of the mathematical models were conducted using Design Expert 13 software. The Cook’s distance, which is a measure of how much the entire regression function changes when the values of a test run are not considered, was calculated to verify the accuracy of the mathematical models [70]. Large differences between Cook’s distances indicate outliers. The Cook’s distances above a value of one are considered critical and can falsify the model.

2.4.2. Optimization of the Control Elements for VR Using Mathematical Models

Numerical optimization calculations were performed for each control element, whose factor values could be used to achieve a high level of control accuracy, user experience, and presence with a low level of time expenditure and mental workload. These calculations were performed using ramp functions. This transformation makes the evaluation parameters dimensionless, and outliers cannot distort the overall result [59]. Each ramp can only take values between 0 and 1. A value of 0 corresponds to a poor result, and a value of 1 corresponds to a very good result. The minimum and maximum observed values of the respective evaluation parameters were used as the corner points of the x-axis.
The ramp function results from the case distinction. Let y be the value of an evaluation parameter, and y1 and y2 be the respective corner points. The value q of the ramp function is calculated as follows:
q =   0                           y y 1                   y y 1 y 2 y 1                 y 1 < y < y 2           1                         y y 2                  
Subsequently, the desirability function D(X) was calculated [71]. Therefore, the function values (q) of all ramps were multiplied as follows:
D = ( q 1 ×   q 2 × × q n ) 1 n = i = 1 n q q i 1 n q
In this case, n denotes the number of evaluation parameters. If an evaluation parameter or factor is outside the desired range, then the entire function becomes zero. Subsequently, the desirability function was optimized using simplex algorithms [72], and it was calculated with the factor values with which the highest possible control accuracy and user experience could be achieved [59].

2.4.3. Validation of the Optimized Control Elements

To investigate whether the mathematically determined control element parameters led to high control accuracy, user experience, and presence, as well as low time consumption and mental workload, confirmation runs were conducted with the optimized control elements. Therefore, four additional test participants (m: 4; age: 26.8 ± 4.5 years) performed the procedure described in Section 2.2 with the joystick and rotary control optimized for VR. Subsequently, the evaluation parameters were determined. These parameters were then compared with the calculated parameters. For example, the mathematical models calculate that a time on task of 20 ± 10 s should be possible with the optimized design of the rotary control. This mathematical model could be confirmed if the value determined in the confirmation runs is within the 95% prediction interval (95% PI).

3. Results

3.1. Rotary Control

3.1.1. Identification of Significant Factors Influencing the Evaluation Parameters

At least one factor had a significant effect on the evaluation parameters time on task (ToT), positioning accuracy (Acc.), presence (SUSQ), workload (NASA TLX), perspicuity (UEQP), efficiency (UEQE), and dependability (UEQP) of the User Experience Questionnaire (p < 0.05).
Table 5 shows a comparison of the factors and evaluation parameters as well as the significance values calculated using variance analysis. If no significance value was entered, this factor had no significant effect (p ≥ 0.05) on the respective evaluation parameter. The factors AC, AG, etc., are interaction effects.
Figure 4 shows the effect of the factor angular resolution on the evaluation parameters time on task (ToT) and positioning accuracy (Acc.). The figure shows that the participants with an angular resolution of 5° needed on average 54.4 s less to complete the tasks than the participants with a resolution of 45°. The angular resolution had the opposite effect on positioning accuracy. The test participants with an angular resolution of 5° made more errors.
Table 6 presents the mathematical models used to calculate the evaluation parameters. In addition, the adjusted coefficient of determination (R2Adj) and signal-to-noise ratio (SNR) are presented. The critical Cook’s distance was not exceeded in any of the tests.
By doubling a factor coefficient, the effect of the level change (e.g., 5° angular resolution to 45°) on the respective evaluation parameter could be determined in the respective unit. Figure 4 shows that by changing the angular resolution (A) from the low level (5°) to the high level (45°), the test participants needed on average 54.4 s longer to complete the tasks. This difference can also be seen in the equation “ToT” in Table 6. By doubling the factor coefficient 27.2, the difference of 54.4 s could be determined. This equation thus also shows that the test participants without haptic feedback (D) took on average 9.6 s longer to complete the tasks.
In addition to the angular resolution factor, the factor input device also significantly influenced the positioning accuracy. Test participants who used the Valve Index controller made about two more errors than test participants who used the HTC Vive controller. The input device factor also has a significant influence on the perceived presence. Users of the HTC Vive controllers rated presence 1.4 points higher than users of the Valve Index controllers.
The factor angular resolution had the strongest influence on mental workload. Averaged over all test runs, the mental workload was rated significantly lower at an angular resolution of 5° (NASA = 2.0) than at an angular resolution of 45° (NASA = 6.9). The factor angular resolution also significantly influenced the dimensions efficiency and perspicuity of the UEQ. Test participants rated the efficiency dimension significantly better (UEQE = 2.3) when they used rotary control with an angular resolution of 5°. Rotary control with an angular resolution of 45° achieved a mean UEQE score of 0.7. The test participants also rated the user experience better when the rotary control was tested in the detailed VR environment (crane). The visualization of the hand in the VR also had a significant influence on the user experience. The test participants rated the dimension perspicuity 0.6 points higher when no hand was shown in the VR.

3.1.2. Optimization of the Control Elements for VR Using Mathematical Models

The final numerical optimization calculation resulted in the following configuration for the rotary control:
A 
Angular resolution: 10–15°/value;
B 
Diameter: 33–45 mm;
C 
Inclination: 0°;
D 
Haptic feedback: yes;
E 
Acoustic feedback: yes;
F 
Visualized hand: no;
G 
Shape: knurling;
H 
Position participant: sitting;
J 
Input device: HTC-controller;
K 
VR environment: crane.
With these factor values, based on the experiments, it was computationally possible to achieve low time on task, minimum positioning errors, high user experience and presence, and low workload. Figure 5 shows an image of the optimized rotary control system for VR.

3.1.3. Validation of the Optimized Control Elements

The optimized rotary control shown in Figure 5 was then tested by four additional test participants in confirmation runs. Table 7 show the results of the confirmation runs for the rotary control. The “Pred. Mean” column lists the values that should be mathematically possible with the rotary control optimized for VR. If the measured values of a parameter (data mean) deviate significantly from the predicted value and thus lie outside the 95% prediction interval, the value is marked red.
Table 7 shows that the measured values of the confirmation runs for the parameter NASA (mental workload, NASA-RAW-TLX) and the dimension perspicuity of the UEQ were outside the 95% PI interval. Consequently, the mathematical models for these parameters could not be confirmed. All other mathematical models were confirmed.

3.2. Joystick

3.2.1. Identification of Significant Factors Influencing the Evaluation Parameters

Table 8 shows a comparison of the factors and evaluation parameters, including the significance values calculated by ANOVA for the joystick analyses. At least one factor had a significant influence (p < 0.05) on the evaluation parameters time on task (ToT) and positioning accuracy (Acc.), presence (SUSQ), perspicuity (UEQP), efficiency (UEQE), stimulation (UEQS), and novelty (UEQN) of the User Experience Questionnaire.
Figure 6 shows the effect of the factor positioning speed on the evaluation parameters time on task (ToT) and positioning accuracy (Acc.). The figure shows that the test participants with a high rate of change needed, on average, 64 s less to complete the tasks than the test participants with a low rate of change. A higher change rate had the opposite effect on positioning accuracy. The higher the positioning speed, the more errors the test participants made.
Table 9 lists the mathematical models for the calculation of the evaluation parameters, including the adjusted coefficient of determination (R2Adj) and SNR for the examination of the joystick. The critical Cook’s distance was not exceeded in any of the tests.
With the medium joystick size, the test participants needed the least amount of time to complete the tasks (ToTmedium = 59.8 s). With the small and large versions, the test participants needed more time (ToTsmall = 78.8 s; ToTlarge = 87.6 s). Test participants who operated the joystick while standing needed on average 13.6 s more time and made about 10 more errors than test participants who were seated. With acoustic feedback, the test participants perceived a higher level of presence (SUSQno acc feedback = 3.9) than without it (SUSQacc feedback = 5.0). The interaction of the factors positioning speed (A) and angular resolution (G) also had a strong influence on the presence. Test participants who tested the joystick with a high positioning speed and a linear angular resolution perceived a higher level of presence (SUSQ = 6.5) than participants who tested high positioning speed with a three-step angular resolution (SUSQ = 3.0).
The equations show that the factor positioning speed (A) had the strongest influence on the user experience. Test participants rated the dimensions efficiency and stimulation of the UEQ significantly better when the joystick had a high positioning speed (12%/s).

3.2.2. Optimization of the Control Elements for VR Using Mathematical Models

The final numerical optimization calculation resulted in the following values for the significant factors of the joystick:
A
Positioning speed: 11%/s;
B
Deflection angle: ±10–17°;
C
Size (length/diameter): 240/43 mm;
D
Position participant: sitting;
E
Shape: vertical handle;
F
VR environment: crane;
G
Angular resolution: linear;
K
Acoustic feedback: yes;
L
Visual feedback: no;
M
Visualized hand: yes.
Factors H (input device) and J (haptic feedback) had no significant effect on the evaluated parameters, either individually or in interaction with other factors (p > 0.05). Figure 7 shows an image of the optimized joystick.

3.2.3. Validation of the Optimized Control Elements

Table 10 show the results of the confirmation runs for the joystick. If the measured values of a parameter (Data Mean) deviated significantly from the predicted value (Pred. Mean) and thus lie outside the 95% prediction interval, the value is marked red.
The validation of the mathematical models of the joystick shows that the models for the dimension stimulation and novelty of the UEQ cannot be confirmed. All other mathematical models were confirmed.

4. Discussion

4.1. Factors Influencing Operation of Control Elements in VR

In this study, we identified, for the first time, the factors that influence the positioning accuracy, time on task, presence, user experience, and mental workload when operating joysticks and rotary controls in VR. Mathematical models were used to calculate how these factors must be designed to enable users to operate the control elements efficiently in VR and to experience a high presence and user experience and a low mental workload. Finally, the VR-adapted control elements were validated by user tests.
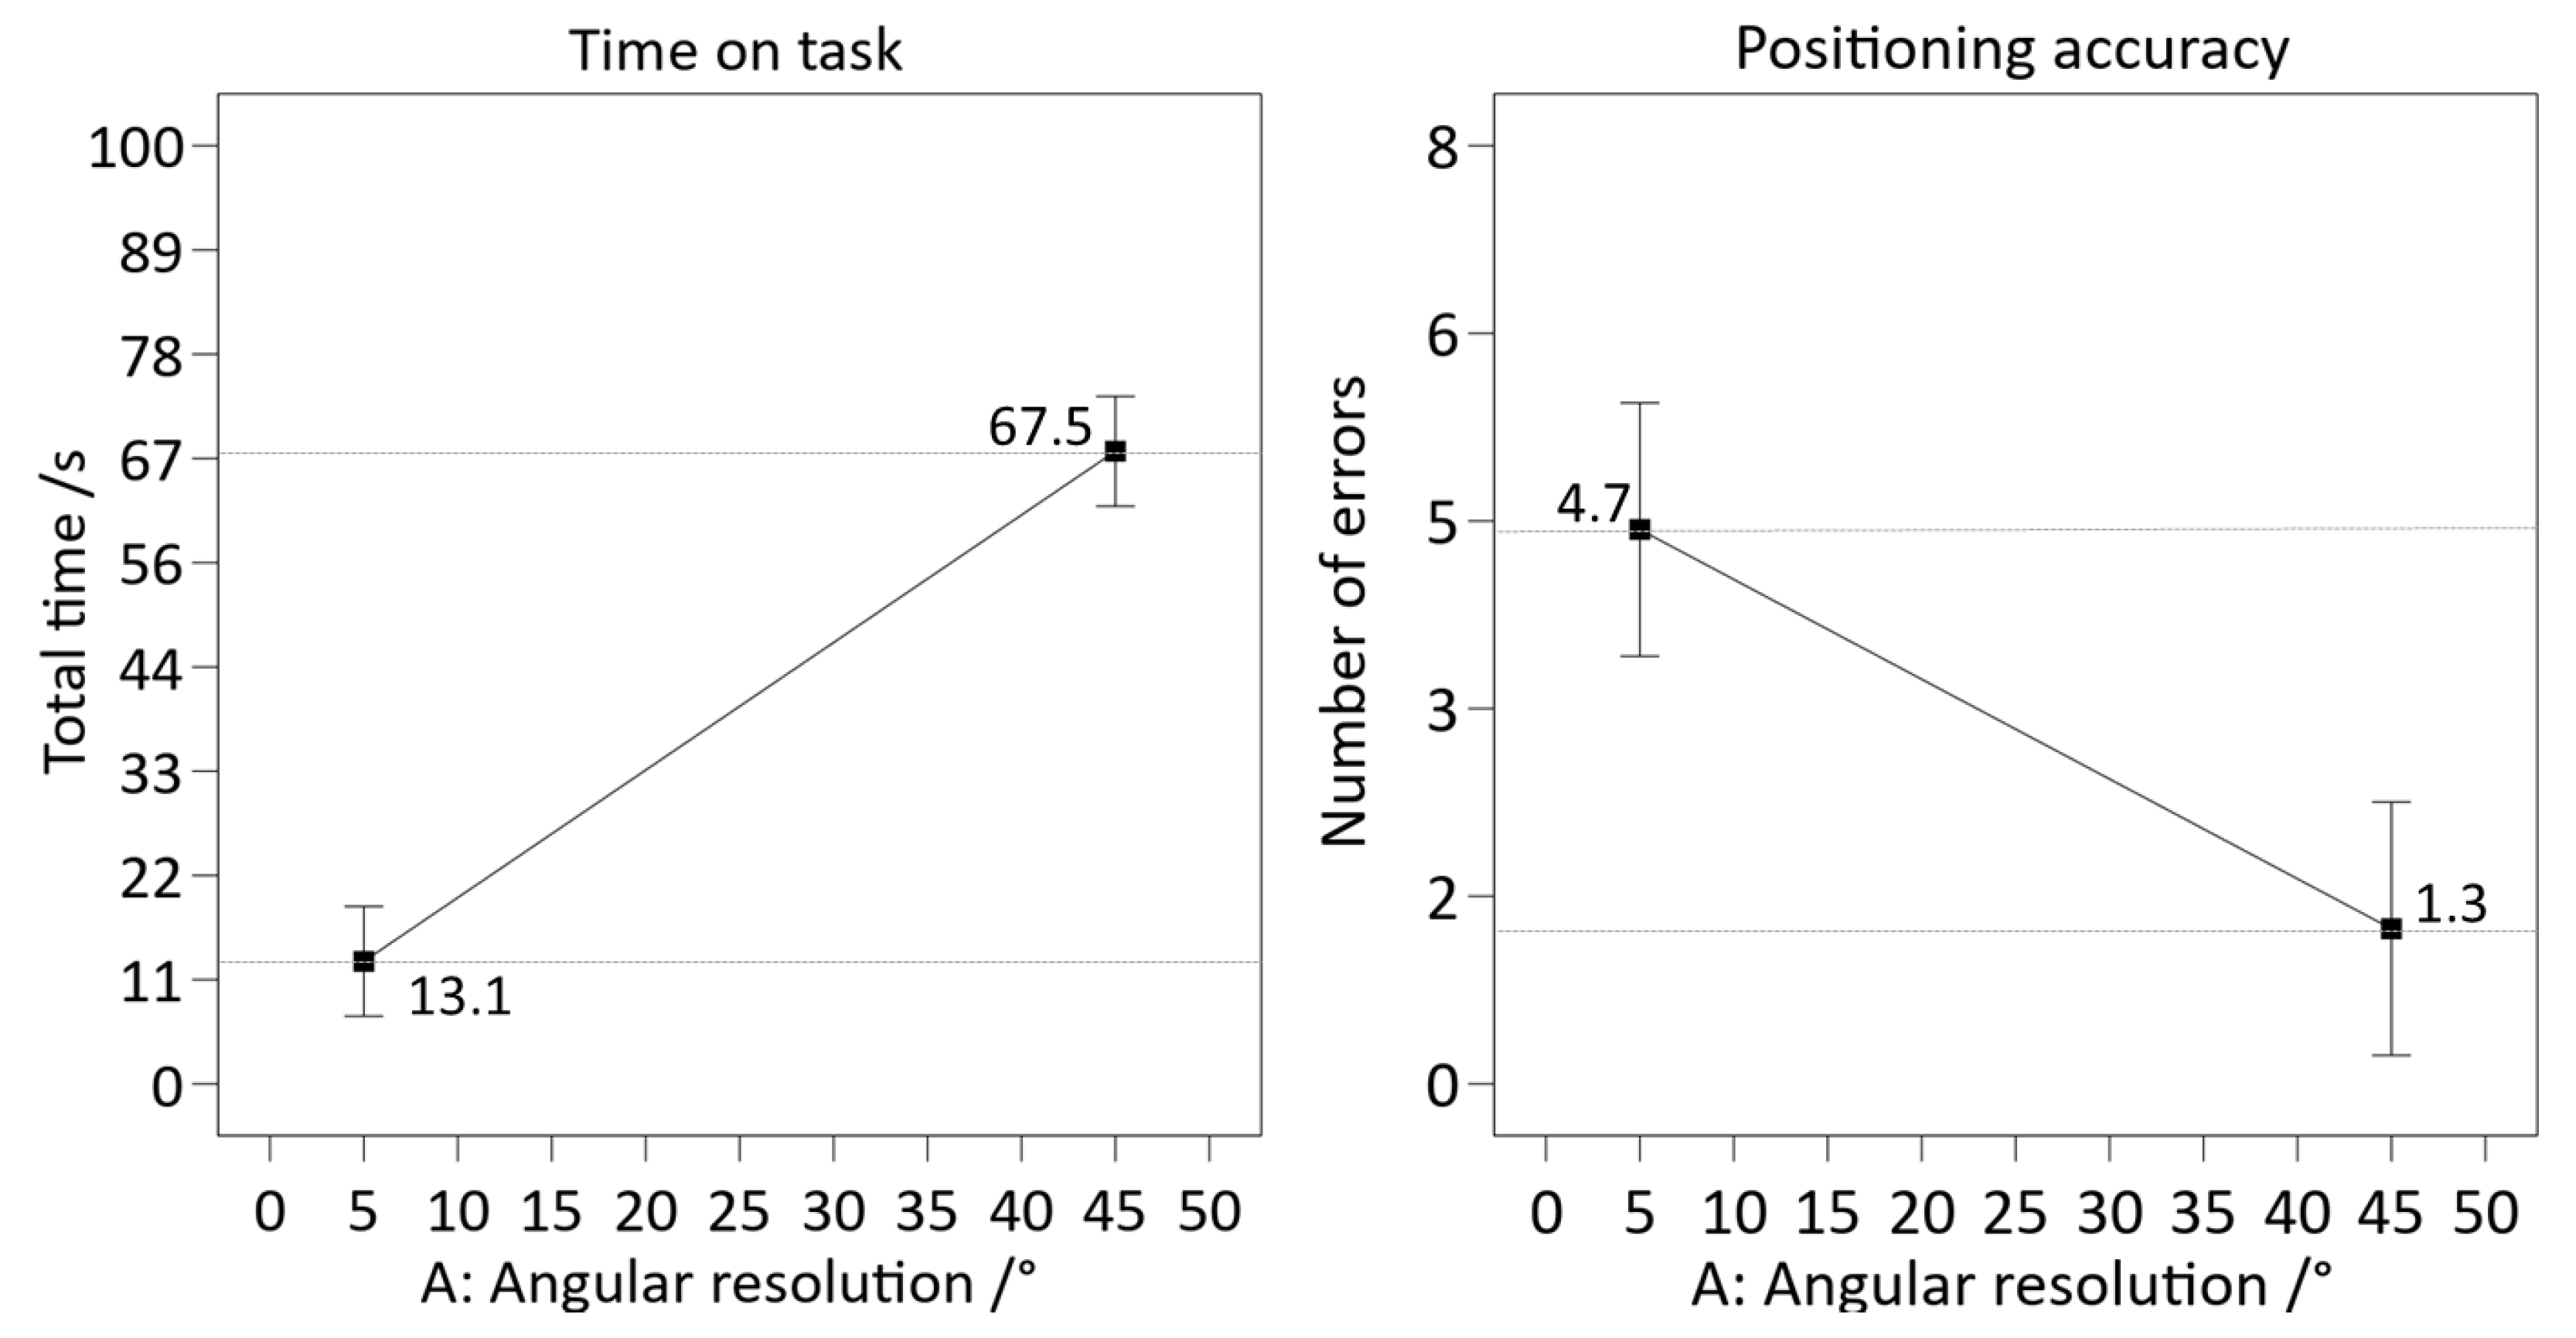
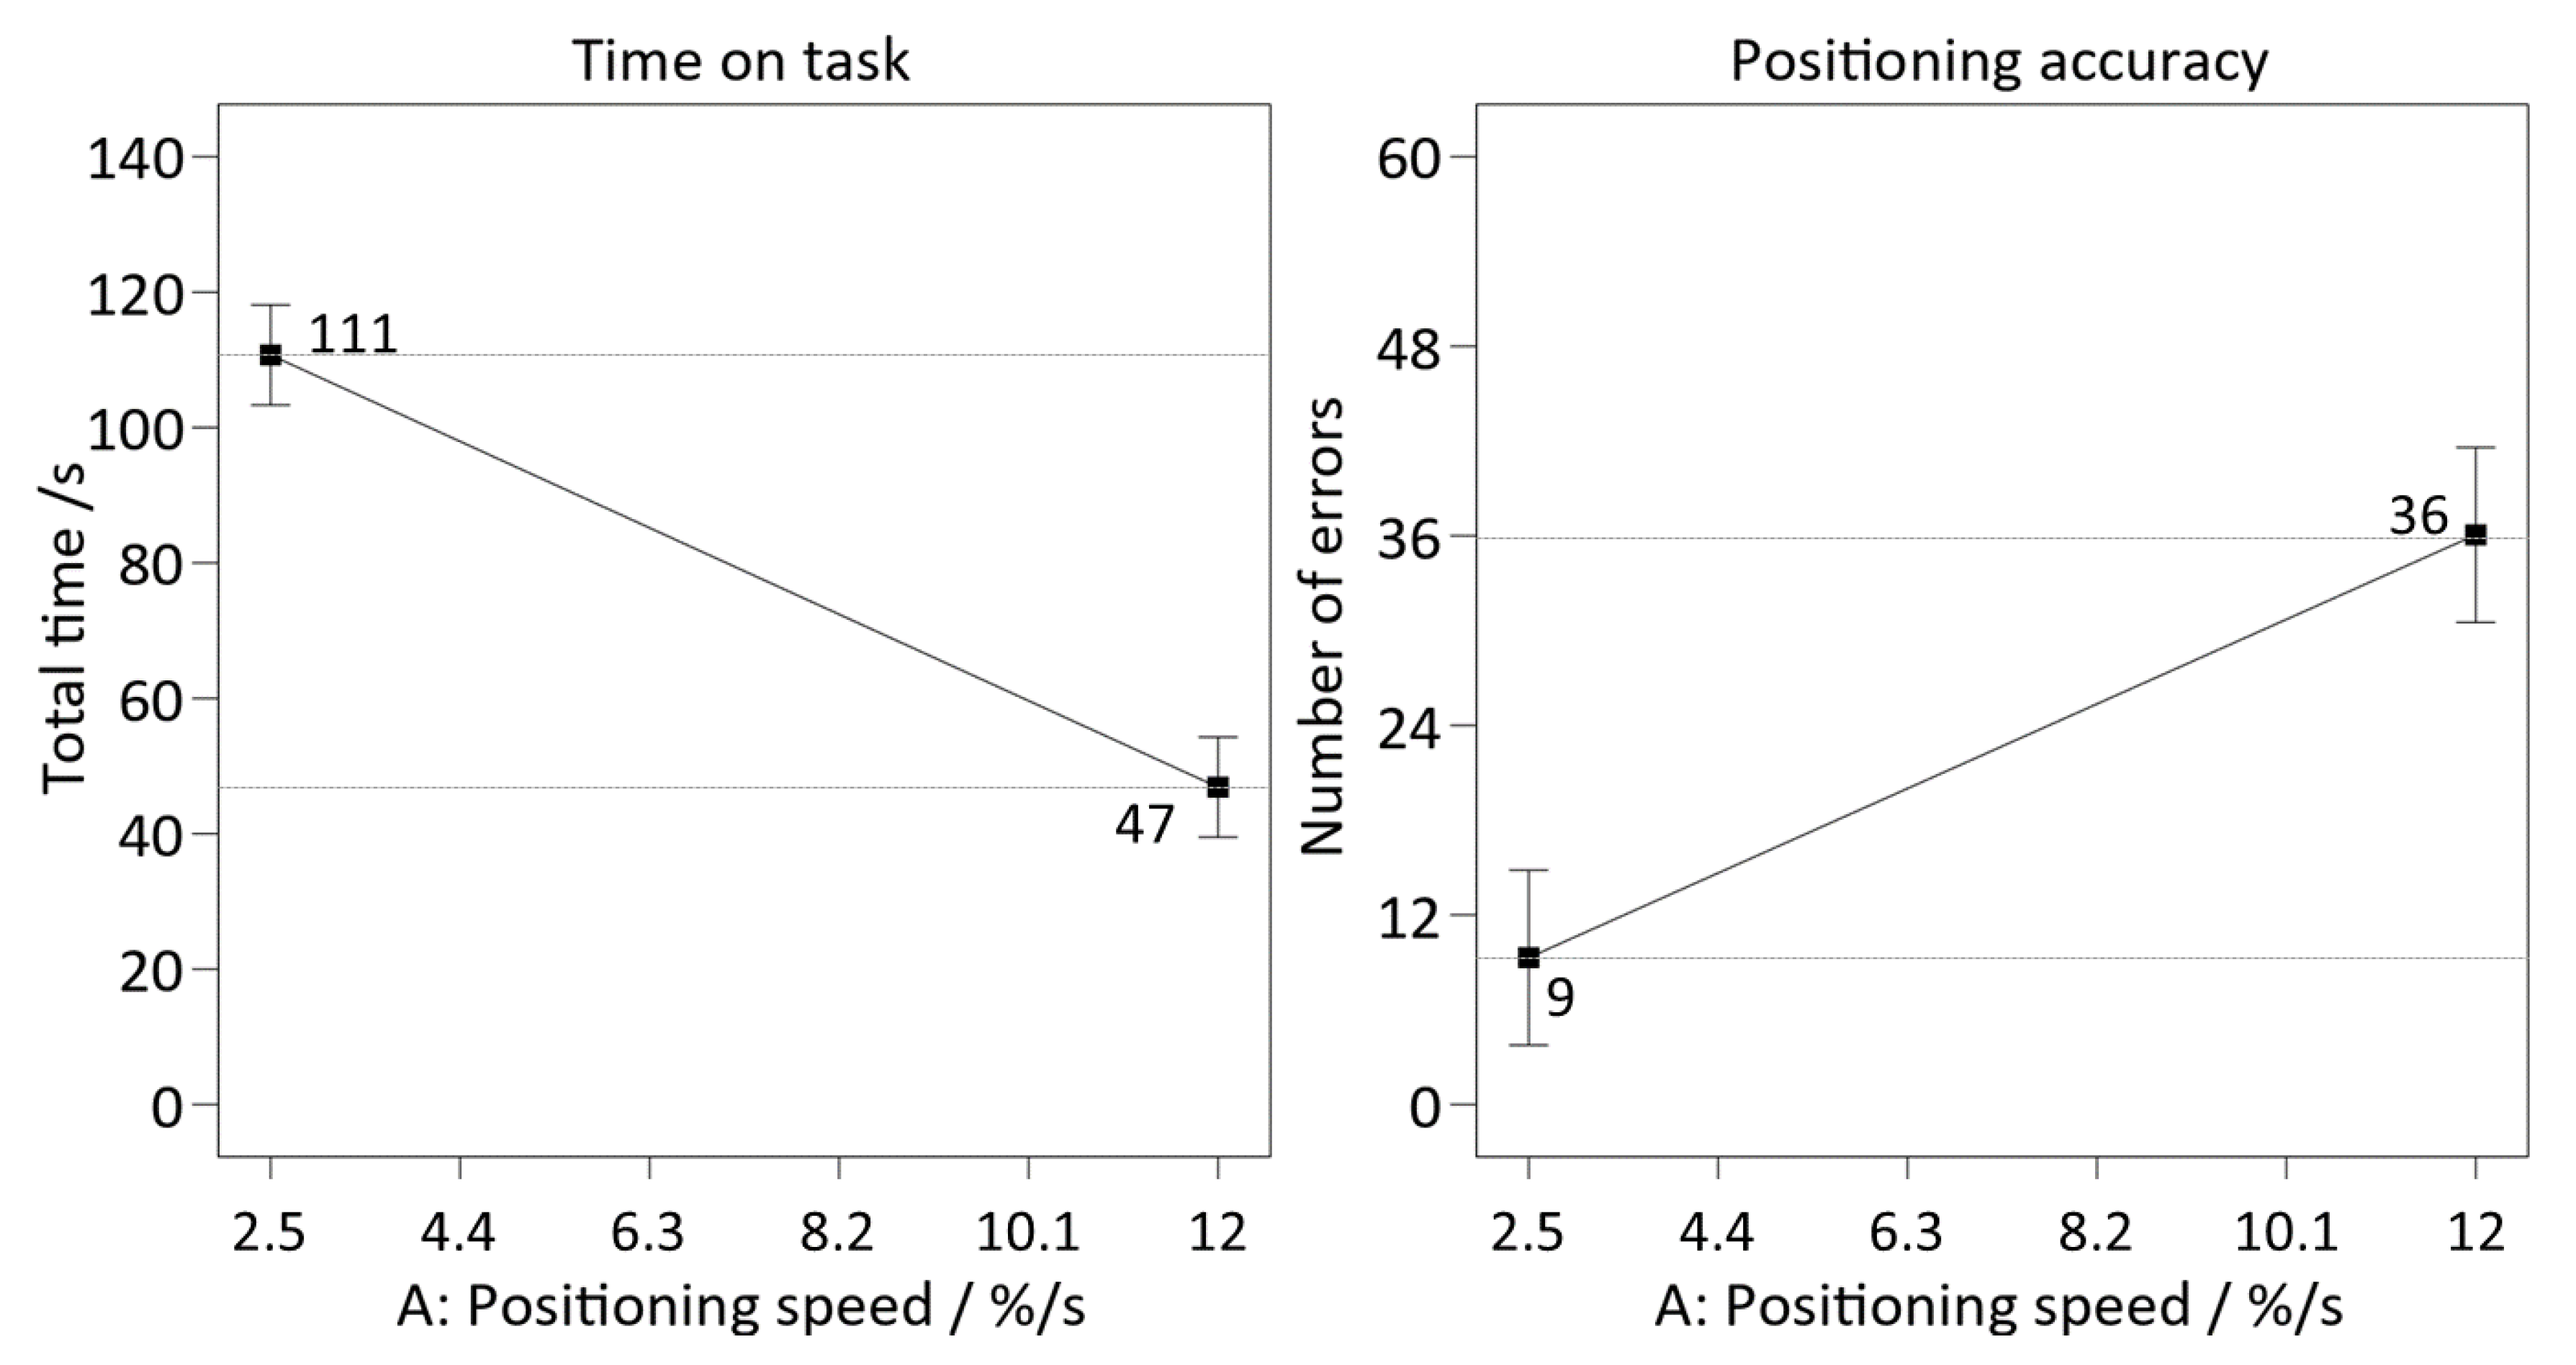
Figure 4 and Figure 6 show the influence of the angular resolution and the positioning speed of the control elements on the evaluation parameter time on task and positioning accuracy. The higher the angular resolution or the positioning speed, the less time the test participants required to complete the tasks. However, the test participants with sensitive control elements also made more errors. The 8%/s calculated by the optimization calculation is therefore a compromise between time on task and positioning accuracy.
The diameter of the rotary control had a significant influence on the efficiency dimension of the UEQ and on mental workload. Test participants rated the mental workload higher and the efficiency dimension lower when the rotary control had a large diameter of 110 mm. However, the diameter of the rotary control had no influence on the positioning time or positioning accuracy. Thus, the test participants only had the feeling that the operation of the big rotary control was not as efficient. Objects are often displayed larger in VR for better readability or representation. The results of this study show that, at least for control elements, an enlarged display may not be useful despite good operability, because test participants perceived the operation of the control element as less efficient.
The factor input device had a significant effect on the positioning accuracy. The test participants with the Valve Index controller primarily had problems releasing the control element at the end of the positioning process. The test participants had to remove their fingers from the controller simultaneously to release the control element in VR. If this was unsuccessful and the test participants continued to move their hands, the control element continued to rotate. With the HTC Vive controller, only the trigger button must be released. Problems with the release did not occur with this controller.
Test participants who tested rotary controls with haptic feedback were able to complete the tasks significantly faster than test participants who tested rotary controls without haptic feedback. We expected that haptic feedback would also influence the positioning accuracy. However, the test participants apparently acted more cautiously and thus slower with the rotary controls without haptic feedback in order to make as few errors as possible. The test participants were not informed that the time for the positioning tasks or the number of errors were measured.
The shape of the rotary control had no significant influence on the time on task and positioning accuracy, but it influenced the mental workload. The test participants with the knurled rotary control experienced the lowest mental workload. The highest mental workload was reported with the cylindrical rotary control. Because of the knurling, the rotation of the rotary control was better recognizable than with the other two variants. We assumed that this additional visual feedback reduced the mental workload of the test participants.
Test participants were able to operate the joystick significantly better while sitting than while standing. Fewer errors were made in the sitting position, and the test participants needed less time for the tasks. In real-life standing workplaces where control elements are operated, forearm supports exist or the operators can rest their arms on a table [73]. The test participants in this study stood freely in the room. Movements in the upper body consequently had a direct effect on the operation of the control element. In reality, small movements in the upper body or arm have no or only a minimal effect because the fixed mounting and the restoring force of the joystick prevent accidental or unintentional operation. In VR, this force is nonexistent. Further studies should investigate how joysticks can be adapted to operation while standing. We suggest that the sensitivity of the joystick should be further reduced. The results show that the position of the test participant should be considered in usability tests of new prototypes and can influence the usability of the prototype in VR.
The factors of acoustic feedback and visualization of the hand influence presence and user experience. Overall, the test participants rated the user experience of the joystick better when it had acoustic feedback and when the hand enclosing the joystick was visualized. Conversely, rotary control was rated better when no hand was visualized. Other studies have described clear benefits of visualizing hands in VR [74,75]. In the study by Lougiakis et al. [75], the effects of virtual hand representation on interaction and embodiment in VR environments were investigated. The test participants in this study had to move an object through a type of obstacle course. Although more errors were made with the hand representation than with the representation of a controller, it was preferred by most users. We assumed that, in our study, the hand covered the rotary control too much and that the participants were better able to detect the rotation of the rotary control without a visualized hand. Another reason for the lower user experience could be the virtual hand posture. In our study, the virtual hand gripped the cylindrical rotary control completely with all fingers (cf. Figure 3). Another type of grip for rotary controls would be a two-finger grip with thumb and index finger or thumb and middle finger. Whether this type of grip is more suitable for VR and feels natural to the user must be investigated in further studies.
Table 8 shows that the size of the joystick in VR had a significant effect on the time on task. The test participants who evaluated the joystick with a total height of 32 cm took significantly longer to complete the tasks. We hypothesized that a large joystick suggests a high actuating force and large range of motion, causing the test participants to pull up on the VR joystick more quickly. Participants who evaluated the smallest VR joystick took less time to complete the task than participants who evaluated the large joystick but took more time than participants who evaluated the medium joystick. We suspected that the small joystick, in contrast, suggested a small range of motion and fine motor work, which did not correspond to the actual work task.
The interaction between the factors positioning speed and angular resolution had a significant influence on the perceived presence of the test participants. The angular resolution was varied because we suspected that a linear angular resolution, i.e., the proportional increase in the positioning speed depending on the deflection of the joystick, could lead to a poor positioning accuracy due to the lack of force feedback in the VR. However, the angular resolution had no influence on the positioning accuracy. With the three-stage angular resolution, the angular range of the joystick was divided into three equal sections in which the same positioning speed prevails. If the test participant moved the joystick within the defined section, the positioning speed did not change. It only changed when the joystick was moved from one section to the next section. The three-stage angular resolution in combination with a high positioning speed led to a strong increase in the change in the positioning speed between the sections. We suspected that this behavior felt very unnatural to the test participants, causing presence to be rated very low for this combination. Overall, it could be concluded that a linear angular resolution is suitable in VR, despite the lack of force feedback, because both the three-stage and the five-stage subdivisions did not lead to a reduction in position errors. A linear angular resolution is more in accordance with the user’s expectations and, therefore, also makes sense in VR.
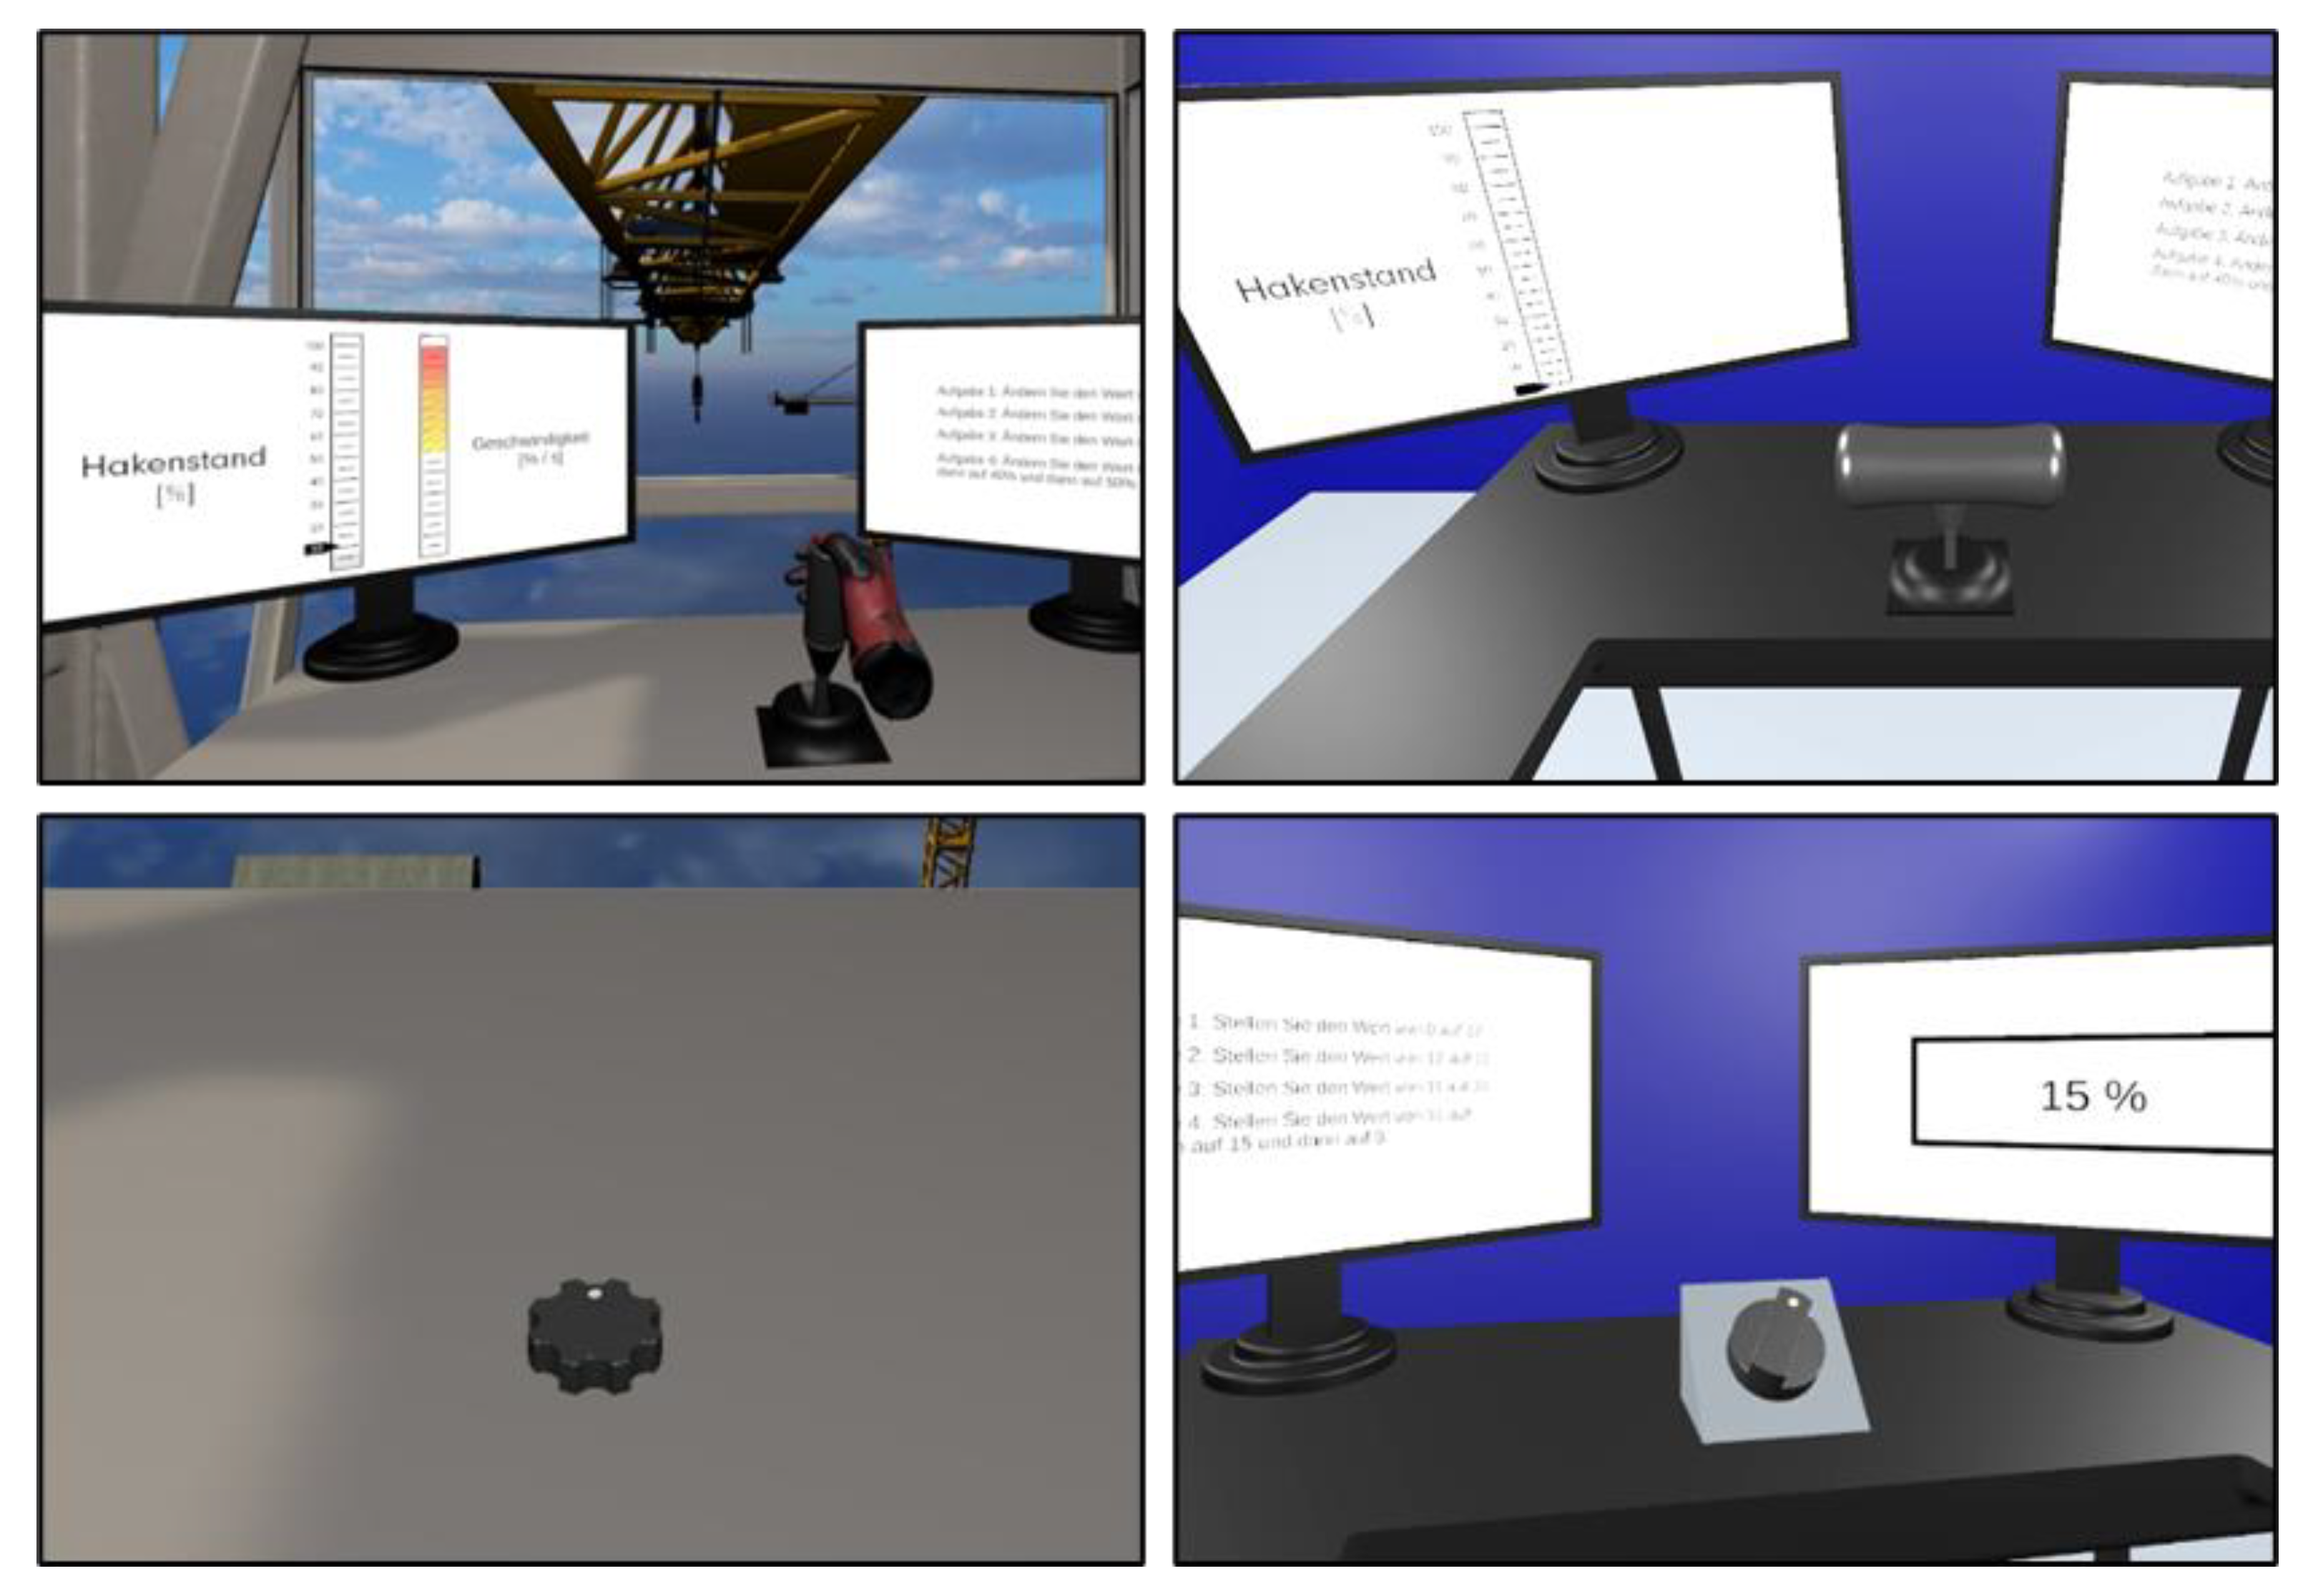
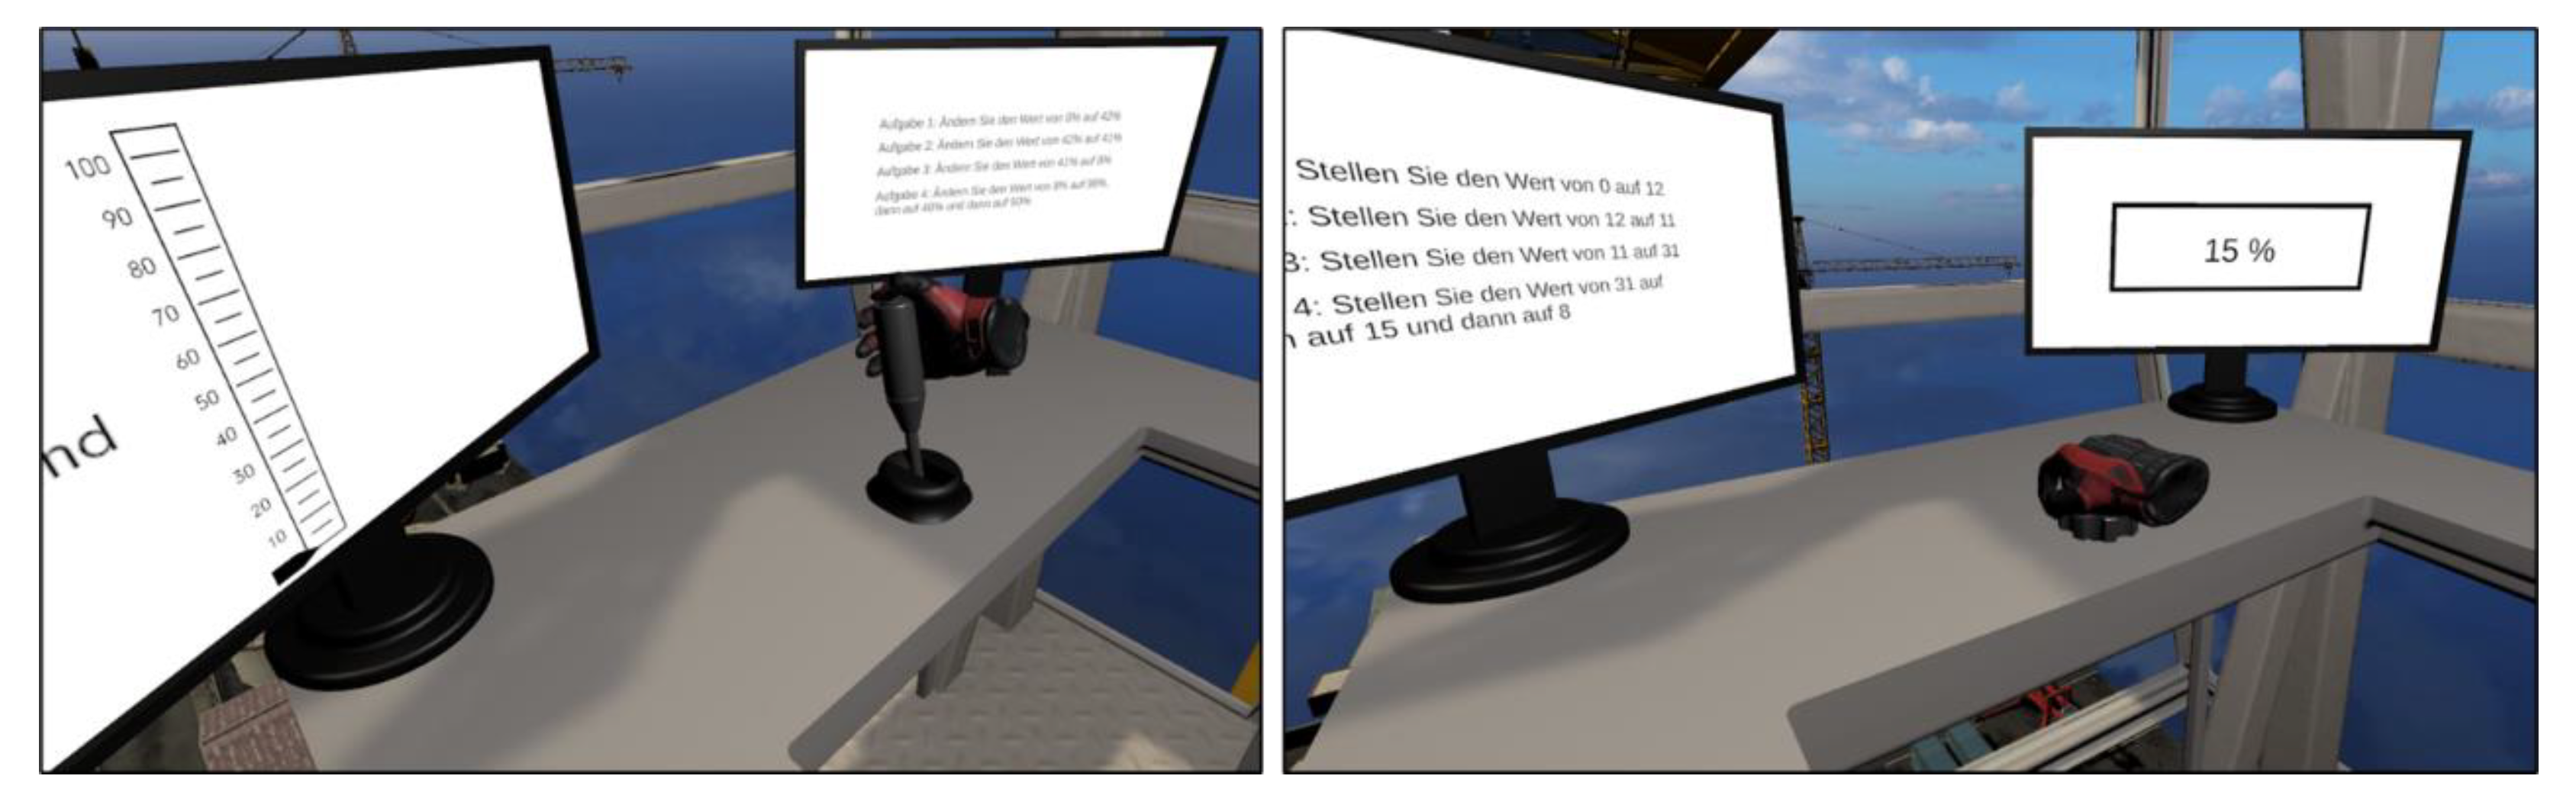
In addition to the control-element-specific factors, we also varied the VR environment. The test participants performed the trials either in a detailed crane environment or in an empty virtual room. In the literature, the advantage of VR is stated to be the ability to create realistic virtual environments that simultaneously provide a high degree of control over experimental conditions and good ecological validity [76]. In our study, the test participants rated the user experience of the control elements higher when the control elements were tested in the detailed crane environment (refer to Figure 2). This could either have been due to the realistic virtual environment or the detailed crane environment increased the novelty effect, in which test participants rate products better due to the novel technology [77]. A comparative study between VR and reality should further investigate whether the same control elements are similarly evaluated in a real crane environment. If not, this could be an indication of a bias caused by the novelty effect.
Overall, the factor positioning speed had a significant influence on most of the evaluation parameters. Objective parameters such as time on task or positioning accuracy as well as subjective parameters such as presence and user experience depend on the positioning speed of the joystick. Therefore, when evaluating prototypes in VR and simulating operating processes, it should be especially considered that the positioning speed is adapted to the changed modalities in VR. The recommendations for the design of a joystick in VR developed in this work offer a first orientation.

4.2. Optimized Control Elements for Operation in VR

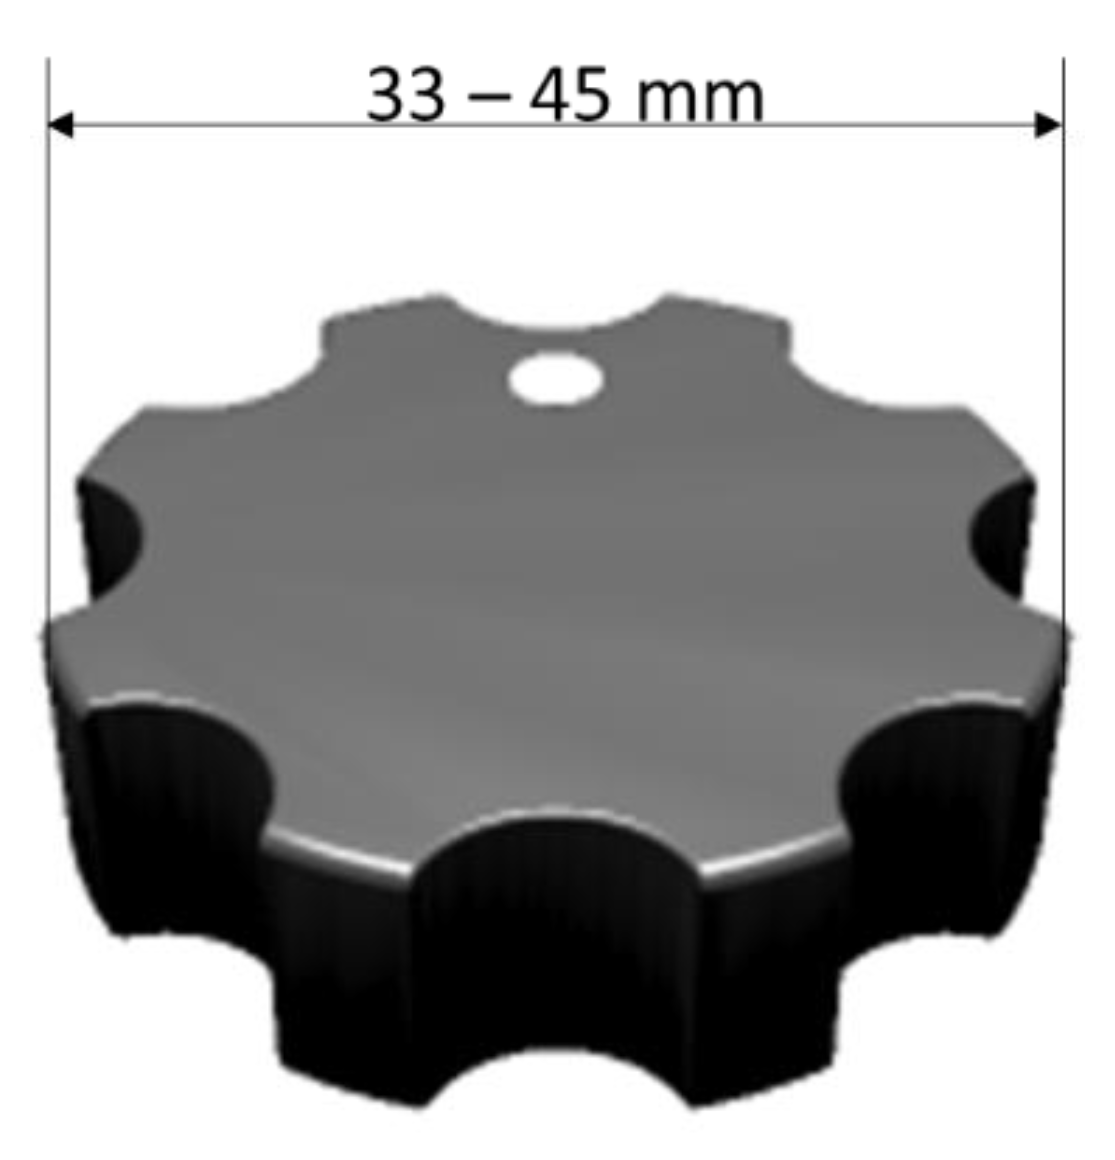
A comparison between the calculated optimal rotary control in VR and the recommendations of Anguelov [40] and Schmidtke and Jastrzebska-Fraczek [30] shows that the calculated optimal diameter of 33–45 mm corresponds to the recommendations for real rotary controls (refer to Table 1). The optimization calculation computed a sensitivity of 24–36 detents per revolution. This is close to the recommended range of Anguelov [40] with 25–35 detents per revolution. We assume that haptic feedback in the form of vibration pulses per detent can compensate for the missing detent torque.
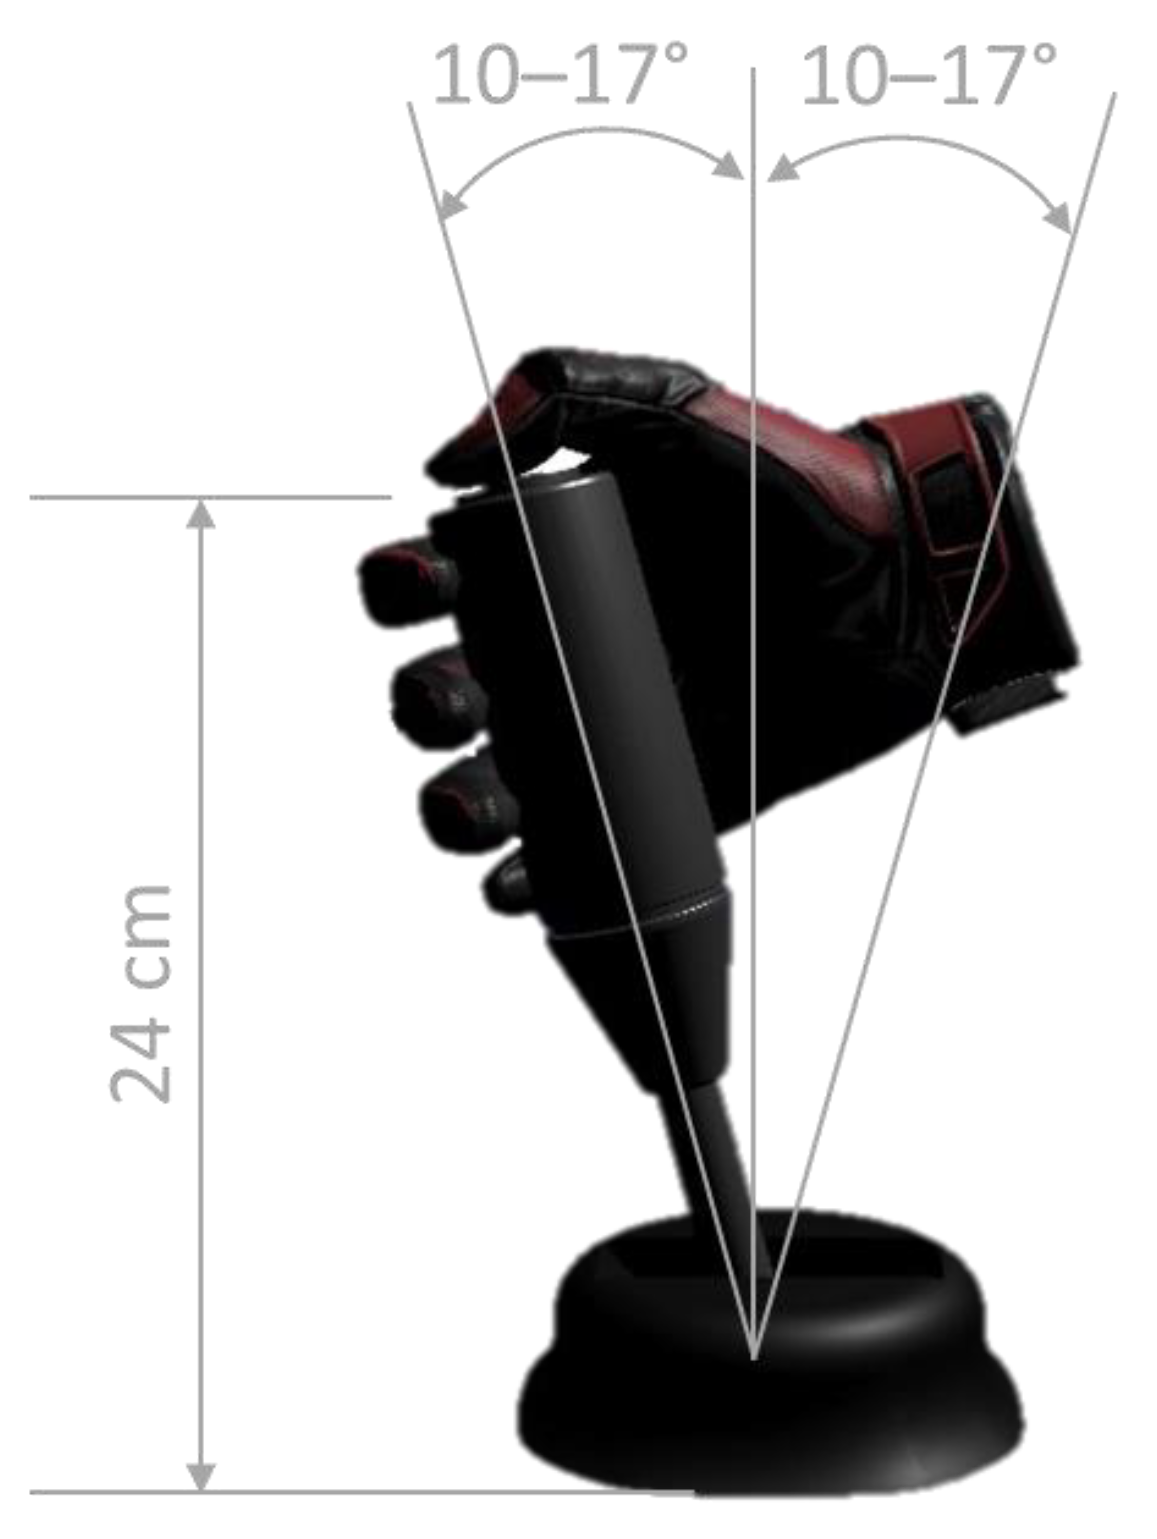
The handle length of a real joystick as recommended Schmidtke and Jastrzebska-Fraczek [30] is 75–125 mm. This recommendation only refers to the grip handle and not to the overall length of the joystick. In our study, we varied the overall length including the grip handle. The joystick optimized for VR had an overall length of 240 mm. In the optimized vertical shape, the length of the VR handle was 95 mm and thus corresponds to the recommendations of Schmidtke and Jastrzebska-Fraczek [30].
The recommended diameter for real joysticks is between 20 and 40 mm, and the actuating angle should be less than 45°. The calculated optimal handle diameter in VR was 43 mm, which is slightly higher than the recommendations. The calculated optimal angle range for joysticks in VR was 10–17°, which is within the recommendations for real joysticks. Overall, the design recommendations for real rotary controls can be transferred to VR if haptic and acoustic feedback types in the form of vibration pulses and clicking sounds are implemented. The recommendations for the design of real joysticks are also transferable to VR; however, the feedback should only be acoustic.

4.3. Limitations

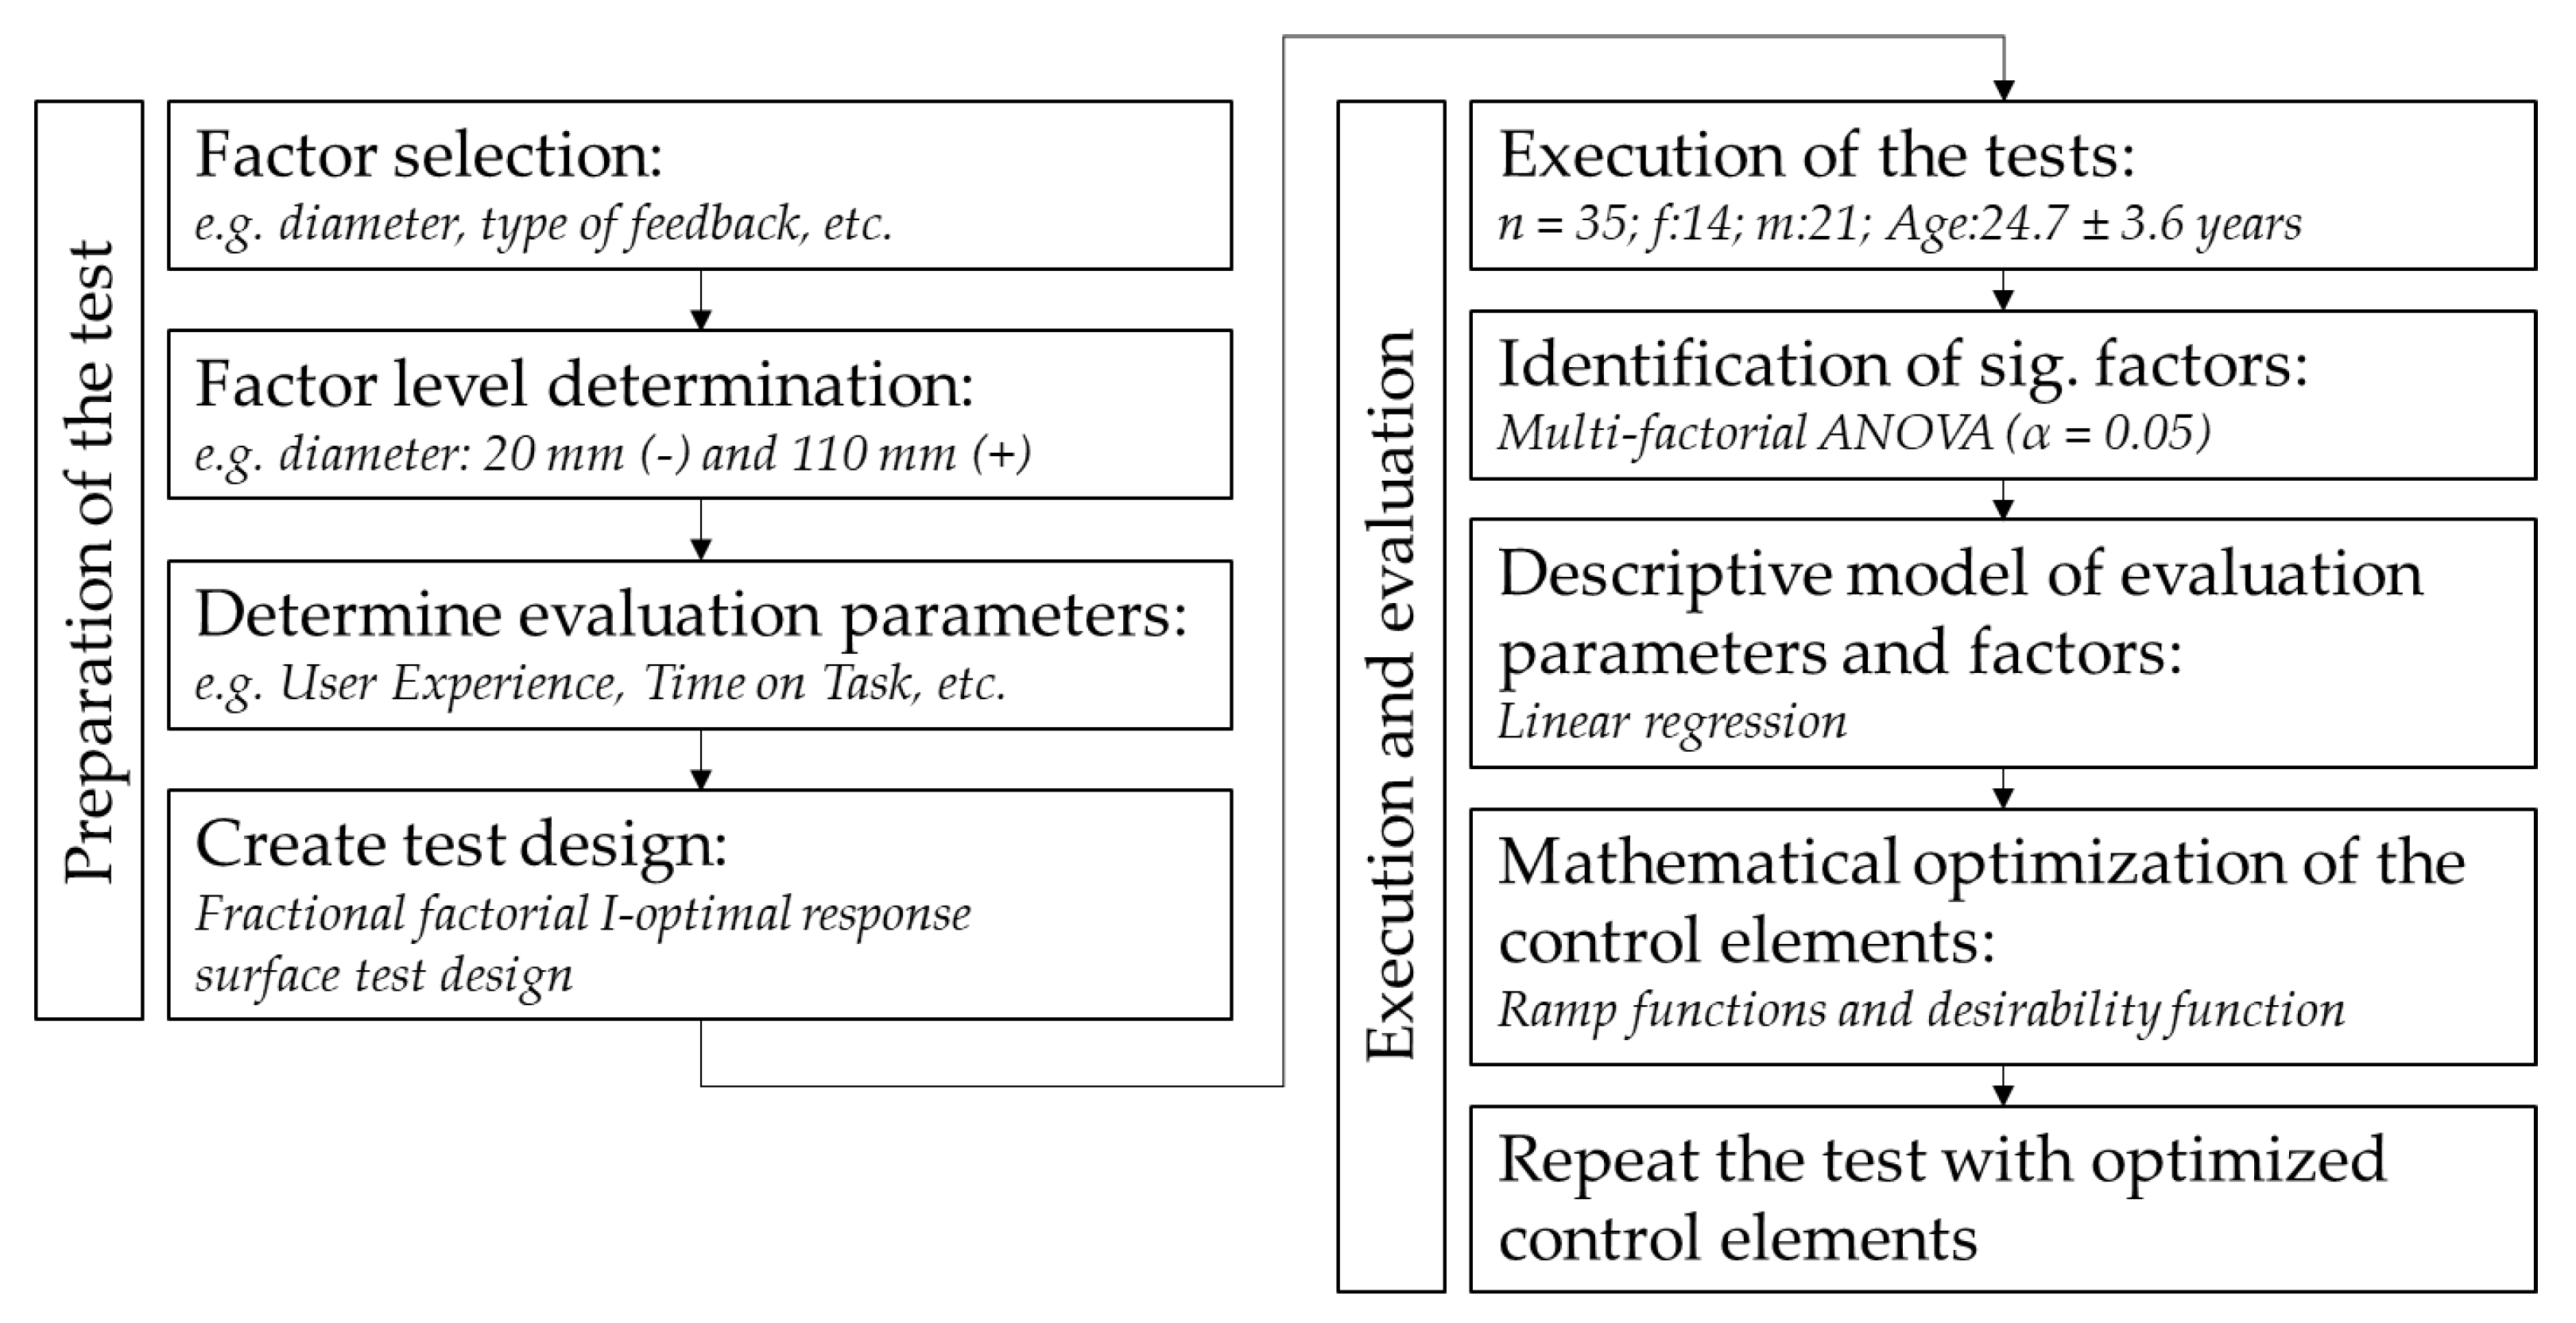
In this study, we used the DOE method and examined the control elements with an fractional factorial I-optimal response surface test design. The test design used had the resolution IV, i.e., the effects of the main factors (A, B, C, etc.) were neither mixed with each other nor with effects of the two-factor interactions (AB, AC, etc.). However, effects of the main factors were mixed with three-factor interactions (ABC, ACD, etc.), as well as effects of the two-factor interactions among themselves. This type of design is used to identify factors that have a significant effect on the evaluation parameters. The mathematical models created and optimization calculations performed in this study provide initial guidance. In a follow-up study, detailed investigations with the significant factors will be conducted with a full factorial design. The important factors will be evaluated on more levels and with a significantly increased number of experiments in order to further increase the accuracy of the mathematical models.
The main field of application of the DOE is chemical and process engineering [59]. However, the DOE is also being used more and more in the field of human factors [78]. Compared with chemical and process engineering, signal-to-noise ratios (SNRs) for human test participants must be expected to be higher owing to human variabilities such as age, affinity for technology, and prior VR experience. The SNR presented in Table 6 and Table 9 indicates that the tests had high scatter in some cases. In our estimation, these are mainly due to the different prior experiences of the test participants with the VR systems. In addition, the standard deviation of questionnaires in the field of usability and user experience is high [79].
This also made it difficult to perform confirmatory runs. Table 7 and Table 10 show the results of the confirmation runs, in which four additional test participants evaluated the optimized control elements. The theoretical parameter values calculated using the mathematical models for these control elements deviated for both the joystick and rotary control for the dimensions of the User Experience Questionnaire. However, the calculated 95% prediction intervals were partially outside the scale of the questionnaire. The upper limits of the 95% prediction interval were above a value of three for all UEQ dimensions, and thus above the scale. In addition, it could be assumed that some test participants tended towards the middle [80,81]. Consequently, extreme values of the questionnaire were selected less frequently. However, during the optimization calculations, the design of the control elements was calculated to precisely achieve these extreme values. Therefore, the mathematical model for the mental workload for operating the rotary control could not be confirmed. According to the optimization calculation, the optimized rotary control should achieve a score of zero. However, this score is unlikely in practice. The optimized rotary control achieved a score of 2.63 in the confirmation runs. This corresponded to a low mental workload.
Overall, the experiments showed that although the response behavior of the test participants could not be precisely modeled mathematically, the models were sufficient to calculate suitable control elements that achieved good results on the questionnaires. Comparatively high values were achieved for the UEQ and SUSQ. The positioning times (time on task) and positioning accuracy were even better than those predicted by the mathematical models. Generally, these human performance data, such as positioning accuracy or the time on task, can be better represented mathematically than factors for perception, such as mental workload.

4.4. Interaction with the Virtual World

The test participants interacted with the virtual control elements using VR controllers (Valve Index/HTC Vive). Studies have also shown that interactions without a controller can be beneficial. In this case, the user’s hands were captured and displayed in VR [82,83,84,85]. Recent innovations, such as the Apple Vision Pro, use a combination of eye and hand tracking to optimize interaction with VR, eliminating the need for controllers [86]. However, for the user evaluation of prototypes, e.g., a new car, in VR, it is important that the interaction modality be transferrable to reality as much as possible. Human-machine interfaces based on eye tracking are not yet established in reality. Accurate hand tracking, such as that provided by the Apple Vision Pro, could enable realistic interacting with virtual prototypes. However, hand tracking alone does not provide haptic feedback. Our study shows that haptic feedback has a significant impact on the operation of control elements in VR. Precise hand tracking, haptic feedback, and force feedback enable data gloves that theoretically allow for the most realistic interaction. However, the implementation of data gloves is currently still very complex [54]. How the control elements have to be designed for operation with optical hand tracking systems or with data gloves has to be investigated in further studies. To this end, our study provides factors that have a significant influence on the usability and subjective perception of the user when operating control elements in VR.

5. Conclusions

Overall, this study shows that it is generally possible to adapt control elements to different modalities in VR and optimize operation. Factors that have a significant impact on user experience, presence, and perceived workload when operating control elements in VR were identified. The results showed that rotary controls in VR should have a resolution of 10–15°/value, a diameter of 33–45 mm, and knurling. Haptic feedback in the form of vibration pulses and acoustic feedback in the form of clicks should be implemented. Joysticks in VR should have a maximum rate of change of 11 values/s, a maximum deflection of ±10–17°, a length of 240 mm, and a diameter of 43 mm. The feedback when operating joysticks in VR should be acoustic.
With VR-adapted control elements, prototypes of machines and devices can be better tested by users in VR by minimizing distortion due to the altered modalities in VR. Possible applications include cranes, drilling rigs, agricultural machines, or medical devices. In these tests, the usability of the new product as well as initial user evaluations can be examined without the need to manufacture real prototypes or control elements. It can be examined whether the selection of control elements and their layout are suitable for the work tasks. These completely virtual tests should be followed by tests in mixed-reality environments in which the selected control elements can be operated as realistically as possible. Overall, this approach could improve the development process, reduce manufacturing costs, and optimize the HMIs of products.
How well control elements can be operated in VR depends strongly on the type of interaction. In this study, VR controllers were used to interact with the virtual joysticks and rotary controls. Currently, more and more interaction types based on hand and eye tracking are entering the market. Data gloves, some of which provide force feedback, are also being developed further. This study shows that haptic feedback in the form of vibration pulses significantly improves the operation of rotary controllers in VR. Therefore, VR controllers or data gloves should be used for user testing of prototypes in VR. Especially, the possibility of force feedback could make the interaction with VR prototypes even more realistic. The influence of the use of data gloves and force feedback on the factors investigated in this study, e.g., user experience, needs to be investigated in further studies.

Supplementary Materials

The following supporting information can be downloaded at: https://www.mdpi.com/article/10.3390/app13158668/s1, Figure S1: VR controllers examined; Table S1: Test design rotary control; Table S2: Test design joystick.

Author Contributions

N.H. and C.S. carried out the experiment. N.H. wrote the manuscript with support from C.S. and C.B. N.H. conceived the original idea. C.B. supervised the project. All authors have read and agreed to the published version of the manuscript.

Funding

This research received no external funding.

Institutional Review Board Statement

The work presented does not include any studies on humans or animals. Due to the study design, no formal vote of an ethics committee was required. The VR experiments performed do not result in any hazards that increase the general risk to life of the persons concerned. All participants gave their informed consent for inclusion before they participated in the study.

Informed Consent Statement

Informed consent was obtained from all participants involved in the study.

Data Availability Statement

The raw data supporting the conclusion of this article will be made available by the authors without undue reservation.

Conflicts of Interest

The authors declare no conflict of interest.

References

  1. Schempp, T.; Kaufmann, A.; Stoehr, I.; Schmid, M.; Boettinger, S. Adaptive Control Elements to Improve the HMI of an Agricultural Tractor. In Advances in Usability, User Experience and Assistive Technology; Ahram, T.Z., Falcão, C., Eds.; Springer International Publishing: Cham, Switzerland, 2019; pp. 153–165. ISBN 978-3-319-94946-8. [Google Scholar]
  2. Siddique, A.H.; Shamsi, T.; Hasan, M. Human Machine Interaction (HMI) in Offshore Drilling–oil rig workers’ opinion about their interaction with machines. Int. J. Occup. Saf. Health 2021, 11, 181–191. [Google Scholar] [CrossRef]
  3. Top, F.; Pütz, S.; Fottner, J. Human-Centered HMI for Crane Teleoperation: Intuitive Concepts Based on Mental Models, Compatibility and Mental Workload. In Engineering Psychology and Cognitive Ergonomics; Harris, D., Li, W.-C., Eds.; Springer International Publishing: Cham, Switzerland, 2021; pp. 438–456. ISBN 978-3-030-77931-3. [Google Scholar]
  4. Lorenz, S.; Helmert, J.R.; Anders, R.; Wölfel, C.; Krzywinski, J. UUX Evaluation of a Digitally Advanced Human–Machine Interface for Excavators. MTI 2020, 4, 57. [Google Scholar] [CrossRef]
  5. Fennigkoh, L. The complexities of the human-medical device interface. Biomed. Instrum. Technol. 2011, 45, 39–43. [Google Scholar] [CrossRef] [PubMed]
  6. Weinger, M.B.; Gardner-Bonneau, D.; Wiklund, M.E.; Kelly, L.M. Handbook of Human Factors in Medical Device Design; CRC Press/Taylor & Francis Group: Boca Raton, FL, USA, 2011; ISBN 9781420063516. [Google Scholar]
  7. Chisnell, D.; Rubin, J.; Spool, J. Handbook of Usability Testing: Howto Plan, Design, and Conduct Effective Tests; Wiley: Hoboken, NJ, USA, 2013; ISBN 978-1-118-08040-5. [Google Scholar]
  8. Backhaus, C. Usability-Engineering in der Medizintechnik; Springer: Berlin/Heidelberg, Germany, 2010; ISBN 978-3-642-00510-7. [Google Scholar]
  9. Zhou, X.; Rau, P.-L.P. Determining fidelity of mixed prototypes: Effect of media and physical interaction. Appl. Ergon. 2019, 80, 111–118. [Google Scholar] [CrossRef] [PubMed]
  10. Bullinger, H.-J.; Dangelmaier, M. Virtual prototyping and testing of in-vehicle interfaces. Ergonomics 2003, 46, 41–51. [Google Scholar] [CrossRef]
  11. Choi, S.; Jung, K.; Noh, S.D. Virtual reality applications in manufacturing industries: Past research, present findings, and future directions. Concurr. Eng. 2015, 23, 40–63. [Google Scholar] [CrossRef]
  12. Salwasser, M.; Dittrich, F.; Melzer, A.; Müller, S. Virtuelle Technologien für das User-Centered-Design (VR for UCD). Einsatzmöglichkeiten von Virtual Reality bei der nutzerzentrierten Entwicklung. In Mensch und Computer 2019—Usability Professionals; Gesellschaft für Informatik e.V.: Bonn, Germany, 2019. [Google Scholar]
  13. Bruno, F.; Muzzupappa, M. Product interface design: A participatory approach based on virtual reality. Int. J. Hum.-Comput. Stud. 2010, 68, 254–269. [Google Scholar] [CrossRef]
  14. Bergroth, J.D.; Koskinen, H.M.K.; Laarni, J.O. Use of Immersive 3-D Virtual Reality Environments in Control Room Validations. Nucl. Technol. 2018, 202, 278–289. [Google Scholar] [CrossRef]
  15. Bordegoni, M.; Ferrise, F. Designing interaction with consumer products in a multisensory virtual reality environment. Virtual Phys. Prototyp. 2013, 8, 51–64. [Google Scholar] [CrossRef]
  16. Chalil Madathil, K.; Greenstein, J.S. An investigation of the efficacy of collaborative virtual reality systems for moderated remote usability testing. Appl. Ergon. 2017, 65, 501–514. [Google Scholar] [CrossRef]
  17. Holderied, H. Evaluation of Interaction Concepts in Virtual Reality Applications. In INFORMATIK 2017; Gesellschaft für Informatik: Bonn, Germany, 2017. [Google Scholar]
  18. Oberhauser, M.; Dreyer, D. A virtual reality flight simulator for human factors engineering. Cogn. Technol. Work. 2017, 19, 263–277. [Google Scholar] [CrossRef]
  19. Bruno, F.; Cosco, F.; Angilica, A.; Muzzupappa, M. Mixed Prototyping for Products Usability Evaluation. In Volume 3: 30th Computers and Information in Engineering Conference, Parts A and B, Proceedings of the ASME 2010 International Design Engineering Technical Conferences and Computers and Information in Engineering Conference, Montreal, QC, Canada, 15–18 August 2010; ASME: New York, NY, USA, 2010; pp. 1381–1390. ISBN 978-0-7918-4411-3. [Google Scholar]
  20. Stamer, M.; Michaels, J.; Tümler, J. Investigating the Benefits of Haptic Feedback during In-Car Interactions in Virtual Reality. In HCI in Mobility, Transport, and Automotive Systems. Automated Driving and In-Vehicle Experience Design; Krömker, H., Ed.; Springer International Publishing: Cham, Switzerland, 2020; pp. 404–416. ISBN 978-3-030-50522-6. [Google Scholar]
  21. Bolder, A.; Grünvogel, S.M.; Angelescu, E. Comparison of the usability of a car infotainment system in a mixed reality environment and in a real car. In Proceedings of the 24th ACM Symposium on Virtual Reality Software and Technology, Tokyo, Japan, 28 November–1 December 2018; Spencer, S.N., Morishima, S., Itoh, Y., Shiratori, T., Yue, Y., Lindeman, R., Eds.; ACM: New York, NY, USA, 2018; pp. 1–10, ISBN 9781450360869. [Google Scholar]
  22. Pettersson, I.; Karlsson, M.; Ghiurau, F.T. Virtually the Same Experience? In Proceedings of the 2019 on Designing Interactive Systems Conference, San Diego, CA, USA, 23–28 June 2019; Harrison, S., Bardzell, S., Neustaedter, C., Tatar, D., Eds.; ACM: New York, NY, USA, 2019; pp. 463–473, ISBN 9781450358507. [Google Scholar]
  23. Grandi, F.; Zanni, L.; Peruzzini, M.; Pellicciari, M.; Campanella, C.E. A Transdisciplinary digital approach for tractor’s human-centred design. Int. J. Comput. Integr. Manuf. 2020, 33, 377–397. [Google Scholar] [CrossRef]
  24. Ma, C.; Han, T. Combining Virtual Reality (VR) Technology with Physical Models—A New Way for Human-Vehicle Interaction Simulation and Usability Evaluation. In HCI in Mobility, Transport, and Automotive Systems; Krömker, H., Ed.; Springer International Publishing: Cham, Switzerland, 2019; pp. 145–160. ISBN 978-3-030-22665-7. [Google Scholar]
  25. Adell, E.; Várhelyi, A.; Hjälmdahl, M. Auditory and haptic systems for in-car speed management—A comparative real life study. Transp. Res. Part. F Traffic Psychol. Behav. 2008, 11, 445–458. [Google Scholar] [CrossRef]
  26. Morris, D.; Tan, H.; Barbagli, F.; Chang, T.; Salisbury, K. Haptic Feedback Enhances Force Skill Learning. In Proceedings of the 2007 2nd Joint EuroHaptics Conference and Symposium on Haptic Interfaces for Virtual Environments and Teleoperator Systems, Tsukaba, Japan, 22–24 March 2007; IEEE: Piscataway, NJ, USA, 2007; pp. 21–26, ISBN 0-7695-2738-8. [Google Scholar]
  27. Mulder, M.; van Paassen, M.M.; Abbink, D.A. Haptic gas pedal feedback. Ergonomics 2008, 51, 1710–1720. [Google Scholar] [CrossRef]
  28. Schmid, P.; Winterholler, J.; Maier, T. Investigation of the Relief Potential of the Visual Perception Channel by the User-Centered Design of a Rotary Control Element. In Stuttgarter Symposium für Produktentwicklung SSP 2019; Binz, H., Bertsche, B., Bauer, W., Riedel, O., Spath, D., Roth, D., Eds.; Fraunhofer-Institut für Arbeitswirtschaft und Organisation IAO: Stuttgart, Germany, 2019. [Google Scholar]
  29. Reisinger, J. Parametrisierung der Haptik von handbetätigten Stellteilen. Ph.D. Dissertation, Technische Universität München, Munich, Germany, 2009. [Google Scholar]
  30. Schmidtke, H.; Jastrzebska-Fraczek, I. Ergonomie: Daten zur Systemgestaltung und Begriffsbestimmungen; Carl Hanser Verlag GmbH Co KG: München, Germany, 2013; ISBN 3446434801. [Google Scholar]
  31. Meera, C.S.; Sairam, P.S.; Veeramalla, V.; Kumar, A.; Gupta, M.K. Design and Analysis of New Haptic Joysticks for Enhancing Operational Skills in Excavator Control. J. Mech. Des. 2020, 142, 121406. [Google Scholar] [CrossRef]
  32. Hong, T.Z.; Eberman, B.; Srinivasan, M.; Cheng, B. Human Factors for The Design of Force-Reflecting Haptic Interfaces. Dyn. Syst. Control. 1994, 55, 353–359. [Google Scholar]
  33. Hampel, T.; Maier, T. Adaptive Stellmomente und deren Einflussgrößen auf den Komfort-und Qualitätseindruck bei multifunktionalen Drehstellern. In Proceedings of the Der Mensch im Mittelpunkt technischer Systeme. 8th Berliner Werkstatt Mensch-Maschine-Systeme 2009, Berlin, Germany, 7–9 October 2009. [Google Scholar]
  34. Hampel, T.; Maier, T. Einflussgrößen auf die Wahrnehmung von Drehmomentunterschieden bei Drehstellern. In Der Fahrer im 21. Jahrhundert. Fahrer, Fahrerunterstützung und Bedienbarkeit. VDI-Berichte 2009, 2085, 269–276. [Google Scholar]
  35. Schmid, P.; Janny, B.; Maier, T. Evidence Based Data for the Design of Rotary Control Elements for Fine Motor Adjustment Tasks with Respect to the Elderly User. In Proceedings of the 20th Congress of the International Ergonomics Association (IEA 2018), Florence, Italy, 26–30 August 2018; Bagnara, S., Tartaglia, R., Albolino, S., Alexander, T., Fujita, Y., Eds.; Springer International Publishing: Cham, Switzerland, 2019; pp. 168–177, ISBN 978-3-319-96064-7. [Google Scholar]
  36. Glohr, T.; Schynoll, S.; Zimmermann, A.; Maier, T. Interaction of Haptics, Acoustics and Optics in the Perception of Rotatory Control Devices. In Advances in Ergonomics Modeling, Usability & Special Populations; Soares, M., Falcão, C., Ahram, T.Z., Eds.; Springer International Publishing: Cham, Switzerland, 2017; pp. 599–611. ISBN 978-3-319-41684-7. [Google Scholar]
  37. Kühner, M.; Wild, J.; Bubb, H.; Bengler, K.; Schneider, J. Haptic perception of viscous friction of rotary switches. In Proceedings of the 2011 IEEE World Haptics Conference, Istanbul, Turkey, 21–24 June 2011; pp. 587–591. [Google Scholar]
  38. Neumann, A.P.; Schmitt, R.H. Quality Perception of Rotary Switches. ATZ Worldw. 2015, 117, 44–49. [Google Scholar] [CrossRef]
  39. Schmitt, R.H.; Neumann, A. Sensorische Qualitätswahrnehmung von Drehschaltern objektivieren. ATZ—Automob. Z. 2013, 115, 616–622. [Google Scholar] [CrossRef]
  40. Anguelov, N. Haptic and acoustic parameters for objectifying and optimizing the perceived value of switches and control panels for automotive interiors. Ph.D. Thesis, Dresden University of Technology, Dresden, Germany, 2009. [Google Scholar]
  41. Wagner, C.R.; Stylopoulos, N.; Howe, R.D. The role of force feedback in surgery: Analysis of blunt dissection. In Proceedings of the 10th Symposium on Haptic Interfaces for Virtual Environment and Teleoperator Systems, HAPTICS 2002, Orlando, FL, USA, 24–25 March 2002; IEEE Computer Society: Washington, DC, USA, 2002; pp. 68–74, ISBN 0-7695-1489-8. [Google Scholar]
  42. Bachman, P.; Milecki, A. Safety Improvement of Industrial Drives Manual Control by Application of Haptic Joystick. In Intelligent Systems in Production Engineering and Maintenance; Burduk, A., Chlebus, E., Nowakowski, T., Tubis, A., Eds.; Springer International Publishing: Cham, Switzerland, 2019; pp. 563–573. ISBN 978-3-319-97489-7. [Google Scholar]
  43. Sekizuka, R.; Ito, M.; Raima, C.; Saiki, S.; Yamazaki, Y.; Kurita, Y. Force Feedback Design of Operation Levers Considering the Characteristics of Human Force Perception to Improve Hydraulic Excavator Operability. IEEE Access 2022, 10, 926–938. [Google Scholar] [CrossRef]
  44. Surale, H.B.; Gupta, A.; Hancock, M.; Vogel, D. TabletInVR: Exploring the Design Space for Using a Multi-Touch Tablet in Virtual Reality. In Proceedings of the 2019 CHI Conference on Human, Factors in Computing Systems, Glasgow, Scotland, UK, 4–9 May 2019; Brewster, S., Fitzpatrick, G., Cox, A., Kostakos, V., Eds.; ACM: New York, NY, USA, 2019; pp. 1–13, ISBN 9781450359702. [Google Scholar]
  45. Bowman, D.A.; Wingrave, C.A. Design and evaluation of menu systems for immersive virtual environments. In Proceedings of the IEEE Virtual Reality 2001, Yokohama, Japan, 13–17 March 2001; IEEE Computer Society: Washington, DC, USA, 2001; pp. 149–156, ISBN 0-7695-0948-7. [Google Scholar]
  46. Fox, D.; Park, S.S.Y.; Borcar, A.; Brewer, A.; Yang, J. Element Selection of Three-Dimensional Objects in Virtual Reality. In Virtual, Augmented and Mixed Reality: Interaction, Navigation, Visualization, Embodiment, and Simulation; Chen, J.Y., Fragomeni, G., Eds.; Springer International Publishing: Cham, Switzerland, 2018; pp. 13–29. ISBN 978-3-319-91580-7. [Google Scholar]
  47. George, C.; Khamis, M.; von Zezschwitz, E.; Schmidt, H.; Burger, M.; Alt, F.; Hussmann, H. Seamless and Secure VR: Adapting and Evaluating Established Authentication Systems for Virtual Reality. In Proceedings of the 2017 Workshop on Usable Security, Workshop on Usable Security, San Diego, CA, USA, 26 February 2017; Volkamer, M., Renaud, K., Eds.; Internet Society: Reston, VA, USA, 2017. ISBN 1-891562-47-9. [Google Scholar]
  48. Lu, Y.; Yu, C.; Shi, Y. Investigating Bubble Mechanism for Ray-Casting to Improve 3D Target Acquisition in Virtual Reality. In Proceedings of the 2020 IEEE Conference on Virtual Reality and 3D User Interfaces (VR), Atlanta, GA, USA, 22–26 March 2020; IEEE: Piscataway, NJ, USA, 2020; pp. 35–43, ISBN 978-1-7281-5608-8. [Google Scholar]
  49. Riege, K.; Holtkamper, T.; Wesche, G.; Frohlich, B. The Bent Pick Ray: An Extended Pointing Technique for Multi-User Interaction. In Proceedings of the 3D User Interfaces (3DUI’06), Alexandria, VA, USA, 25–29 March 2006; IEEE: Piscataway, NJ, USA, 2006; pp. 62–65, ISBN 1-4244-0225-5. [Google Scholar]
  50. Vanacken, L.; Grossman, T.; Coninx, K. Exploring the Effects of Environment Density and Target Visibility on Object Selection in 3D Virtual Environments. In Proceedings of the 2007 IEEE Symposium on 3D User Interfaces, Charlotte, NC, USA, 10–11 March 2007; IEEE: Piscataway, NJ, USA, 2007. ISBN 1-4244-0907-1. [Google Scholar]
  51. Safikhani, S.; Holly, M.; Pirker, J. Work-in-Progress—Conceptual Framework for User Interface in Virtual Reality. In Proceedings of the 2020 6th International Conference of the Immersive Learning Research Network (iLRN), San Luis Obispo, CA, USA, 21–25 June 2020; IEEE: Piscataway, NJ, USA, 2020; pp. 332–335, ISBN 978-1-7348995-0-4. [Google Scholar]
  52. Kharoub, H.; Lataifeh, M.; Ahmed, N. 3D User Interface Design and Usability for Immersive VR. Appl. Sci. 2019, 9, 4861. [Google Scholar] [CrossRef] [Green Version]
  53. Tanjung, K.; Nainggolan, F.; Siregar, B.; Panjaitan, S.; Fahmi, F. The Use of Virtual Reality Controllers and Comparison Between Vive, Leap Motion and Senso Gloves Applied in The Anatomy Learning System. J. Phys. Conf. Ser. 2020, 1542, 12026. [Google Scholar] [CrossRef]
  54. Pietro, G.d.; Gallo, L.; Howlett, R.J.; Jain, L.C.; Vlacic, L. (Eds.) Intelligent Interactive Multimedia Systems and Services; Springer International Publishing: Cham, Switzerland, 2019; ISBN 978-3-319-92230-0. [Google Scholar]
  55. Borst, C.W.; Indugula, A.P. Realistic virtual grasping. In IEEE Proceedings, Proceedings of the VR 2005, Virtual Reality, 2005, Bonn, Germany, 12–16 March 2005; IEEE: Piscataway, NJ, USA, 2005; pp. 91–320. ISBN 0-7803-8929-8. [Google Scholar]
  56. Prachyabrued, M.; Borst, C.W. Visual feedback for virtual grasping. In Proceedings of the 2014 IEEE Symposium on 3D User Interfaces (3DUI), Minneapolis, MN, USA, 29–30 March 2014; IEEE: Piscataway, NJ, USA, 2014; pp. 19–26, ISBN 978-1-4799-3624-3. [Google Scholar]
  57. Montgomery, D.C. Design and Analysis of Experiments, 8th ed.; Wiley: Hoboken, NJ, USA, 2013; ISBN 978-1118146927. [Google Scholar]
  58. Scheffler, E. Statistische Versuchsplanung und -auswertung: Eine Einführung für Praktiker 186 Tabellen; Dt. Verl. für Grundstoffindustrie; Wiley-VCH: Stuttgart/Weinheim, Germany, 2001; ISBN 3527309578. [Google Scholar]
  59. Siebertz, K.; van Bebber, D.; Hochkirchen, T. Statistische Versuchsplanung; Springer: Berlin/Heidelberg, Germany, 2017; ISBN 978-3-662-55742-6. [Google Scholar]
  60. Jones, B.; Goos, P. I-Optimal Versus D-Optimal Split-Plot Response Surface Designs. J. Qual. Technol. 2012, 44, 85–101. [Google Scholar] [CrossRef] [Green Version]
  61. Anderson, M.J.; Whitcomb, P.J. RSM Simplified; Productivity Press: New York, NY, USA, 2016; ISBN 9781498745994. [Google Scholar]
  62. Berkman, M.I.; Akan, E. Presence and Immersion in Virtual Reality. In Encyclopedia of Computer Graphics and Games; Lee, N., Ed.; Springer International Publishing: Cham, Switzerland, 2019; pp. 1–10. ISBN 978-3-319-08234-9. [Google Scholar]
  63. Slater, M.; Wilbur, S. A Framework for Immersive Virtual Environments (FIVE): Speculations on the Role of Presence in Virtual Environments. Presence Teleoperators Virtual Environ. 1997, 6, 603–616. [Google Scholar] [CrossRef]
  64. Wall, K. Mixed-Methods-Untersuchung zur Display Fidelity von Immersiven Virtuellen Fahrzeugprototypen. Ph.D. Thesis, Ilmenau University of Technology, Ilmenau, Germany, 2019. [Google Scholar]
  65. Usoh, M.; Catena, E.; Arman, S.; Slater, M. Using Presence Questionnaires in Reality. Presence Teleoperators Virtual Environ. 2000, 9, 497–503. [Google Scholar] [CrossRef]
  66. Laugwitz, B.; Held, T.; Schrepp, M. Construction and Evaluation of a User Experience Questionnaire. In HCI and Usability for Education and Work; Holzinger, A., Ed.; Springer: Berlin/Heidelberg, Germany, 2008; pp. 63–76. ISBN 978-3-540-89349-3. [Google Scholar]
  67. Rauschenberger, M.; Schrepp, M.; Perez-Cota, M.; Olschner, S.; Thomaschewski, J. Efficient Measurement of the User Experience of Interactive Products. How to use the User Experience Questionnaire (UEQ).Example: Spanish Language Version. IJIMAI 2013, 2, 39. [Google Scholar] [CrossRef]
  68. Hart, S.G.; Staveland, L.E. Development of NASA-TLX (Task Load Index): Results of Empirical and Theoretical Research. Adv. Psychol. 1988, 52, 139–183. [Google Scholar] [CrossRef]
  69. Seifert, K. Evaluation multimodaler Computer-Systeme in frühen Entwicklungsphasen. Ph.D. Thesis, Technical University Berlin, Berlin, Germany, 2002. [Google Scholar]
  70. Cook, R.D. Influential Observations in Linear Regression. J. Am. Stat. Assoc. 1979, 74, 169–174. [Google Scholar] [CrossRef]
  71. Myers, R.H.; Montgomery, D.C.; Anderson-Cook, C. Response Surface Methodology: Process and Product Optimization Using Designed Experiments, 4th ed.; Wiley: Hoboken, NJ, USA, 2016; ISBN 978-1-118-91601-8. [Google Scholar]
  72. StatEase Inc. Numerical Optimization Algorithm. Available online: https://www.statease.com/docs/v11/contents/optimization/numerical-optimization-algorithm/ (accessed on 7 December 2022).
  73. Ayoub, M.M.; Miller, M. Industrial Workplace Design. In Workspace, Equipment and Tool Design; Elsevier: Amsterdam, The Netherlands, 1991; pp. 67–92. ISBN 9780444874412. [Google Scholar]
  74. Argelaguet, F.; Hoyet, L.; Trico, M.; Lecuyer, A. The role of interaction in virtual embodiment: Effects of the virtual hand representation. In Proceedings of the 2016 IEEE Virtual Reality (VR), Greenville, SC, USA, 19–23 March 2016; IEEE: Piscataway, NJ, USA, 2016; pp. 3–10, ISBN 978-1-5090-0836-0. [Google Scholar]
  75. Lougiakis, C.; Katifori, A.; Roussou, M.; Ioannidis, I.-P. Effects of Virtual Hand Representation on Interaction and Embodiment in HMD-based Virtual Environments Using Controllers. In Proceedings of the 2020 IEEE Conference on Virtual Reality and 3D User Interfaces (VR), Atlanta, GA, USA, 22–26 March 2020; IEEE: Piscataway, NJ, USA, 2020; pp. 510–518, ISBN 978-1-7281-5608-8. [Google Scholar]
  76. Rebelo, F.; Noriega, P.; Duarte, E.; Soares, M. Using virtual reality to assess user experience. Hum. Factors 2012, 54, 964–982. [Google Scholar] [CrossRef]
  77. Karapanos, E.; Zimmerman, J.; Forlizzi, J.; Martens, J.-B. User experience over time. In Proceedings of the CHI ‘09: CHI Conference on Human Factors in Computing Systems, Boston, MA, USA, 4–9 April 2009; Olsen, D.R., Arthur, R.B., Hinckley, K., Morris, M.R., Hudson, S., Greenberg, S., Eds.; ACM: New York, NY, USA, 2009; pp. 729–738, ISBN 9781605582467. [Google Scholar]
  78. Fallahiarezoudar, E.; Ahmadipourroudposht, M.; Ngadiman, N.H.A. An empirical regression model toward optimized ergonomic conditions for monitoring room operators using RSM. Facilities 2021, 39, 449–469. [Google Scholar] [CrossRef]
  79. Sauro, J.; Lewis, J.R. Quantifying the User Experience: Practical Statistics for User Research, 2nd ed.; Elsevier/Morgan Kaufmann: Cambridge, MA, USA, 2016; ISBN 9780128025482. [Google Scholar]
  80. Krosnick, J.A.; Fabrigar, L.R. Designing Rating Scales for Effective Measurement in Surveys. In Survey Measurement and Process Quality; Lyberg, L., Biemer, P., Collins, M., Leeuw, E., de Dippo, C., Schwarz, N., Trewin, D., Eds.; Wiley: Hoboken, NJ, USA, 1997; pp. 141–164. ISBN 9780471165590. [Google Scholar]
  81. Saris, W.E.; Gallhofer, I.N. Design, Evaluation, and Analysis of Questionnaires for Survey Research; John Wiley & Sons, Inc.: Hoboken, NJ, USA, 2007; ISBN 9780470165195. [Google Scholar]
  82. Harms, P. Automated Usability Evaluation of Virtual Reality Applications. ACM Trans. Comput.-Hum. Interact. 2019, 26, 1–36. [Google Scholar] [CrossRef]
  83. Kerefeyn, S.; Maleshkov, S. Manipulation of virtual objects through a LeapMotion optical sensor. Int. J. Comput. Sci. Issues 2015, 12, 52–57. [Google Scholar]
  84. Li, Y.; Huang, J.; Tian, F.; Wang, H.-A.; Dai, G.-Z. Gesture interaction in virtual reality. Virtual Real. Intell. Hardw. 2019, 1, 84–112. [Google Scholar] [CrossRef]
  85. Zhang, H. Head-mounted display-based intuitive virtual reality training system for the mining industry. Int. J. Min. Sci. Technol. 2017, 27, 717–722. [Google Scholar] [CrossRef]
  86. Apple Vision Pro. Available online: https://www.apple.com/apple-vision-pro/ (accessed on 23 July 2023).
Figure 1. Overview of the methodological approach.
Applsci 13 08668 g001
Figure 2. Experimental setups with different factor levels. Top left: Visual feedback on the rate of change. Top right: Horizontal joystick. Bottom left: A 20 mm rotary control with knurling. Bottom right: An 80 mm rotary control with knob and 45° inclination.
Applsci 13 08668 g002
Figure 3. Experimental setup in VR. Left: Examination of the joystick. Right: Examination of the rotary control.
Applsci 13 08668 g003
Figure 4. Effect of the factor angular resolution on time on task and positioning accuracy.
Applsci 13 08668 g004
Figure 5. Optimized shape and diameter of the rotary control.
Applsci 13 08668 g005
Figure 6. Effect of the factor positioning speed on time on task and positioning accuracy.
Applsci 13 08668 g006
Figure 7. Optimized shape and height of the VR joystick.
Applsci 13 08668 g007
Table 1. Recommendations for the design of rotary controls.
ParameterRecommended Value
Anguelov [36]
Recommended Value Schmidtke [35]
Diameter40–50 mm≥30 mm
Number of detent pos.25–358–24
Torque30–40 mNm200–700 mNm
Table 2. Identified factors that could influence the operation and subjective perception of users.
Factor+
Rotary
control
Angular resolution5°/Value45°/Value
Diameter20 mm110 mm
Inclination 90°
ShapeKnurling/Toggle/Cylinder
JoystickMax. angle of deflection10°45°
Max. positioning speed2.5%/s12%/s
Size (vertical/horizontal)15/7 cm32/17 cm
Angular resolution3-Stagelinear
Visual feedbackYesNo
ShapeVerticalHorizontal
Rotary control and joystickHaptic feedbackYesNo
Acoustic feedbackYesNo
Hand visualizationYesNo
Position of the participantSittingStanding
VR environmentTableCrane
Input device usedHTC ViveValve Index
Table 3. The first three runs of the test design for the rotary control.
RunA: Angular
Resolution (°/s)
B: Diameter (mm)C: Inclination (°)D: Haptic
Feedback
1104045No
2451100Yes
3454045No
Table 4. Tasks of the user tests.
TaskRotary ControlJoystick
1Set the value from 0 to 12Set the value from 0 to 42
2Set the value from 12 to 11Set the value from 42 to 41
3Set the value from 11 to 31Set the value from 41 to 8
4Set the value from 31 to 10, then to 15, then to 8Set the value from 8 to 98, then to 40, then to 50
Table 5. Factors that had a significant effect (p < 0.05) on the evaluation parameters when operating the rotary control. If a factor had a significant influence on an evaluation parameter, the significance value was entered. If the factor has no significant influence, “---” was entered.
FactorToTAccSUSQNASA TLXUEQPUEQEUEQD
A<0.0010.003---<0.001---<0.0010.012
B---------0.038---<0.001---
C<0.001------------------
D0.020------------------
E---------------------
F---------------0.004---
G---------0.004---------
H---------------------
J---0.0170.006------------
K------------0.002---0.019
AC<0.001------------------
AG------------------0.040
BE------0.0060.002<0.001------
EF---------------0.006---
EH---------.003---------
HK---------------<0.001---
A: angular resolution; B: diameter; C: inclination; D: haptic feedback, E: acoustic feedback; F: visualized hand; G: shape; H: position participant; J: input device; K: VR environment.
Table 6. Mathematical models of the rotary control with coded factors. The italicized factors alone had no significant influence on the respective evaluation parameters. They were included in the model because the interaction with this factor had a significant influence on the evaluation parameter.
Mathematical ModelsR2AdjSNR
ToT = 45.0 + 27.2A + 12.8C + 4.8D + 15.0AC0.8419.70
Acc = 3.0 − 1.7A + 0.9J0.306.83
SUSQ = 4.4 − 0.3B − 0.1E − 0.7J − 1.1BE0.286.96
NASA = 4.09 + 2.5A + 0.9B − 0.1E + 1.3G1 + 0.2G2 − 0.4H − 1.5BE − 1.2EH0.7512.85
UEQP = 2.5 − 0.07B − 0.01E − 0.3K + 0.5BE0.387.98
UEQE = 1.5 − 0.8A − 0.7B − 0.04E + 0.3F + 0.08H − 0.1K − 0.3EF − 0.5HK0.7112.20
UEQD = 1.7 − 0.5A − 0.4G1 + 0.04G2 − 0.4K − 0.7AG1 + 0.3AG20.349.90
A: Angular resolution; B: Diameter; C: Inclination; D: Haptic feedback, E: Acoustic feedback; F: Visualization hand; G: Shape; H: Position participant; J: Input device; K: VR environment.
Table 7. Results of confirmation runs for the rotary control. Predicted parameter results vs. measured results of the validation runs.
ParameterPred. MeanStd Dev95% PI LowData Mean95% PI High
Time on Task20 s10 s7 s18 s34 s
Pos. Accuracy3.131.990.801.285.47
SUSQ4.901.213.394.506.42
NASA0.001.50−3.082.632.12
UEQP2.960.372.492.063.43
UEQE2.430.461.721.883.15
UEQD2.420.721.462.133.38
Table 8. Factors that had a significant effect (p < 0.05) on the evaluation parameters when operating the joystick. If a factor had a significant influence on an evaluation parameter, the significance value was entered. If the factor has no significant influence, “---” was entered.
FToTAccSUSQUEQPUEQEUEQSUEQN
A<0.001<0.001------<0.0010.016---
B---------------------
C<0.001------------------
D0.0140.010---------0.028---
E---------0.014---------
F---------------------
G------------------0.031
H---------------------
J---------------------
K------0.008---0.039------
L---------------------
M------------0.0070.004<0.001
EK---0.003---------------
AG------<0.001------------
FL------------------0.002
BC------------0.009------
A: positioning speed; B: deflection angle; C: size; D: position participant; E: shape; F: VR environment; G: angular resolution; H: input device; J: haptic feedback; K: acoustic feedback; L: visual feedback; M: visualized hand.
Table 9. Mathematical models of the joystick with coded factors. The italicized factors alone had no significant influence on the respective evaluation parameters. They were included in the model because the interaction with this factor had a significant influence on the evaluation parameter.
Mathematical ModelsR2AdjSNR
ToT = 82.3 − 31.9A + 3.3C1 − 15.7C2 + 6.8D 0.7615.20
Acc = 25.3 + 13.4A + 5.1D + 1.8E − 0.2K − 6.1EK0.5215.20
SUSQ = 4.1 + 0.02A + 0.35G1 − 0.35G2 − 0.6K + 1.5AG1 −1.3AG2 0.346.61
UEQE = 1.2 + 0.7A + 0.1B − 0.02C1 + 0.1C2 − 0.2K − 0.3M − 0.1BC1 − 0.8BC20.499.76
UEQS = 1.2 + 0.5A − 0.3D − 0.4M0.339.10
UEQN = 1.2 + 0.2F + 0.4G1 − 0.5G2 + 0.2L − 0.5M + 0.5FL0.387.40
A: positioning speed; B: deflection angle; C: size; D: position participant; E: shape; F: VR environment; G: angular resolution; K: acoustic feedback; L: visual feedback; M: visualized hand.
Table 10. Results of confirmation runs for the joystick. Predicted parameter results vs. measured results of the validation runs.
ParameterPred. MeanStd Dev95% PI LowData Mean95% PI High
Time on Task34.6514,.315.4623.1053.81
Pos. Accuracy231091037
UEQP1.971.200.602.253.35
UEQE2.910.651.942.063.88
UEQS2.290.761.321.133.27
UEQN3.000.711.751.314.29
Disclaimer/Publisher’s Note: The statements, opinions and data contained in all publications are solely those of the individual author(s) and contributor(s) and not of MDPI and/or the editor(s). MDPI and/or the editor(s) disclaim responsibility for any injury to people or property resulting from any ideas, methods, instructions or products referred to in the content.

