Article

Fostering Sustainable Aquaculture: Mitigating Fish Mortality Risks Using Decision Trees Classifiers

by
Dimitris C. Gkikas
1,*,
Marios C. Gkikas
2 and
John A. Theodorou
1
1
Department of Fisheries & Aquaculture, School of Agricultural Sciences, University of Patras, 26504 Messolonghi, Greece
2
OWEB Digital Experience, 26 Eosef Rogon Str., 30200 Messolongi, Greece
*
Author to whom correspondence should be addressed.
Appl. Sci. 2024, 14(5), 2129; https://doi.org/10.3390/app14052129
Submission received: 24 January 2024 / Revised: 20 February 2024 / Accepted: 27 February 2024 / Published: 4 March 2024
(This article belongs to the Special Issue Soft Computing Methods and Applications for Decision Making)

Abstract

:

Featured Application

The specific application of this work involves the development of an intelligent system for diagnosing and treating fish diseases in Greek fish farming. The project aims to enhance the competitiveness of Greek fish farming by addressing the increasing mortality rates attributed to unsustainable farming methods and environmental factors. The application of data mining classifiers, particularly decision trees (DTs), in predicting and categorizing fish mortality instances contributes to the development of an intelligent system for disease diagnosis and treatment. The proactive approach, supported by rigorous evaluation processes and a feature importance analysis, holds implications for sustainable aquaculture management and aligns with global sustainability initiatives.

Abstract

A proposal has been put forward advocating a data-driven strategy that employs classifiers from data mining to foresee and categorize instances of fish mortality. This addresses the increasing concerns regarding the death rates in caged fish environments because of the unsustainable fish farming techniques employed and environmental variables involved. The aim of this research is to enhance the competitiveness of Greek fish farming through the development of an intelligent system that is able to diagnose fish diseases in farms. This system concurrently addresses medication and dosage issues. To achieve this, a comprehensive dataset derived from various aquaculture sources was used, including various factors such as the geographic locations, farming techniques, and indicative parameters such as the water quality, climatic conditions, and fish biological characteristics. The main objective of the research was to categorize fish mortality cases through predictive models. Advanced data mining classification methods, specifically decision trees (DTs), were used for the comparison, aiming to recognize the most appropriate method with high precision and recall rates in predicting fish death rates. To ensure the reliability of the results, a methodical evaluation process was adopted, including cross-validation and a classification performance assessment. In addition, a statistical analysis was performed to gain insights into the factors that identify the correlations between the various factors affecting fish mortality. This analysis contributes to the development of targeted conservation and restoration action strategies. The research results have important implications for sustainable management actions, enabling stakeholders to proactively address issues and monitor aquaculture practices. This proactive approach ensures the protection of farmed fish quantities while meeting global seafood requirements. The data mining using a classification approach coincides with the general context of the UN sustainability goals, reducing the losses in seafood management and production when dealing with the consequences of climate change.

1. Introduction

Increasing mortality rates are a major challenge for both wild fisheries and in marine aquaculture. Various factors, such as overfishing, the presence of pollutants, the destruction of ecosystems, and climate change, contribute to the increased rates. Overfishing threatens the sustainability of marine aquaculture, underscoring the urgent need to address this challenge [1,2].
Furthermore, pollution from industrial and agricultural activities has resulted in a degraded water quality, adversely impacting fish health and survival [3].
In the realm of aquaculture, unsustainable practices, such as overcrowding, poor water quality, and excessive antibiotic use, can trigger disease outbreaks and lead to heightened mortality rates. The rapid expansion of aquaculture has been accompanied by environmental degradation and disease proliferation, resulting in substantial fish losses [4,5].
This work introduces a project dedicated to enhancing Greek fish farming through the incorporation of innovative technologies and sustainable practices. The project’s core objective is the development of intelligent systems for diagnosing and treating fish diseases, ultimately bolstering the competitiveness of Greek aquaculture. The proposed data-driven strategy utilizes data mining classification methods, including decision trees (DTs), to predict and categorize instances of fish mortality. The model considers various factors such as the geographical locations, husbandry methods, water quality, weather conditions, and biological characteristics of the fish. The application of DTs in the research allows for the identification of thresholds for features like the median atomic weight (MAB), water temperature (Temp), volume of the cell (Vol), and concentration of fish inside the cell (i–f), leading to the classification of outcomes into specific classes. The project’s aim is to aid sustainable aquaculture management, offering a proactive approach to address fish mortality issues by demonstrating valuable insights into the factors influencing fish mortality. The findings aid the development of targeted conservation and management strategies, empowering stakeholders to protect farmed fish stocks. The current research complies with the UN sustainability goals to reduce seafood production losses due to climate change [6].
This research effort aims to promote sustainable fishing and aquaculture in Greece. The current project, entitled “Improving Greek Fish Farming Competitiveness”, aims to upgrade the sector by creating an intelligent system for diagnosing fish diseases, taking into account factors including the treatment, diet, temperature, and volume. This initiative is coordinated with a broader effort to enhance the competitiveness of Greek fish farming through the integration of technological innovation and sustainable practices [7].
This study comprises six distinct sections, each contributing to a comprehensive understanding of the proposed data-driven strategy for fish mortality prediction and categorization. These sections encompass the Introduction, Related Work, Research Methodology, Results, Discussion, and Conclusions. Each segment provides a structured overview of our approach, methodology, findings, and implications. Hence, the introductory part has made clear the scope and goal of the current study regarding the application of data mining models in fish mortality prediction. Following this, the Related Work refers to existing research, studies, or projects that are relevant to the use of data mining in fish mortality prediction, incorporating the research objectives of the study. The Research Methodology mentions the specific approach, techniques, and procedures used to conduct the study. This section outlines how the research was designed, implemented, and analyzed to address the research questions or objectives. It includes details about the research scope, an overview of the method used, the dataset, as well as the DTs classifiers. The Results section provides information about the outcomes and findings of the study based on the descriptive statistical analysis of the collected data, including explanatory tables, and figures to present the mortality rates through DT classification, highlighting the implications and significance of the findings in relation to the research questions or objectives. The Discussion negotiates the interpretation of the results produced by the study, providing a context in which the findings take shape and purpose, discussing their implications, and drawing overall conclusions. Moreover, the last section refers to conclusions and summarizes the key points of the paper, enhancing the main notions for the reader.

2. Related Work

The current research negotiates the use of DT classifier prediction models in fish mortality factors. Thus, the field of study combines the data mining techniques configuration and application and its contribution to the cage aquaculture industry. Also, a statistical analysis of the factors which affect fish mortality takes place, indicating those that are more likely to impact fish death rates. The literature review refers to similar attempts to classify and predict fish death rates using machine learning and data mining models.
There is research focusing on a model called “Digital Twin”, which focuses on the design of infrastructure supporting an advanced artificial intelligence Internet of Things (AIoT) system for monitoring fish in the aquaculture industry. This system is based on the Internet of Things and cloud technology combined with artificial intelligence (AI) and machine learning models. The physical unit is equipped with sensors and elements integrated into intelligent fish feeding and selection machines. These collect and transmit raw data to cloud services, using wireless communication networks for real-time and remote monitoring. There are four main software twin services: an automated fish feeding process, fish metric estimation, the measurement of environmental factors, and the monitoring of fish vitality, mortality, and disease. Each one of the digital twin services is designed to support multiple artificial intelligence (AI) services capable of performing sophisticated decision-making processes like optimization, prediction, and data analysis [8].
The development of advanced monitoring technologies presents a critical avenue for addressing the persistent challenges in the aquaculture industry, such as early outbreak detection, the mitigation of massive mortality events, and the promotion of sustainable practices. The current landscape of the fish industry is characterized by these challenges, underscoring the need for sophisticated systems. Another research attempt to provide a comprehensive analysis of the monitoring technologies uses a Gaussian distribution model adjusted for the identification of hazardous operating conditions in industrial fish farming. This model facilitates the visualization of fish production states—ranging from normal to warning to dangerous—through 2D imaging techniques. Moreover, the implications of this method extend beyond cage aquaculture, offering potential applications for advanced decision making across scientific fields. The statistical analysis unveils data patterns within various physical, chemical, and biological systems [9].
Following this, another significant study examines the perspectives of fishermen from various regions in Fiji on the primary causes and risk factors of fish poisoning. Fish poisoning is an emerging health risk, especially given that fish is the main food source. Utilizing a computational, intelligence-based data mining methodology, the research delves into the fishermen’s views, employing data mining techniques. These techniques refer to association rule mining (ARM) and were used to uncover patterns and perceived primary causes of fish poisoning in order to assess the effectiveness of an ARM-based approach in conjunction with a dedicated database for capturing expert fishermen’s insights into fish poisoning. The findings revealed a consensus among fishermen regarding the environmental factors contributing to fish poisoning. Contaminated migratory paths, water pollution, and specific seasonal and environmental conditions were some of the main causes for increased fish mortality rates. These insights had the potential to guide the development of diagnostic decision-making systems for the monitoring, detection, and prediction of fish poisoning, and risk factor-mitigating strategies [10].
Nowadays, aquaculture holds the first place as a fundamental sector of the food industry. However, in order to become a sustainable and more profitable industry, it is necessary to monitor several associated risk factors. These factors include the temperature, salinity, ammonia, hydrogen, nitrogen dioxide, bromine, etc. The current study examines the important role of aquaculture in the food industry and highlights the necessity for sustainable and profitable practices. An innovative detection model based on a multivariate Gaussian probability framework that detects anomalies is proposed, aiming to correlate the gathered raw data of fish tank water compositions with fish mortality rates. The machine learning model, trained on daily data collection for the Senegalese sole, show a high performance in the real-time monitoring and successful prediction of high mortality rates. This approach highlights a significant advancement in predictive modeling, providing unique potentiality to fish farming practices [11].
Digital technologies can organize, store, and analyze big real-time volumes of raw data in an autonomous and self-optimized manner. Such technologies have started affecting general policies, administration, economies, trade, societies, and science. This article explores the potential of three digital data technologies including AI, data mining, and blockchain, in reforming the commercial cage aquaculture industry. These technologies, currently undergoing rapid development and implementation, are significantly influencing various aspects of cage aquaculture trade by providing solutions to significant problems and drawbacks, such as transparency in the supply chain, consumer information access, regulatory oversight, and market competition. By enhancing the transparency and information availability, the trust among stakeholders in the cage aquaculture sector is fostered [12].

Research Objectives

The current study seeks to provide predictions of high accuracy using DTs for mortality case classification. Along with the data mining experiments, a series of statistical analysis tests were conducted to measure the correlation among mortality rates and other factors. The application of DT classifiers is used for analyzing, handling, categorizing, and extracting new patterns from fish data. Different feature types, numbers of classes, and instances were used.
The research objectives refer to four different directives. To begin with, the primary goal is to evaluate the effectiveness of DT classifiers for fish mortality prediction. Following this, it is essential to highlight the impact of a series of environmental factors on fish mortality rates in Greek aquaculture. Research on how the current fish farming practices contribute to fish mortality is also a main objective.
Finally, this study aims to create the foundations of a robust system that not only diagnoses and categorizes fish diseases but also builds the foundations of an effective treatment strategy.
The empirical investigation incorporates three phases: The first phase focuses on the statistical analysis of the fish mortality factors. The second phase refers to the DT application on the raw data of the fish in order to reveal potential matches through a series of mortality occurrences. Finally, the third phase demonstrates the data classification using decision tree graph visualizations along with their classification performance using a dataset of 37,203 instances for training, validation, testing, and visualization. The generated results will indicate the cases under which the dependent and independent factors are related, achieving a high classification accuracy referring to different numbers of class attributes. The research objectives are clearly stated in the following table: each one of them examines the efficiency of such a probabilistic approach for fish mortality prediction (Table 1).

3. Research Methodology

3.1. Research Scope

The proposed research endeavors to address the critical issue of fish mortality in Greek fish farming, which is caused by a combination of factors including overfishing, pollution, habitat destruction, and unsustainable aquaculture practices. The overarching goal is to enhance the competitiveness of Greek aquaculture by developing and implementing intelligent systems for the diagnosis and treatment of fish diseases.

3.2. Method Overview

The collection of data took place in cage aquaculture within the Ionian Sea in Greece, yielding information on nominal (one) and numerical factors (four). The study utilized an extensive dataset, incorporating various elements such as the geographical locations, husbandry methods, and other variables like the water quality and weather conditions. This dataset includes a range of cage aquaculture techniques, offering a wealth of information for the analysis. We utilize a data-driven approach, incorporating data mining classifiers, and leveraging comprehensive datasets from diverse aquaculture sources [13,14].
Prior to the DTs classification deployment, a data mining-algorithm performance comparison took place to determine which algorithm performs better based on the current data. A DT classification performance assessment requires certain steps which need to be taken. Regarding the statistical analysis of the data to analyze the correlations between the “Deaths” variable (considered as the dependent variable) and the other variables in the dataset (considered as independent variables), data cleansing and formatting must be conducted, including handling missing values and outliers. Following this, an exploratory data analysis is conducted to understand the distribution and range of each variable. A correlation analysis is significant to calculate the correlation coefficients between the dependent “Deaths” variable and each of the other independent variables. Finally, data visualization using plots will help to demonstrate the relationships between the “Deaths” variable and the other variables. Data mining classifiers like DTs are employed for the predictive modeling of fish mortality instances. We implement rigorous evaluation processes, such as k-fold cross-validation and a performance metric analysis, to ensure the reliability of the research findings. The data classification is properly represented in tree structures. Rows containing any missing values were excluded from the final dataset analysis. An analysis of these factors was conducted to discern their impact on fish mortality. The study managed to provide measurements of the water quality, weather state, and biological characteristics of the fish as the primary elements influencing mortality rates (Table 2) [15].

3.3. Dataset

A dataset specifically focused on fish mortality was extracted and utilized in the experiments. This dataset encompasses diverse aquaculture practices, providing a rich source of information for the analysis The data were collected from marine aquaculture companies in the Ionian Sea in Greece. The data contain one nominal and four numerical factors (real, integers) of 37,203 instances. This dataset encompasses caged fish information, including variables like the median atomic weight of the fish (MAB), the volume of the cell occupied by the fish (Vol), the concentration of fish within the cell (i–f), the water temperature (Temp), and the number of “Deaths” (Table 2 and Table 3) [16,17,18,19,20].
The values within the “Deaths” variable are transformed into discrete classes, enabling the application of classification algorithms. This transformation process is commonly referred to as binning or discretization (Table 3 and Table 4). The class range segmentation is also demonstrated along its number of instances (Table 5).

3.4. Classification Algorithm Performance Assessment

Before the DT classification process is deployed, a classification algorithm performance assessment is essential to be conducted to define the optimal algorithm for such a classification. To determine which algorithms might perform better for the current dataset, there are several factors that need to be considered, such as the nature of the data, its features, and the specific problem context (classification, regression, etc.). Without applying each algorithm to the data, it is difficult to predict with certainty which one will underperform. Decision trees offer distinct advantages over logistic regression, KNN (K-nearest neighbors), and naive Bayes in various situations, primarily due to their inherent flexibility and robustness to certain types of data. They excel at handling complex and non-linear relationships between features and the target variable, making them particularly useful for datasets where linear models like logistic regression might struggle to capture the underlying patterns. Decision trees naturally accommodate both categorical and numerical data, and their hierarchical structure allows for an intuitive interpretation and analysis, akin to human decision-making processes. This interpretability is a significant advantage, particularly in fields where understanding the decision rationale is as important as the decision itself [21,22,23,24,25].
Moreover, decision trees are less sensitive to outliers and missing values compared to logistic regression and naive Bayes, which can be significantly impacted by such anomalies due to their reliance on assumptions about the data distribution. While KNN is non-parametric and also robust to the non-linearity of data, it can suffer from the curse of dimensionality and become computationally intensive with large datasets, a drawback that decision trees mitigate through feature selection and dimensionality reduction at each split. However, decision trees can be prone to overfitting, especially with very complex trees, and may require techniques like pruning or ensemble methods like random forests to maintain generalizability. In contrast, logistic regression offers a more straightforward, less computationally intensive option for binary outcomes with linear relationships, and naive Bayes can be particularly effective in probabilistic classification tasks, such as spam detection, despite its simplicity and strong independence assumptions [21,22,23,24,25].

3.5. Decision Trees (DTs)

A variety of data mining classifiers were employed in a comparative analysis to determine the most effective method for predicting fish mortality, focusing on achieving a high classification accuracy. Data mining serves as an approach to extract valuable insights through the utilization of data analysis tools and data mining models. These tools enable the discovery of significant correlations, providing essential information for decision-making and predictive processes. Among the commonly used techniques in data mining, DTs play a pivotal role. The application of data mining aims to unearth new knowledge, establish connections and correlations, and reveal intricate patterns [26,27].
Efforts to optimize the binning strategy for a maximum classification accuracy involve patterns for understanding the identification and potential correlation between the “Deaths” variable and other factors. Among the optimal classification strategies is the ability to explore a range of binned variables and measure their effect on the overall data classification performance using cross-validation methods. In the current experiment, the equal width binning model was used for the “Deaths” variable. The initial dataset was divided into training (70%), validation (20%), and testing datasets (10%) [28,29].
DTs that were trained on each binned target in the training set were evaluated using the validation set and tested using the test set. DTs, a frequently employed classification model in data mining, act as a classification mechanism, interpreting data and assigning values to classes in an ‘if-then-else’ sequence. The nodes in the decision tree refer to dataset features, while the branches represent the features values. The top node refers to a superclass which includes the leaf nodes representing the sub-classes. The process involves splitting the entire set of examples into training, validation, and testing datasets [29,30].
Following this, the DT training process takes place with the training set of examples, where a hypothesis is generated, and the percentage of correctly classified examples in the validation sets is calculated. This procedure is repeated with a diverse range of training data. Finally, the testing process validates the results using new data, with overfitting being a potential challenge to the classification process due to insufficient data [29,30].
Tree pruning techniques are employed to address overfitting, maintaining the model’s simplicity and interpretability. The success rate of the data mining methods was gauged by calculating the average success rate across ten experiments (folds). The model underwent training and assessments using a 10-fold cross-validation approach. A pruned DT classifier with a maximum depth of 3 was applied to eliminate overfitting. The 10-fold cross-validation provided a concise measurement of the model’s performance, succeeding in achieving a high average accuracy (95.43%).
In the context of decision trees, the Shannon function plays a crucial role in the DT algorithm, serving to assess the utility of each attribute by quantifying the information it contributes to bits. The Shannon function gauges the overall relevance of an attribute, considering its consistency with the existing knowledge. When an attribute conveys a substantial size of information, the Shannon function yields a lower value. It calculates the information gained from the entire set of examples separately calculated for a specific attribute [29].
The quantification of information gained is expressed in bits, and the mathematical expression for the Shannon function is articulated as follows:
I ( P u 1 , ,   P u n ) = i = 1 n P u i   l o g 2 P ( u i )
where I P u 1 , ,   P u n refers to the amount of information gained by splitting the dataset according to the attributes of P u 1 , ,   P u n , P u refers to the analogy of the dataset assigned to each class after the split, and P( u i ) refers to the probability of the possible answer ( u i ) (Algorithm 1) [29,30,31].
R e m a i n d e r   ( A ) = i = 1 n p i + n i p + n   I   p i p i + n i ,   n i p i + n i
G a i n   A = I     p i p i + n i ,   n i p i + n i R e m a i n d e r   A
G i n i   A = 1 i = 1 n p i 2
Algorithm 1. Shannon function pseudocode.
  • Function shannonFunction(attribute):
  • knowledgeConsistency = evaluateKnowledgeConsistency(attribute)
  • informationGained = calculateInformationGained(attribute)
  • fitnessSimilarity = assessFitnessSimilarity(attribute, knowledgeConsistency)
  • shannonValue = calculateShannonValue(informationGained, fitnessSimilarity)
  • return shannonValue
  • evaluateKnowledgeConsistency(attribute):
  • calculateInformationGained(attribute):
  • assessFitnessSimilarity(attribute, knowledgeConsistency):
  • calculateShannonValue(informationGained, fitnessSimilarity):
  • shannonValue = informationGained/fitnessSimilarity
  • return shannonValue
Beyond the Shannon function, the Gini index and the chi-squared test are also used to measure the information gain from the class attributes. These measures look at different aspects of the data, and the choice of the most suitable function mostly depends on the particular problem. Selecting a suitable function to evaluate the information gain is critical to create precise DTs that can significantly classify and predict results (Algorithm 2) [29,30].
Algorithm 2. Binary decision tree pseudocode.
  • Function Custom_Decision_Tree (Attributes, default_class, training_examples);
  • Atts ← Attributes;
  • Default_Class ← default_class;
  • Training_Examples ← training_examples;
  • Best_Attribute ← 0;
  • Attribute_Values[i] ← Atts[1…N];
  • Subset[i] ← 0;
  • SubTree ← 0;
  • Create Node RootNode;
    • If Training_Examples have the same classification then
    • return classification;
    • If Training_Examples is empty then
    • return Default_Class classification;
  • Best_Attribute ← Find_Best_Attribute(Atts, training_examples);
  • RootNode ← Best_Attribute;
    e.
    For any Attribute_Value(i) of Attribute_Values do
    • Training_Examples(i) ← Best Attribute_Value[i] from Training_Examples;
    f.
    If SubTree is not empty
    g.
    then
    • New_Atts ← Atts - Best_Attribute;
    • SubTree ← Custom_Decision_Tree(SubTree, New_Atts);
    • Attach subtree as a child of RootNode;
    h.
    Else
    • Create Leaf Node Leaf;
    • Leaf ← Default_Class;
    • Attach Leaf as a child of RootNode;
  • Return RootNode;

4. Results

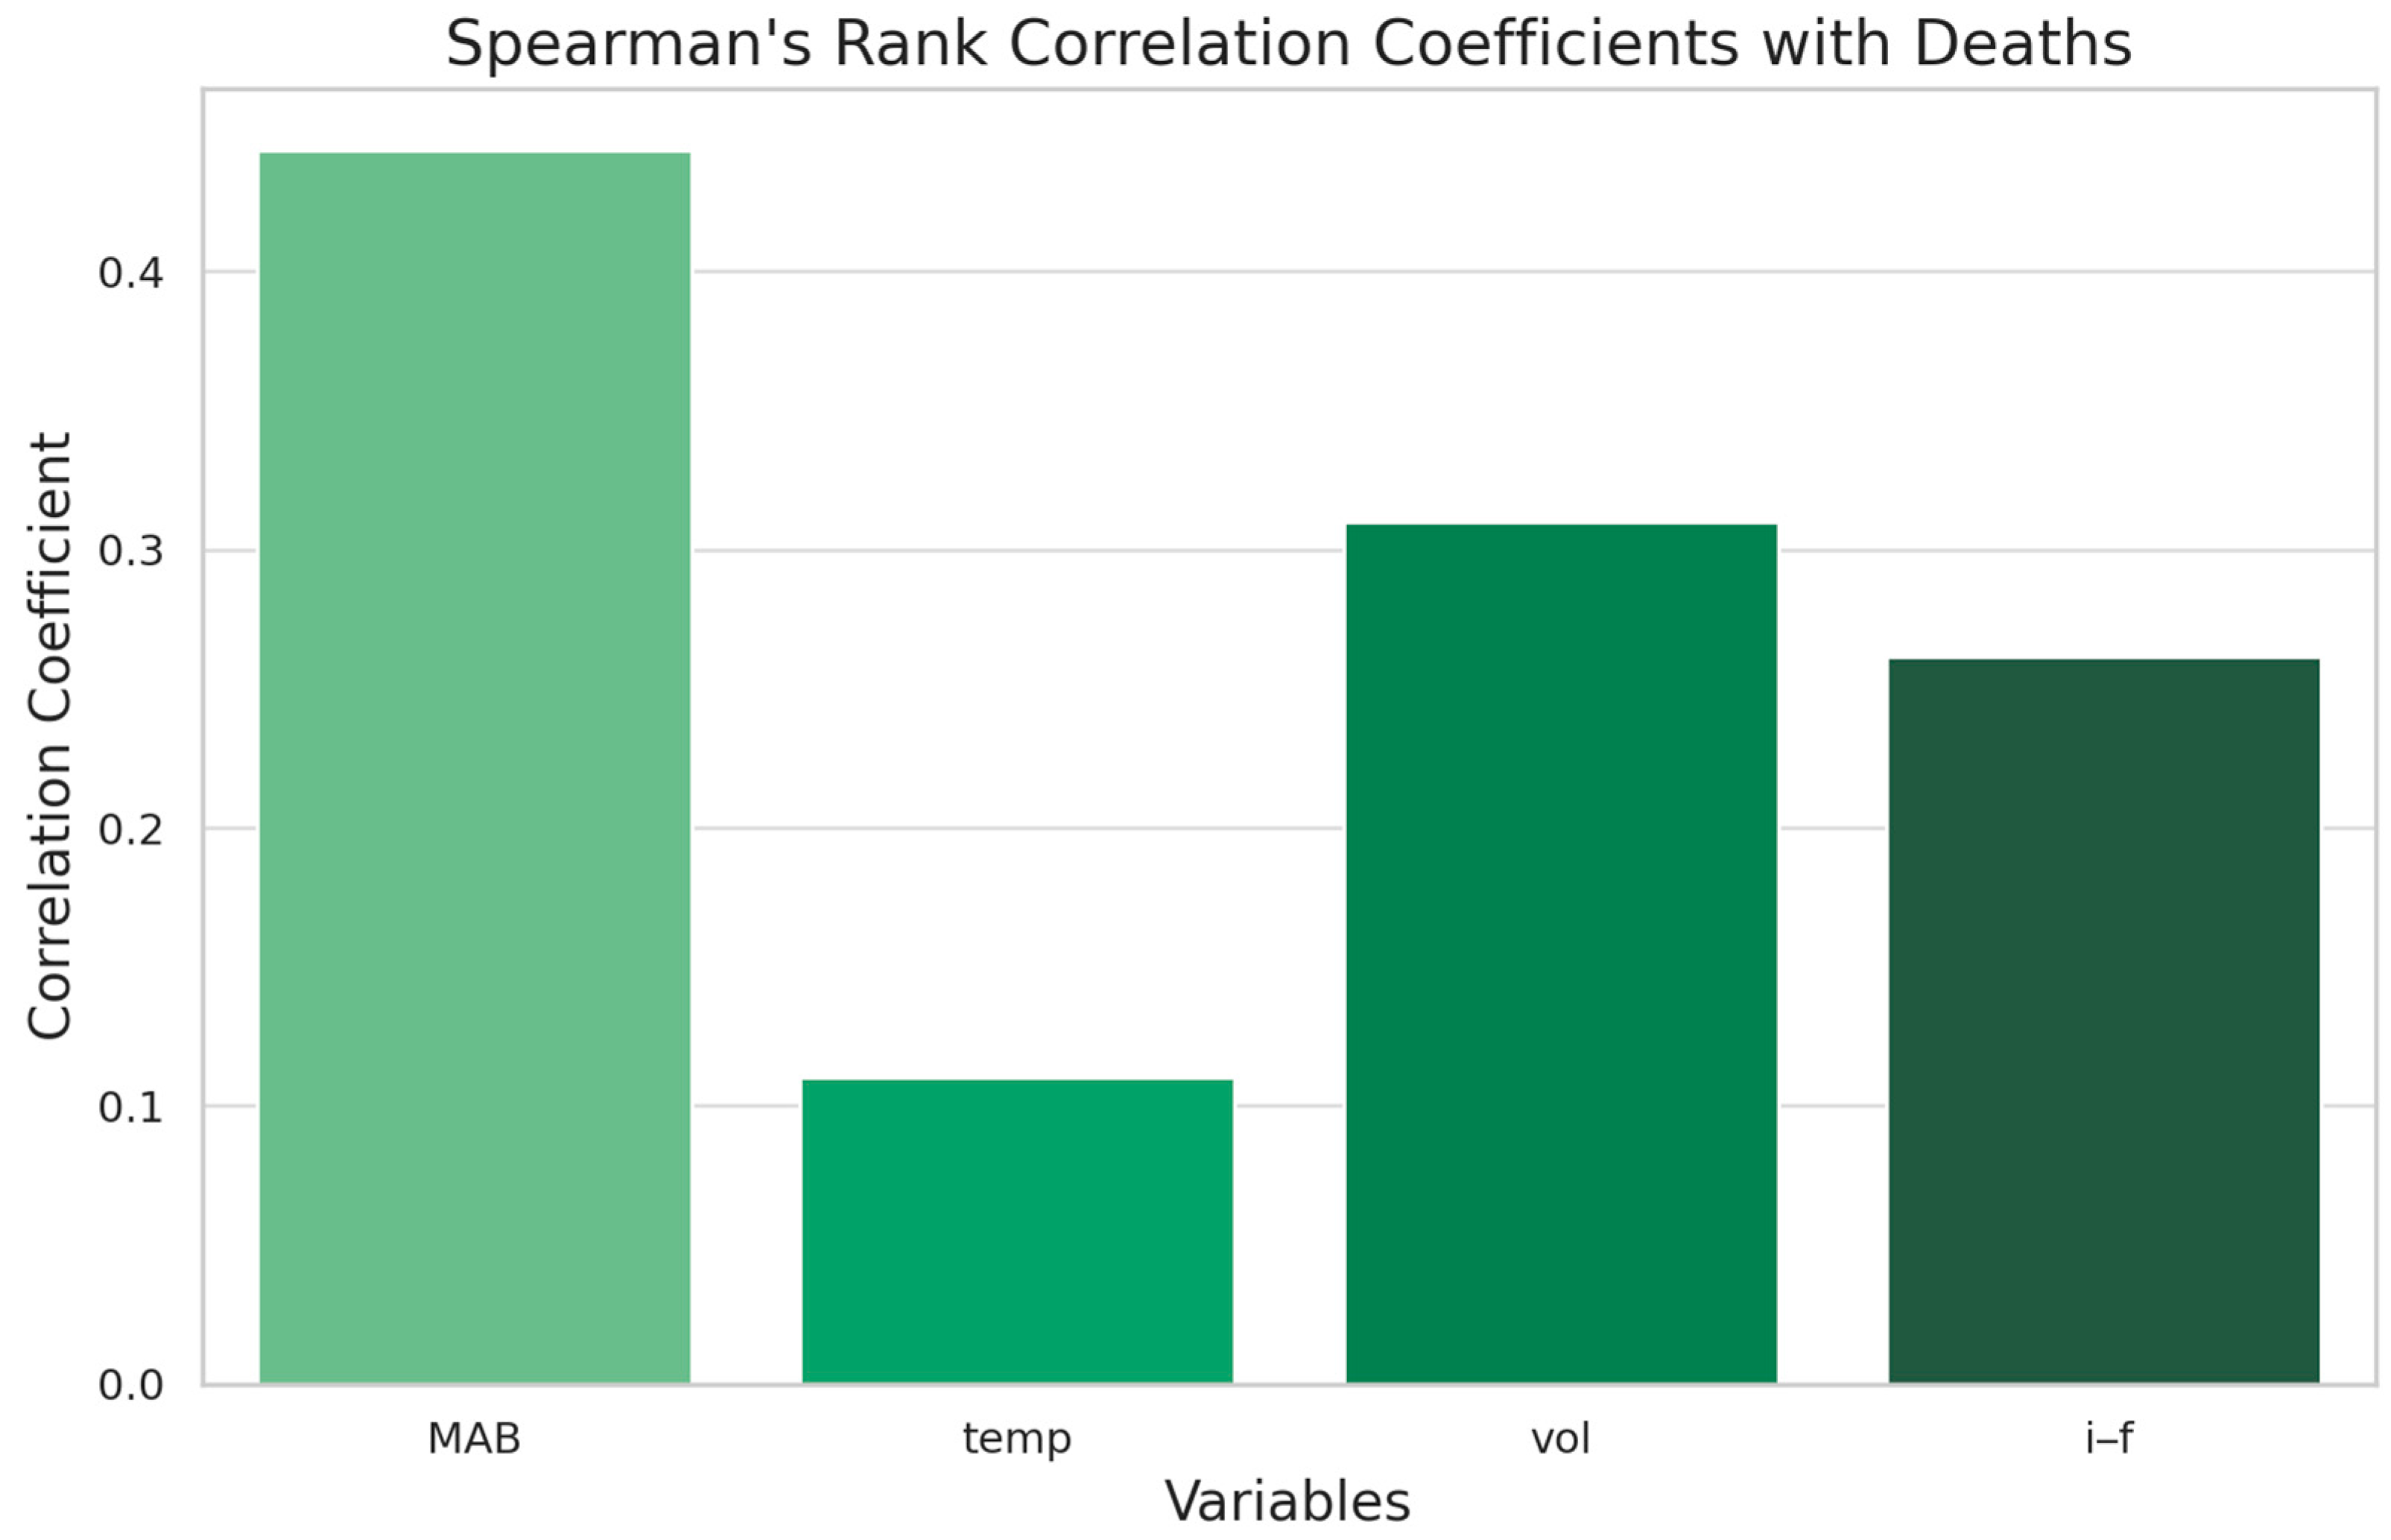
The results present the correlations between various factors and fish mortality. The author discusses the strength and direction of the correlations, highlighting potential relationships between factors like the median atomic weight of the fish, the volume of the cell occupying the fish, the fish concentration inside the cell, and the water temperature. The text also mentions the correlation’s significance or lack thereof in the binned data.

4.1. Descriptive Statistics

Table 6 indicates that for all variables, the p-values are significantly below 0.05, indicating that the data for these variables do not follow a normal distribution. Given these results, it is more appropriate to use non-parametric methods for analyzing the correlations between these variables. To explore the possible correlation between the “Deaths” variable and the other independent variables, the non-parametric Spearman correlation was employed to assess the linear relationship for each pair of continuous variables [16,17,18,19,20].
The correlations have changed after binning the “Deaths” variable. The correlations are generally weaker with the binned “Deaths” variable compared to the original continuous values. This change is expected, as discretizing a continuous variable can lead to a loss of information, which may affect the strength and nature of the relationships with other variables (Table 7).
The MAB has a correlation of 0.4439 with the “Deaths” variable, indicating a moderately positive relationship. This implies that when the MAB increases, the “Deaths” variable tends to increase as well. The “Temp” shows a weak positive correlation of 0.1100 with the “Deaths” variable. The “Vol” has a correlation of 0.3099, indicating a weak to averagely positive relationship with the “Deaths” variable. The “i–f” has a correlation of 0.2616, also indicating a weak to moderately positive relationship with the “Deaths” variable. All variables have very low p-values (close to 0), indicating strong statistical significances of the correlations with “Deaths” (Figure 1) (Table 7).

4.2. Overall Classification Performance Assessment

Table 8 represents the overall classification performance assessment for the used models. The decision tree model was successfully trained and evaluated on the validation set, achieving an accuracy of approximately 95.43%. The logistic regression model was successfully trained and evaluated on the validation set, achieving an accuracy of approximately 95.42%. Also, the K-nearest neighbors (KNN) model was successfully trained and evaluated on the validation set, achieving an accuracy of approximately 94.74%. Finally, the naive Bayes model was successfully trained and evaluated on the validation set, achieving an accuracy of approximately 95.30%. With the performance metrics, the results can be summarized into an overall table.

4.3. Decision Tree Mortality Classification

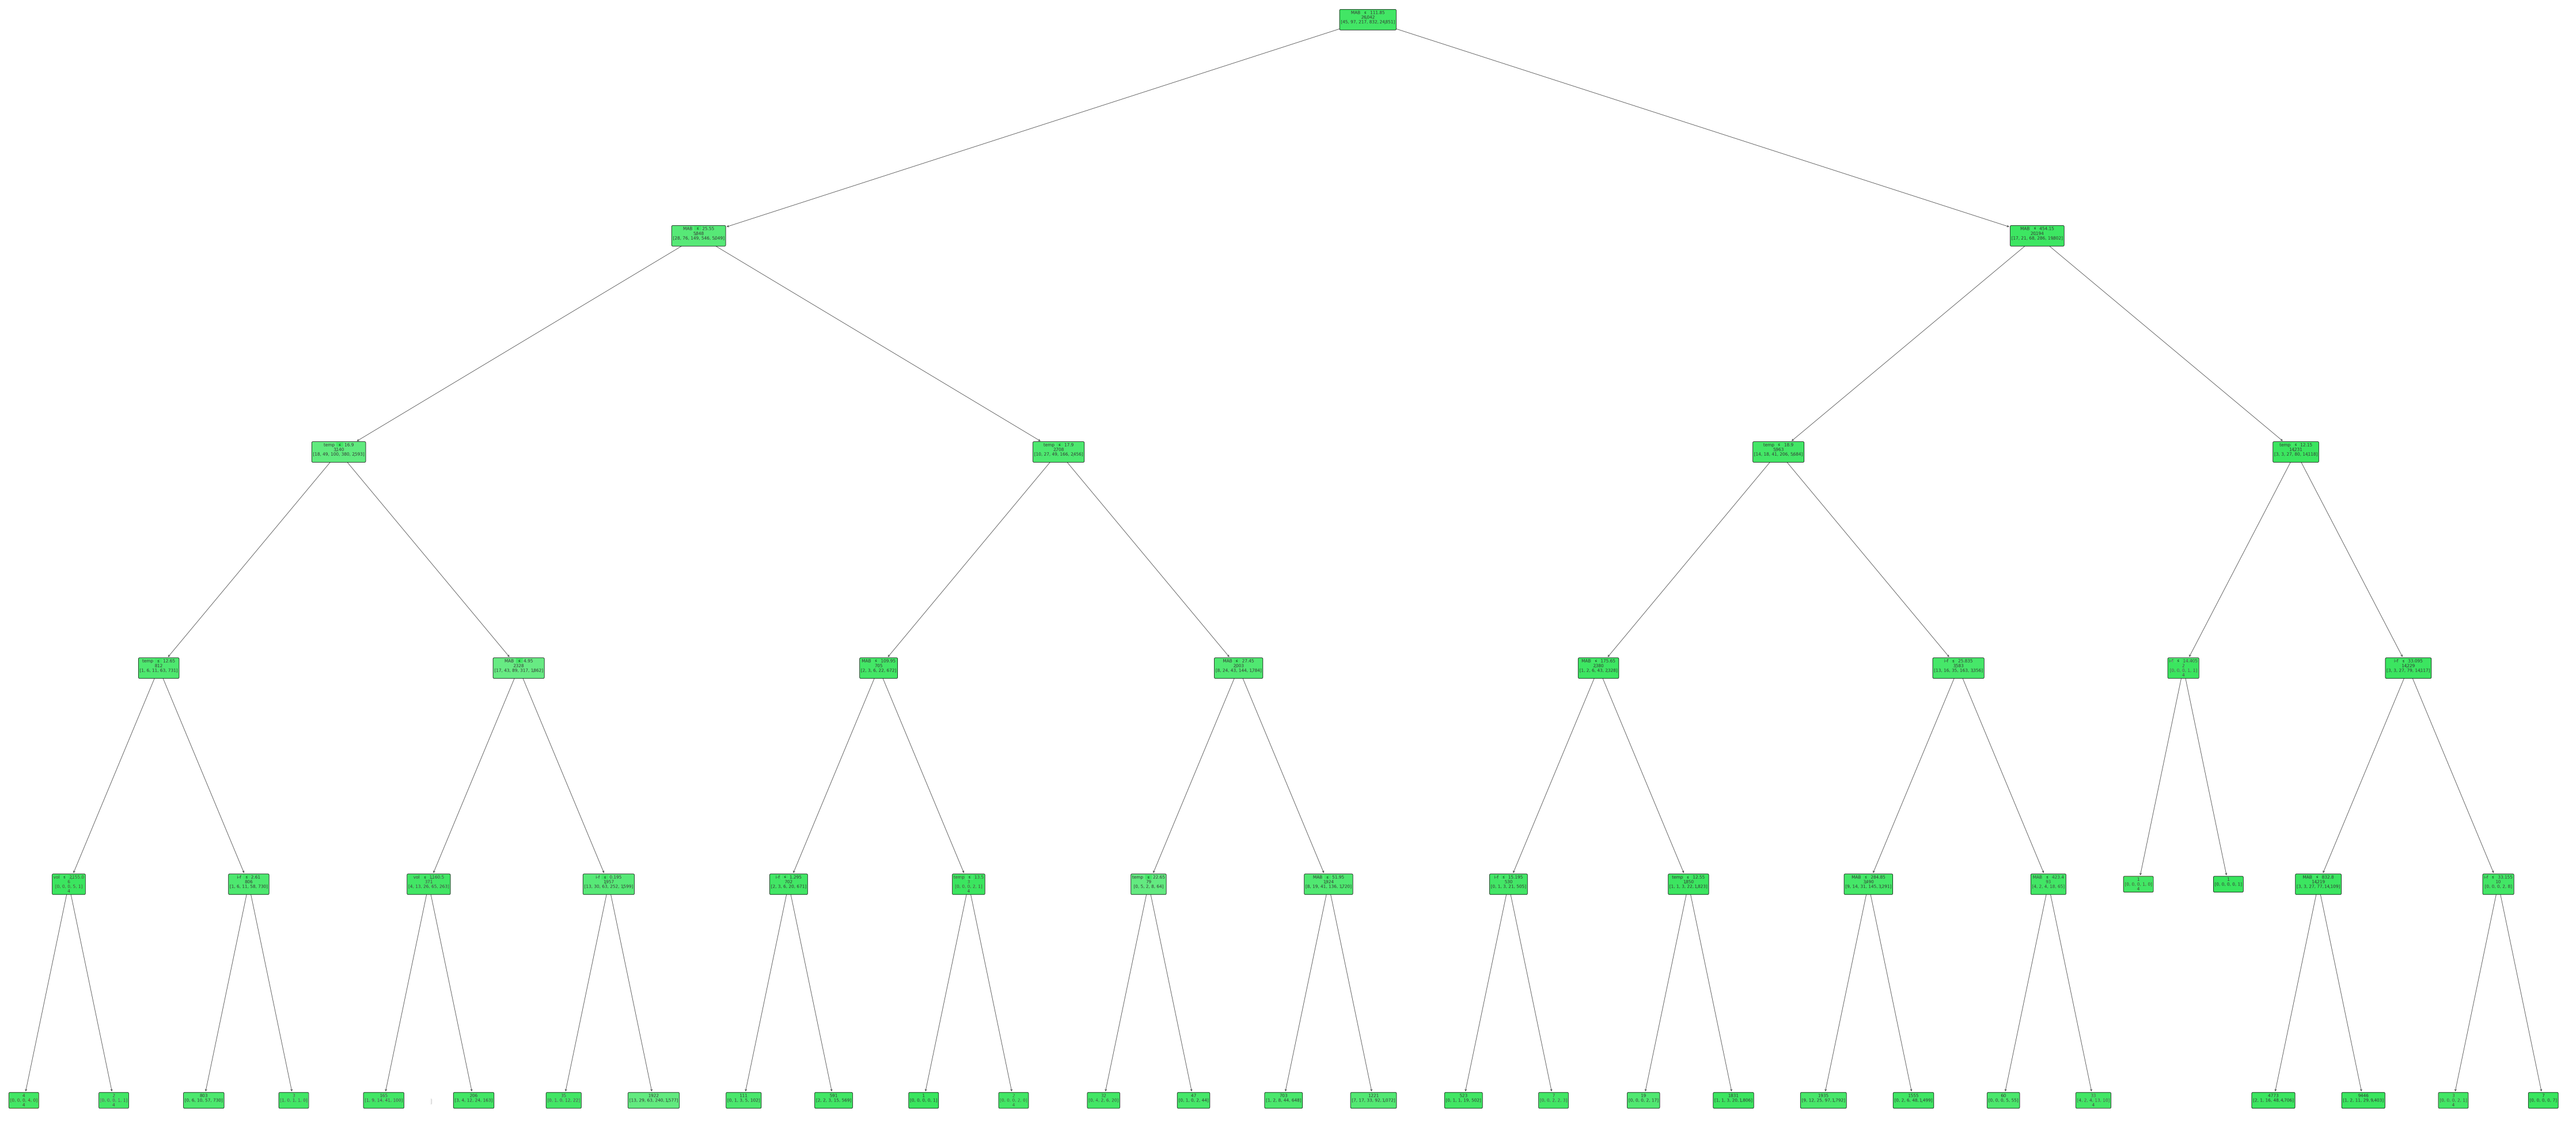
Figure 2 indicates the initial non-pruned decision tree visualization for fish mortality prediction. Focusing on the DT graph and its implications for classifying outcomes based on various variables, it is imperative to prune the decision tree using pruning techniques in order to avoid overfitting occurring. The bigger the decision tree becomes, the bigger the noise that is generated among the nodes, and the overfitting increases as well. High values of overfitting result in a lower classification accuracy for the classification process. A low classification accuracy leads to insufficient classification (Figure 2) [28,29].
Figure 3 indicates the final pruned decision tree visualization for fish mortality prediction. The entire process also covers the training process of the DT classifier, including the preprocessing steps, pruning, and model evaluation using a 10-fold cross-validation. In DTs, each subsequent split aims to increase the homogeneity of the node with respect to the target variable, which, in this context, is likely related to the classes of fish mortality. The Gini impurity is a metric that quantifies the purity of a node, with a lower value indicating a higher purity. The “value” arrays give insight into the composition of the classes at each node, showing how many samples fall into each class. The class with the majority within each “value” array dictates the predicted class for that node or the further splitting rule if the node is not a terminal leaf node (Figure 3) [28,29].
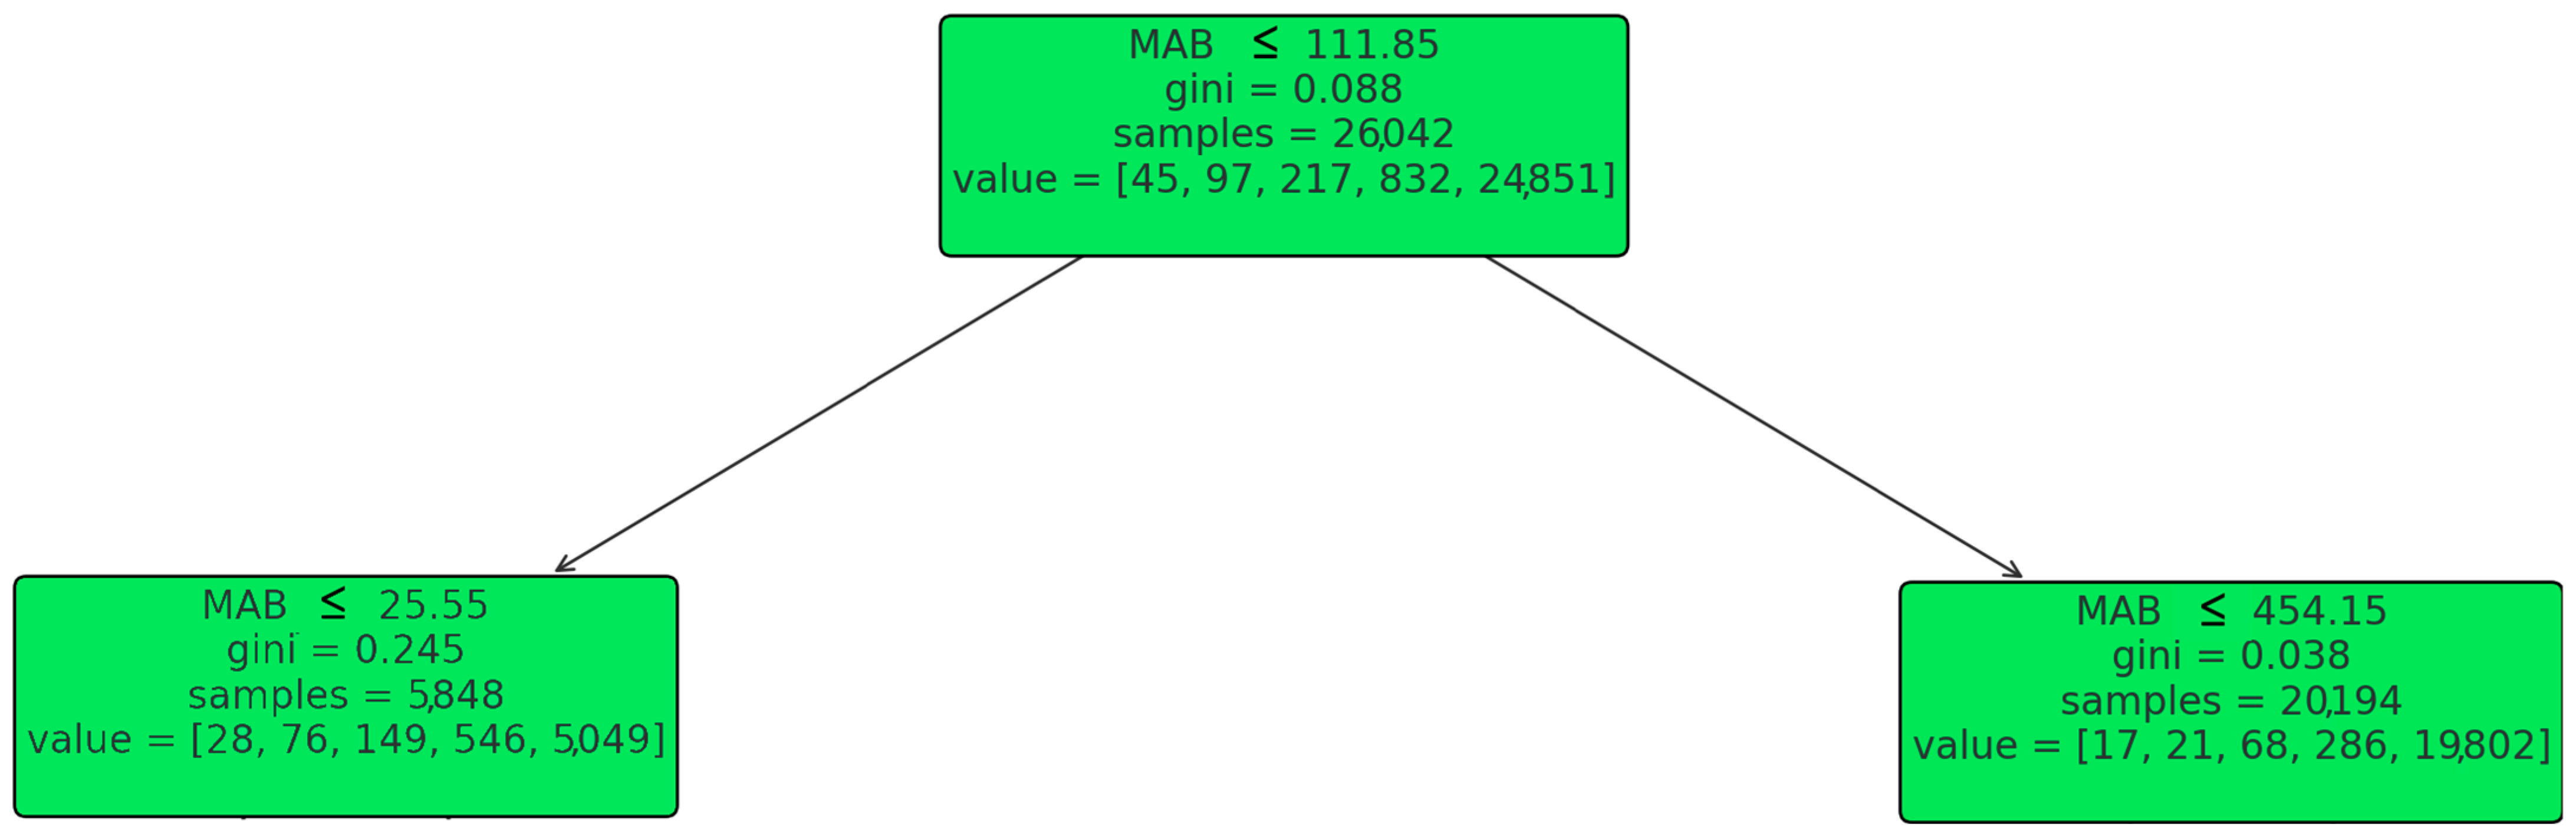
Figure 4 represents the root node of the decision tree while splitting, based on the feature “MAB” at a threshold of 111.85. The Gini impurity at this node is 0.088, suggesting a reasonable level of purity among the samples with respect to the target variable. The node is responsible for a significant number of samples, specifically 26,042, and these samples are distributed across various classes as indicated by the “value” array [45, 97, 217, 832, 24,851]. This distribution suggests that the majority of the samples at this node fall into the last class represented in the “value” array. From this root node, the decision tree further branches into two child nodes: The left child node is the result of the condition MAB ≤ 111.85. At this node, the Gini impurity is slightly higher than the root node, which is 0.245, indicating that the samples are less pure with respect to the target variable compared to the root node. The samples are divided among the classes as [28, 76, 149, 546, 5049]. This node will further branch out based on additional conditions. The right child node follows from the condition MAB > 111.85 and splits again at MAB ≤ 454.15. This node has a very low Gini impurity of 0.038, suggesting that the samples at this node are quite homogeneous. There are 20,194 samples at this node, distributed as [17, 21, 68, 286, 19,802] across the classes. The predominance of samples in the last class indicates a strong majority class presence at this node (Figure 4).
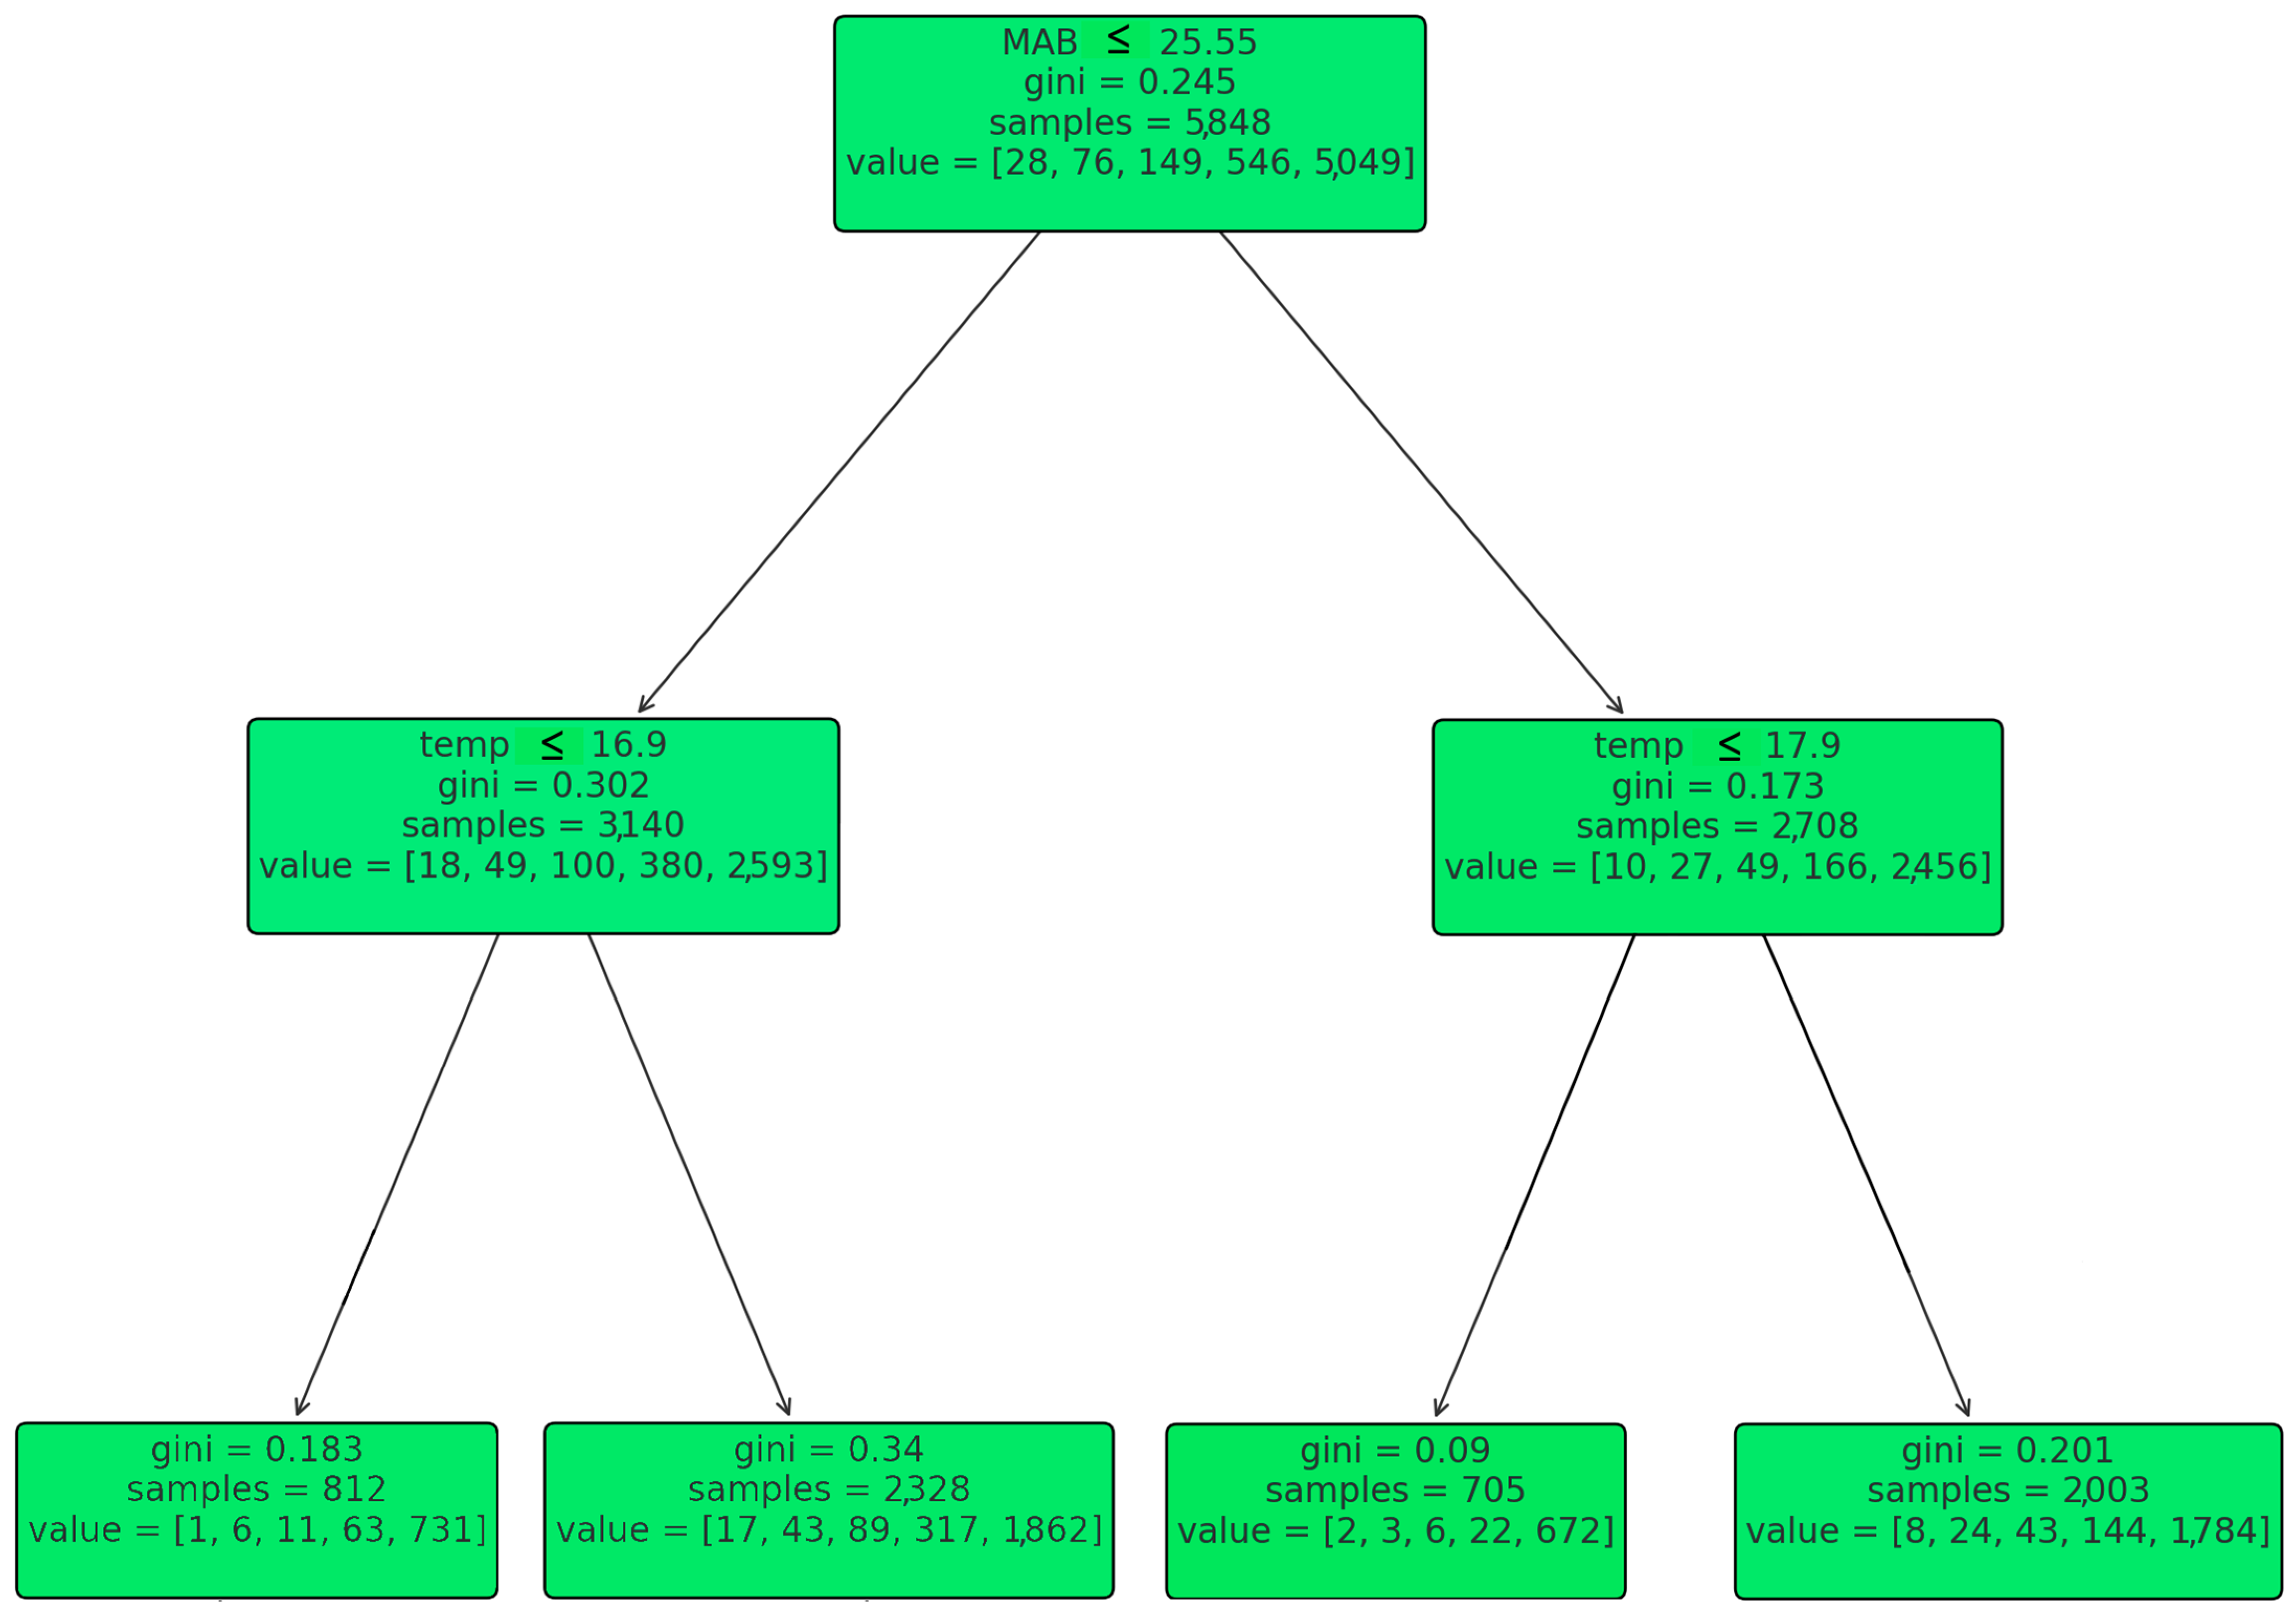
Figure 5 represents the root node while splitting on the feature “MAB”, with a threshold of 25.55. This indicates that the first decision in the tree to separate the data involves checking if the “MAB” value is less than or equal to 25.55. The Gini impurity for this node is 0.245, and it contains samples that fall into various classes, as indicated by the “value” array. The left child node of the root is further split based on the feature “Temp”, with a threshold of 16.9. The Gini impurity of this node is 0.302, and it also contains a mix of classes. The right child node of the root also splits based on the “Temp”, but with a threshold of 17.9. Its Gini impurity is 0.173. Each of the nodes following the “Temp” splits further into more nodes, which are not fully visible in the provided snippet. These subsequent nodes will have additional thresholds and possibly other features that they split on, further segmenting the data into the most homogeneous groups possible with respect to the target variable (likely the classes of fish mortality). Each of these rules would further branch out based on additional conditions until a final leaf node is reached, which would provide the predicted class. The predicted class at each leaf node would typically be the class that has the majority within that node, indicated by the ‘value’ array. The ‘value’ array, such as [18, 49, 100, 380, 2593], represents the distribution of samples across different classes at that node. The Gini impurity is a measure of the node’s purity; a smaller Gini index indicates a greater purity (Figure 5).
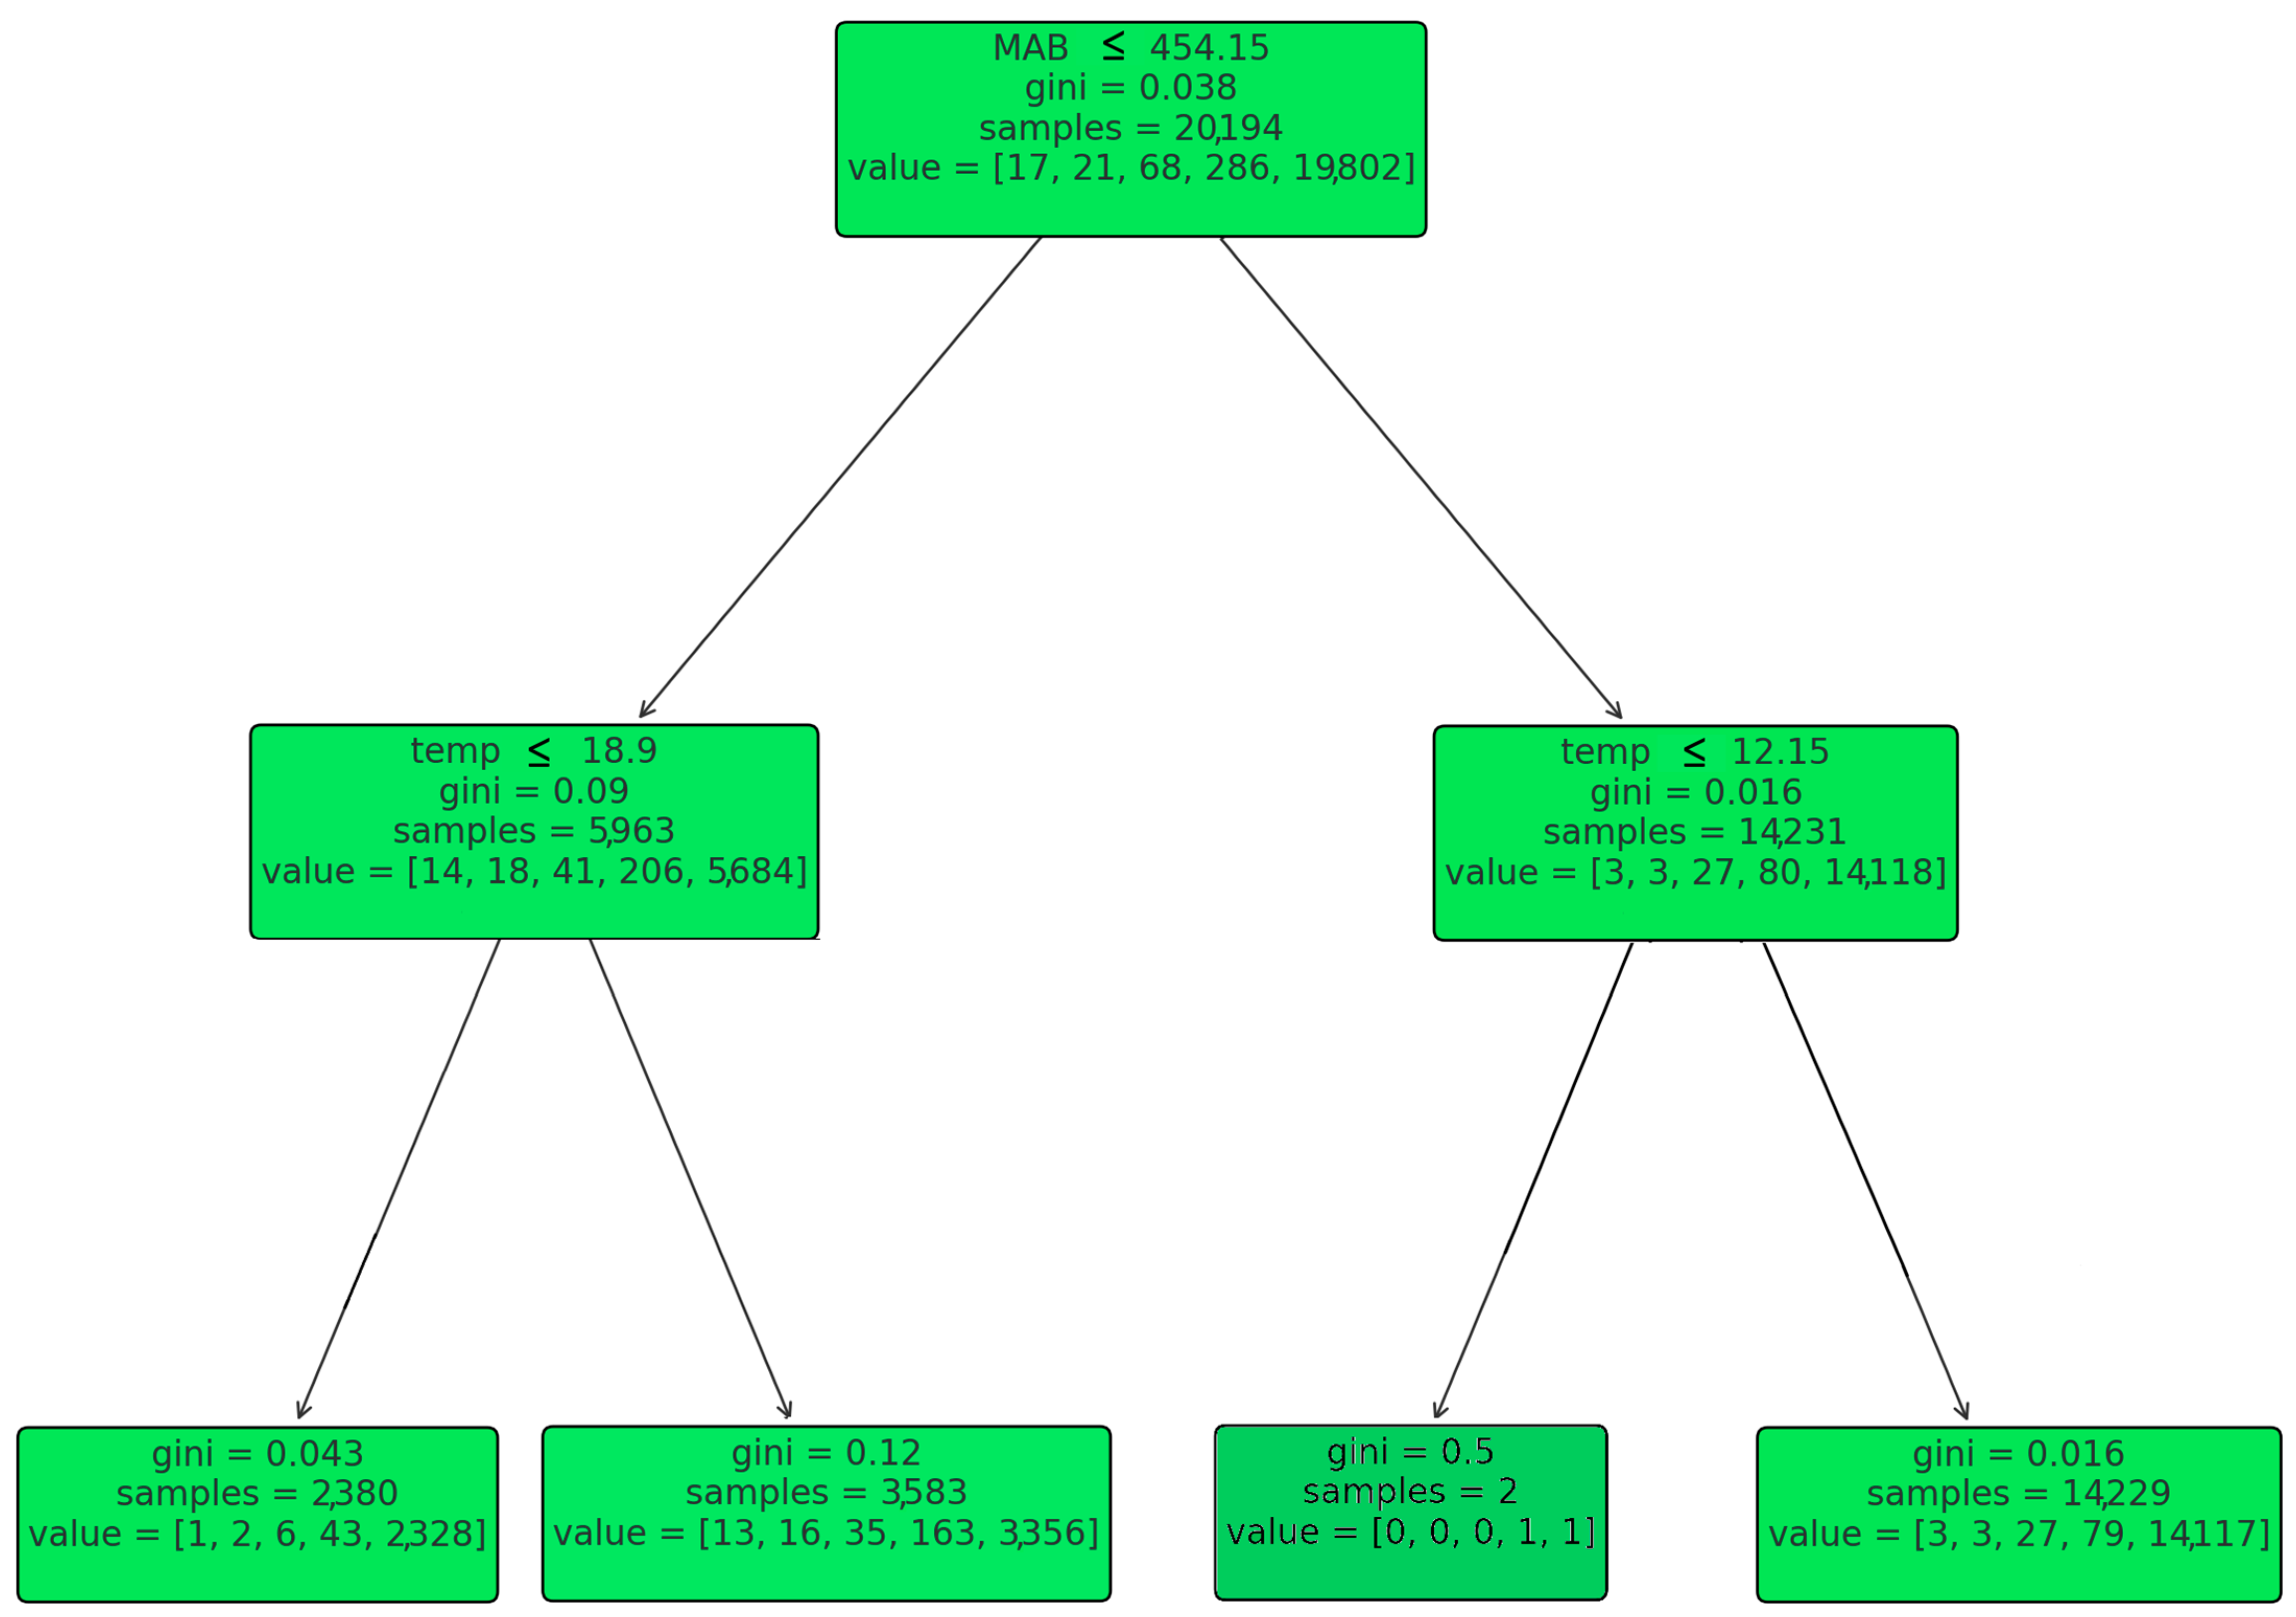
Figure 6 represents the root node while splitting the decision tree’s right child node based on the feature “MAB” at a threshold of 454.15. The Gini impurity at this node is remarkably low, at 0.038, indicating that the samples are quite pure with respect to the target variable, and there is a strong majority class present. There are 20,194 samples at this node, which are distributed across various classes as indicated by the “value” array [17, 21, 68, 286, 19,802]. From this node, the decision tree branches into two paths: On the left, if “Temp” is less than or equal to 18.9, the Gini impurity increases slightly to 0.09, and the number of samples at this node is 5963. The samples are distributed as [14, 18, 41, 206, 5684] across the classes. This path indicates that temperature plays a significant role in classifying samples when “MAB” is less than or equal to 454.15. On the right, if “Temp” is greater than 18.9 and less than or equal to 12.15, the Gini impurity is very low at 0.016, with 14,231 samples. The “value” array is [3, 3, 27, 80, 14,118], suggesting a strong class presence. This suggests that lower temperatures are associated with a particular class when the “MAB” is greater than 454.15 (Figure 6).
Focusing on the DT structure and its implications for classifying outcomes based on various variables, the authors discuss specific thresholds for features like “MAB”, “Temp”, “Vol”, and “i–f”, detailing how these thresholds lead to different branches and classifications. The entire process also covers the training process of the DT classifier, including preprocessing steps, pruning, and model evaluations using a 10-fold cross-validation (Figure 2, Figure 3, Figure 4, Figure 5 and Figure 6). Derived from the illustrated DT structure, when the “MAB” is less than or equal to 111.85, it results in diverse branches, predominantly leading to classes 3 and 4. Conversely, when the “MAB” exceeds 111.85, most outcomes are categorized as class 4, occasionally extending to class 3. The “Temp” emerges as a pivotal factor, introducing various thresholds such as 16.90, 12.65, 17.90, and 18.90, contributing to distinct branches and classifications. For example, when the “MAB” is less than 25.55 and the “Temp” is less than 16.90, additional temperature limits further categorize the results into classes number 3 and 4. The “Vol” thresholds, including 2155.00 and 1160.50, are featured in the tree representation, helping with the result classification when paired with the variables “MAB” and “Temp”. The “i–f” within the cage also shapes the results, with thresholds of 2.61, 0.20, and 1.29. In collaboration with the variables “MAB” and “Temp,” the “i–f” factor serves to more accurately categorize examples into unique classes (Figure 2, Figure 3, Figure 4, Figure 5 and Figure 6) [29,30].
The DT classifier underwent training on a preprocessed dataset, involving different phases including excluding missing values and the discretization of “Deaths” variable values into five equal-width bins. To prevent overfitting, the model underwent pruning using a maximum depth value for a decision tree representation of 5, and its performance was evaluated through 10-fold cross-validation.
The results indicate a robust accuracy through a series of training, validation, and testing sets, achieving classification accuracies of 95.47% for the training set, 95.43% for the validation set, and 96.26% for the testing set. The visualization of the pruned DT offers insights into the model’s decision-making process for classifying data based on the provided features (Figure 2, Figure 3, Figure 4, Figure 5 and Figure 6) (Table 9) [28,29,30,31].

5. Discussion

The model’s notable accuracy and ability to generalize signifies its potential for effectively predicting the discretized “Deaths” values according to the selected dataset attributes. To classify instances of fish mortality, advanced data mining classifiers (DTs) were employed to determine the best performing predictive method [32].
These models managed to produce commendable accuracy rates, underscoring their efficacy in predicting fish mortality values. The success of these models highlights the initiative of data-driven approaches in cage aquaculture management [33].
A thorough analysis of feature importance was conducted to uncover factors influencing fish mortality, facilitating the deployment of strategic conservation and management practices, and offering valuable forecasts to stakeholders aiming to mitigate fish mortality through data processing [34].
The research findings bear significant implications for sustainable management endeavors, empowering stakeholders to proactively act against the factors that affect fish mortality. The data insights were derived from the current research, contributing to an expanded range of disciplines aimed at safeguarding fish stocks and promoting sustainable cage aquaculture [35,36].
The study underscores the importance of proactive measures and the continuous monitoring in cage aquaculture to maintain caged fish stocks. Adhering to best practices and implementing ongoing observation processes allow for sustainable cage aquaculture operations. Furthermore, the current research encompasses the global sustainability goals by eliminating farmed fish production losses caused by climate change. Regarding farmed fish mortality, for sustainable best practices, the project follows the global policy for responsible fish consumption and production [37,38].

5.1. Research Contribution

The current research proposes a pioneering data-driven strategy, leveraging advanced data mining classifiers and incorporating DT classifiers to forecast and classify examples of caged fish mortality. The project, embedded within the overarching initiative “Improving Competitiveness of the Greek Fish Farming through Development of Intelligent Systems for Disease Diagnosis & Treatment”, addresses the significance of mortality rate escalation in caged fish populations. The focus expands to unsustainable fish farming paradigms and environmental factors which impact this issue [37].
The key contribution lies in the development and evaluation of predictive models showcasing highly accurate results. By employing efficient data mining classifiers for numeric data, the research identifies DTs as one of the most suitable methods for predicting fish mortality. The robustness of the model pinpoints the efficacy of data-driven practices in cage aquaculture management [37].
Furthermore, the incorporation of a comprehensive dataset from diverse aquaculture sources, encompassing factors like the geographical locations, husbandry methods, and key parameters including the weather conditions and water quality, adds significant depth to the research. The dataset forms the basis for a thorough analysis, including a feature importance assessment and the prediction of factors which influence fish mortality [38].
The outcomes of this research contribute significantly to sustainable management efforts. The deployment of focused conservation and operational strategies, informed by the feature importance analysis, offers valuable insights for stakeholders. The proactive measures advocated in the strategies aim to mitigate fish mortality and enhance the protection of farmed fish stocks [38].

5.2. Practical Applications

The authors have expanded the discussion to provide insights into how their research can be applied in the field of aquaculture. Specifically, they have outlined potential implementation strategies, including the integration of decision tree classifiers into existing aquaculture management systems. By leveraging the predictive capabilities of these classifiers, aquaculture stakeholders can make informed decisions regarding disease management, stock optimization, and environmental monitoring. Furthermore, the research has addressed the challenges associated with implementation, such as data integration and stakeholder engagement, and highlighted opportunities for scaling the solution across different aquaculture settings. Overall, these practical applications underscore the relevance and potential impact of their research in improving the sustainability and competitiveness of fish farming practices.

5.3. Limitations

It is imperative to explicitly discuss the limitations of the study to provide a comprehensive understanding of its scope and potential constraints. While the research demonstrates a robustness in its methodology and predictive modeling approach, several limitations warrant acknowledgment. Firstly, despite the thorough analysis conducted, limitations related to data quality issues may exist. The dataset’s completeness, accuracy, and representativeness could influence the reliability and generalizability of the findings. Additionally, while the research methodology is well structured, sample size limitations may constrain the extent to which conclusions can be drawn. The size and diversity of the dataset, although comprehensive, may not fully capture the complexity of aquaculture systems, potentially limiting the study’s applicability to diverse contexts. Moreover, biases in the data collection process, such as selection bias or measurement bias, could introduce distortions in the analysis and interpretation of results. Acknowledging these limitations is crucial for contextualizing the study’s findings and informing future research endeavors aimed at addressing these constraints for more robust and reliable outcomes.

5.4. Future Work

The current research provides a foundation for predictive modeling in fish mortality using data mining classifiers, particularly DTs. Future work should consider several avenues for further exploration and enhancement, including the exploration of other advanced machine learning techniques to gain a more comprehensive understanding of patterns within fish mortality data.
In terms of data acquisition and data management, real-time monitoring and dynamic updates can enable the model to adapt to changing conditions and identify emerging threats promptly, contributing to a more proactive management system.
While maintaining the focus on data mining classifiers in the current study, the authors have outlined potential avenues for further investigation, including expanding the application of their methodology to different aquaculture environments and species. By conducting comparative analyses with other machine learning techniques and decision tree algorithms, future research could provide a more comprehensive understanding of predictive modeling in marine aquaculture management. Additionally, we have considered the integration of decision tree classifiers with other data analysis techniques to enhance the predictive accuracy and address the emerging challenges in aquaculture.
Regarding the various factors, collecting more data to include genetic factors and environmental variables would contribute to a more nuanced understanding of mortality predictors and aid in the development of personalized conservation strategies. Also, validating the predictive models across diverse aquaculture settings will enhance the generalizability and applicability in varying environmental conditions. Including a multispecies analysis will tailor predictive models to specific species for more accurate and targeted management strategies. Addressing these future directions will contribute to the ongoing evolution of data-driven approaches in cage aquaculture management, ensuring their adaptability, effectiveness, and contribution to the broader goals of sustainable aquaculture and responsible resource management.
Enhancing the interpretability and transparency of the decision-making procedure will gain stakeholders’ trust. The collaboration with industry stakeholders, including fish farmers, environmental agencies, and policymakers, is necessary to gather practical insights and enhance the relevance of developed models.
These future research directions aim to advance the understanding of AI’s role in marine aquaculture management and contribute to the development of innovative and effective solutions for sustainable aquaculture practices. Moreover, there are areas of opportunity for optimizing the long-term impacts of implemented strategies and policies on fish mortality rates, providing insights into the sustainability of aquaculture policies.

6. Conclusions

The research proposes a data-oriented strategy deploying classification methods to forecast and categorize caged fish mortality examples, indicating the increasing rates attributed to unsustainable fish farming and environmental factors. The current research aims to support Greek fish farming competitiveness by developing an intelligent system that will eventually allow for fish diseases diagnosis, emphasizing medication and dosage issues. The project utilizes a comprehensive dataset, enabling predictive modeling with state-of-the-art data mining classifiers, particularly DTs, ensuring high precision and recall rates. The feature importance analysis offers insights for developing targeted conservation strategies.
The DT classifier, trained on extensive datasets from the Ionian Sea, showcases a robust predictive performance in fish mortality instances. The correlation findings highlight factors influencing mortality, such as the median atomic weight, the volume of the cell, the concentration of fish, and the water temperature. The DT structure provides thresholds for feature variables, contributing to the classification of outcomes. Pruning, model evaluation using the 10-fold cross-validation, and high accuracies (95.47%, 95.43%, 96.26%) underscore the model’s reliability. The discussion emphasizes the model’s effectiveness, the data-driven approaches in cage aquaculture management, and implications for sustainable practices.
The conclusions also consider the future directions and global seafood demand, emphasizing the research’s importance in addressing complex challenges in cage aquaculture. The project’s promising direction for improving fish farming practices, coupled with the necessity for endless research and collaboration to meet global seafood demands sustainably, is highlighted. The study provides valuable new knowledge for establishing the development of innovative actions and evidence-oriented practices to optimize the resilience and sustainability of the aquaculture industry.
This research pinpoints the keystone role of data-oriented approaches and methods in predicting caged fish mortality rates. By designing, training, and applying advanced data mining classifiers, this research not only demonstrates the potential effectiveness of such models but also sets a milestone for future efforts in the field. The findings manage to explain the broader goal of sustainable cage aquaculture management, providing a beacon for efforts to meet the growing global demand for seafood without compromising sustainability.

Author Contributions

Conceptualization, D.C.G.; methodology, D.C.G.; software, D.C.G. and M.C.G.; validation, D.C.G. and M.C.G.; formal analysis, D.C.G. and M.C.G.; investigation, D.C.G. and M.C.G.; resources, J.A.T.; data curation, D.C.G. and M.C.G.; visualization, D.C.G. and M.C.G.; writing—original draft, D.C.G.; writing—review and editing, D.C.G., M.C.G. and J.A.T.; supervision, D.C.G.; project administration, J.A.T.; funding acquisition, J.A.T. All authors have read and agreed to the published version of the manuscript.

Funding

This research was funded by the OPERATIONAL PROGRAM FOR FISHERIES and MARITIME 2014–2020, grant number (MIS) 5067321.

Institutional Review Board Statement

Not applicable.

Informed Consent Statement

Not applicable.

Data Availability Statement

The data presented in this study are available on request from the corresponding author. The data are not publicly available due to copy right restrictions from the private company that owns it.

Acknowledgments

This work is supported by the action “Improving Competitiveness of the Greek Fish Farming through Development of Intelligent Systems for Disease Diagnosis & Treatment Proposal and Relevant Risk Management Supporting Actions”.

Conflicts of Interest

Author Marios C. Gkikas is the founder and owner of the company OWEB Digital Experience. The remaining authors declare that the research was conducted in the absence of any commercial or financial relationships that could be construed as a potential conflict of interest.

Abbreviations

The following abbreviations are used in this manuscript:
AIartificial intelligence
AIoTartificial intelligence Internet of Things
Deathsnumber of fish deaths
DTsdecision trees
i–fconcentration of fish inside the cell
MABmedian atomic weight
Tempwater temperature
Volvolume of the cell occupying the fish

References

  1. FAO. Available online: https://www.fao.org/3/ca9229en/ca9229en.pdf (accessed on 12 November 2023).
  2. Pauly, D.; Christensen, V.; Guénette, S.; Pitcher, T.J.; Sumaila, U.R.; Walters, C.J.; Watson, R.; Zeller, D. Towards sustainability in world fisheries. Nature 2002, 418, 689–695. [Google Scholar] [CrossRef] [PubMed]
  3. Cheung, W.W.L.; Lam, V.W.Y.; Sarmiento, J.L.; Kearney, K.; Watson, R.; Pauly, D. Projecting global marine biodiversity impacts under climate change scenarios. Fish Fish. 2009, 10, 235–251. [Google Scholar] [CrossRef]
  4. Naylor, R.; Goldburg, R.; Primavera, J.; Kautsky, N.; Beveridge, M.C.M.; Clay, J.; Folke, C.; Lubchenco, J.; Mooney, H.; Troell, M. Effect of aquaculture on world fish supplies. Nature 2000, 405, 1017–1024. [Google Scholar] [CrossRef] [PubMed]
  5. Stentiford, G.D.; Neil, D.M.; Peeler, E.J.; Shields, J.D.; Small, H.J.; Flegel, T.W.; Vlak, J.M.; Jones, B.; Morado, F.; Moss, S.; et al. Disease will limit future food supply from the global crustacean fishery and aquaculture sectors. J. Invertebr. Pathol. 2012, 110, 141–157. [Google Scholar] [CrossRef] [PubMed]
  6. Klinge, D.; Naylor, R. Searching for solutions in aquaculture: Charting a sustainable course. Annu. Rev. Environ. Resour. 2012, 37, 247–276. [Google Scholar] [CrossRef]
  7. FishAI. Available online: https://www.fishai.upatras.gr (accessed on 22 November 2023).
  8. Ubina, N.A.; Lan, H.-Y.; Cheng, S.-Y.; Chang, C.-C.; Lin, S.-S.; Zhang, K.-X.; Lu, H.-Y.; Cheng, C.-Y.; Hsieh, Y.-Z. Digital twin-based intelligent fish farming with Artificial Intelligence Internet of Things (AIoT). Smart Agric. Technol. 2023, 5, 100285. [Google Scholar] [CrossRef]
  9. Silva, L.C.B.d.; Lopes, B.D.M.; Blanquet, I.M.; Marques, C.A.F. Gaussian distribution model for detecting dangerous operating conditions in industrial fish farming. Appl. Sci. 2021, 11, 5875. [Google Scholar] [CrossRef]
  10. Nahar, J.; Sharma, N.A.; Kumar, K.; Prasad, A.; Kumar, A. Fishermen’s expert views on the causes of fish poisoning in fiji: An investigation through data mining technique. In Proceedings of the 2017 4th Asia-Pacific World Congress on Computer Science and Engineering (APWC on CSE), Nadi, Fiji, 10–12 December 2017; pp. 99–105. [Google Scholar]
  11. Bruna, D.M.L.; Silva, L.C.B.; Blanquet, I.M.; Georgieva, P.; Marques, C.A.F. Prediction of fish mortality based on a probabilistic anomaly detection approach for recirculating aquaculture system facilities. Rev. Sci. Instrum. 2021, 92, 025119. [Google Scholar] [CrossRef]
  12. Probst, W.N. How emerging data technologies can increase trust and transparency in fisheries. ICES J. Mar. Sci. 2020, 77, 1286–1294. [Google Scholar] [CrossRef]
  13. Bostock, J.; McAndrew, B.; Richards, R.; Jauncey, K.; Telfer, T.; Lorenzen, K.; Little, D.; Ross, L.; Handisyde, N.; Gatward, I.; et al. Aquaculture: Global status and trends. Philos. Trans. R. Soc. B 2010, 365, 2897–2912. [Google Scholar] [CrossRef] [PubMed]
  14. Tacon, A.G.J.; Metian, M. Global overview on the use of fish meal and fish oil in industrially compounded aquafeeds: Trends and future prospects. Aquaculture 2008, 285, 146–158. [Google Scholar] [CrossRef]
  15. Boyd, C.E.; Tucker, C.S. Pond Aquaculture Water Quality Management; Springer: New York, NY, USA, 1998. [Google Scholar] [CrossRef]
  16. Matplotlib. A Plotting Library for Python and Its Numerical Mathematics Extension, NumPy. It Provides an Object-Oriented API for Embedding Plots into Applications. 2023. Available online: https://matplotlib.org/stable/users/index.html (accessed on 25 December 2023).
  17. NumPy. A Library for the Python Programming Language, Adding Support for Large, Multi-Dimensional Arrays and Matrices, along with Mathematical Functions to Operate on These Arrays. 2023. Available online: https://numpy.org/doc/stable/ (accessed on 25 November 2023).
  18. Pandas. A Powerful and Flexible Open-Source Data Analysis and Manipulation Library for Python. It Was Used to Read, Clean, and Manipulate the Data. 2023. Available online: https://pandas.pydata.org/docs/ (accessed on 25 November 2023).
  19. Scikit-Learn. A Machine Learning Library in Python, Built on NumPy, SciPy, and Matplotlib. It Was Used for Linear Regression and Correlation Analysis. 2023. Available online: https://scikit-learn.org/stable/index.html (accessed on 25 November 2023).
  20. Seaborn. A Data Visualization Library Based on Matplotlib, Providing a Higher-Level Interface for Drawing Attractive and Informative Statistical Graphics. 2023. Available online: https://seaborn.pydata.org/ (accessed on 25 December 2023).
  21. Mitchell, T.M. Machine Learning; McGraw-Hill: New York, NY, USA, 1997. [Google Scholar]
  22. Dumitrescu, E.; Hué, S.; Hurlin, C.; Tokpavi, S. Machine Learning for Credit Scoring: Improving Logistic Regression with Non-Linear Decision-Tree Effects. Eur. J. Oper. Res. 2022, 297, 1178–1192. [Google Scholar] [CrossRef]
  23. Wang, L.-M.; Li, X.-L.; Cao, C.-H.; Yuan, S.-M. Combining Decision Tree and Naive Bayes for Classification. Knowl.-Based Syst. 2006, 19, 511–515. [Google Scholar] [CrossRef]
  24. Yadav, K.; Thareja, R. Comparing the Performance of Naive Bayes and Decision Tree Classification Using R. Int. J. Intell. Syst. Appl. 2019, 11, 11–19. [Google Scholar] [CrossRef]
  25. Rahmadani, S.; Dongoran, A.; Zarlis, M.; Zakarias. Comparison of Naive Bayes and Decision Tree on Feature Selection Using Genetic Algorithm for Classification Problem. J. Phys. Conf. Ser. 2018, 978, 012087. [Google Scholar] [CrossRef]
  26. Karim, M.; Rahman, R.M. Decision Tree and Naïve Bayes Algorithm for Classification and Generation of Actionable Knowledge for Direct Marketing. J. Softw. Eng. Appl. 2013, 6, 196–206. [Google Scholar] [CrossRef]
  27. Kohavi, R. A Study of Cross-Validation and Bootstrap for Accuracy Estimation and Model Selection. In Proceedings of the 14th International Joint Conference on Artificial Intelligence, Montréal, QC, Canada, 20–25 August 1995; Volume 2, pp. 1137–1143. [Google Scholar]
  28. Guyon, I.; Elisseeff, A. An Introduction to Variable and Feature Selection. J. Mach. Learn. Res. 2003, 3, 1157–1182. [Google Scholar]
  29. Quinlan, J.R. Induction of Decision Trees. Mach. Learn. 1986, 1, 81–106. [Google Scholar] [CrossRef]
  30. Russel, S.; Norvig, P. Artificial Intelligence: A Modern Approach, 3rd ed.; Prentice Hall: Hoboken, NJ, USA, 2003. [Google Scholar]
  31. Witten, I.; Frank, E.; Hall, M. Data Mining; Morgan Kaufmann Publishers: Burlington, MA, USA, 2011. [Google Scholar]
  32. Hastie, T.; Tibshirani, R.; Friedman, J. The Elements of Statistical Learning; Springer: Berlin/Heidelberg, Germany, 2009. [Google Scholar]
  33. Powers, D.M.W. Evaluation: From Precision, Recall and F-Measure to ROC, Informedness, Markedness and Correlation. J. Mach. Learn. Technol. 2011, 2, 37–63. [Google Scholar]
  34. Garcia, S.M.; Rice, J.; Charles, A. Governance of Marine Fisheries and Biodiversity Conservation. In Governance of Marine Fisheries and Biodiversity Conservation; Garcia, S.M., Rice, J., Charles, A., Eds.; Wiley: Hoboken, NJ, USA, 2014. [Google Scholar] [CrossRef]
  35. FAO. Contributing to Food Security and Nutrition for All. The State of World Fisheries and Aquaculture. 2016. Available online: https://www.fao.org/3/i5555e/i5555e.pdf (accessed on 12 December 2023).
  36. Worm, B.; Hilborn, R.; Baum, J.K.; Branch, T.A.; Collie, J.S.; Costello, C.; Fogarty, M.J.; Fulton, E.A.; Hutchings, J.A.; Jennings, S.; et al. Rebuilding Global Fisheries. Science 2009, 325, 578–585. [Google Scholar] [CrossRef] [PubMed]
  37. United Nations. The Sustainable Development Goals (SDGs) and Disability. 2015. Available online: https://social.desa.un.org/issues/disability/news/the-sustainable-development-goals-sdgs-and-disability (accessed on 25 November 2023).
  38. IPCC. Global Warming of 1.5 °C; Intergovernmental Panel on Climate Change: Geneva, Switzerland, 2018. [Google Scholar]
Figure 1. Correlations between the “Deaths” and other factors. Fish mortality is not represented.
Applsci 14 02129 g001
Figure 2. Initial non-pruned decision tree representation for fish mortality prediction.
Applsci 14 02129 g002
Figure 3. Entire pruned decision tree representation for fish mortality prediction.
Applsci 14 02129 g003
Figure 4. Decision tree representation for “Deaths” prediction (upper nodes).
Applsci 14 02129 g004
Figure 5. Decision tree representation for “Deaths” prediction (left nodes).
Applsci 14 02129 g005
Figure 6. Decision tree representation for “Deaths” prediction (right nodes).
Applsci 14 02129 g006
Table 1. Research objectives.
No.Research Objectives (ROs)
1.Evaluate the effectiveness of decision tree classifiers in predicting fish mortality;
2.Analyze the impacts of environmental factors on fish mortality rates in Greek aquaculture;
3.Research how the current fish farming practices contribute to fish mortality;
4.Aim to create the foundations of a robust system that not only diagnoses and categorizes fish diseases but is also able to suggest effective treatment strategies.
Table 2. Descriptive statistics.
VariableCountMeanStd DevMin25th PctlMedian75th PctlMax
MAB37,203702.39623.452.20142.50531.801202.752628.90
Deaths37,203−44.3483.75−995.00−45.00−17.00−6.00−1.00
Temp37,20320.294.0512.0016.3020.8023.8027.30
Vol37,2032503.33946.23640.001271.003260.003260.003260.00
i–f37,2039.956.150.015.2210.1713.9541.25
Table 3. Fish mortality statistic values.
FeaturesValue
Count37,203
Mean−44.34
Standard deviation83.75
Minimum−995.00
Maximum−1.00
Missing valuesNon-missing values
Table 4. Binned fish mortality classes.
FeaturesValue
Unique bins/classes5
Most frequent bin−199.8–1.0 (35,536 occurrences)
Table 5. Equal width binning strategy for the “Deaths” variable.
Class NoRangeInstances
1 From −995 to −79674
2 From −796 to −597139
3 Form −597 to −398301
4 From −398 to −1991153
5 From −199 to −1.035,536
Table 6. Shapiro–Wilk test.
VariableStatisticp-Value
MAB0.90020.0000
Deaths0.49990.0000
Temp0.9412~0
Vol0.70780.0000
i–f0.9688~0
Table 7. Spearman’s rank correlation coefficients.
VariableCorrelation CoefficientSig. (2-Tailed)N
MAB0.4439~037,203
Temp0.1100~037,203
Vol0.3099~037,203
i–f0.2616~037,203
Table 8. Decision Tree accuracies.
ModelValue
Decision trees 95.43%
Logistic regression95.42%
K-nearest neighbors (KNN)94.74%
Naive Bayes95.30%
Table 9. Decision tree accuracies.
Classification AccuracyValue
Training 95.43%
Validation95.46%
Testing96.29%
Disclaimer/Publisher’s Note: The statements, opinions and data contained in all publications are solely those of the individual author(s) and contributor(s) and not of MDPI and/or the editor(s). MDPI and/or the editor(s) disclaim responsibility for any injury to people or property resulting from any ideas, methods, instructions or products referred to in the content.

