Article

Shape Deviation Network of an Injection-Molded Gear: Visualization of the Effect of Gate Position on Helix Deviation

Precision Manufacturing Laboratory, Department of Mechanical Engineering, Kyoto Institute of Technology, Goshokaidou-cho, Matsugasaki, Sakyo-ku, Kyoto 606-0951, Japan
*
Author to whom correspondence should be addressed.
Appl. Sci. 2024, 14(5), 2013; https://doi.org/10.3390/app14052013
Submission received: 31 January 2024 / Revised: 23 February 2024 / Accepted: 25 February 2024 / Published: 29 February 2024
(This article belongs to the Special Issue Modern Research of Gears and Power Transmission)

Abstract

:
The purpose of this study is to develop an evaluation method for assessing the relative relationship between gear tooth shape deviations on every gear tooth using network theory. Our previous study introduced a method for representing the phase difference between each helix deviation as a network, demonstrating that it is possible to identify the relative relationship between gear tooth deviations. However, there has been no in-depth analysis of the impact of injection molding on the gear’s phase difference network. In this paper, we begin by measuring the gear tooth shape deviation, calculating the correlation coefficient, and expressing it as an adjacency matrix. When the adjacency matrix was visualized and displayed as a pixel plot, a periodic pattern was formed. The relationship between the position of the gate used to inject molten resin material into the injection mold and the pixel plot were then investigated in detail, and it was confirmed that the helix deviation network of a gear manufactured with the injection molding process is useful as a new indicator for the manufacturing error of injection-molded plastic gear.

1. Introduction

Gears play an important role in power transmission mechanisms and are widely used across various industries. With the growing demand for high-volume production, there is a need to manufacture transmission gears that are both highly efficient and low in noise. The properties of gear tooth flanks generally affect not only the strength but also the efficiency and noise level of the gears in power transmissions [1,2,3,4,5]. While high precision grade gear pairs are believed to produce low-noise and low-vibration transmission systems, there are instances where even with the use of such gears, quiet gear power transmissions cannot be achieved [6,7,8]. This suggests that the current gear accuracy evaluation system may still be insufficient. The existing gear inspection parameters only account for tooth profile deviation and tooth helix deviation of individual teeth, without considering the relative evaluation among the deviations that may cause unnecessary vibration during power transmission [9,10].
Network theory is an analytical approach that is commonly employed to analyze complex system structures, such as railway networks, airline networks, and the network of spreading of COVID-19, as well as social network analysis of attitudes towards immigrants [11,12,13]. In addition, the method can be utilized to understand and elucidate the deviation of manufactured gears, for which Iba et al. proposed a novel approach based on network theory for expressing the relationship between tooth helix deviation curves in helical gears [14,15]. The study is accomplished by calculating the inner product between two helix deviations, which generates correlation coefficients which is an indicator capable of acquiring the phase difference between the deviations in the direction of the helix. Based on this approach, a network image of the gear is constructed, with each tooth of the gear representing a node and the correlation coefficient representing a link, respectively. Consequently, a comprehensive overview of the entire helix deviation curve of a gear is obtained, a feat that was previously challenging to achieve using conventional chart diagrams of helix deviation. However, to date, no detailed studies have created a tooth helix deviation network using deviation data of plastic gear manufactured through injection molding, nor have any studies investigated the impact of the manufacturing method on the phase difference network of the gear.
In this paper, this study aims to develop an evaluation method to assess the relative relationship between shape deviations on each tooth of an injection-molded gear by utilizing network theory. Firstly, the gear tooth shape deviation on each tooth of the injection-molded plastic gear was measured, and the data acquired were used to construct a helix deviation network. Subsequently, the adjacency matrix of the network was output as an image in the form of a pixel plot. The periodic pattern that formed in the pixel plot of the helix deviation network was then meticulously investigated by generating network images consisting of various fixed correlation coefficient ranges.

2. Materials and Methods

The present study presents a specialized approach to extract and visualize the periodicity imprinted on the tooth flank during the gear manufacturing process. The approach is based on visualizing the network between helix deviations, as suggested and devised by Iba et al. [14,15]. The first section of the paper provides a detailed description of the gear specification, followed by an overview of the adopted analysis method. The approach includes preprocessing the helix deviation data obtained from the gear inspection machine, computation of the correlation coefficient between two helix deviations, generation of the adjacency matrix, and visualization of the helix deviation network of injection-molded plastic gear. The methodology provides an effective way to extract and visualize the periodicity information left on the gear tooth flank during the gear manufacturing process.

2.1. Gear Specification

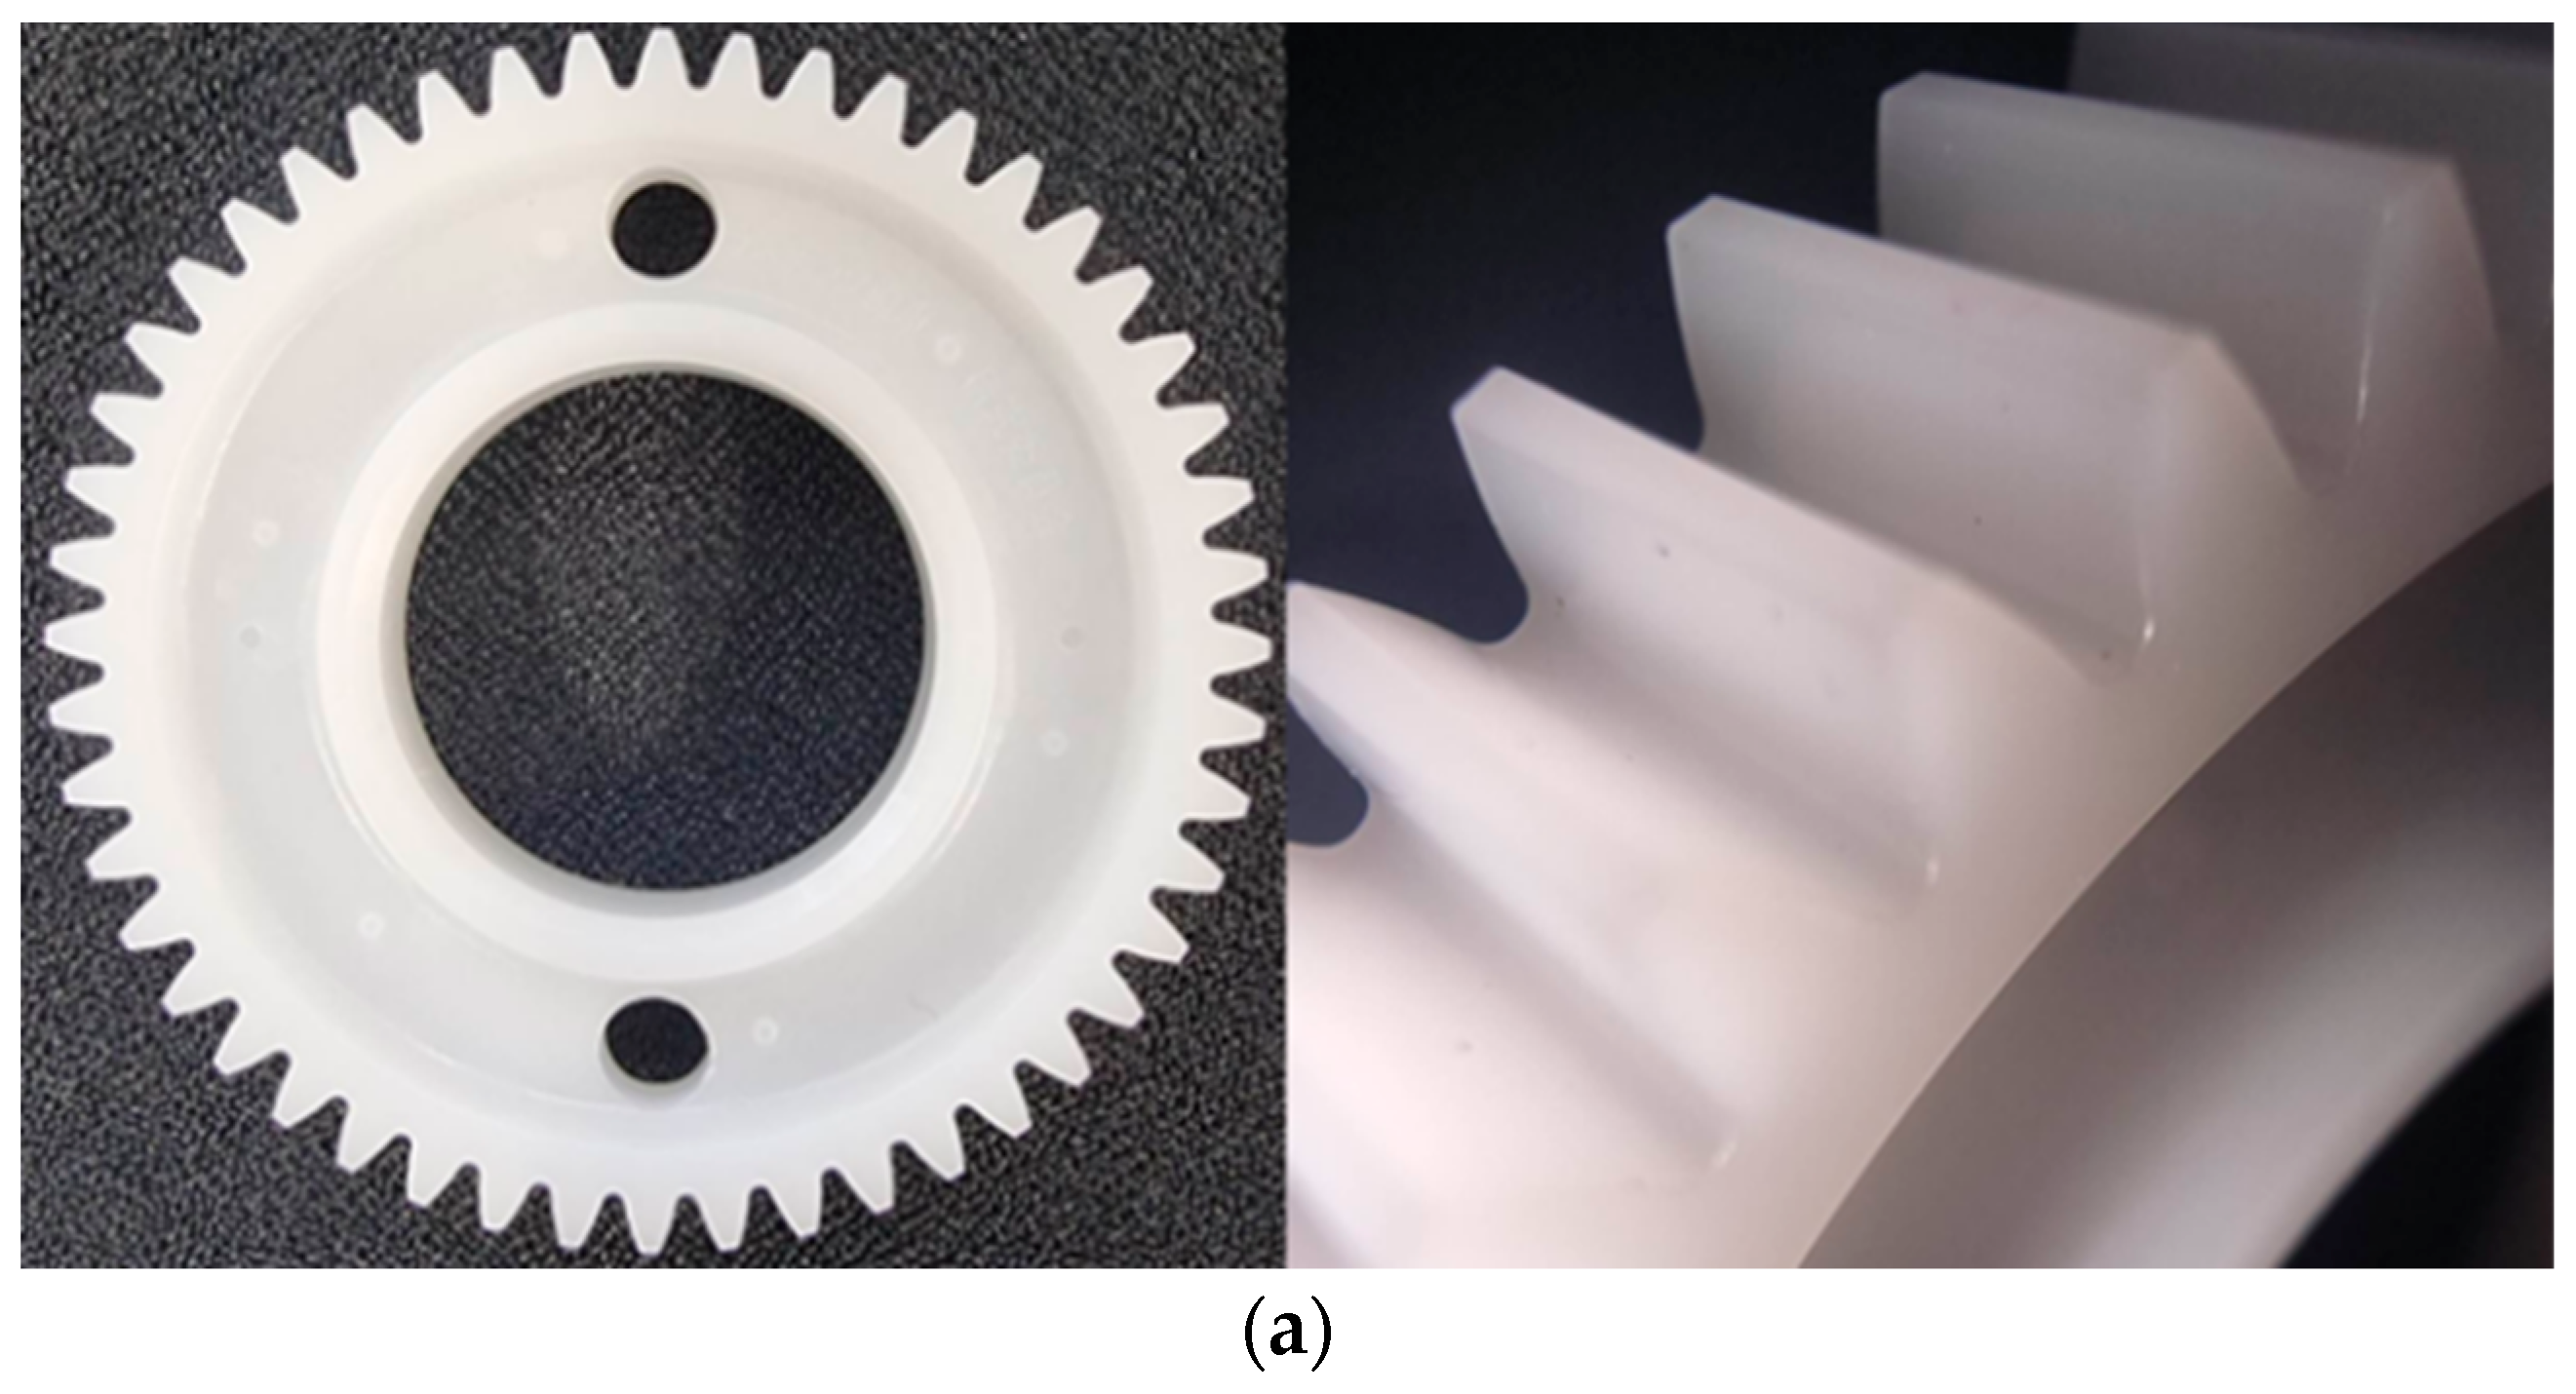
Figure 1a shows the gear used in this study, an injection-molded plastic gear with a module of 1.0. Made from polyoxymethylene (POM), it is also referred to as acetal or polyacetal, and the gear has a total of 48 teeth. The gear’s dimensions are displayed in Figure 1b, with its specifications outlined in Table 1 below. To accurately assess the deviation network of the helix in gears manufactured via injection molding, it is worth noting that the analysis in this study was performed on gears that were not subjected to any driving tests prior to the analysis.

2.2. Gear Inspection

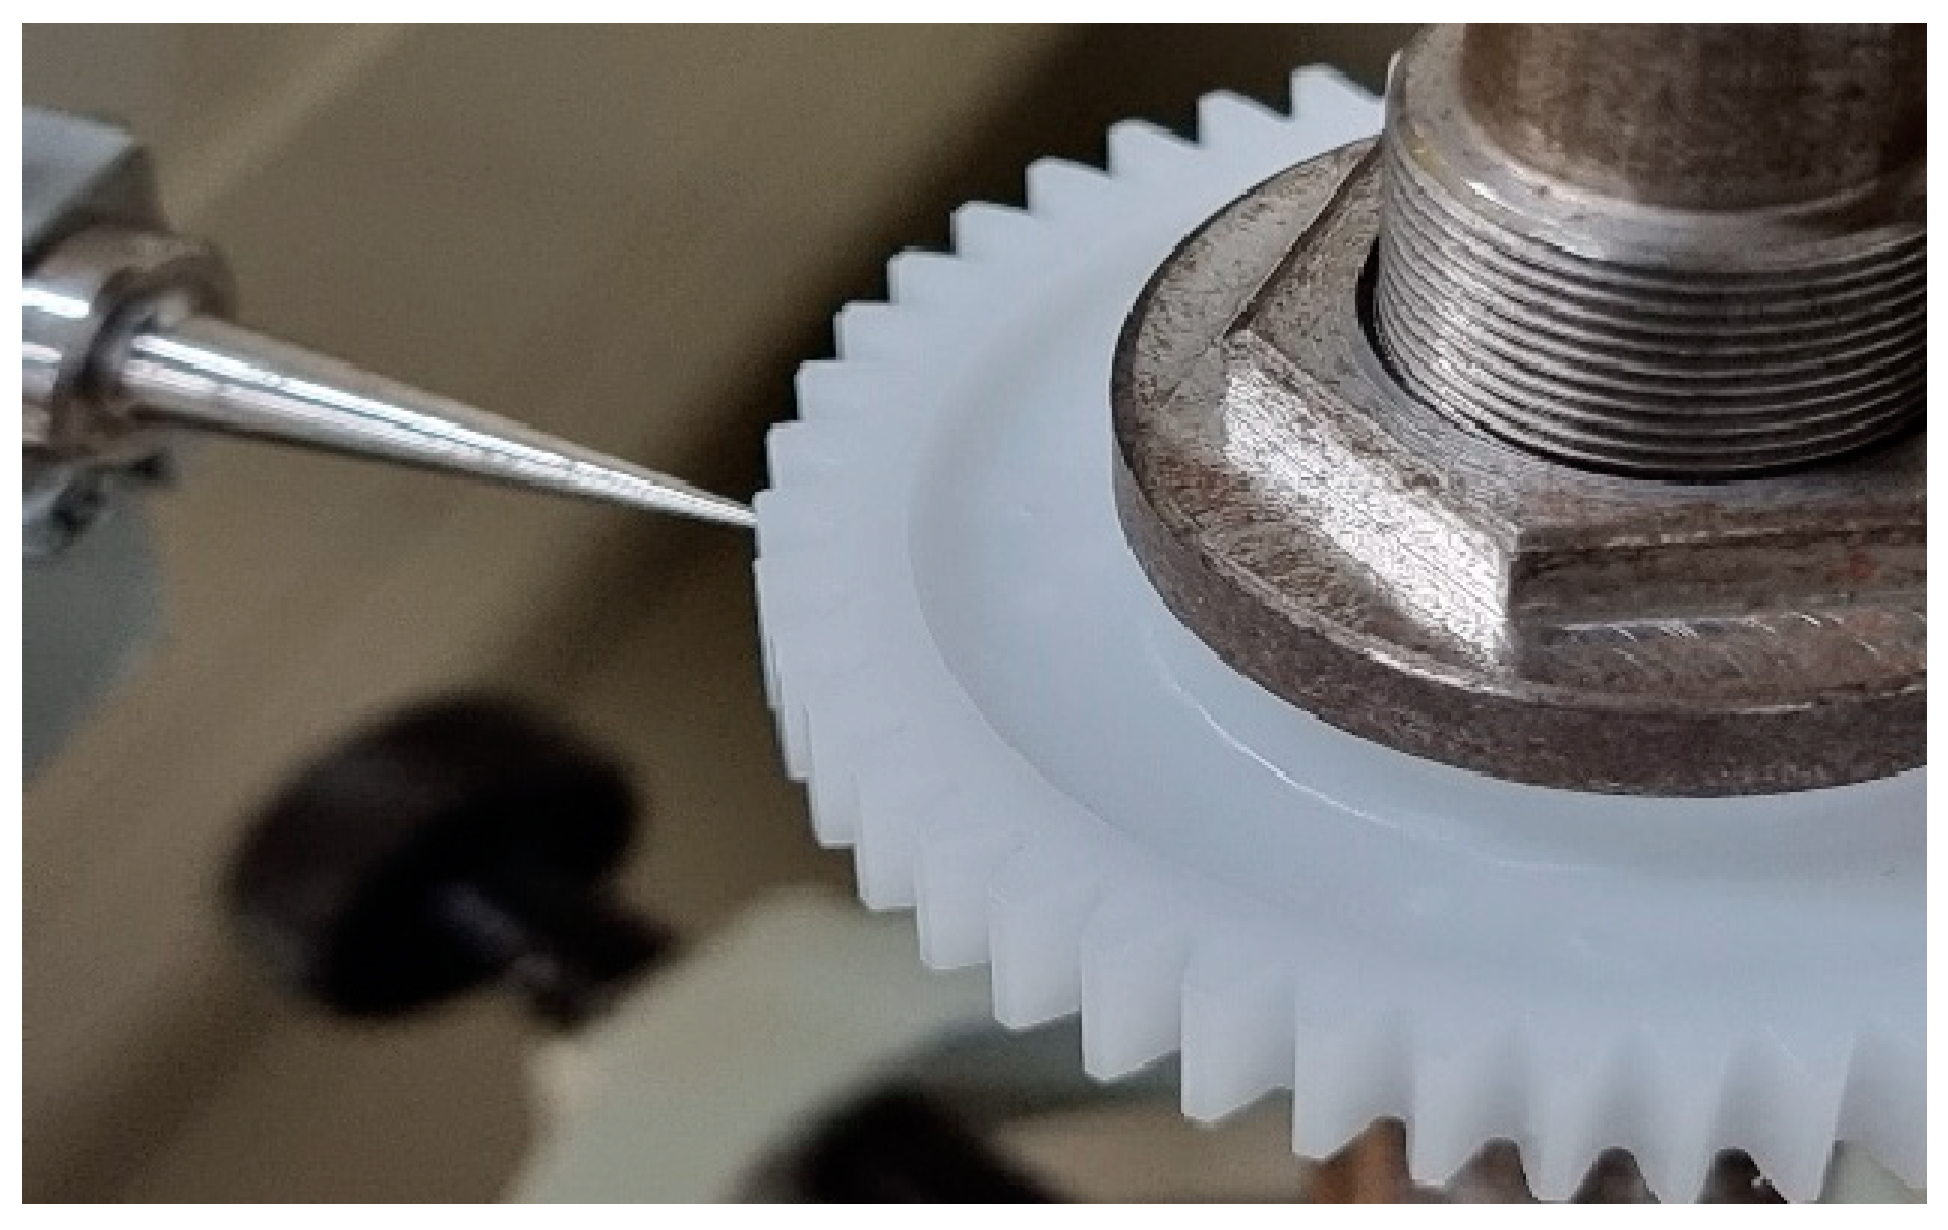
To analyze the helix deviation curves of the injection-molded plastic gear, we adopted a method proposed and devised by Iba et al. elaborated in reference article number 14th and 15th. Firstly, the helix deviation data of the gear were obtained by using a gear measuring machine. In our study, we employed a Computer Numerical Control (CNC) automatic gear inspection machine (model name: CLP-35) by TPR OSAKA SEIMITSU KIKAI Co., Ltd., Higashi-Osaka, Osaka, Japan to carry out the gear inspection process to obtain the data on helix deviation. Figure 2 shows an image of an injection-molded plastic gear undergoing the gear inspection process with the utilization of the gear inspection machine CLP-35. The specification of the gear inspection machine is shown in Table 2. When the gear inspection process is completed, the obtained data are converted and stored in the form of a Microsoft Excel 2019 file. The file is then imported to “MATLAB R2023a” programming software for further detailed analysis. For instance, the analyses executed in this study consisted of preprocessing of helix deviation data obtained from a gear inspection machine, computation of the correlation coefficient between two helix deviations, generation of the adjacency matrix, and visualization of the helix deviation network of injection-molded plastic gear.

2.3. Data Preprocessing

2.3.1. Elimination of Direct Current (DC) Component

When addressing tooth helix deviation, a crucial factor to consider is the direct current (DC) component or average value of the waveform. Removing the DC component is prioritized as it has a significant impact on pitch deviation but does not affect the phase shift of the helix deviation. Following this, the helix deviation curve after removing the DC component for i t h tooth number, f β i x , is calculated with the following Equation (1) in this paper.
f β i x = f β i ^ x f β   D C   i x
The helix deviation curve obtained from the data of gear inspection for i t h tooth number is regarded as f β i ^ x , and the DC component or average value of the curve for i t h tooth number is defined as f β   D C   i x . Additionally, x denotes the position of the evaluation length of helix deviation.

2.3.2. Elimination of Slope Component

The inclusion of a slope component in the measurement signal such as the signal of helix deviation of this study can pose a challenge when attempting to extract its periodicity through correlation function analysis. Therefore, it is crucial to eliminate the gradient component to derive the exact periodicity of the signal. In this paper, the helix deviation curve after the removal of DC and slope component for the i t h tooth number, f H β i x , is calculated with the following Equation (2).
f H β i x = f β i x y H β i x
f β i x is regarded as the helix deviation curve after the DC component for i t h tooth number is eliminated, and y H β i x is regarded as the slope component of f β i x calculated by utilizing the least square method.

2.3.3. Elimination of Low-Frequency Component

It is crucial to acknowledge that the signal of a helix deviation often comprises a waviness component, which pertains to a low-frequency element. As significant low-frequency components of the signal can substantially impact the outcome of the correlation function analysis, it is crucial to consider the elimination of the low-frequency component of the helix deviation signal. Equation (3) illustrates the Fourier transform employed on the helix deviation curve, f H β i x , following the removal of the slope component.
F H β i ω / 2 π = f H β i x · e i · ω x d x
Subsequently, the largest waviness component, F H β i   l o w , of the tooth helix deviation after being Fourier transformed is then eliminated by utilizing the following Equation (4). The Fourier transformed helix deviation signal following the elimination of the largest waviness component is regarded as F β i   e l i as illustrated in Equation (4).
F β i   e l i = F H β i ω / 2 π F β i   l o w
In consequence, the helix deviation after the elimination of the largest waviness component, F β i   h i g h x , is then derived by applying inverse Fourier transform to the Fourier transformed helix deviation signal following the elimination of the largest waviness component F β i   e l i as illustrated in the following Equation (5).
F β i   h i g h x = F β i   e l i · e i · ω x d ω

2.3.4. Gaussian Filter

In order to effectively extract the desired frequency component of the study, a designated filter is utilized in this procedure. In particular, the Gaussian filter is employed to remove the roughness component from the frequency component of the signal. This filter can be employed alongside the Fourier transform and inverse Fourier transform operation to effectively remove low-frequency components. The filter’s weight function, as defined in Equation (6), has an amplitude transfer of 50% at the cutoff value of λ c .
s x = 1 α λ c e π x α λ c 2
The coefficient α is defined in the following Equation (7).
α = l n 2 π 0.5
The filtering of the signal is executed by utilizing convolution integration of the measured helix deviation curves and weight functions as shown in the following Equation (8).
f ^ β i x = f ¯ β i τ s x τ d τ

2.4. Correlation Function

In this paper, a helix deviation network of the gear is generated from the measured helix deviation data according to the method proposed and devised in the previous studies [14,15]. This section describes the derivation method of the shape deviation network. Firstly, nodes and links are required for constructing networks. To obtain a precise understanding of the relationships that exist among nodes within a network, it is important to examine not only the existence of the links within the nodes but also the strength or intensity of their connection. This study has achieved this by computing correlation coefficients between helix deviations. In the methodology adopted based on previous studies, the teeth of gears are regarded as nodes, and the computed correlation coefficients serve as links within the network. The correlation coefficient is determined by deriving the inner product between two helix deviations as illustrated in the following Equation (9).
f β j x , f β k x = 1 L 0 L f β j x f β k x d x
where f β j x represents the helix deviation of j t h tooth. j and k are positive integers from tooth number 1 to the number of teeth z ; however, k j . x is defined as the position of the evaluation length and L is defined as the integral range. The orthogonality of signals can be expressed by defining the inner product as illustrated in Equation (9). When f β j x , f β k x = 0 , f β j x and f β k x are orthogonal. By calculating the inner product as illustrated in Equation (9) above, the phase difference between the two tooth helix deviations can be obtained. The quotient of the inner product and the norm of each deviation is calculated as the correlation coefficient. Additionally, the norm of the helix deviation is defined in the following Equation (10).
f β j x = 1 L 0 L f β j x 2 d x
By applying both Equations (9) and (10), the correlation coefficient of a network is defined as the following Equation (11).
r j , k = f β j x , f β k x f β j x f β k x
It is important to note that the correlation coefficient measures the degree of linear relationship between two variables, and it ranges from the value −1.0 to 1.0, where the value −1.0 denotes a perfect negative correlation, the value 0 denotes no correlation, and the value 1.0 indicates a perfect positive correlation. When the two tooth helix deviations exhibit a small phase difference, the correlation coefficient tends to approach the value of 1.0. Conversely, when the two deviations display a large phase difference, the correlation coefficient tends to approach the value of −1.0. Therefore, it is crucial to consider the phase difference between the two tooth helix deviations when interpreting the value of the correlation coefficient.

2.5. Adjacency Matrix

To represent complete information about a network, links in the network must be traced and represented. Therefore, network theory [11] mathematically represents the network by listing links in a matrix called an adjacency matrix, where the adjacency matrix A of a network diagram with N edges have N rows and N columns, and the element A m , n for which edge m , n has weight of w m , n is usually defined as the following Equation (12).
A m , n = w m , n   I f   v m   a n d   v n   a r e   c o n n e c t e d 0   I f   v m   a n d   v n   a r e   n o t   c o n n e c t e d   t o   e a c h   o t h e r
In this study, the 1st row and the 1st column of the matrix express the number of gear teeth in the matrix. The correlation coefficient among the helix deviations of the gear can be found starting in the 2nd row and 2nd column of the adjacency matrix. Each component from the 2nd row and 2nd column represents the correlation coefficient among the helix deviations of the gear. The diagonal elements of the matrix are defined as 0. By employing the adjacency matrix, it is possible to quantitatively evaluate the helix deviation network of a gear.

2.6. Visualization

2.6.1. Pixel Plot

In this section, a diagram consisting of pixels is generated from the adjacency matrix. Similar to the tooth number ordering in the adjacency matrix, the horizontal and vertical axes both represent the number of teeth, with the number of tooth number on the horizontal axis starting from left to right in ascending order, and the number of tooth number on the vertical axis starting from the top to bottom in ascending order. Each tooth number, z, possesses a total number of z − 1 correlation coefficients with other teeth, and correlation coefficients of all teeth are listed together in an adjacency matrix with a dimension of z × z excluding the 1st row and the 1st column of the matrix that expresses the number of gear teeth. The degree of the correlation coefficient, r j , k is represented by the color bar positioned on the right side next to the plot, the yellowish color represents a correlation coefficient with a value closer to 1.0. On the contrary, the bluish color represents a correlation coefficient with a value closer to −1.0. By applying this method, the relative relationship between each gear teeth can be studied and understood.

2.6.2. Network Image

A diagram consisting of several points and lines connecting the points is called a graph. When a graph consists of weighted edges that incorporate various functions, such as time or distance, it is commonly referred to as a “network”. In network theory, the vertices and edges are denoted as nodes and links, respectively. The graph G can be determined by its vertex set   V and edge set   E . Therefore, the expression for the graph G can be represented mathematically by using the following Equation (13).
G = V , E
In this study, the vertex set V consists of the teeth of gears and is expressed by the following equation, where z represents the tooth number.
V = v 1 , v 2 , , v z
Next, the edge connected to the m t h and n t h gear tooth number is expressed as v m , v n . Thus, the edge set E is defined as the following equation.
E = v 1 , v 2 , v 2 , v 3 , , v z 1 , v z
In this study, correlation coefficients are used to assign weights to the edges, allowing one to generate a network image that displays the relative relationship between gear teeth within a specific range of correlation coefficients.

3. Results

In this section, the analysis method is applied to the injection-molded cylindrical gear shown in Section 2.1, and the result obtained will be presented and discussed. To ensure a thorough evaluation of the results, the section has been divided into several distinct parts comprising the helix deviation curve, adjacency matrix, pixel plot, and network image.

3.1. Helix Deviation Curve

3.1.1. Original Data

Figure 3 shows the left helix deviation curve of tooth number 1st plotted with data obtained from the gear inspection process. For ease of identification, the helix deviation plotted with all data points is indicated by the curve in black color, and the helix deviation after the elimination of 20% of data points at both ends is indicated by the curve in red color. Due to the presence of chamfer and rounding of the tooth on the tooth flank, the data at both ends of helix deviation possess inappropriate weighted information that will have an unnecessary influence on the analysis result. Therefore, 20% of data points at both ends of the helix deviation are eliminated to enhance the accuracy of the analysis result.
The helix deviation data obtained from the gear inspection process are plotted in the same graph, and Figure 4a and Figure 4b show the left and right helix deviation curves of all gear teeth, respectively. The helix deviation curves of tooth number 1st~48th are shown accordingly in the graph from top to bottom. From the results, we observed that left and right helix deviations of the analyzed POM gear exhibit a negative gradient, while the gradient of each tooth varies among each tooth.

3.1.2. Elimination of Direct Current (DC) and Slope Component

The helix deviation curves of left and right gear teeth after the elimination of DC and slope components are shown in Figure 5a and Figure 5b, respectively. In contrast to the helix deviation curves of the original data, both left and right helix deviations display a relatively uniform gradient. Nonetheless, certain curves exhibit a slightly convex shape, with a minor dip in the central region of the curves.

3.2. Adjacency Matrix

3.2.1. Adjacency Matrix of Left and Right Helix Deviation

In this section, the correlation coefficient of each tooth is then calculated and listed as an adjacency matrix. In this study, the injection-molded plastic gear used is a gear consisting of 48 teeth. Therefore, the adjacency matrix formed is a 48 × 48 dimensions matrix. Figure 6a shows the adjacency matrix enclosed with the correlation coefficient of left helix deviation. Due to the enormous size of the adjacency matrix, only the information of the tooth numbers 1st to 8th are shown here. To study the network of the helix deviation, we then visualize the adjacency matrix by generating a pixel plot, and a color bar is added to express the strength of the correlation coefficient. Figure 6b shows the pixel plot corresponding to the adjacency matrix shown in Figure 5a. From the pixel plot, the pixels of tooth number pairs 3rd and 4th, 3rd and 5th, and 4th and 5th are filled with the color yellow as the correlation coefficients of the 3 pairs are 0.797, 0.773, and 0.773, respectively. On the contrary, the pixels of tooth number pairs 2nd and 5th and 5th and 7th are filled with the color blue as the correlation coefficients of the pairs are −0.002 and 0.032, respectively. With the visualization of pixel plots, the helix deviation network of gear with an enormous number of teeth can be understood easily.
The adjacency matrix and its visualization allow the expression of the entire tooth helix deviation curve from a bird’s-eye view, which is a significant improvement over the conventional chart diagram that organizes the deviation curves tooth by tooth. The conventional chart diagram poses difficulty in expressing an overview of the tooth helix deviation curve, which is addressed by the utilization of this method. By employing this approach, the entire curve can be visualized with ease, providing a comprehensive representation of the network of helix deviation.

3.2.2. Strong Correlation and Weak Correlation

This section shows the curves with the greatest and weakest correlation coefficients between the helix deviation data of the left and right helix deviations of the injection-molded gear. Figure 7a shows the helix deviation curves of tooth number 20th and 45th that exhibit the greatest correlation coefficient in the left helix deviation. The value of the correlation coefficient is 0.892. The helix deviation curve of tooth number 20th and 45th are identical to each other as portrayed in Figure 7a. Despite having slightly different fluctuations in the curves, the phase difference between the curves is almost zero. On the contrary, the minimum value of the correlation coefficient is −0.448, which is exhibited by the pair of tooth number 9th and 27th shown in Figure 7b. As opposed to Figure 7a, the helix deviation curves in Figure 7b possess a large phase difference. By calculating correlation coefficients of helix deviations, we can uncover new insights and obtain phase information between helix deviations of 2 gear teeth.

3.3. Pixel Plot

Figure 8a,b show the pixel plot of left and right helix deviation generated from the adjacency matrix that encloses information on the correlation coefficient after the DC and slope components are eliminated. Since the greatest correlation coefficients of left and right helix deviation are 0.892 and 0.916 and the weakest correlation coefficients of left and right helix deviation are −0.448 and −0.419, respectively, the range of color bar which indicates the degree of the correlation coefficient in pixel plot is set to −0.5 to 1.0. For both left and right helix deviations, a uniform and periodic pattern is formed. In both cases, for almost every tooth number, there are six regions with relatively high correlation coefficients, which are indicated by the yellowish and yellow color of the plot, and six regions with low negative correlation coefficients which are indicated by the greenish and blue color. In the case of the left tooth helix deviation shown in Figure 8a, a grid-like pattern can be observed. Moreover, the region of tooth number 2nd, 7th~10th, 16th~18th, 41st~42nd possesses a lower correlation coefficient in left helix deviation. In the case of the right helix deviation shown in Figure 8b, a houndstooth pattern was formed. Every tooth possesses six high and low correlation coefficient regions, and the size of the regions is fairly uniform. For the grid-like pattern that formed in the pixel plot of left helix deviation and the houndstooth pattern that formed in right helix deviation, the six high and six low correlation coefficient regions occurred at almost the same distance.

3.4. Network Image

Figure 9 and Figure 10 show the network images of left and right helix deviation generated from the upper triangular of the adjacency matrix that enclosed information on the correlation coefficient after DC and slope components are eliminated. The network images are generated within the correlation coefficient range of −0.5 to 1.0, and a 0.25 interval between each image is set to understand the properties of helix deviations of the gear and avoid overlapping of the links. A total of six network images are generated in descending order with the degree of strength of the correlation coefficients, and the links in red represent the positive correlation coefficient value between two helix deviations, while the links in blue represent the negative correlation coefficient value between two helix deviations. In the network images of both left and right helix deviation, most of the links occurred within the positive ranges, while most of the positive links occurred in the correlation coefficient range of 0.50 r j , k 0.75 .
Additionally, in both cases of left and right helix deviation, a hexagon-shaped network is formed within the correlation coefficient range of 0.75 r j , k 1.0 . A total of six spots concentrated with links were formed in both the network images. For the left helix deviation shown in Figure 8, the six concentrated link spots are tooth number 3rd~5th, 12th~13th, 19th~23rd, 27th~30th, 35th~38th, 44th~46th, whereas, in right helix deviation shown in Figure 10, the six concentrated link spots are 1st~3rd, 9th~10th, 16th~18th, 24th~26th, 32nd~35th, 39th~42nd.

4. Discussion

The present study demonstrates that visualizing the network between helix deviations of an injection-molded plastic gear enables the extraction and visualization of the periodicity left on the gear tooth flank during the gear manufacturing process. To ensure the accurate analysis and extraction of the periodicity left on the gear tooth flank during the injection molding process, the DC and slope components were eliminated to eliminate unnecessary weight that would affect the accuracy of the analysis result. Gaussian filter was not adopted in this study as the extraction of the waviness component would eliminate the periodicity left on the tooth flank of an injection-molded plastic gear.
Furthermore, with the visualization of the pixel plot, the relative relationship between each gear tooth can be recognized easily. When the pixel plots of left and right helix deviation of the injection-molded plastic gear were generated, a grid pattern was formed in the network of the left helix deviation shown in Figure 8a, whereas in the case of the network of right helix deviation shown in Figure 8b, a houndstooth pattern was formed. By comparing the pixel plot of a specific tooth number across the pixel plot vertically or horizontally, the information on the correlation coefficient of the specific tooth with all other 47th teeth could be obtained.
For instance, in the case of the pixel plot of left helix deviation, tooth numbers 7th to 10th were filled with bluish pixels when observed across the plot. This implies that the helix deviations of tooth numbers 7th to 10th exhibit a lower correlation coefficient, meaning that the helix deviations are dissimilar when compared to other teeth.
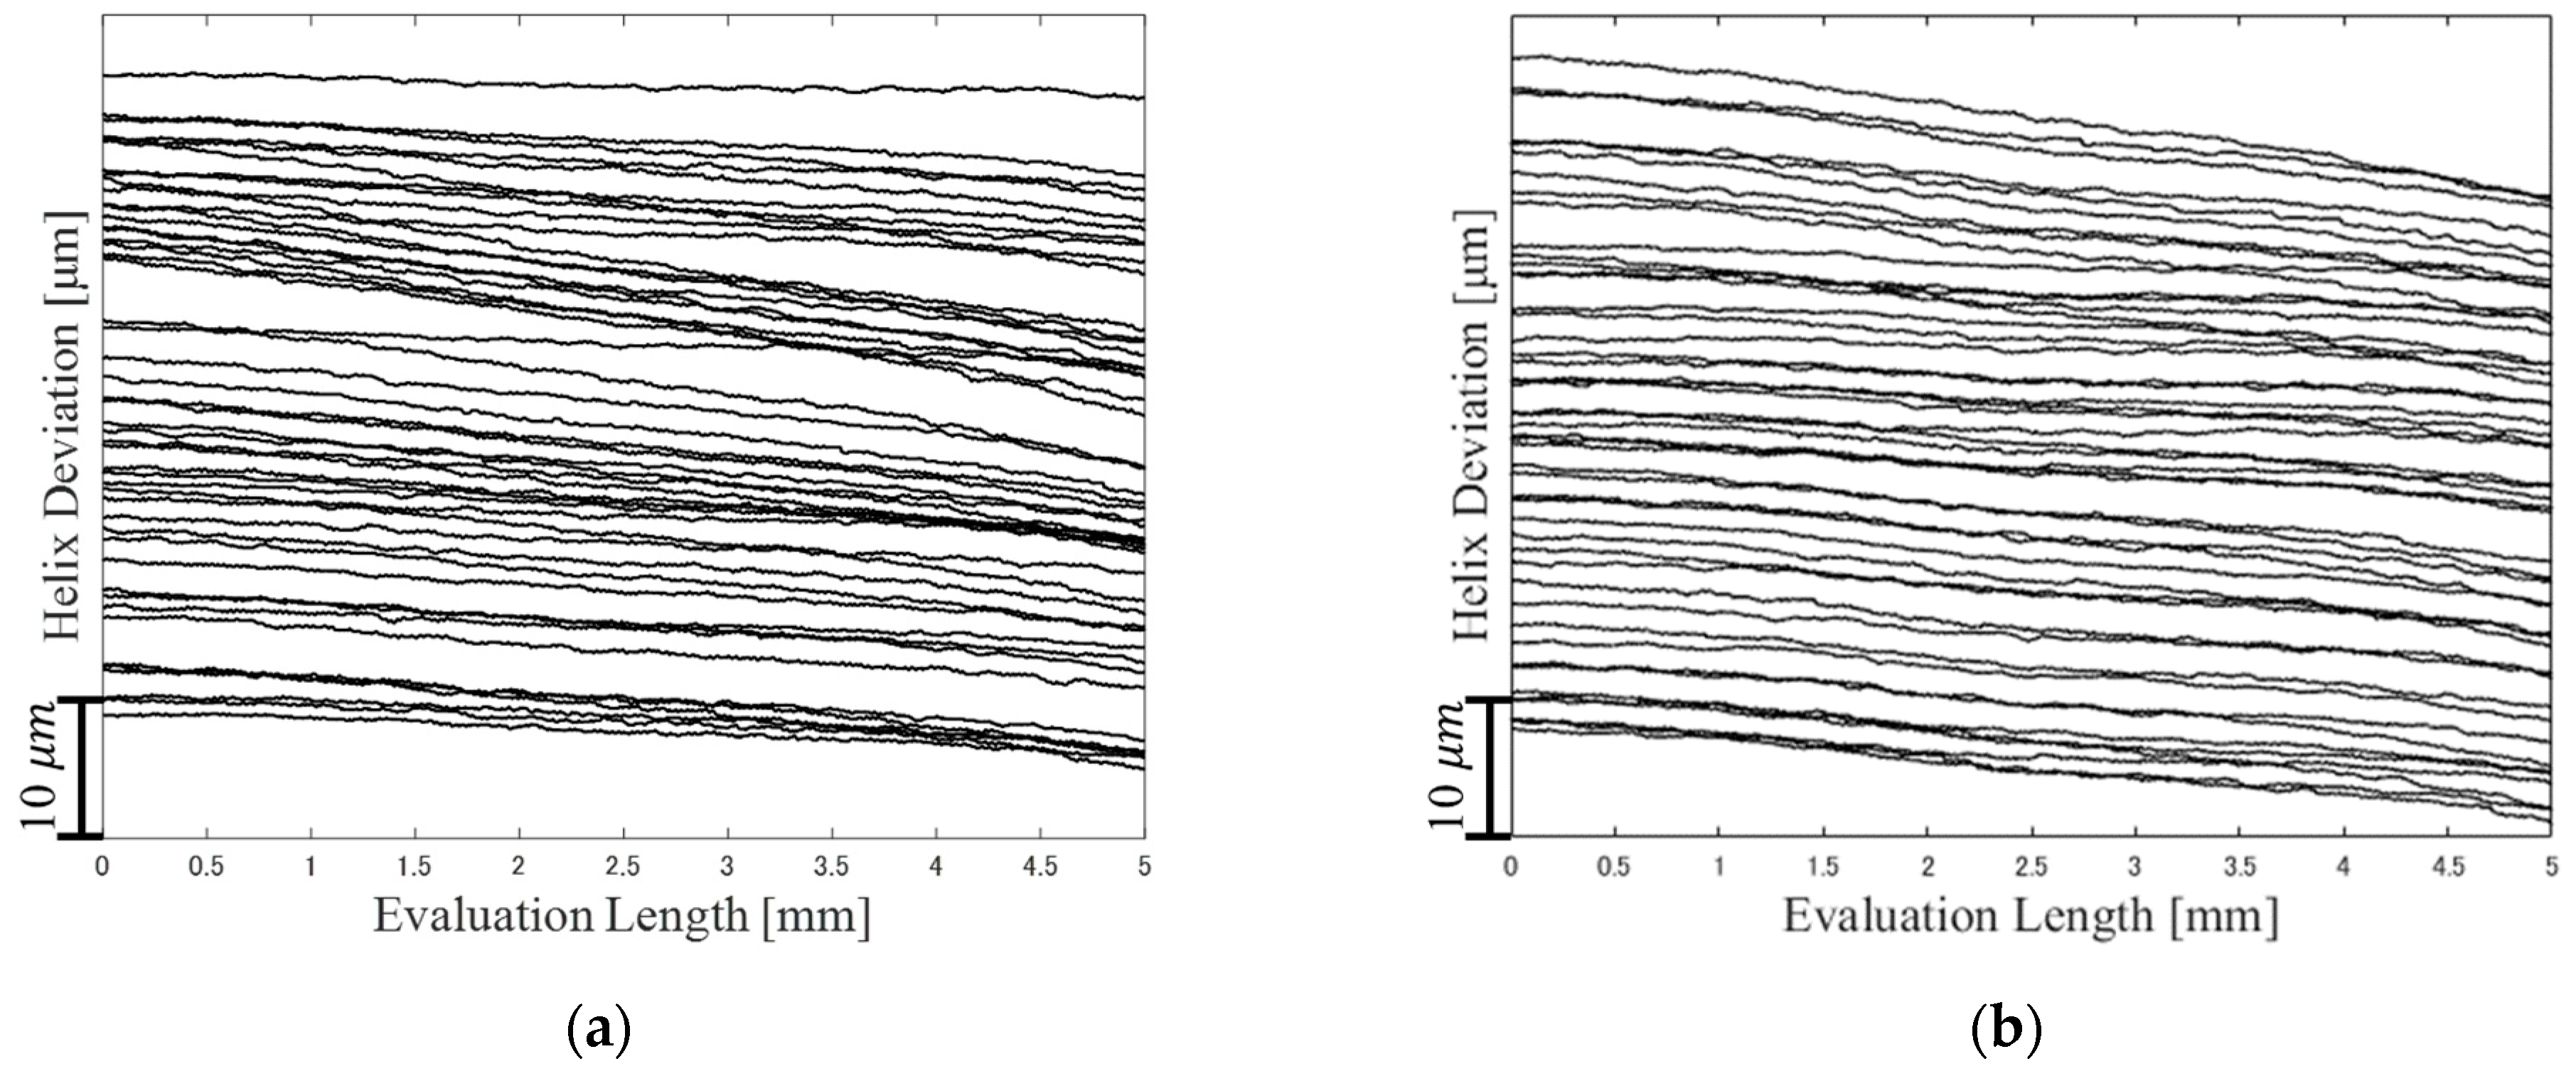
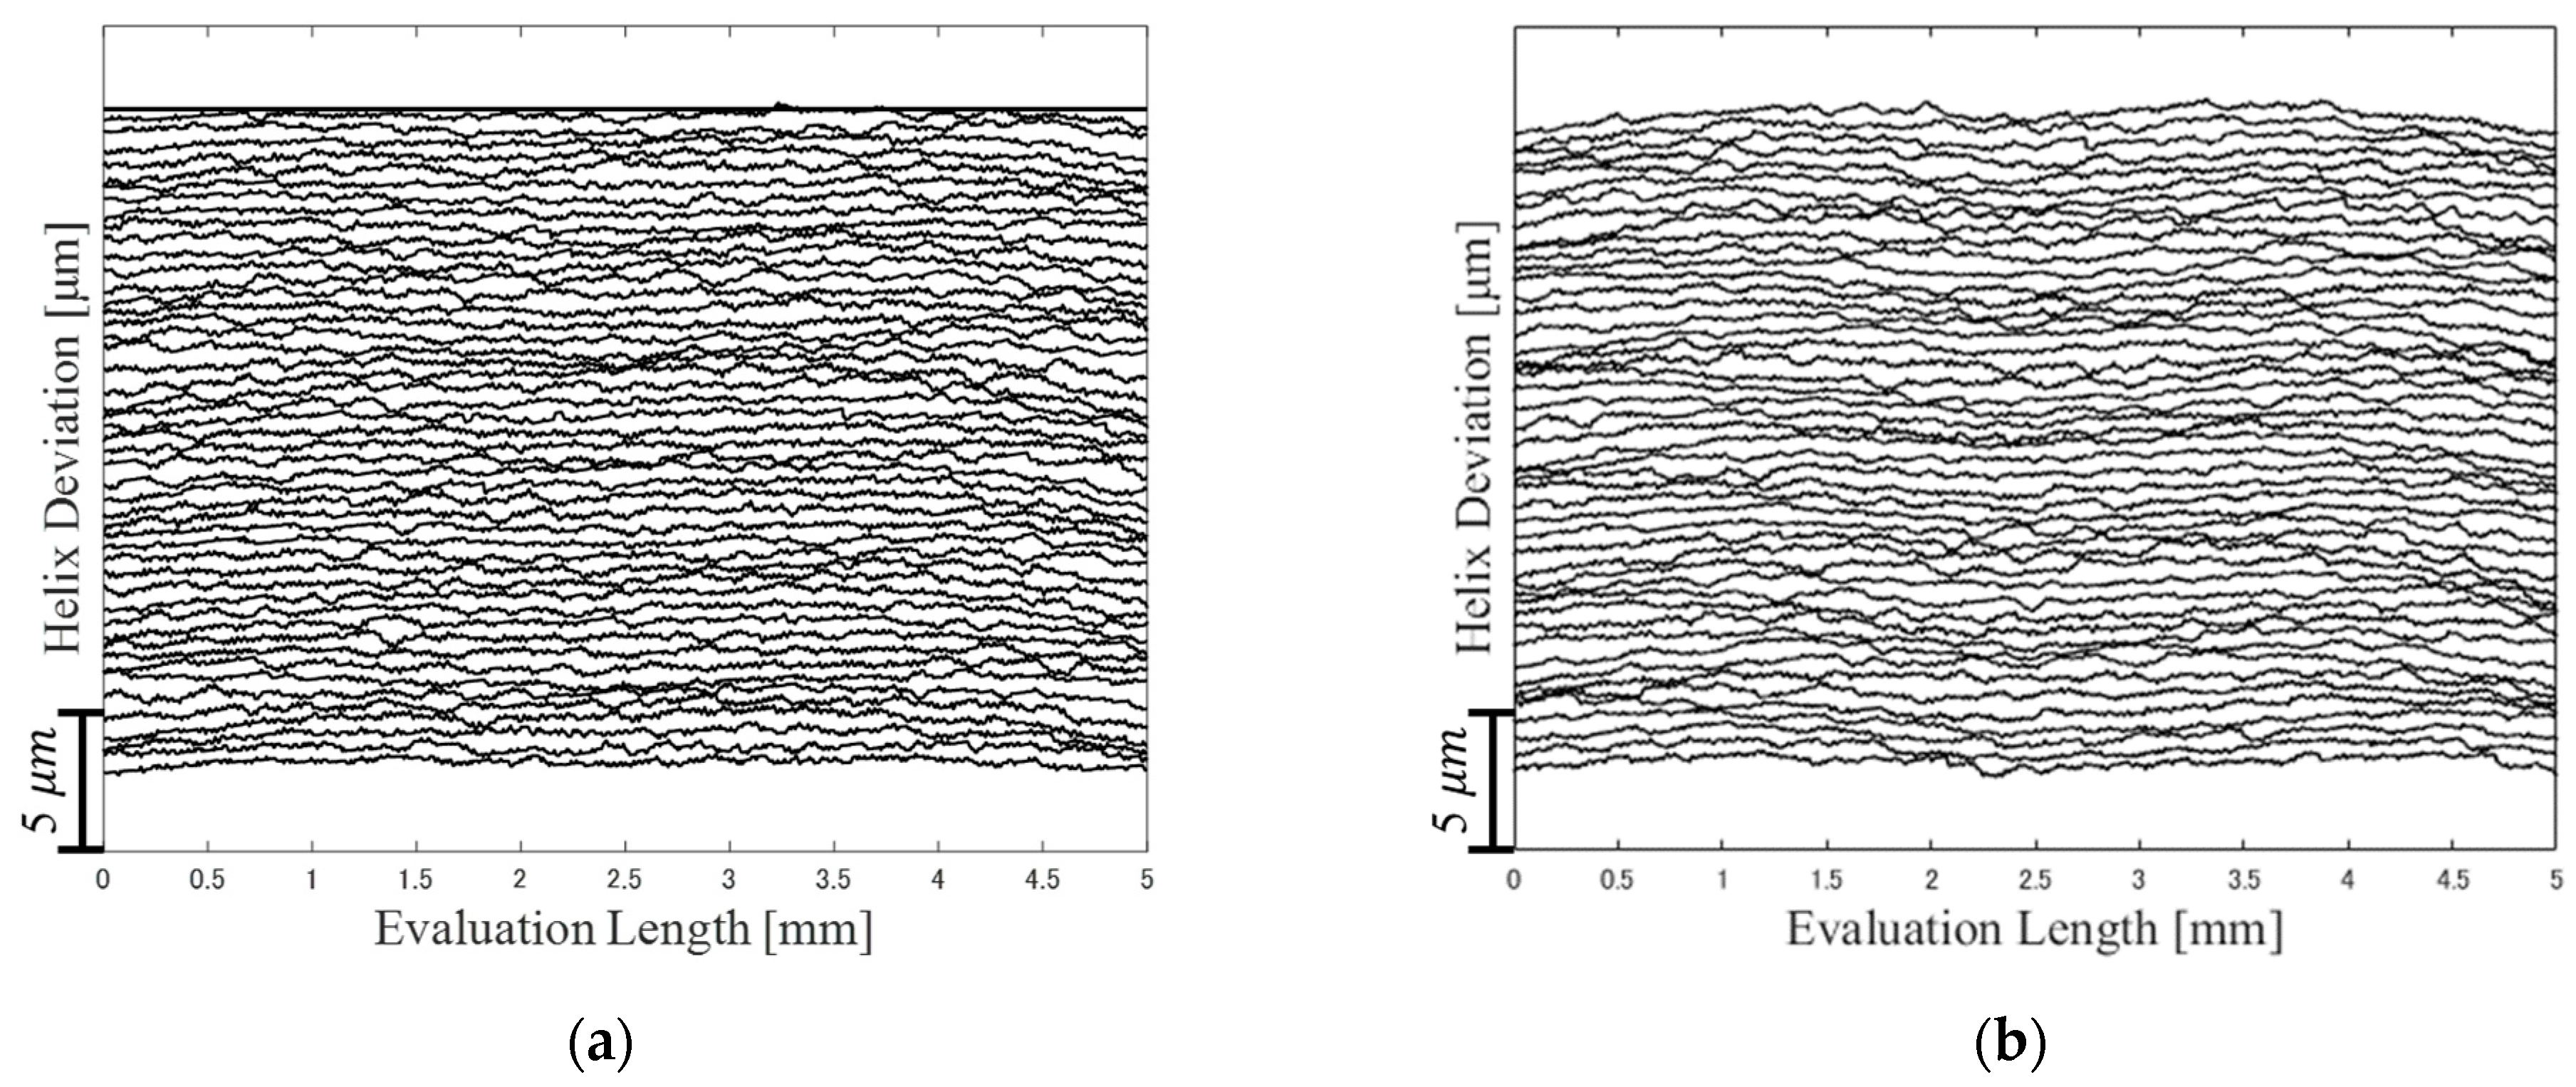
 Figure 11a and Figure 11b show the left helix deviation curves of tooth number 3rd~6th and 7th~10th, respectively. When the helix deviation curves of tooth number 7th~10th are compared to the helix deviation curves of tooth number 3rd~6th, which largely possess pixels filled with yellowish color when observed across the plot, it is apparent that the curves have a different distinctive shape. In the case of tooth number 3rd~6th, the helix deviation curves possess convex shape curves, with a slight dent at evaluation length 1.8 mm, whereas in the case of tooth number 7th~10th, the helix deviation curves possess M-shaped curves, where the dent of the curves occurred at evaluation length 2.5 mm.
In the case of pixel plot of right helix deviation, when the pixels of tooth number 1st~3rd are observed horizontally across the plot, pixels filled with yellowish color and bluish color alternated and occurred next to each other, where the yellowish pixels formed first from the left. On the contrary, for tooth number 4th~7th, pixels filled with yellowish and bluish color can be observed across the plot, where the bluish pixels formed first from the left. Figure 12a and Figure 12b show the right helix deviation curves of tooth numbers 1st~3rd and 4th~7th, respectively. When the helix deviation curves of tooth number 1st~3rd are compared to tooth number 4th~7th, helix deviation curves in both cases possess m-shaped curves, where the valley of the curves occurred at evaluation length 2.5 mm. However, the minima of the valley of the curves in tooth number 4th~7th has a smaller value of helix deviation compared to the valley in the case of tooth number 1st~3rd.
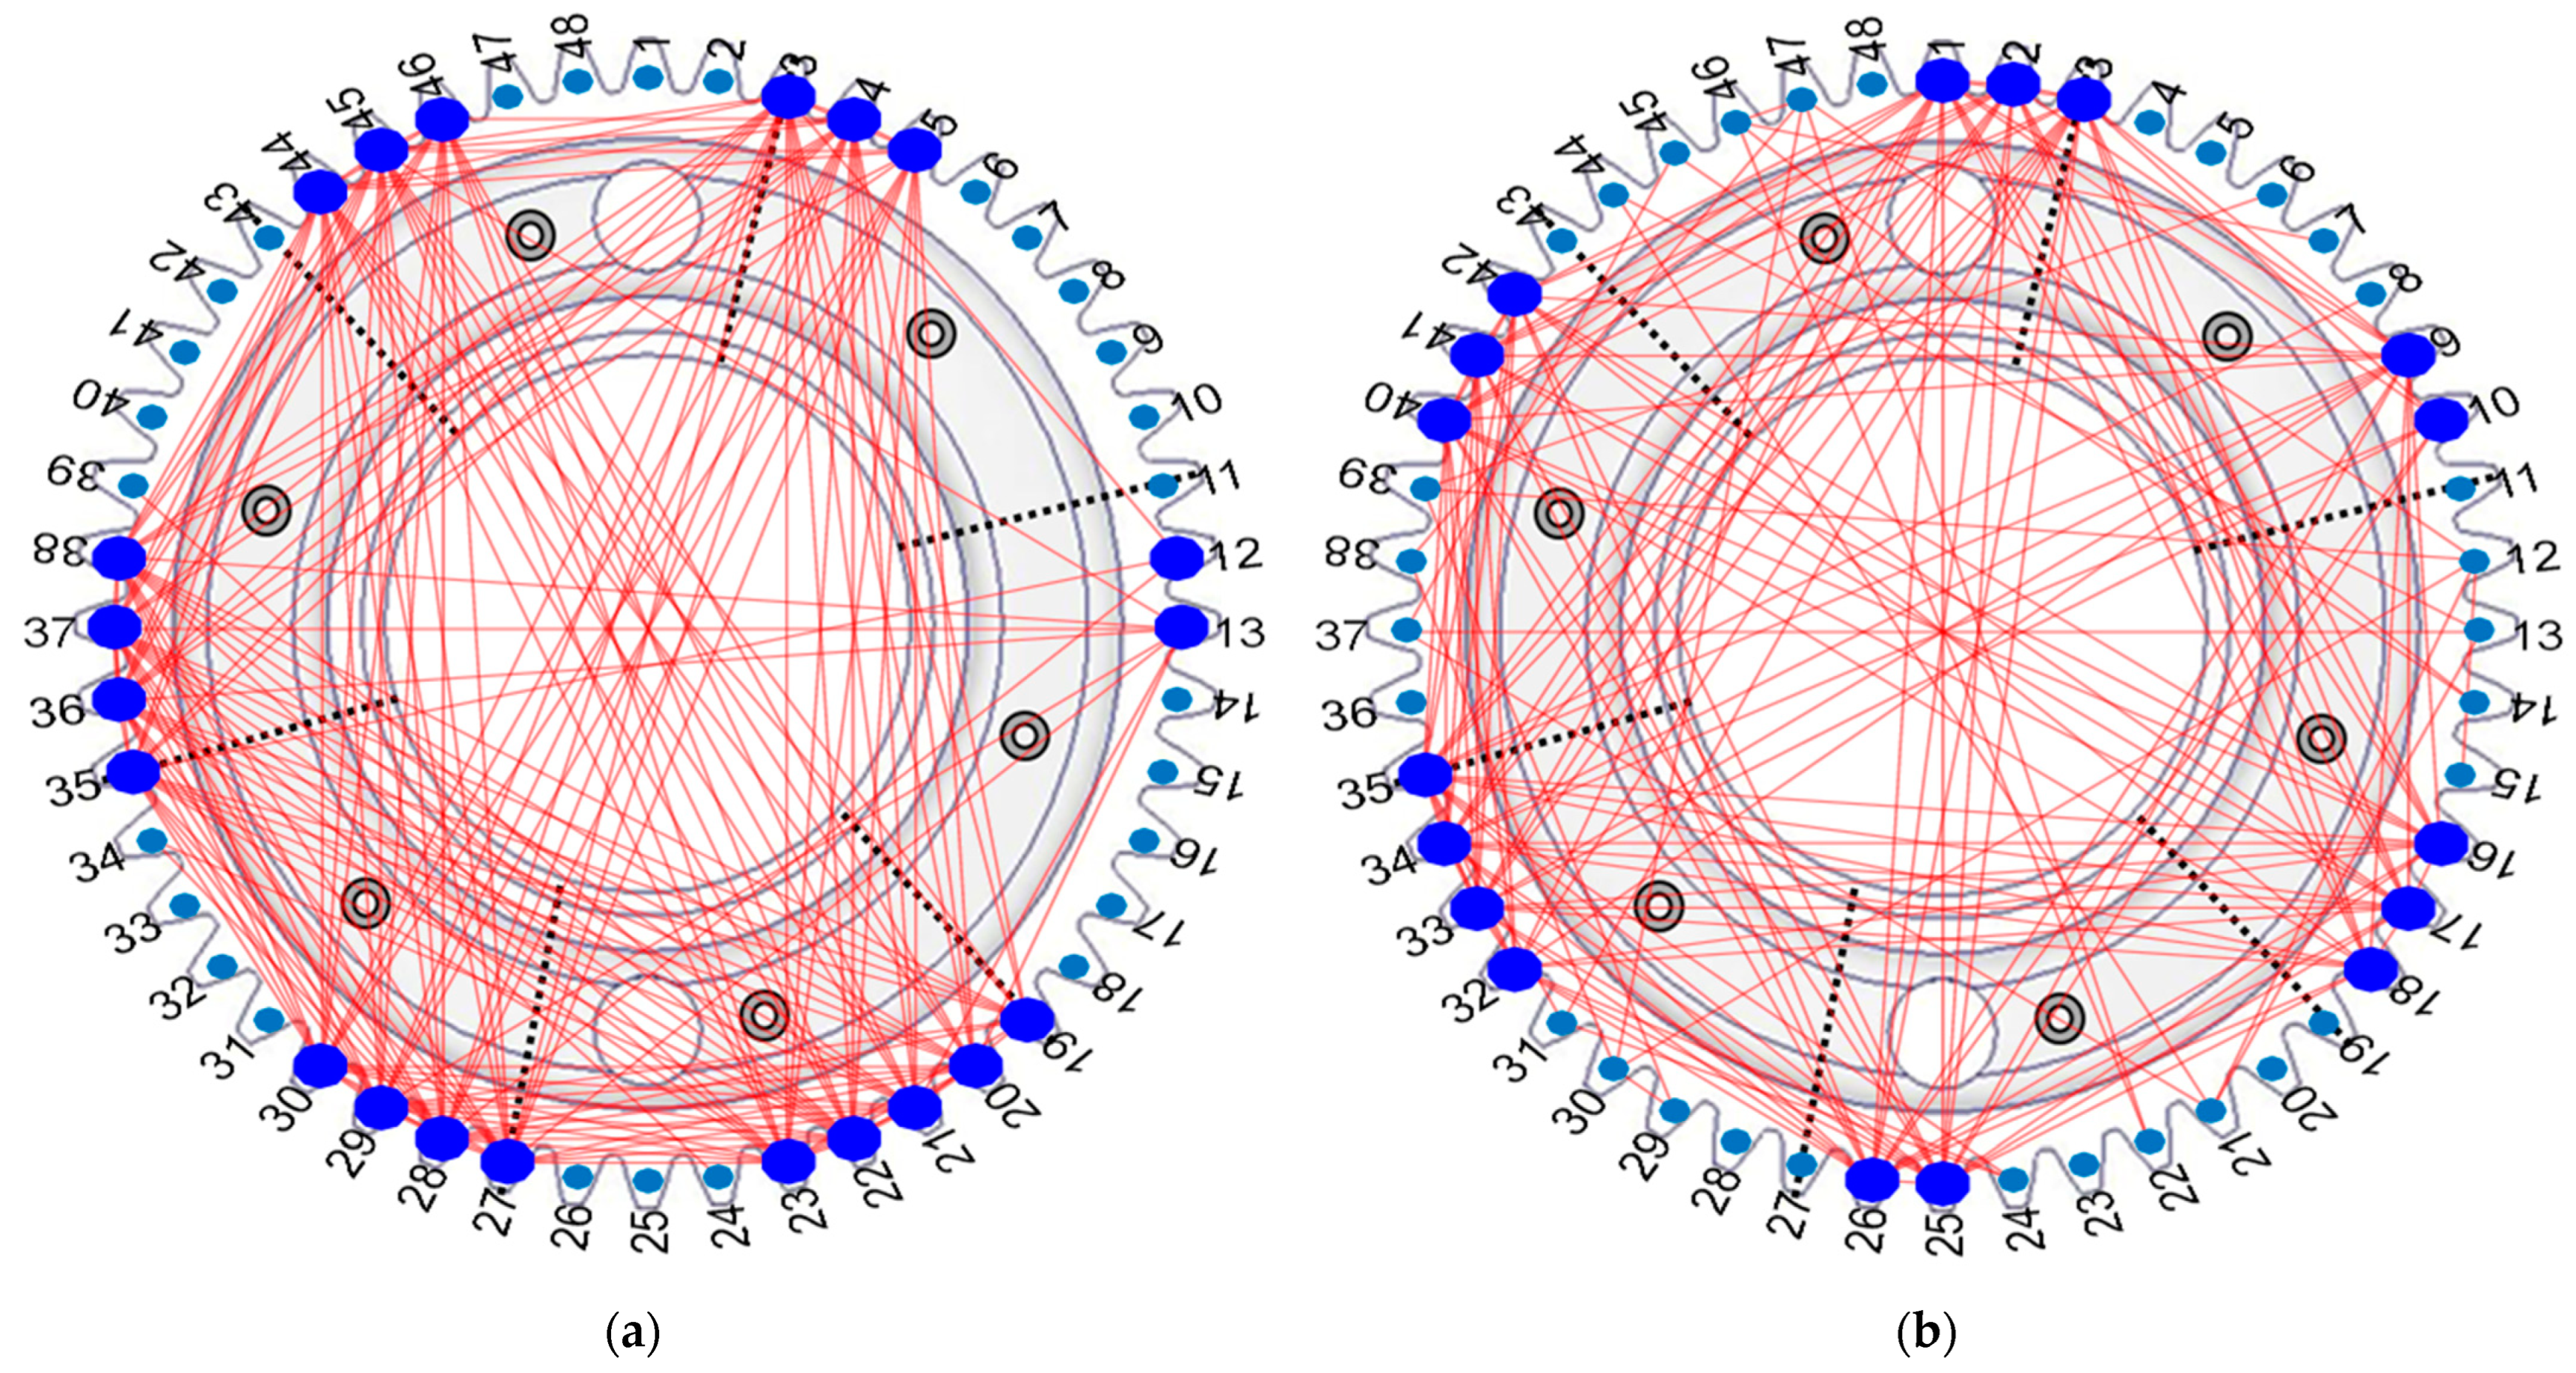
The network of the helix deviations was then output in the form of a network image to investigate the relative relationship between each gear tooth when the correlation coefficient is at a fixed range. In this study, the range was set to −0.5~1.0 with an interval of 0.25. When the network of left and right helix deviation was output in the form of network images as shown in Figure 9 and Figure 10, a network pattern with a hexagon shape and six spots of concentrated link spots were formed within the correlation coefficient range of 0.75 r j , k 1.0 . Moreover, these concentrated link spots occurred at the same span. The center of each concentrated link region is approximately eight teeth number next to each other, which correlates with the result in the pixel plot where the center of each high correlation coefficient region is approximately eight teeth number next to the center of the high correlation coefficient region next to it.
When the network images with a coefficient range of 0.75 r j , k 1.0 were plotted on the illustration of gear used in this study, it became apparent that the injection molding gate has a significant impact on the result of our studies. In plastic injection molding, the gate is the point where molten plastic is injected into the mold during the process. The gate’s position plays a pivotal role in the mold design and directly impacts the quality of the molded product. The position of the gate determines the flow of plastic into the mold cavity, and a poorly positioned gate can cause common defects such as shrinkage and weld lines. However, by adjusting the gate position, it is possible to control these defects and enhance the final product’s quality significantly [16,17]. Therefore, identifying the optimal gate position is crucial for attaining optimal injection molding outcomes.
In the case of injection-molded gear used in this study, there are six gate marks on the surface of the gear. The injection molding gate mark of the gear used in this study is shown in Figure 13a, and Figure 13b shows the gate mark observed with an electronic microscope. These gate marks are located at the position of tooth numbers 7th, 15th, 23rd, 31st, 39th, and 47th, where the location of each gate mark is eight teeth apart from each other. The concentrated link spots are formed at the region between the gate mark and the weld line. The gate marks are marked with a grey circular ring on the gear illustration and the weld lines are marked with dotted lines in Figure 14. In the case of left helix deviation shown in Figure 14a, the concentrated link spots, highlighted by the large blue circles, were formed on the left side of the gate mark, whereas in the case of right helix deviation shown in Figure 14b, the concentrated link spots were formed on the right side of the gate mark.
In the plastic injection molding process, fountain flow occurs when the material at the flow front is pushed forward and channeled out of the injection molding gate. During the mold filling process, the material is injected into an empty melt flow channel fountains to the channel walls. The fountain flow creates similar left helix deviations at the left side of the gate mark to the weld line to its left, and similar right helix deviations at the right side of the gate mark to the weld line to its right. Since the temperature of the molten material decreases as it moves through the mold, the temperature of each tooth during injection molding changes depending on its position from the gate. This temperature distribution causes differences in material shrinkage behavior during the cooling process, which is thought to influence the shape of the tooth flank. However, the effect of changes in manufacturing conditions during injection molding on the tooth flank was not investigated in this study. Future investigation is necessary to evaluate the effect of temperature distribution in the material during injection molding.
With that being said, from the analysis results obtained from Section 3.3 and Section 3.4, the occurrence of uniform and periodic patterns with six high correlation coefficient regions and six low correlation coefficient regions in the pixel plot, and the formation of a network that exhibits a hexagon shape with six concentrated link spots were deeply influenced by the position of the injection molding gate as shown in Figure 14.

5. Conclusions

In this study, an analytical methodology has been adopted to assess the relationship between the helix deviations of each tooth in plastic gears manufactured via injection molding [14,15]. The correlation coefficient is computed from the helix deviation curves of one tooth and all the teeth after the elimination of the DC and slope component as a preprocessing measure, and the network was visualized by generating a pixel plot to study the relationship between each gear teeth. Network images were then generated to further dissect the relationship between each gear tooth across varying correlation coefficient ranges. In summary of the analysis result and discussion, the accomplishments of this study are presented as follows:
  • The relative relationship between each gear tooth can be understood with the application of visualization of network methods such as pixel plot and network image as proposed in this paper.
  • The helix deviation network of an injection-molded plastic gear is deeply influenced by the position of the injection molding gate of the mold.
The result of this study is vital to acknowledge the influence of the position of the injection molding gate on the tooth helix deviation network of injection-molded gear. he visualization of the helix deviation network of injection-molded plastic gear serves as feedback to its manufacturing process, and appropriate adjustment of injection molding environment and condition can be made with judgment on the topology of the helix deviation network, which can further improve the accuracy of injection-molded gear. The obtained result is useful in the development of a new indicator for the manufacturing error evaluation method of injection-molded plastic gear, and thus enhances the accuracy of the tooth flank of an injection-molded plastic gear.

Author Contributions

Conceptualization, D.I., D.Y., J.C.L. and Y.S.; methodology, D.I., D.Y., J.C.L. and Y.S.; software, D.I., D.Y., J.C.L. and Y.S.; validation, D.I. and J.C.L.; formal analysis, J.C.L. and D.I.; investigation, J.C.L. and D.I.; resources, D.I.; data curation, J.C.L., D.Y. and Y.S.; writing—original draft preparation, J.C.L. and D.I.; writing—review and editing, J.C.L. and D.I.; visualization, J.C.L. and D.I.; supervision, D.I.; project administration, D.I.; funding acquisition, D.I. All authors have read and agreed to the published version of the manuscript.

Funding

This research was funded by the Japanese Ministry of Education, Culture, Sports, Science and Technology, Grant-in-Aid for Scientific Research (C), 21K03835.

Institutional Review Board Statement

Not applicable.

Informed Consent Statement

Not applicable.

Data Availability Statement

The data presented in this study are available on request from the corresponding author.

Acknowledgments

The authors gratefully acknowledge the support from the Japanese Ministry of Education, Culture, Sports, Science and Technology, Grant-in-Aid for Scientific Research (C), 21K03835.

Conflicts of Interest

The authors declare no conflicts of interest.

References

  1. Park, C.I. Noise characteristics and acoustic design sensitivity of the helical gear system in wind turbine load. J. Mech. Sci. Technol. 2022, 36, 5915–5924. [Google Scholar] [CrossRef]
  2. Lee, J.Y.; Chang, J.H. Vibration and noise characteristics of coaxial magnetic gear according to low-speed rotor structure. J. Mech. Sci. Technol. 2017, 31, 2723–2728. [Google Scholar] [CrossRef]
  3. Park, C.I. Characteristics of noise generated by axial excitation of helical gears in shaft-bearing-plate system. J. Mech. Sci. Technol. 2015, 29, 1571–1579. [Google Scholar] [CrossRef]
  4. Mohamad, E.N.; Komori, M.; Matsumura, S.; Ratanasumawong, C.; Yamashita, M.; Nomura, T.; Houjoh, H.; Kubo, A. Effect of variations in tooth flank form among teeth on gear vibration and an sensory evaluation method using potential gear noise. J. Adv. Mech. Des. Syst. Manuf. 2010, 4, 1166–1181. [Google Scholar] [CrossRef]
  5. Ogawa, Y.; Matsumura, S.; Houjoh, H.; Sato, T.; Umezawa, K. Rotational Vibration of a spur gear pair considering tooth helix deviation (Development of simulator and verification). JSME Int. J. Ser. C Mech. Syst. Mach. Elem. Manuf. 2000, 43, 423–431. [Google Scholar] [CrossRef]
  6. Ryo, E.; Tadami, K.; Kazutaka, S. Mechanism of Occurrence of Ghost Noise in Helical Gears Resulting from Thread-Type Tool Grinding(Machine Elements, Design and Manufacturing). Trans. Jpn. Soc. Mech. Eng. Ser. C 2009, 75, 2575–2580. [Google Scholar]
  7. Shigeki, M.; Haruo, H. Vibration diagnosis method of multistage gearing to point out ghost noise source with amplitude fluctuation analysis. Trans. JSME 2015, 81, 15-00004. (In Japanese) [Google Scholar]
  8. Myungsoo, K.; Daisuke, I.; Tomohiro, T.; Junichi, H.; Morimasa, N.; Ichiro, M. New measuring method for single pitch deviation of hobbed gears (Using measured helix form data conditioned with Gaussian filter). Trans. JSME 2016, 82, 16-00128. (In Japanese) [Google Scholar]
  9. ISO 1328-1:2013; Cylindrical Gears—ISO System of Flank Tolerance Classification—Part 1: Definitions and Allowable Values of Deviations Relevant to Flanks of Gear Teeth. ISO: Geneva, Switzerland, 2013; pp. 1–50.
  10. JIS B 1702-1; Cylindrical Gear-Accuracy Class—Part 1: Definition and Tolerance of Errors on Gear Tooth Flanks. Japanese Industrial Standard: Tokyo, Japan, 2016; pp. 1–20.
  11. Barabási, A.-L. Network Science. Chapter 2. Available online: http://networksciencebook.com (accessed on 6 April 2023).
  12. Ionnis, P.; Qin, Z. Optimization of injection molding design. Part I: Gate location optimization. Polym. Eng. Sci. 1990, 30, 873–882. [Google Scholar]
  13. Kawasaki, R.K.; Ikeda, Y. Network analysis of attitudes towards immigrants in Asia. Appl. Netw. Sci. 2020, 5, 85. [Google Scholar] [CrossRef]
  14. Iba, D.; Noda, H.; Inoue, H.; Kim, M.; Moriwaki, I. Visualization of phase differences between tooth helix deviations using graph theory. Forsch. Ingenieurwesen 2019, 83, 529–535. [Google Scholar] [CrossRef]
  15. Iba, D.; Inoue, H.; Noda, H.; Kim, M.; Moriwaki, I. Networks of tooth helix deviations of ground and super-finished gears—Phase edges and intensity vertices. J. Mech. Sci. Technol. 2019, 33, 5689–5697. [Google Scholar] [CrossRef]
  16. Senthilvelan, S.; Gnanamoorthy, R. Fiber Reinforcement in Injection Molded Nylon 6/6 Spur Gears. Appl. Compos. Mater. 2006, 13, 237–248. [Google Scholar] [CrossRef]
  17. Solanki, B.S.; Singh, H.; Sheorey, T. Study on Gate Location and Gate Number for Manufacturability of Polymer Gears. In Recent Advances in Mechanical Engineering; Springer: Singapore, 2021; pp. 71–81. [Google Scholar]
Figure 1. (a). Injection-molded plastic gear used in this study. (b). Measurement of gear used in this study.
Applsci 14 02013 g001aApplsci 14 02013 g001b
Figure 2. Injection-molded plastic gear undergoing inspection process.
Applsci 14 02013 g002
Figure 3. Helix deviation of tooth number 1st: helix deviation plotted with all data points is indicated by the color black, and the helix deviation after 20% of data points at both ends is eliminated is indicated by the color red.
Applsci 14 02013 g003
Figure 4. Helix deviation curves derived from helix deviation data obtained from the gear inspection process: (a) Left helix deviation where the helix deviation curves of tooth number 1st~48th are shown accordingly in the graph from top to bottom; (b) Right helix deviation where the helix deviation curves of tooth number 1st~48th are shown accordingly in the graph from top to bottom.
Applsci 14 02013 g004
Figure 5. Helix deviation curves after elimination of DC and slope component: (a) Left helix deviation where the helix deviation curves of tooth number 1st~48th are shown accordingly in the graph from top to bottom; (b) Right helix deviation where the helix deviation curves of tooth number 1st~48th are shown accordingly in the graph from top to bottom.
Applsci 14 02013 g005
Figure 6. (a) Adjacency matrix of tooth number 1st~8th of left helix deviation; (b) Pixel plot corresponding to adjacency matrix of tooth number 1st~8th of left helix deviation.
Applsci 14 02013 g006
Figure 7. Left helix deviation pairs with the greatest and lowest correlation coefficient: (a) Left helix deviation pair with highest correlation coefficient, tooth number 20th and 45th; (b) Left helix deviation pair with lowest correlation coefficient, tooth number 9th and 27th.
Applsci 14 02013 g007
Figure 8. Pixel plot: (a) Pixel plot of left helix deviation exhibits a grid-like pattern; (b) Pixel plot of right helix deviation exhibits a houndstooth pattern.
Applsci 14 02013 g008
Figure 9. Network images of left helix deviation.
Applsci 14 02013 g009
Figure 10. Network images of right helix deviation.
Applsci 14 02013 g010
Figure 11. Comparison of left helix deviation curves of high and low correlation coefficient regions in the pixel plot: (a) Left helix deviation curves of tooth number 3rd~6th; (b) Left helix deviation curves of tooth number 7th~10th.
Applsci 14 02013 g011
Figure 12. Comparison of right helix deviation curves of high and low correlation coefficient regions in the pixel plot: (a) Right helix deviation curves of tooth number 1st~3rd; (b) Right helix deviation curves of tooth number 4th~7th.
Applsci 14 02013 g012
Figure 13. Gate mark of injection-molded plastic gear used in this study: (a) Gate mark of gear; (b) Gate mark observed with electronic microscope.
Applsci 14 02013 g013
Figure 14. Network images of correlation coefficient range of 0.75 r j , k 1.0 plotted on gear illustration where the six grey circular rings represent gate marks, the six dotted lines represent weld lines, the two white circles represent pin holes: (a) Left helix deviation; (b) Right helix deviation.
Applsci 14 02013 g014
Table 1. Gear specification.
ParameterValue (Target Gear)
Module (mm)1.0
Number of Teeth (−)48
Helix Angle (deg.)0
Pressure Angle (deg.)20
Profile Shift Coefficient (−)0
Face width (mm)8.0
Tip Diameter (mm)50.0
Root Diameter (mm)45.5
MaterialPolyoxymethylene (POM)
Table 2. Specification of Gear Measuring Machine.
ParameterValue (Gear Measuring Machine)
Normal Module (mm)0.5~12
Number of Teeth (−)10~500
Gear Outer Diameter (mm)Max φ350
Basic Circle Diameter (mm)0~φ300
Tooth Width (mm)Max 400
Tangent Length for Profile Measurement (mm)±120
Helix Angle (deg.)0~±60
Gear Shaft Length (mm)50~400
Gear Weight (kg)Max 50
Resolution (V)0.0001
Power Supply (V)AC 100
Capacitance (KVA)2
Machine Weight (kg)1500
Dimension (W × D × H) (mm)1133 × 1071 × 1995
Disclaimer/Publisher’s Note: The statements, opinions and data contained in all publications are solely those of the individual author(s) and contributor(s) and not of MDPI and/or the editor(s). MDPI and/or the editor(s) disclaim responsibility for any injury to people or property resulting from any ideas, methods, instructions or products referred to in the content.

