Article

Research on the Application of THz-TDS in Coal–Rock Interface Recognition

1
School of Coal Engineering, Shanxi Datong University, Datong 037009, China
2
School of Physical Science and Electronics, Shanxi Datong University, Datong 037009, China
3
Beijing Key Laboratory of Millimeter Wave and Terahertz Technology, Beijing Institute of Technology, Beijing 100081, China
*
Authors to whom correspondence should be addressed.
Appl. Sci. 2024, 14(4), 1431; https://doi.org/10.3390/app14041431
Submission received: 16 January 2024 / Revised: 3 February 2024 / Accepted: 6 February 2024 / Published: 9 February 2024
(This article belongs to the Special Issue Progress in Nondestructive Testing and Evaluation (NDT&E))

Abstract

:

Featured Application

The research results can provide timely, accurate and non-destructive detection of the coal–rock interface in the intelligent production of coal mines.

Abstract

The recognition of coal–rock interface is very crucial for research in the intelligent production of coal mines. To this end, the study investigated the application of terahertz time-domain spectroscopy in the recognition of coal–rock interface, including the identification of coal–rock and coal–rock mixtures, as well as the accurate characterization of coal seam thickness. Terahertz detection was used to obtain the optical parameter information of pressed pellets prepared by mixing two different kinds of coal and two kinds of rock. Based on the experiment’s results, a database was established for the identification of coal–rock interfaces for coal mining machines. The terahertz detection was performed on 10 different kinds of sheet anthracite with different thicknesses, and the terahertz spectra of coal seams with different thicknesses were simulated and calculated using simulation software. By comparing the two effective mining thicknesses, parameters can be provided for coal seam mining. The experiment and simulation show that the terahertz time-domain spectroscopy technology has a promising application prospect in the identification of coal–rock interface.

1. Introduction

Coal, used to supply a large proportion of energy consumption, is expected to remain irreplaceable for a long time [1]. With advancements in coal mining technology, the depth of coal mines continues to increase. However, the common occurrence of rock bursts, fire, water inrush and other disasters casts a great dark cloud over this field; thus, it is essential to provide necessary warnings, in the face of the increasingly complex coal mining environment, to prevent loss of life and property [2]. Intelligent mining, that is, unmanned mining, is the ultimate goal of coal mine safety production, and research on coal–rock identification is a crucial step in achieving this goal [3,4,5]. Moreover, intelligent identification of coal–rock interface can maximize the efficient utilization of coal resources, replacing the existing manual identification, which not only reduces the safety risk for frontline coal miners but also avoids the waste of coal resources. It is noted that automatic height adjustment of the coal cutter drum is a key aspect of coal–rock interface identification technology. In recent years, considerable research efforts have been made in the field of coal–rock interface recognition technology, such as image detection, cutting force detection, intelligent sensing technology, ground-penetrating radar (GPR) detection, and infrared detection [6]. In 2019, Miao Shuguang et al. [7] used the finite-difference time-domain method to build models of different coal–rock combinations and conduct numerical simulations to obtain radar detection signals, demonstrating the applicability of radar detection technology in coal–rock interface recognition. In 2020, Liu Zaibin et al. [8] used a dynamic visualization modeling method to characterize the complex structure of coal seams to address the problem of stepwise transparency in coal seams. In 2021, Zhang Ronghua [9] conducted a comparative study of LSM and RELB-based coal–rock identification methods, explaining their applicability in the field of coal and rock identification. Ju Liana et al. [10] classified coal by analyzing coal color and frequency histograms to obtain reflectance distributions. Nazarova et al. [11] assessed the stress state of coal and rock mass in the coal cutting area and reconstructed a three-dimensional stress field of coal and rock mass through coal layer tomography and evaluation of the horizontal component of the external stress field. Shan et al. [12] proposed a numerical method for simulating the coupled fluid–solid process during the failure of fractured coal–rock bodies by considering the characteristics of regional stress in the steep coal seam, providing a reliable theoretical basis for optimizing roof weakening in steep coal seam mining.
Terahertz (THz) waves, with a frequency range from 0.1 THz to 10 THz, fall between microwaves and infrared waves in the electromagnetic spectrum. Due to their high resolution, non-contact and non-destructive properties, THz waves have been applied in diverse fields such as medical testing, space communication, and non-destructive testing [13,14]. In recent years, THz time-domain spectroscopy has been applied to the study of coal–rock interfaces. Researchers such as Takenori Tanno et al. [15] from Tohoku University and Akita University in Japan measured the transmission spectra of dry and non-dry coal powder and polyethylene mixed with laminated samples in the range of 1~5 THz to estimate the water content in coal. Bao [16] conducted an analysis of THz wave transmission properties in reservoir layers, revealing the transmission characteristics of THz waves in rocks, which is helpful to improve the efficiency of THz time-domain spectroscopy and enrich oil field exploration methods. In the realm of coal–rock identification, Wang Xin et al. [17] from China University of Mining and Technology extracted various THz signal parameters from different kinds of coal and rocks, and proposed a classification method based on the absorption characteristics and refractive indices of different coal and rock materials, demonstrating the potential applications of THz technology in coal and rock identification. Subsequently, Yu Jing et al. [18] used the least squares support vector machine algorithm to analyze and study the THz parameters of the coal–rock mixtures with varying proportions. From previous research on THz applications in coal–rock identification, it is evident that THz time-domain spectroscopy technology can be applied not only to coal–rock identification but also to more complex situations.
In this study, THz-TDS technology (THz time-domain spectroscopy) is applied to the identification of coal, rock and coal–rock mixtures for the detection of coal seam thickness. The measurement results of different samples prepared from two kinds of coal (anthracite, lignite) and two kinds of rock (limestone, quartz sandstone), and the extracted optical parameters were used to establish a high-resolution optical database for identification of multiple kinds of coal and rock mixtures. Additionally, by preparing and analyzing a wider variety of coal–rock mixtures, various interface scenarios and an optical database for multiple coal–rock mixtures can be established to provide data support for intelligent identification of multiple coal–rock interfaces by coal mining machines. Based on this, coal seam thickness detection technology based on THz-TDS was successfully proposed. Through analyzing the THz spectrum detection of 10 anthracite flakes with different thicknesses and simulating the experimental process using CST 2021 software, the relationship between the time-domain signal and thickness variation of different coal flakes can be established, thereby verifying the effectiveness and feasibility of this method, which has broader applications in the field of coal–rock interface identification.

2. Experimental Detection

2.1. Experimental Instruments

The experimental setup used in this study was the THz time-domain spectrometer. The device was purchased from BATOP GmbH. The model was THz-TDS 1008. The experimental instrument is shown in the Supplementary Materials. The working principle of the THz time-domain spectrometer involves the generation of laser pulses by the external laser source. These laser pulses are then divided into two parts (the pump pulse and the probe pulse) by the beam-splitting mirror. The pumped pulse enters the THz emitter to produce THz pulses. These THz pulses propagate free space for a certain distance and then contact the THz detector together with the detection pulses to drive the THz detection device for measurement. By controlling the time delay system to adjust the time delay between the pump pulse and the probe pulse, the complete time-domain waveform of the THz pulse can be detected. Through Fourier transform, the frequency domain spectrum of the measured sample can be obtained, which can provide essential optical parameters including absorption coefficient and refractive index, among others [19,20,21]. It is worth noting that the laser source used in this setup has a central wavelength of 800 nm and a pulse duration of 100 fs. In order to ensure experimental conditions are close to the actual environment and avoid potential effects on the measurement results, the experiments were carried out at room temperature (23 °C). In addition, to obtain valid experiment results, the moisture value of the experiment environment was set under 5% relative humidity because water can be extremely absorbent to the THz radiation. (No dry air or nitrogen was in the system).

2.2. Sample Preparation

In this study, two kinds of coal (anthracite and lignite) and two kinds of rock (quartz sandstone and limestone) were collected from Datong Coal Mine in Shanxi Province. The sample preparation was undertaken using two methods: the first was the preparation of coal and rock powder mixed laminate, while the second part was the preparation of coal flakes (anthracite) with different thickness. The test sample is shown in the Supplementary Materials. In the first part, coal and rock were individually pressed into certain size pellets. Then, in order to simulate different coal–rock mixtures, four combinations were made (quartz sandstone–anthracite, limestone–anthracite, quartz sandstone–lignite, limestone–lignite), and each combination was mixed in four different proportions.
Before preparation, we used an agate mortar to grind the coal and rock into powder with a particle size of less than 74 μm, that is, the ground powder must pass through a 200-mesh steel screen. Since THz waves are sensitive to water vapor, in order to make the test results accurate and reliable, the ground and screened powder was dried in a dryer to remove excess water in the sample. During the experiments, coal powder was mixed with rock powder in proportion after grinding. Different proportions refers to the ratio of coal to coal–rock mixed powders. Since the diameter of the tablet press is 5 mm, each sample has the same diameter but different thickness. The thickness of different samples was measured using a digital caliper. The specific information for the samples is shown in Table 1 and Table 2. The total mass of each sample was 0.2 g. The signal of THz waves through the air was used as the reference. In this study, we used THz time-domain spectroscopy to detect and identify coal and coal mixture powders. In a typical shearer coal-cutting operation scenario, there can be a large amount of dust and powder nearby the cut solid material and the drum. Therefore, studying the powder of coal, rock and coal–rock mixture is more in line with the situation of mining operation site than without such consideration.
The second part is the preparation of flake anthracite samples with different thicknesses to simulate coal seam thickness detection using THz waves, which is more suitable to coal–rock identification scenarios in actual coal mines. First, the original anthracite was cut into various thickness samples using a cutting machine. Then, the surfaces of these plate-like samples were polished using sandpaper to make them relatively smooth and reduce scattering of THz waves on the surface of the sample, minimizing their impact on the test results. The thickness of different samples was measured using a digital caliper. The thickness of each sample was measured three times and the average value was taken. The information for 10 flaky samples is shown in Table 3. THz waves passing through an empty sample stage, representing air, was used as a reference in the time-domain spectroscopy.

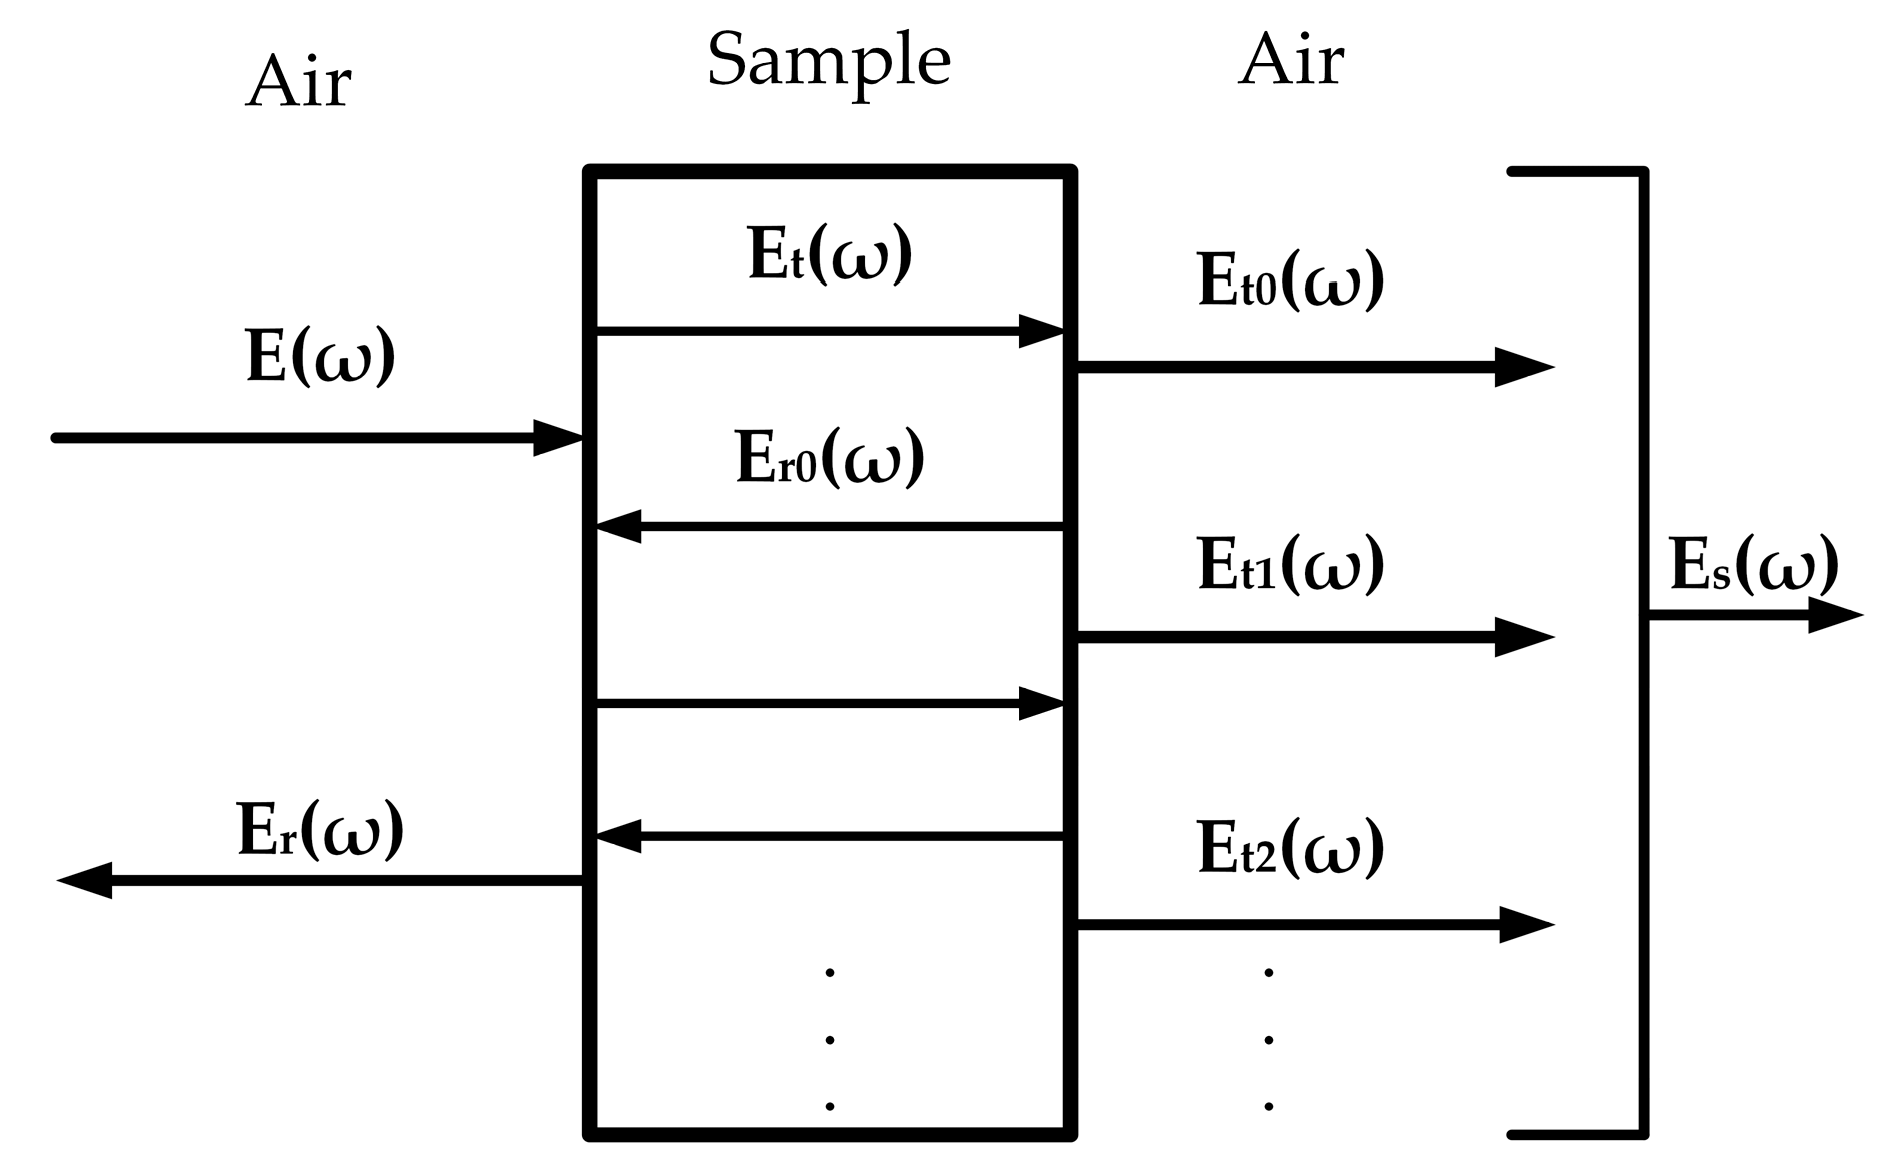
2.3. Methods for Calculation of Optical Parameters

As shown in Figure 1, when THz wave E(ω) is irradiated onto the sample from air, it can be seen from Fresnel’s law [22,23,24] that reflected wave Er(ω) and transmitted wave Et(ω) will be generated on the surface of the sample, and transmitted wave Et(ω) can have the same phenomenon on another surface of the sample, resulting in transmitted wave Et0(ω) and reflected wave Er0(ω). The reflected wave Er0(ω) is reflected several times inside the sample, resulting in a series of transmitted waves such as Et1(ω) and Et2(ω), which are known as echoes. All the transmitted waves superimposed together are received as THz time-domain signals containing sample information. In this experiment, THz waves are vertically incident on the surface of the sample. According to Duvillare, Dorney et al., who reported the physical and mathematical model of optical parameters in the THz band [25,26,27], when the sample thickness d is thick enough, echo signals such as Et1(ω) and Et2(ω) in the time-domain spectrum are far away from transmitted wave Et0(ω), so separation can be realized. In this experiment, the main peak signal and the echo signal can be separated. Therefore, the Et0(ω) can be used to approximately represent the sum of the THz signals that penetrate the sample Es(ω). Two preconditions should be noted for using this model: (1) The sample compression structure in the experiment is uniform, the front and back surfaces of sample are smooth, and the samples remain parallel. (2) The response function of THz-TDS cannot change with time. In this study, the powder was thoroughly mixed to produce a smooth and parallel surface tablet. The refractive index of air is approximately set to 1. According to Fresnel’s law:
T 1 ( ω ) = 2 n ~ ω + 1
  T 2 ( ω ) = 2 n ~ ( ω ) n ~ ω + 1
R 2 ( ω ) = n ~ ω 1 n ~ ω + 1
P ( ω , d ) = exp [ i n ~ ( ω ) ω d c ]
where n ~ ( ω ) : sample complex refractive index; ω: angular frequency; d: sample thickness; T1(ω): THz wave transmission coefficient into the sample; T2(ω), R2(ω): THz wave transmission coefficient from the sample to the air, reflection coefficient; P(ω, d): THz wave propagation coefficient in the sample.
n ~ ( ω ) can be obtained by n(ω), κ(ω):
n ~ ( ω ) = n ω i κ ω
The time-domain signal is obtained by THz detection. The reference signal passing through the pure polyethylene sample is denoted as Eref(ω), and the sample signal is denoted as Et0(ω). Fourier changes are performed on Eref(ω) and Et0(ω) to obtain their frequency domain spectra Eref(ω) and Et0(ω), according to Fresnel’s law:
Et0(ω) = E(ωT1(ωPsample(ω,dT2(ω)
Eref(ω) = E(ωPref(ω,dAir)
where Psample(ω,d): THz wave propagation coefficient in coal/rock/coal–rock mixture sample; Pref(ω,dAir): THz wave propagation coefficient in air; dAir is the distance between the THz generator and the detector. Et0(ω) approximates Es(ω):
Es(ω) = E(ωT1(ωPsample(ω,dT2(ω)
E s ( ω ) E ref ( ω ) = 4 n ~ ( ω ) ( 1 + n ~ ( ω ) ) 2 · exp [ i ( n ~ ( ω ) 1 ) ω d c ]
α ω can be represented by κ(ω):
α ω = 2 ω κ ω c
where c represents the speed of light, κ(ω) << n(ω). Simplify (9) to obtain:
E s ( ω ) E ref ( ω ) = ρ ω exp [ i φ ω ]
where φ ω : the phase difference between the sample signal and the reference signal; ρ ω : the amplitude ratio of the sample signal to the reference signal.
Then, optical parameters such as refractive index n(ω), absorption coefficient α(ω), and extinction coefficient k(ω) were obtained by using the optical parameter extraction model [25,26,27]. The formulas for these calculations are as follows:
n ω = φ ω c ω d + 1
α ω = 2 d ln 4 n ω ρ ω n ω + 1 2
k ( ω ) = c α ω 2 ω
where ω : frequency; Φ ( ω ) : phase difference between the sample signal and the reference signal; ρ (ω) is the amplitude ratio between the sample signal and the reference signal; d: sample thickness; c: the speed of light.

3. Results and Discussion

3.1. THz Spectral Properties of Coal–Rock and Coal–Rock Mixtures

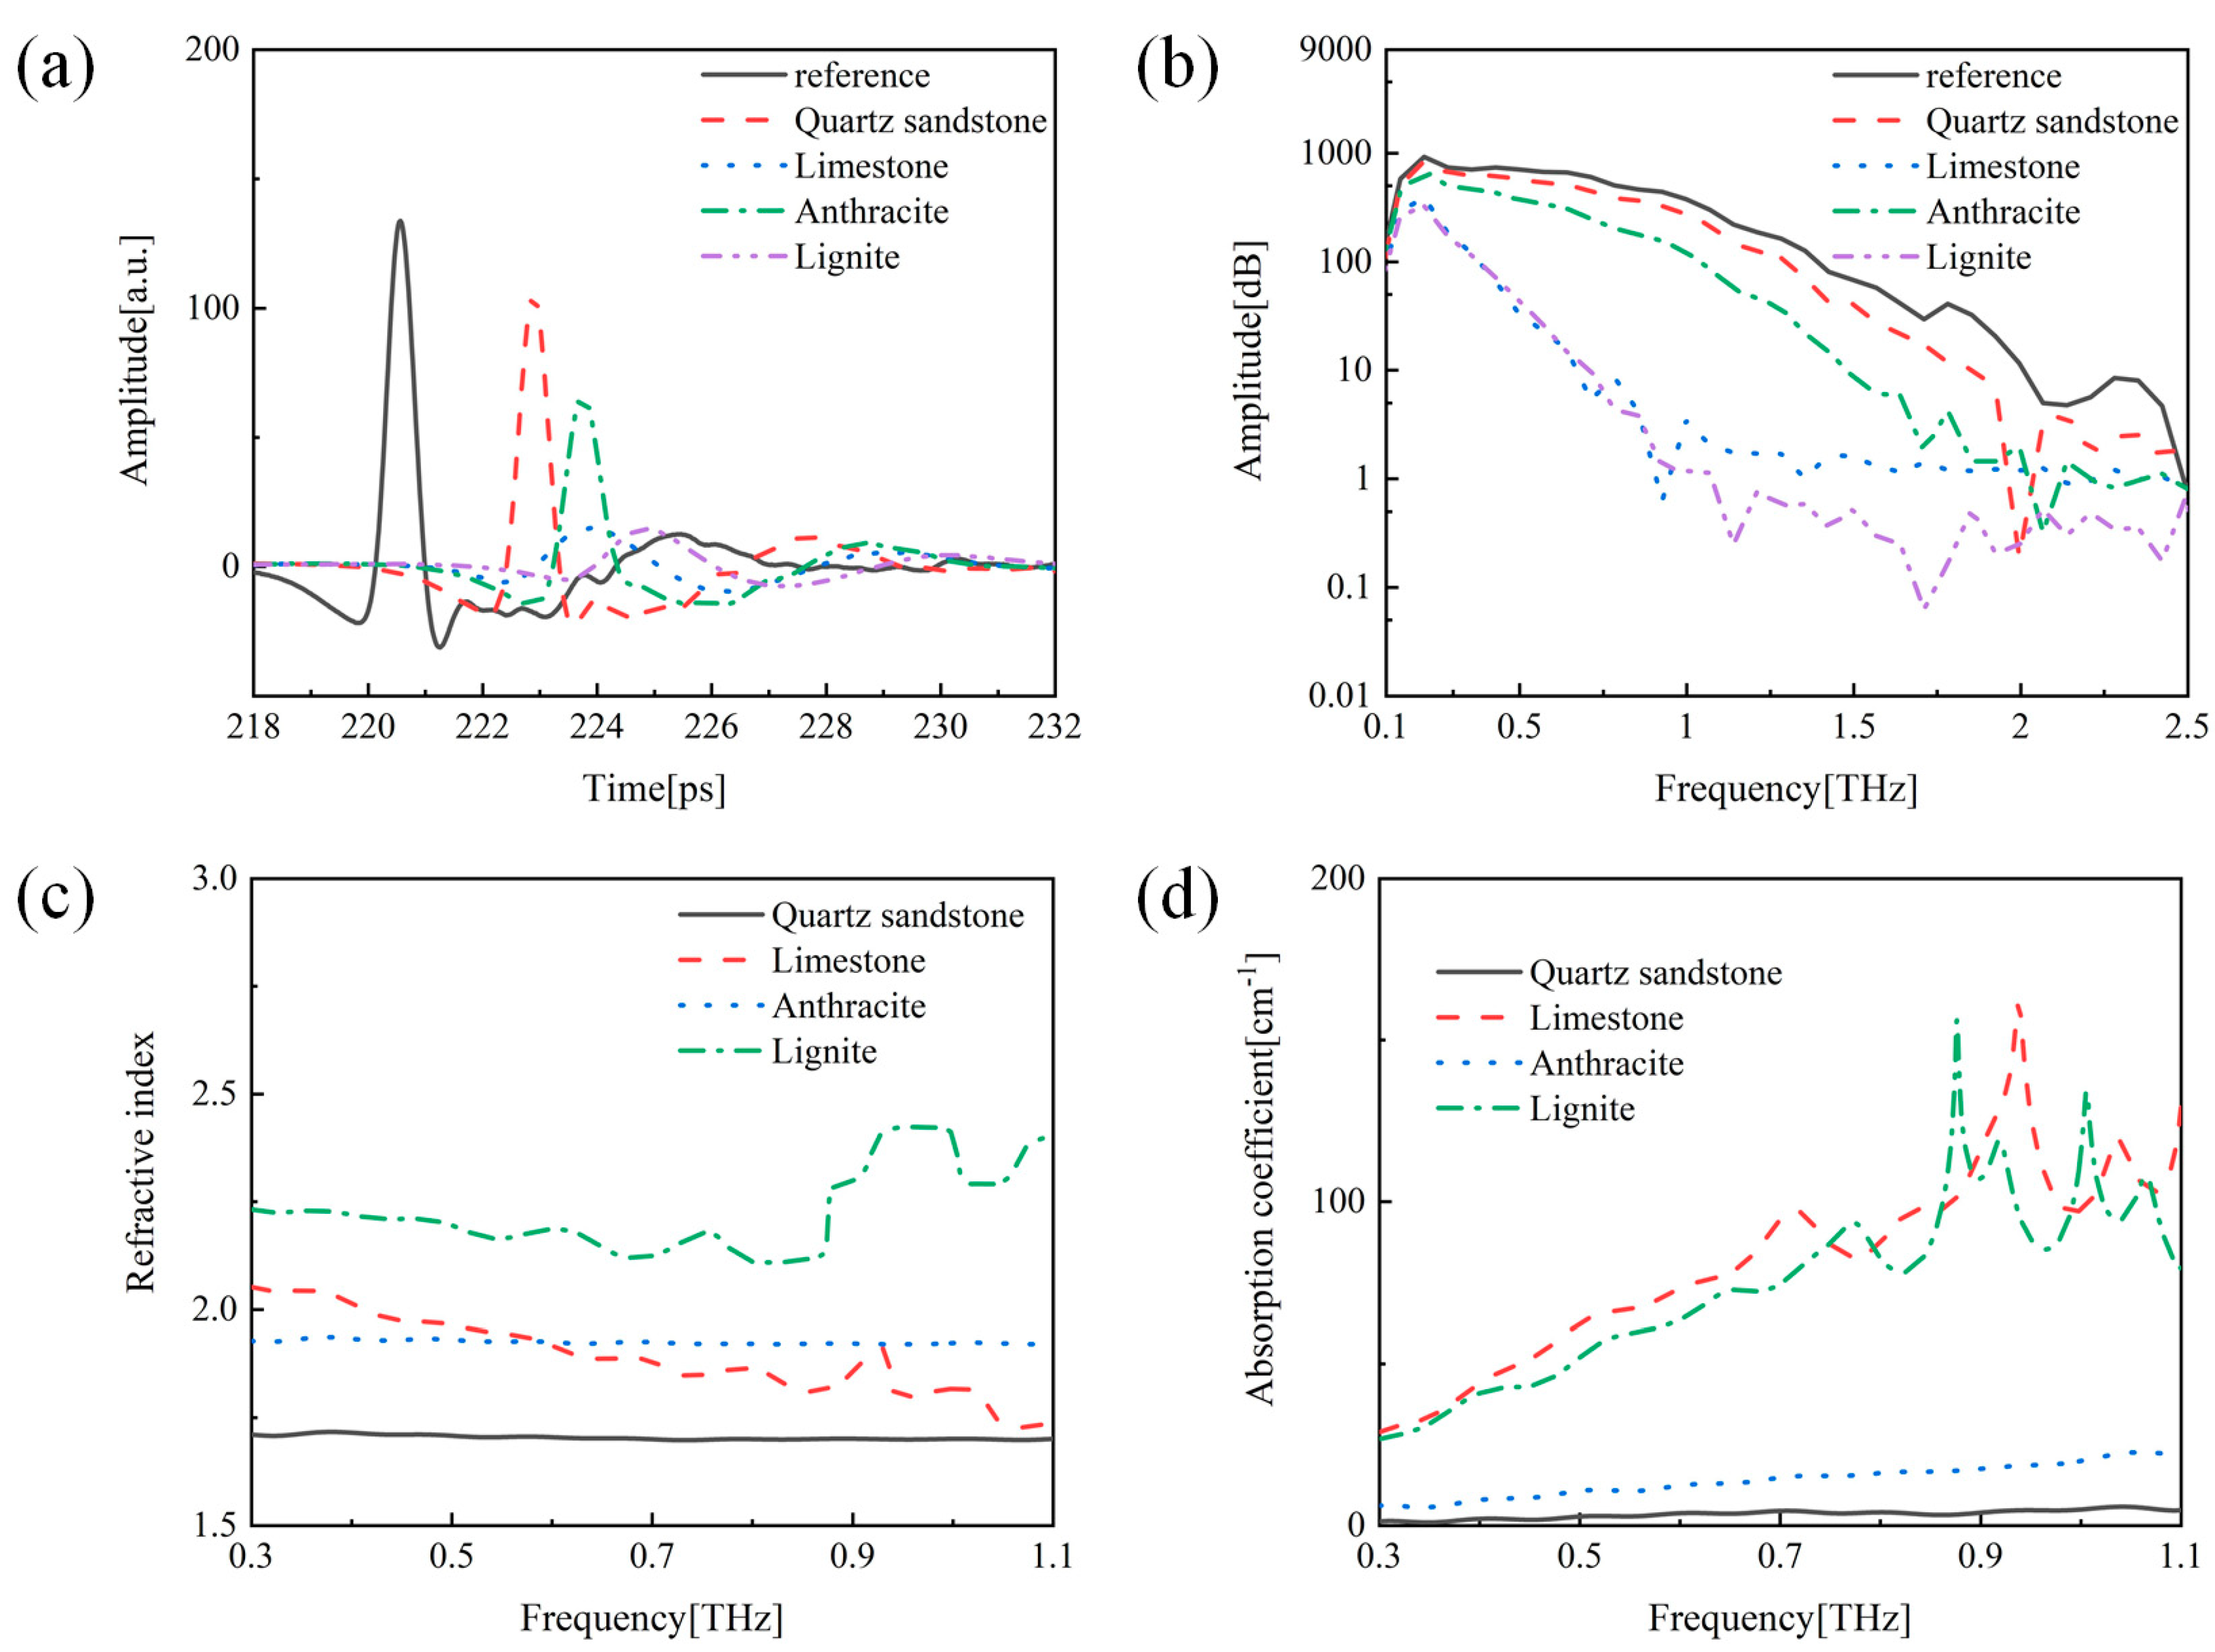
3.1.1. THz Spectral Properties of Coal and Rock

Before starting the sample test, it is necessary to wait for the femtosecond laser to stabilize and recalibrate in advance to ensure the safe stability of the measurement. First, the reference THz signal is obtained without placing the sample on the sample table. Then, different coal and rock samples are tested separately. The THz spectral scan range was 218–232 ps with a step size of 0.02 ps to obtain the time-domain spectrum of the sample as shown in Figure 2a. THz-TDS is a coherent detection technology that can simultaneously obtain information of the THz pulse amplitude and phase. As such, it relies on the THz wave reflection to detect changes in the THz time-domain pulse wave in the sample before and after irradiation, called the reference and sample waveforms, respectively. It can be observed that the THz amplitudes of coal–rock samples decrease to varying degrees compared with the reference signal due to surface reflection and absorption. Because the four samples have different refractive index, the wave speed and light path of the THz pulse passing through the sample are different, leading to differences in the time delay and the appearance of the signal at different times [28]. It is pointed out that the waveforms starting at 218 ps are not offset or intrinsic results from our method, which is determined by the motorized stages, phase-lock amplifier and detection antenna of THz-TDS. The reason is that the peaks occur in THz band, and only through this band are we able to see a full and useful time-domain waveform.
Fast Fourier transform (FFT) was used to convert the time-domain signals of coal and rock into the frequency domain to obtain the frequency domain spectrum, as shown in Figure 2b. It can be found that the amplitude of temporal waveform for samples has some oscillation and attenuation relative to the reference waveform. This may be due to the sample’s reflection, dispersion and absorption. In addition, it should be pointed out that the echoes were cut off in the THz time-domain spectra before the THz frequency domain spectra was obtained by Fourier transform, which can effectively avoid the Fabry–Perot effect. THz frequency domain spectra reveal significant differences between the sample’s signal and reference signal, which is caused by the different propagating velocity in the sample relative to the reference path, which gives rise to the different time delay. Meanwhile, the reduced THz pulse intensity results from the sample’s reflectivity and absorption, as well as the THz pulse which broaden with sample dispersion. In general, there is a critical value for the sample’s absorption of high-frequency signals greater than that of low-frequency signals. Below the critical value, the signal strength of the sample is greater than the noise signal, and the spectral information of the sample can be truly reflected. Once the value is greater than the critical value, because the signal strength of the strongly absorbed sample is less than the noise signal, the sample information is submerged in the noise, and the sample information cannot be truly reflected. Therefore, we intercepted the effective frequency range according to the critical value. It can be seen from Figure 2b that the effective frequency range is 0.3~1.1 THz. Accordingly, the frequency band of 0.3~1.1 THz was selected to analyze the absorption coefficient and refractive index of the sample. Then, we analyzed the optical signal of the coal mixture sample within the 0.3~1.11 THz frequency band.
Therefore, the refractive index and absorption coefficient of coal and rock samples can be calculated using Formulas (12) and (13). From Figure 2c, the refractive index of coal and rock samples is relatively stable. Figure 2d illustrates the absorption coefficient of coal and rock samples, showing that the absorption coefficient of each coal and rock sample increases steadily with the increase of frequency. The absorption spectrum of each sample exhibits slight fluctuations due to internal absorption or surface scattering of the sample. The differences in optical parameters, such as refractive index and attenuation coefficient between coal and rock, allow for the accurate identification of coal and rock in the THz band, which also demonstrates that THz time-domain spectroscopy technology can be well applied to coal and rock identification.

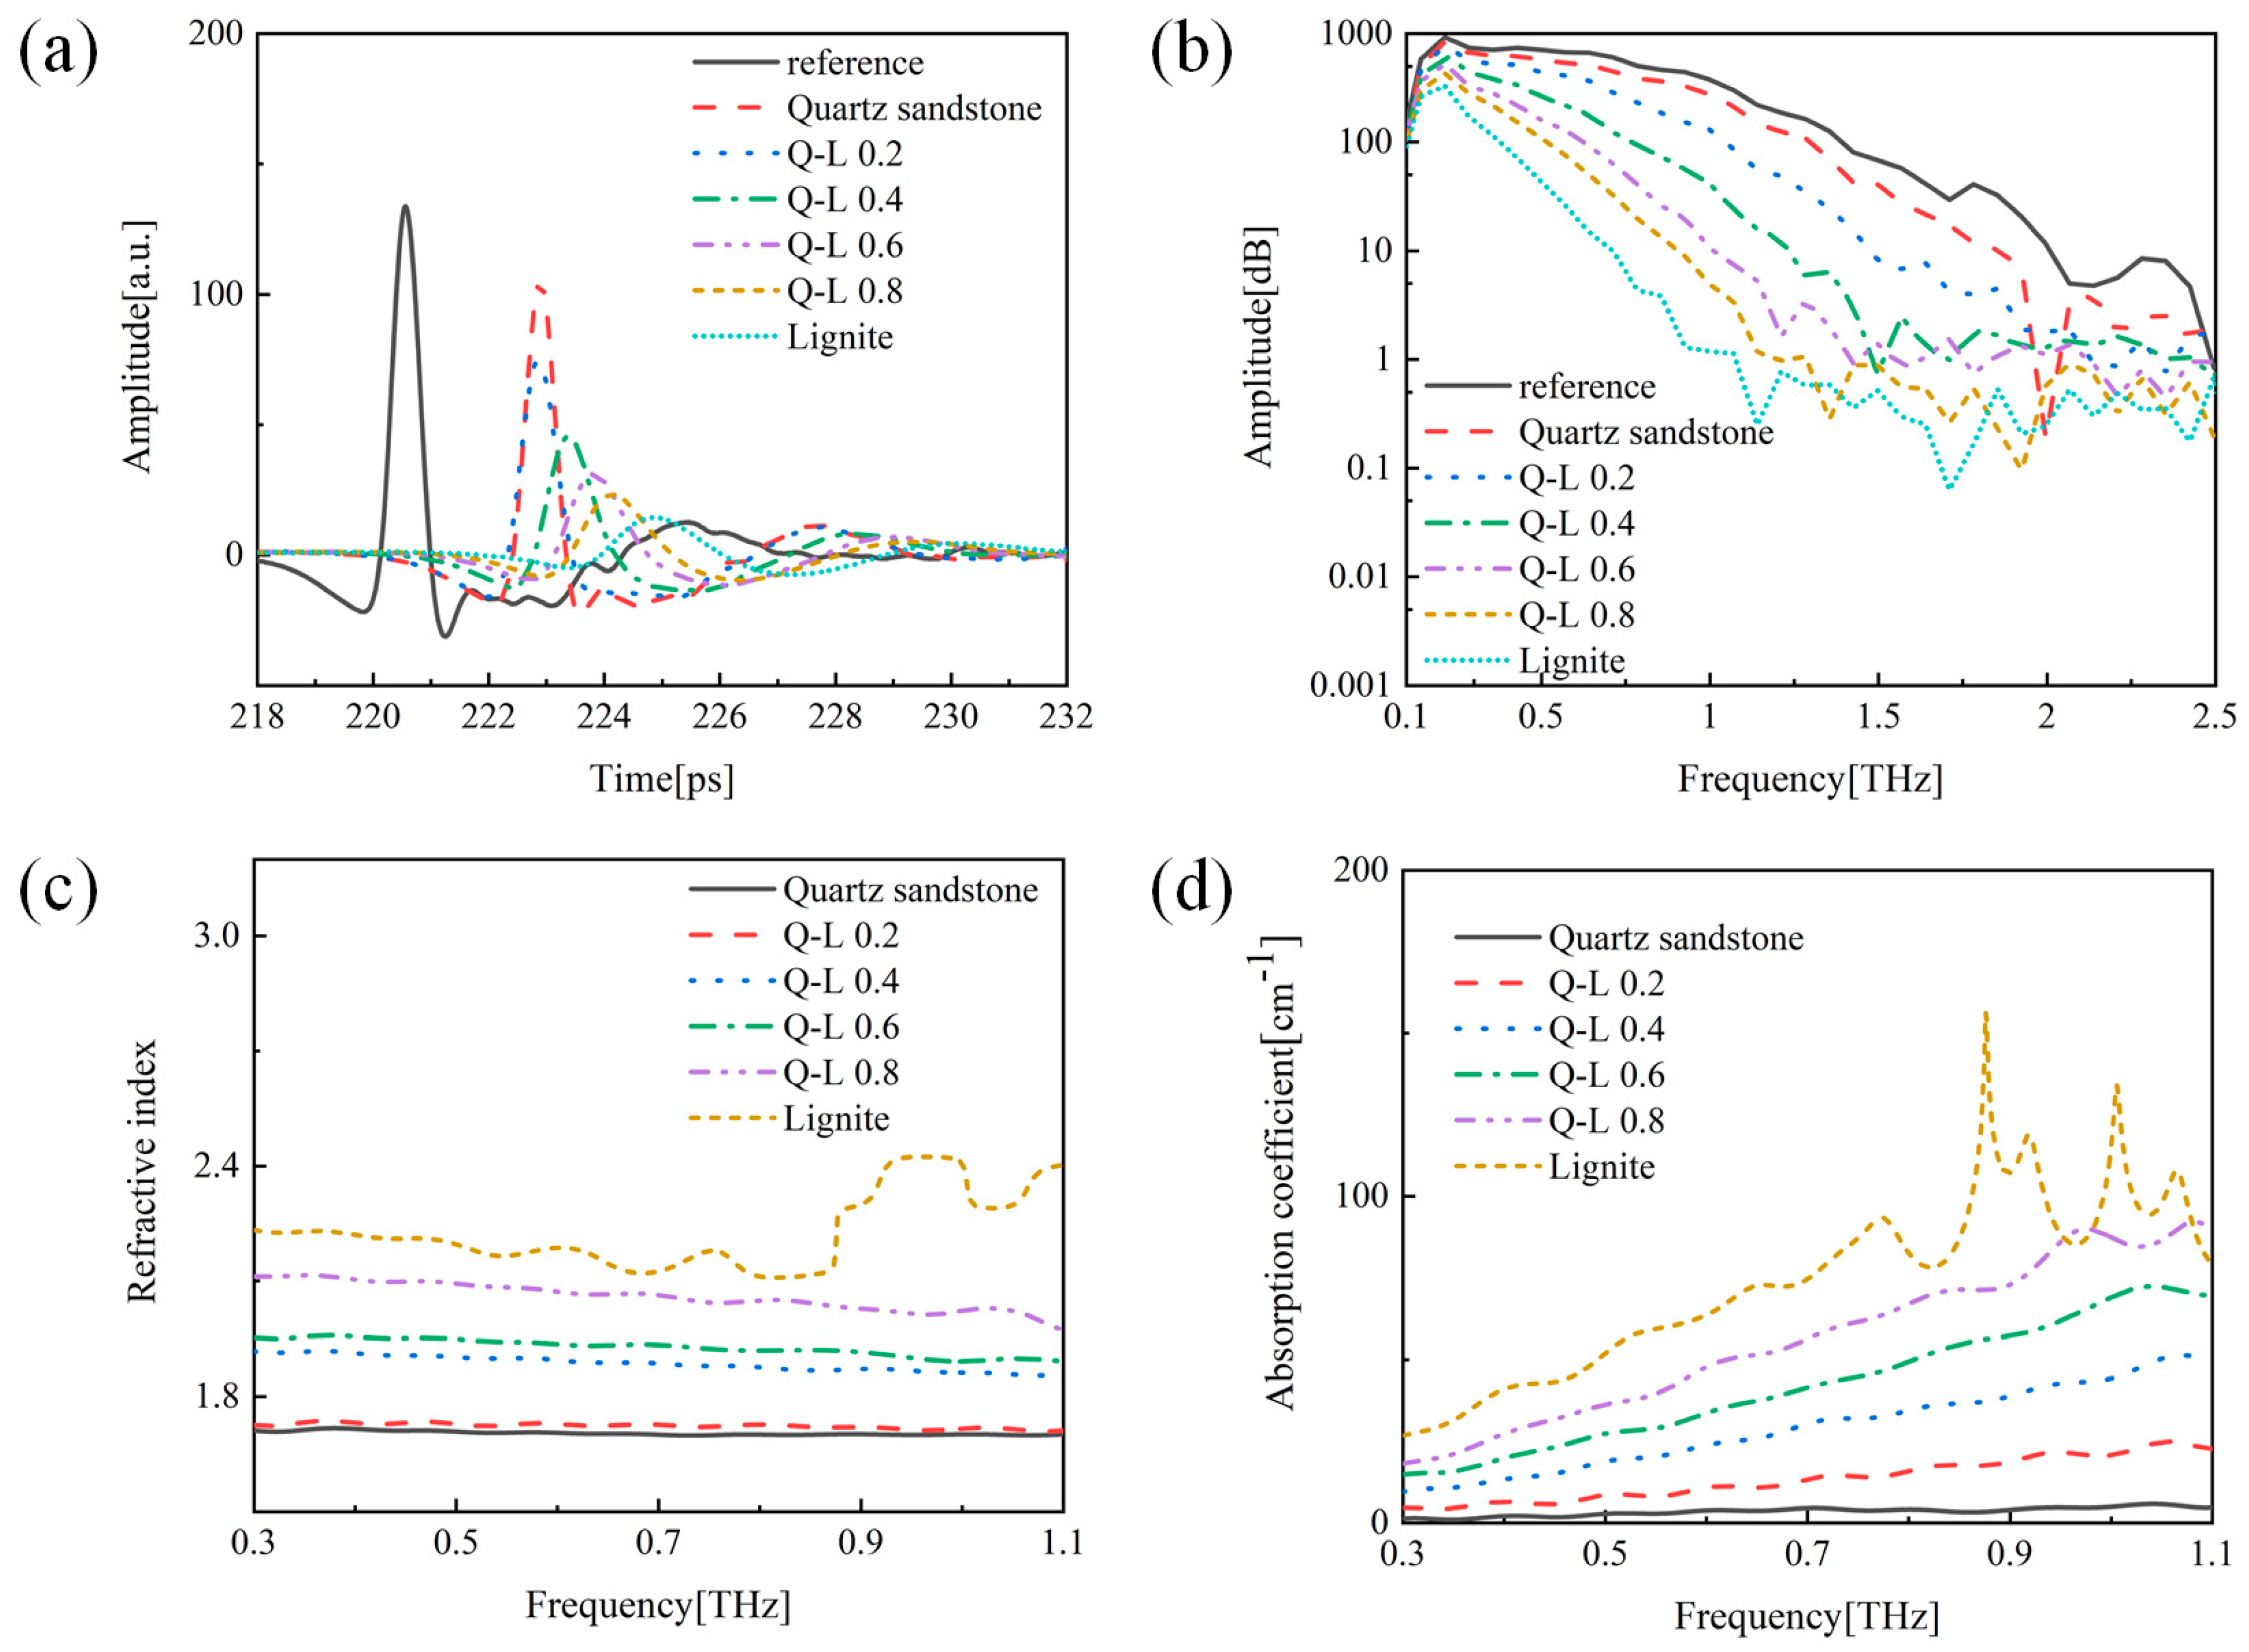
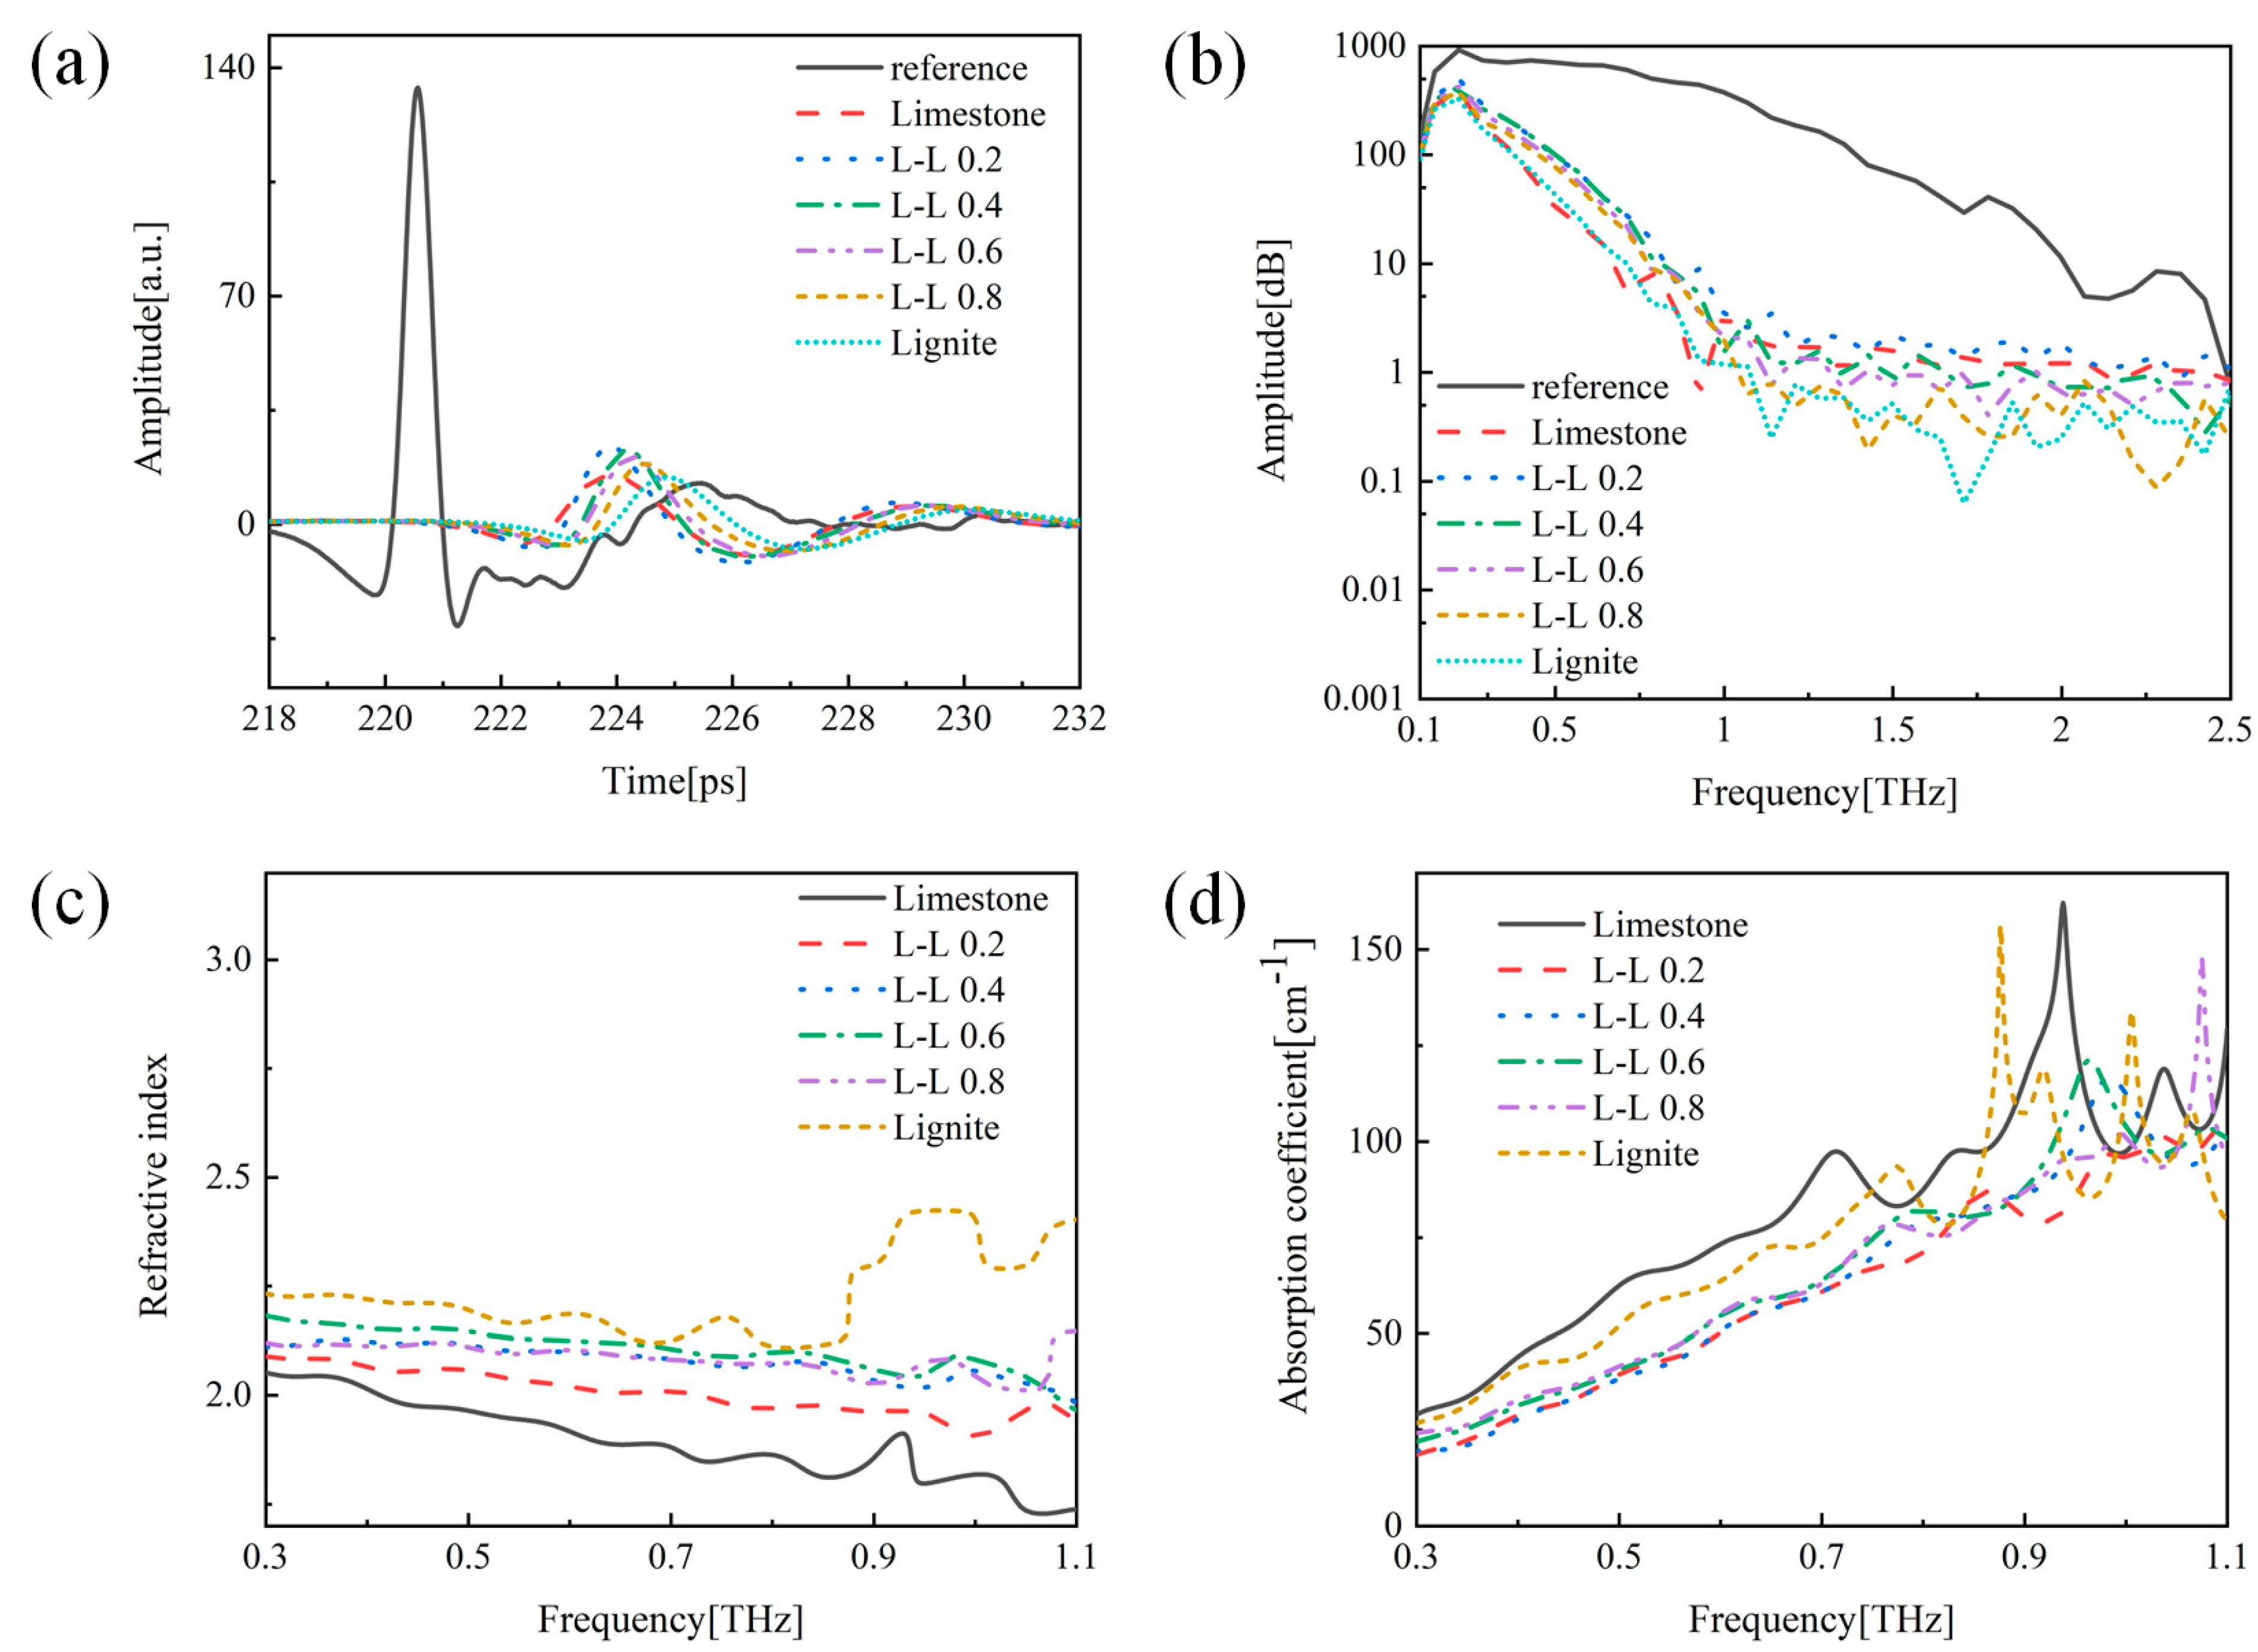
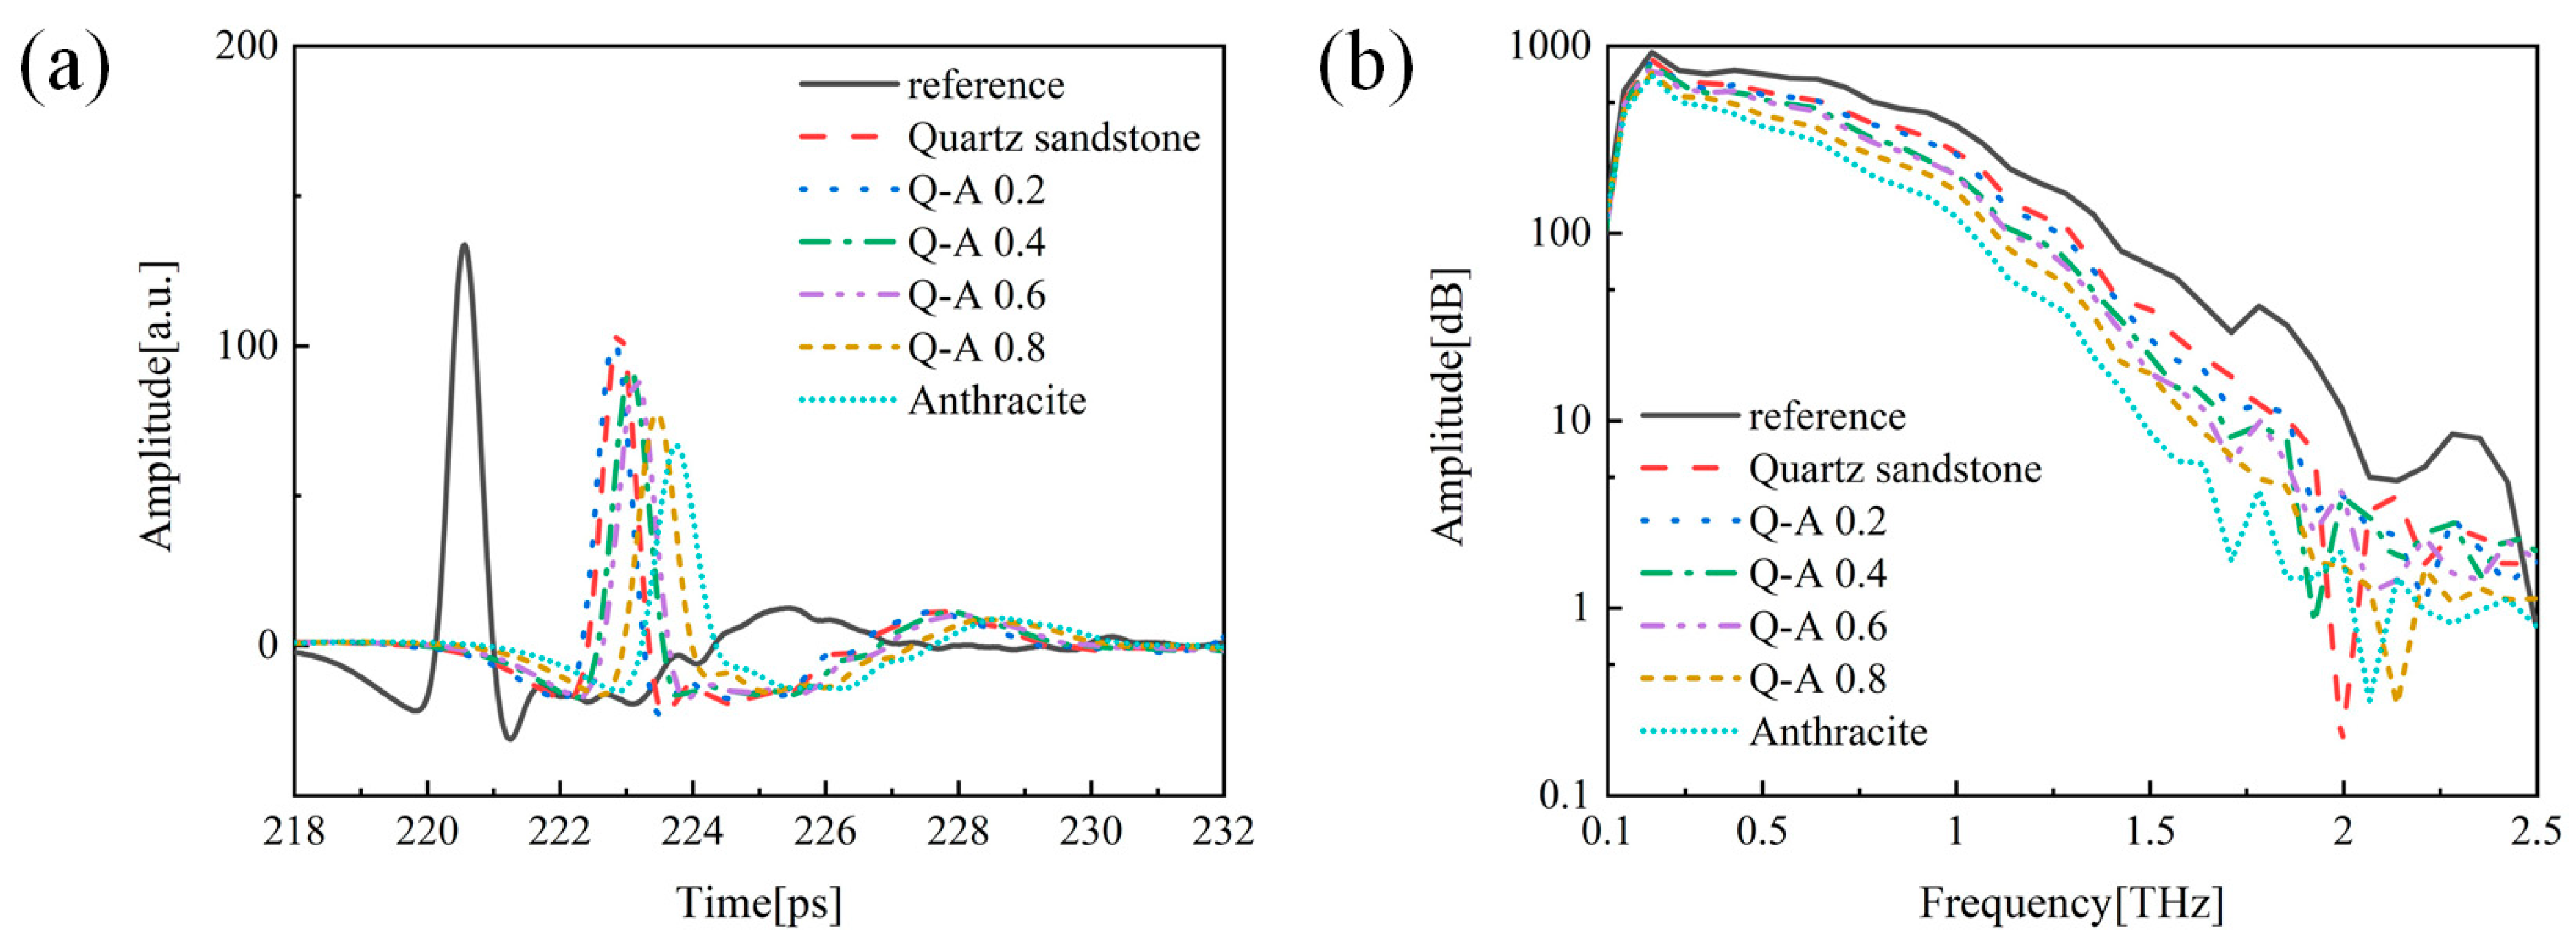
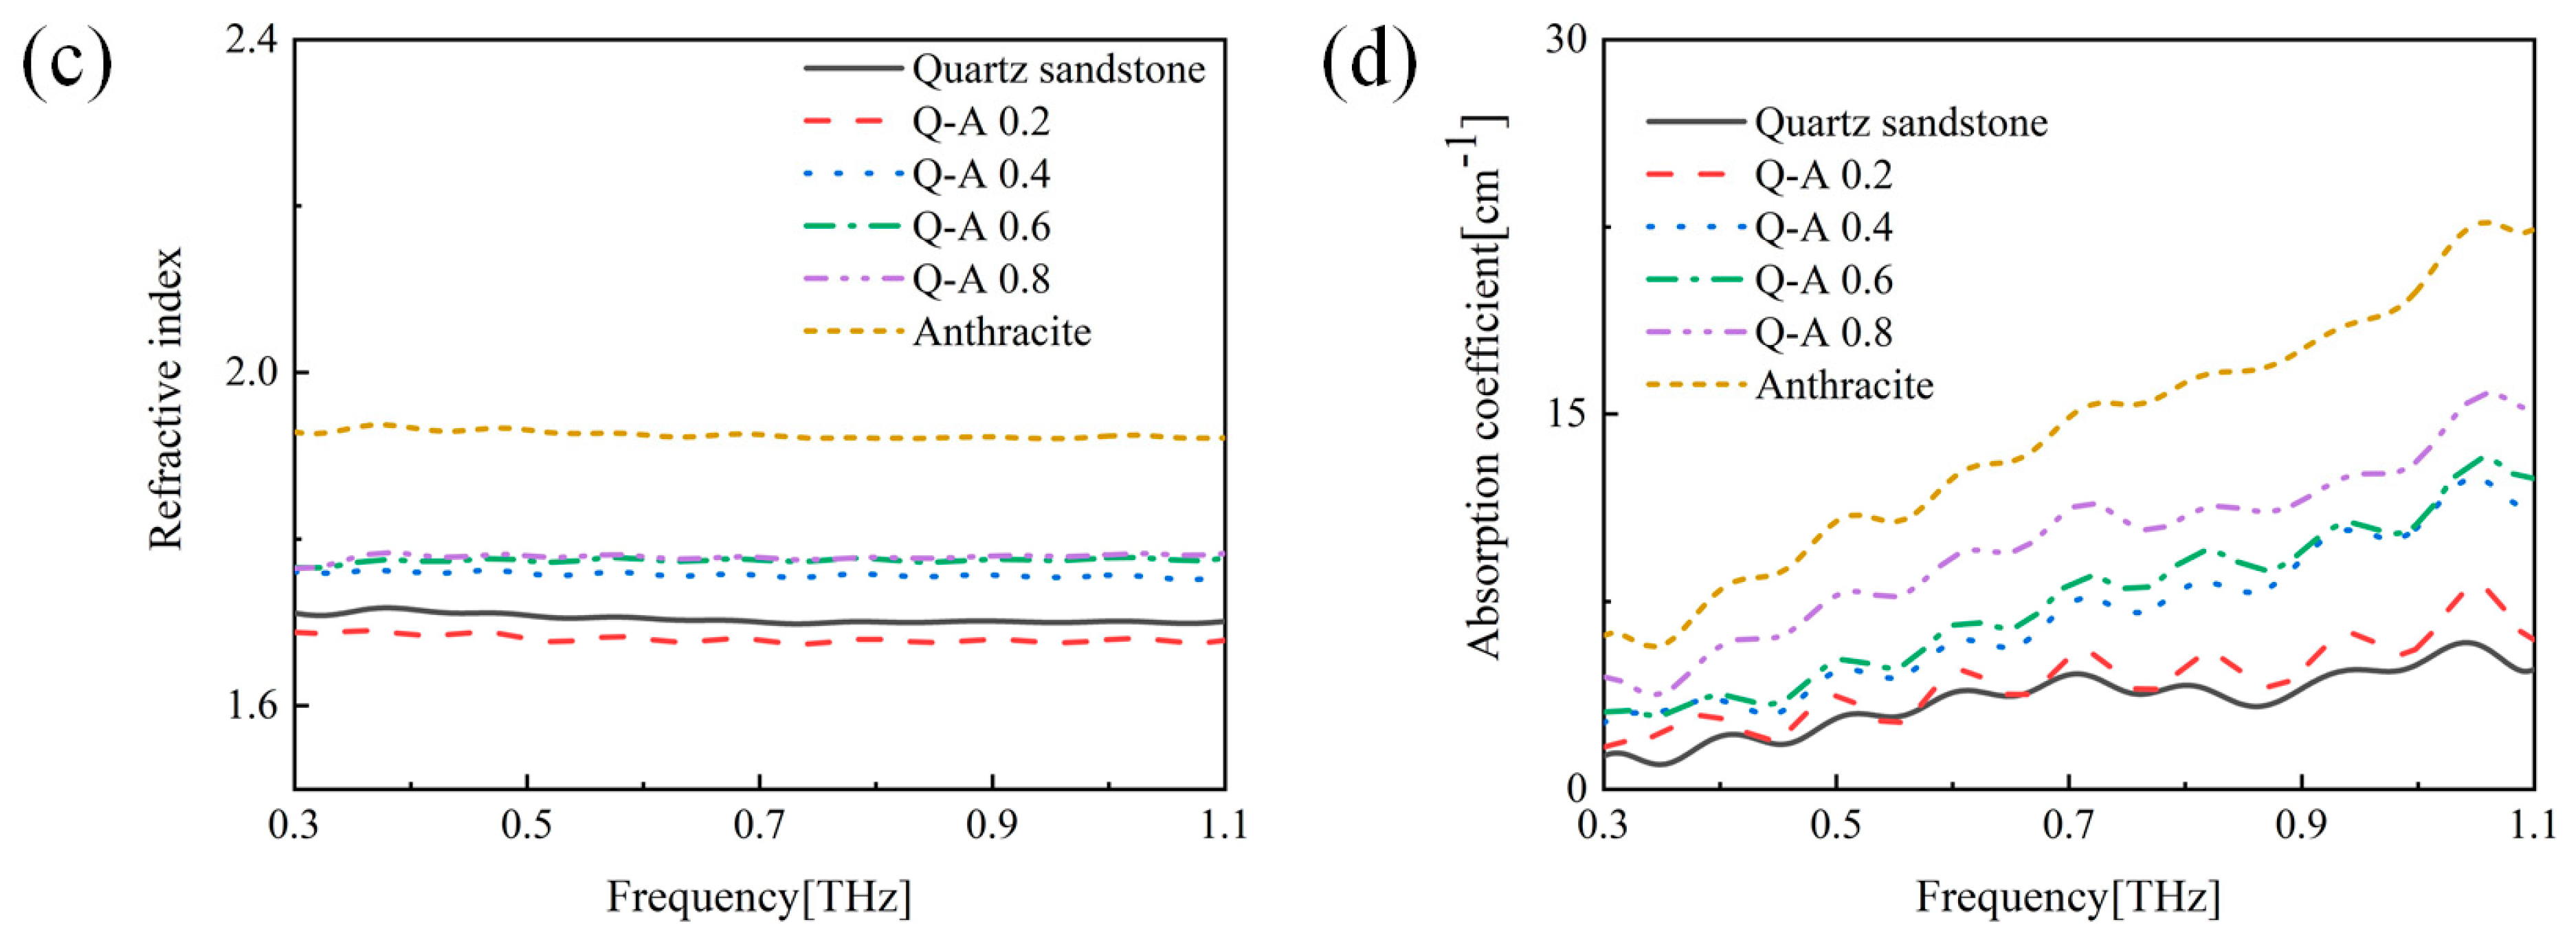
3.1.2. THz Spectral Properties of Coal–Rock Mixtures

The THz time-domain spectral system is consistent with previous configurations, and the measurement and calculation results for the coal–rock mixture sample are shown in Figure 3, Figure 4, Figure 5 and Figure 6. The resulting THz spectra were analyzed using the quartz sandstone–lignite mixture samples, as shown in Figure 3. Figure 3a shows the THz time-domain signal of six samples with the mass ratio of coal powder to coal–rock powder displayed in the upper right corner.
It can be seen from Figure 3a that the attenuation of THz waves is different when passing through the coal and rock mixed samples. The frequency master diagram of the coal–rock mixed sample is obtained by applying fast Fourier transform, as shown in Figure 3b. From the figure, all samples of the coal–rock mix peak at 0.2 THz. As the mass ratio of coal increases, the peak size gradually decreases, which is consistent with the time-domain variation in Figure 3a. In addition, with the increase of the mass ratio of coal, the bandwidth of the sample also decreases gradually, and the bandwidth of pure lignite sample is the shortest. The refractive index and absorption coefficient of coal and rock mixed samples are obtained by calculation. It can be observed from Figure 3c that the refractive index of the six samples is basically stable, and the difference in refractive index can be attributed to the difference in the main composition of coal and rock materials.
Figure 3d is the absorption coefficient diagram for the coal–rock mixture samples. From the figure, the absorption coefficients of all samples increase with the increase of frequency. The increase in absorption becomes more pronounced as the coal content in the sample increases. In the THz band, no obvious absorption peaks are observed in the coal and rock mixed samples. This could be due to the following three reasons: (1) there are no EM resonances of either coal or rock molecules in the THz range; (2) there is no component that strongly absorbs THz waves in the sample; (3) there are multiple components in the samples to absorb the THz waves in such a way that peak values cannot be obtained clearly. Based on the optical data obtained from the THz detection of coal–rock mixture samples, the refractive index and absorption coefficient of coal–rock mixture can serve as the reference for identifying the coal–rock interface.

3.1.3. Application of THz-TDS in Coal–Rock Interface Identification

In the actual working environment of a coal mine, continuous mining machines need to make timely judgements about the interface while cutting the coal seam. These machines work underground in coal seams, where the material being cut is general coal. However, when a continuous mining machine encounters a coal–rock working face, it starts cutting a mixture of coal and rock. At this point, it is crucial for the shearer to stop mining the current working face and proceed to judge and mine the next working face instead of completely cutting the rock before starting [29].
In this section, THz time-domain spectroscopy technology is used to assist the continuous mining machine in making real-time assessments of coal–rock working faces; a flow chart is shown in Figure 7. When the continuous mining machine cuts the working face, it generates a mixture of coal/rock/coal–rock mixed powder. This powder is collected and sieved. With particle size below 74 µm, the dry treatment is carried out to ensure the reliability for THz detection. Subsequently, the samples undergo THz testing to obtain the time–domain spectrum signal. After testing, the samples are separated from the remaining powder collected earlier, humidified, and removed. The purpose of this process is to avoid retesting the collected and tested powder, which could potentially impact the subsequent mining machine’s real-time assessment of the coal–rock working face and lead to incorrect judgment. Then, the time-domain spectral signals of the samples are subjected to fast Fourier transform to obtain frequency domain spectra. The optical parameters such as refractive index and absorption coefficient are calculated. All the THz data from the samples are sent to the database for analysis. The analysis database is built by integrating all the time-domain signals, frequency domain signals and multiple optical parameters of coal, rock and coal–rock mixture in Section 3.1.1 and Section 3.1.2. In practice, the situation of coal–rock working surface is relatively complex, which requires us to judge a variety of coal–rock combinations in addition to coal and rock. The core function of the database is to assist the continuous mining machine in distinguishing complex coal–rock interface situations, providing a wealth of information. The THz information of the samples is compared and analyzed against the existing information in the database to determine whether the tested sample is coal, rock, or a coal–rock mixture and draw a conclusion. The resulting determination can be transmitted as instructions to the continuous mining machine, which takes the next steps accordingly. Subsequently, the conclusions can be recorded in the database to provide more abundant data analysis for future tests. Through this process, the THz time-domain spectroscopy technology can be effectively applied to the coal–rock interface identification.

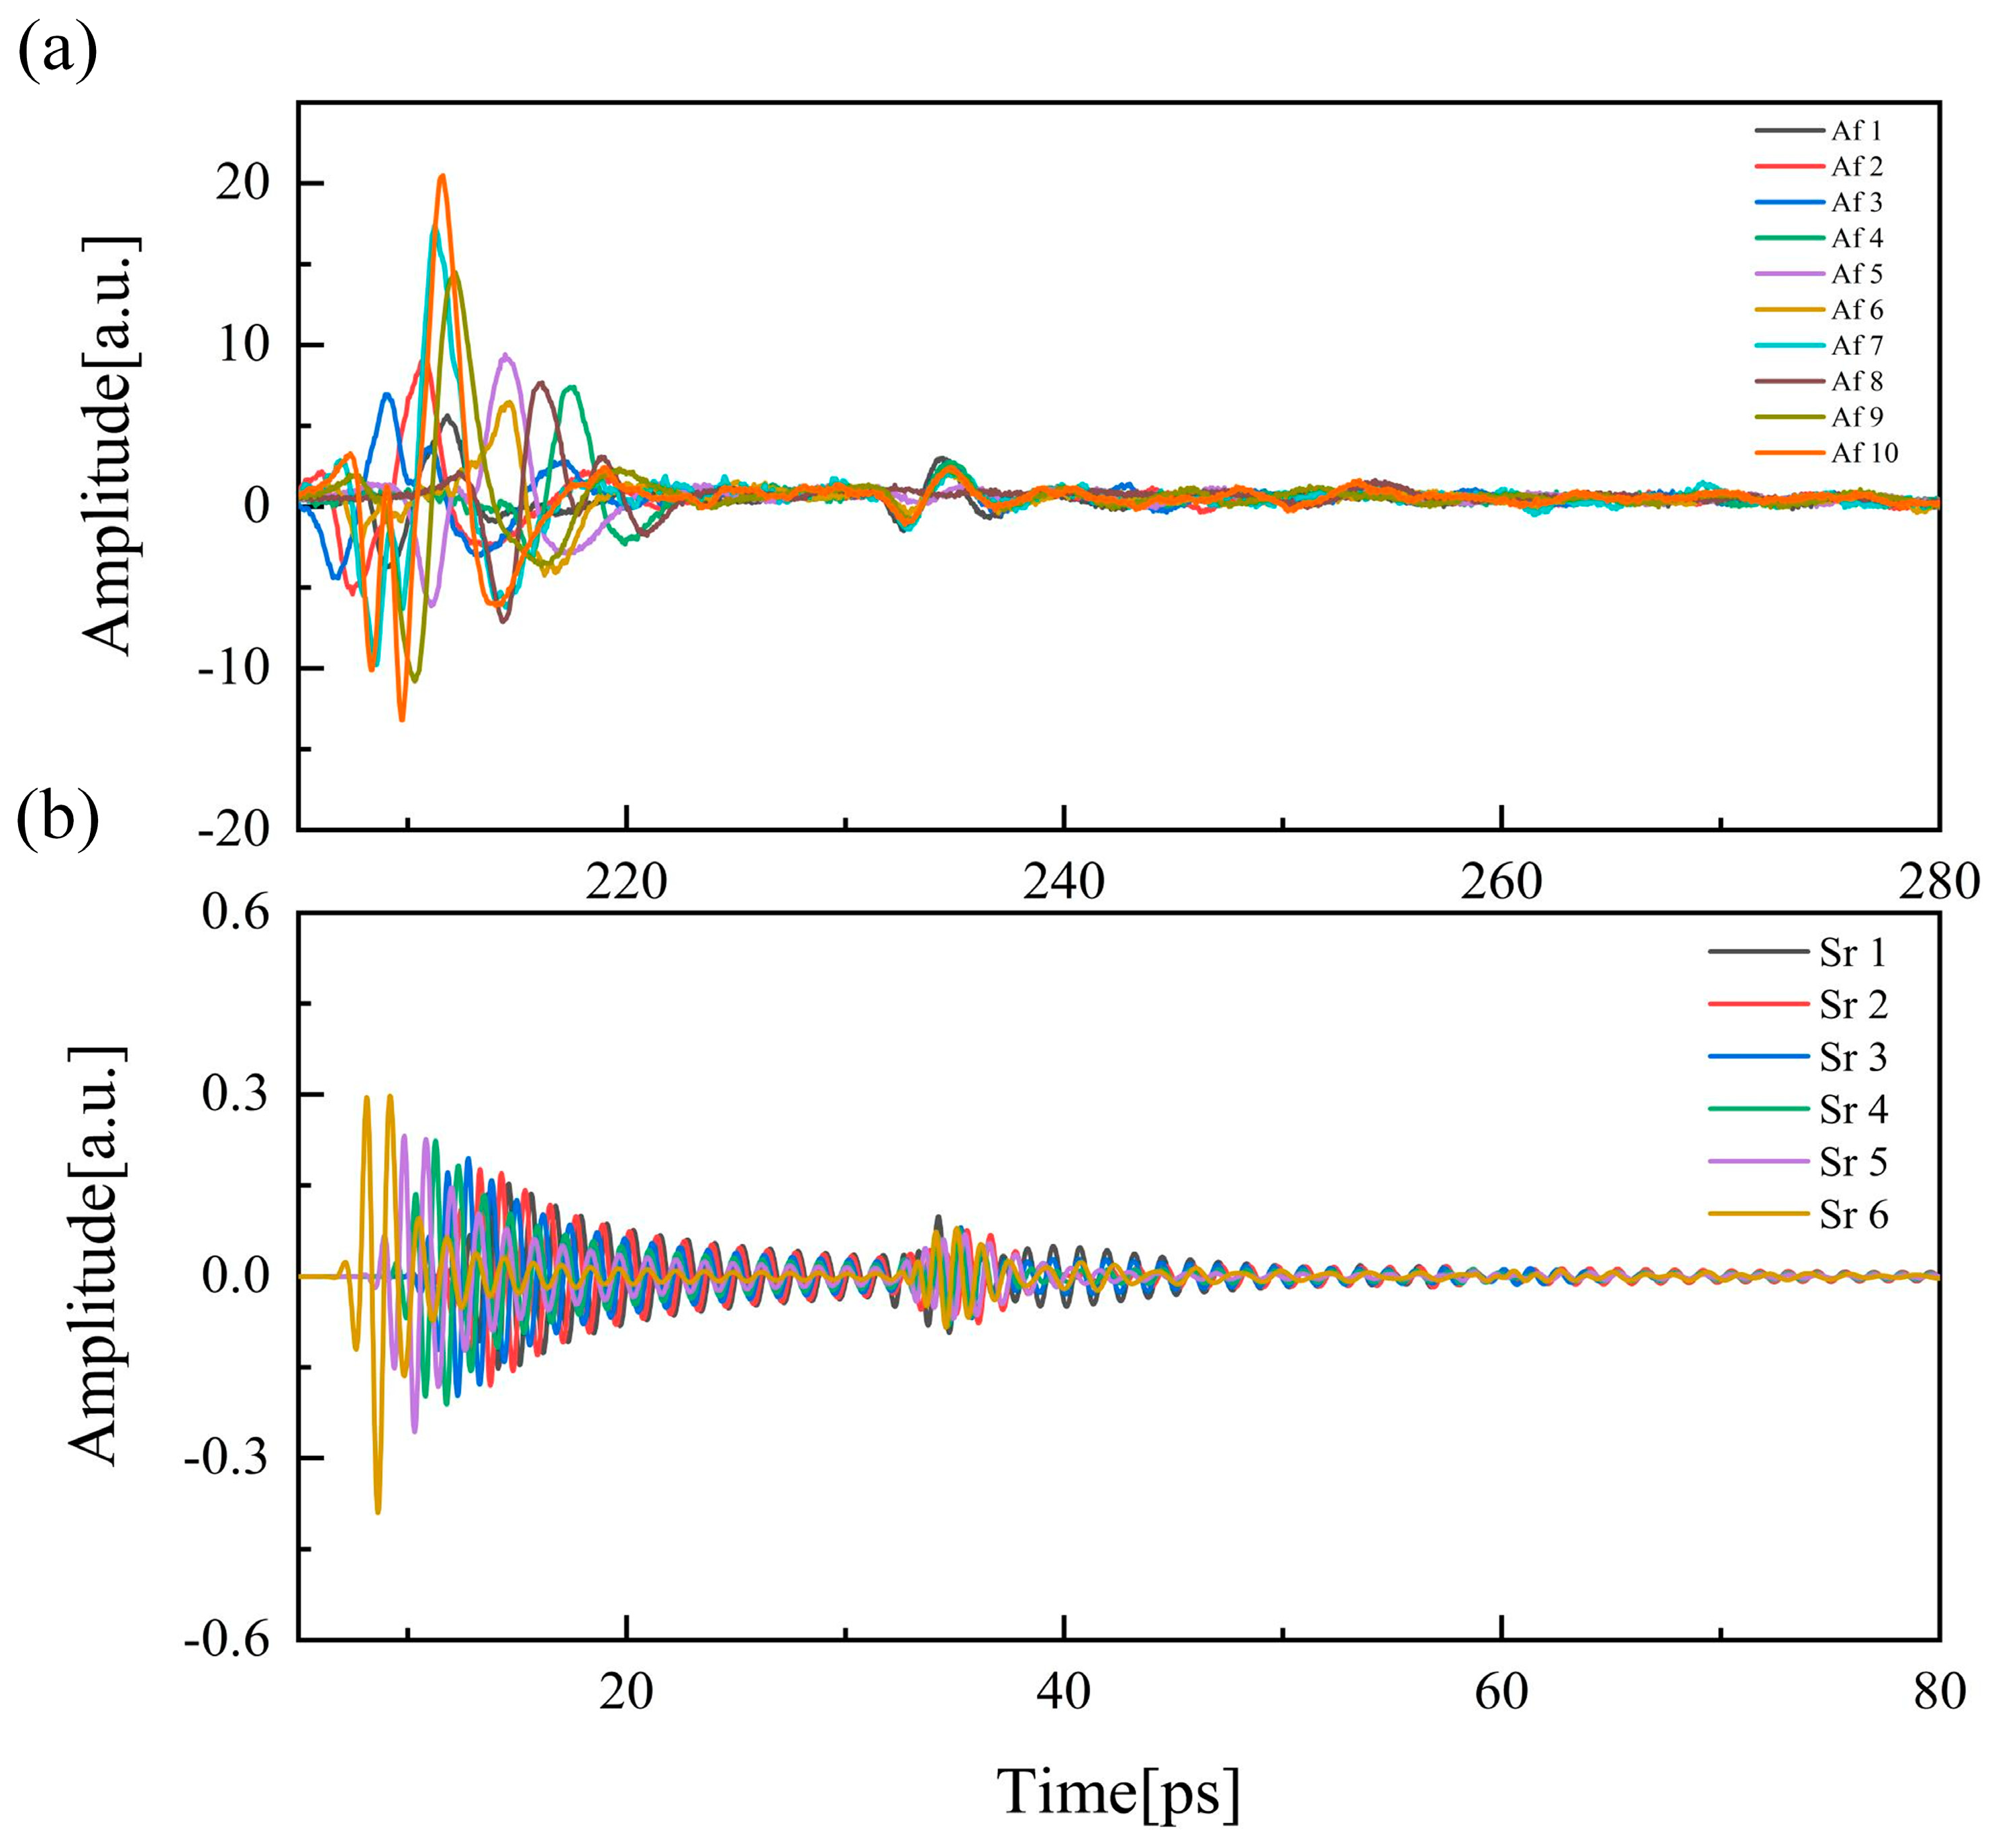
3.2. THz Detection and Simulation of Coal Flakes of Different Thickness

THz testing was carried out on 10 coal samples with different thicknesses, spanning the waveform range of 205–232 ps with a step size of 0.05 ps, as shown in Figure 8a. After propagating through free space, the THz pulses interact with the flake coal, resulting in phenomena such as transmission, reflection, absorption and scattering. Ideally, if the measured coal flake can meet the absolute ideal conditions (having smooth, parallel surfaces and an internal structure size smaller than the length of the THz wave), then the THz wave cannot scatter on the surface and inside of the coal flake. However, post-processing and preparation of coal flakes obviously cannot meet these ideal conditions since both the surface and interior of the coal flake exhibit scattering, affecting the time-domain spectrogram. Usually in the THz measurement, both scattering and absorption of THz waves by a substance occur at the same time. When there are components in the material with high absorption of THz waves, the THz waves can be partially absorbed when passing through the coal sheet. When the THz pulse touches the surface of the coal sheet, part of the THz wave can be reflected back by the surface, while the rest can penetrate the coal surface to reach the inside of the coal sheet. During this process, some THz waves can be scattered or absorbed by the coal material. When the remaining THz waves reach the subsequent surface, reflection and transmission occur again, the system detects the changes in the time-domain signal of the THz waves between the two surfaces, as shown in Figure 8a. In order to ensure full interaction between the THz pulse and the coal sheet, all samples are positioned in the same location before testing, securing the second surface’s position while the position of the first surface varies with the thickness of each coal slice. Therefore, in Figure 8a, the peak value of THz waves on the first surface of coal flakes with different thicknesses is mainly in the range of 210–220 ps, and the peak value of the second surface is concentrated around 235 ps. In the time-domain signal of the sample, the peak value of the first surface is different in addition to the delay time, and the amplitude of the peak value is also different, which is caused by the different levels of surface smoothness on the coal sheet. Polishing the sample surfaces can make them similarly smooth but not identical, leading to differences in the extent of scattering, resulting in variations in the first peak.
In order to verify the experimental results, we used the simulation software Computer Simulation Technology (CST 2021) to simulate the experimental process of measuring coal seams with different thicknesses by THz time-domain spectroscopy technology, and compared the simulated time-domain spectra with the actual samples. Fourier transform of the time-domain signal of the sample was used to obtain the effective spectrum range of the coal slice, which is 0.2–1.5 THz. The simulation model of rectangular waveguide was established using CST. The waveguide can guide the directional transmission of electromagnetic waves. The rectangular waveguide is composed of a waveguide port for the emission source of electromagnetic waves at the front of the waveguide (THz pulse), the two kinds of dielectric materials in the middle of waveguide (air and anthracite), and a waveguide port of short circuit for realizing the reflection of THz wave. In order to better simulate the experimental process, the materials are divided into two parts, the first part is air to simulate the propagation of THz pulse in free space, and the second part is anthracite. For air material, relative permittivity is 1, conductivity is 0; for the anthracite material, relative permittivity is 3.6, conductivity is 0.00001 [30]. The cross-section length of rectangular waveguide is 0.1956 mm; the width is 0.0978 mm. Mesh properties set as hexahedra, largest cell set as 0.0132 mm, and the background properties set as normal. The direction of the incident electric field is set as the positive direction of x-axis. At the same time, the boundary conditions of rectangular waveguide set port-dependent incident energy on the y-z and x-z planes. Using a time-domain solver, the frequency range is set to 0.2–1.5 THz, consistent with the effective spectrum range of the coal flake sample. Because in the CST time-domain solver, the incident pulse waveform is controlled by setting the solving frequency range (width of the frequency range), so the incident waveform in this study is fixed. By adjusting the distance of the wind side, the first side of the coal seam can be changed, and the second side can be fixed to achieve the change of the thickness of the coal seam. The experimental process of measuring coal seams with different thicknesses by terahertz time-domain spectroscopy is simulated, and the simulated time-domain spectra are compared with the actual samples. In order to simulate the THz spectra of different thickness samples in the experiment, the length of the waveguide coal seam part (Sr1-Sr6) to be simulated are set as 4.05, 3, 5, 3.50, 3.45 and 3.90 mm, respectively. The average time for simulating coal seams of different thicknesses is 2 min. The simulation results (Sr) are shown in Figure 8b. The peak value of the first surface of the time-domain signal of different thickness coal seams is mainly in the range of 10–20 ps, and the peak value of the second surface is concentrated around 35 ps. Compared with Figure 8a, it can be seen that the time ranges of the two surface peaks in the samples and simulation results are consistent, and the time-domain spectra are the same. Because their position depends on the thickness of the sample, the second peak is identical to the time interval of the first peak. Observation of anthracite flakes Af2, Af3, Af6, Af7 and simulation of their obtained simulation results Sr5, Sr6, Sr1, Sr4 were compared. The thickness comparison between the experiment and simulation are shown in Table 4.
As can be seen from Figure 8, the simulation waveform is different from the experimental waveform, because the waveform after simulation is different due to the different Settings of materials and coal seam thickness (the Settings are different to simulate the experimental process), which is not fixed and different from the experimental THZ waveform. However, the simulation results (the interval between the two peaks) are consistent with the experimental results, which can achieve the goal of this study. The two peaks correspond to the largest amplitude of the two pulse oscillations. The first peak value is generated when the THz wave passes through the first surface of the sample, and the second peak value is generated when it reaches the second surface of the sample after passing through the interior of the sample. The time interval between the two peaks is consistent with the experimental results and the simulation results of coal seams with different thicknesses. In this study, the time-domain spectra of simulation results and experimental results have similar intervals between the two peaks when the thickness of coal seams were set to be same as the experimental coal slice. The proposed method is based on the high resolution and non-destructive properties of THz waves, and therefore, the thickness of the sample can be estimated by comparing the THz waveform obtained by the experiment and the simulation results. In this study, the feasibility of applying THz-TDS technology and CST simulations to estimate the thickness of the samples has been proved by comparing the time-domain spectra of 10 different thickness coal slices and the simulation results of six different thicknesses of coal slices (Table 4). The method still needs to be improved (for example, the thickness of the measured coal flake is small in this study). We hope to estimate any thickness of unknown coal slice based on the simulation and experimental results in the future.

4. Conclusions

In recent years, THz time-domain spectroscopy has developed rapidly, and research using its application in various fields is in progress. Specifically, research on THz detection system designed for outdoor and severe conditions is underway. The advantage of using THz waves to detect the coal–rock interface is the ability to perform timely, accurate and non-destructive material detection. The analysis of time and frequency domain signals, refractive index and absorption coefficient of coal and rock samples and coal and rock mixture samples can accurately identify the detected powders. The establishment of a database can enable the analysis of the shearers to judge whether the cutting face is coal, rock or coal–rock. When a coal mining machine encounters a coal–rock interface during cutting, THz time-domain spectroscopy can be employed to assess the working face, thus avoiding cutting into the rock portion. In addition, compared with the existing research, this study proposed a thickness measurement method combining the terahertz time-domain system with simulation software, and carried out related experiments and simulation. Through terahertz testing of 10 kinds of coal flakes with different thicknesses, and comparative analysis with the simulation data, the feasibility of this method was confirmed. It lays a foundation for the future study of coal seam thickness detection using the terahertz system. The research in this work contributes to the application of THz time-domain spectroscopy technology in the identification of coal–rock interface, and also provides a reference for the study of THz wave detection of coal seam.

Supplementary Materials

The following supporting information can be downloaded at: https://www.mdpi.com/article/10.3390/app14041431/s1, Figure S1: THz-TDS; Figure S2: TDS 1008 inside, laser beam path; Figure S3: Samples-a; Figure S4: Samples-b.

Author Contributions

Conceptualization, Z.J., T.M. and C.Y.; methodology, T.M. and H.L.; software C.Y. and W.H.; validation, L.H., Z.J. and H.L.; formal analysis, Z.J. and W.H.; investigation, W.H.; resources, H.L.; data curation, C.Y., H.L. and W.H.; writing–original draft preparation, Z.J., T.M. and L.H.; Writing–review and editing, Z.J. and H.L; visualization, C.Y.; supervision, H.L.; project administration, W.H.; funding acquisition, H.L. and W.H. All authors have read and agreed to the published version of the manuscript.

Funding

This research was funded by the National Key R&D Program of China, grant number 2021YFB3200100; Applied Basic Research Projects of Shanxi Province, grant number 202203021221212; Research Project Supported by Shanxi Scholarship Council of China, grant number 2020-135; the Key R&D Project of Datong City, grant number 2020019; and Special Project of Shanxi Datong University, grant numbers 2020YGZX003, 2020YGZX004, 2021YGZX33, and 2022YGZX001.

Institutional Review Board Statement

Not applicable.

Informed Consent Statement

Not applicable.

Data Availability Statement

The data used to support the findings of this study are included in the article.

Conflicts of Interest

The authors declare no conflicts of interest.

References

  1. Solomon, B.D.; Krishna, K. The coming sustainable energy transition: History, strategies, and outlook. Energy Policy 2011, 39, 7422–7431. [Google Scholar] [CrossRef]
  2. Lan, H.; Chen, D.K.; Mao, D.B. Current status of deep mining and disaster prevention in China. Coal Sci. Technol. 2016, 44, 39–46. [Google Scholar]
  3. Huang, S.J.; Liu, J.G. Research of coal-rock recognition technology based on GMM clustering analysis. J. China Coal Soc. 2015, 40 (Suppl. S2), 576–582. [Google Scholar]
  4. Wei, R.; Xu, L.J.; Meng, X.Y.; Wu, J.F.; Zhang, K. Coal and rock identification method based on hyper spectral feature absorption peak. Spectrosc. Spectr. Anal. 2021, 41, 1942–1948. [Google Scholar]
  5. Ge, S.R. The development history of coal shearer technology (Part six)—Coal-rock interface detection. China Coal 2020, 46, 10–24. [Google Scholar]
  6. Sun, J.P.; Chen, B. Coal-rock recognition approach based on CLBP and support vector guided dictionary learning. J. China Coal Soc. 2017, 42, 338–3348. [Google Scholar]
  7. Miao, S.G. Study of Coal-Rock Characteristics Identification Method Based on GPR and ESR. Ph.D. Thesis, China University of Mining and Technology, Xuzhou, China, 2019. [Google Scholar]
  8. Liu, Z.B.; Liu, C.; Liu, W.M.; Lu, Z.Q.; Li, P.; Li, Z.Q. Multi-attribute dynamic modeling technique for transparent working face. J. China Coal Soc. 2020, 45, 2628–2635. [Google Scholar]
  9. Zhang, R.H. Discussion on coal rock identification method based on LSM and RELBP. Comput. Technol. Autom. 2021, 40, 109–113. [Google Scholar]
  10. Galhardi, J.A.; García-Tenorio, R.; Francés, I.D.; Bonotto, D.M.; Marcelli, M.P. Natural radionuclides in lichens, mosses and ferns in a thermal power plant and in an adjacent coal mine area in southern brazil. J. Environ. Radioact. 2016, 167, 43. [Google Scholar] [CrossRef] [PubMed]
  11. Nazarova, L.A.; Nazarov, L.A.; Protasov, M.I. Reconstruction of 3D stress field in coal–rock mass by solving inverse problem using tomography data. J. Min. Sci. 2016, 52, 623–631. [Google Scholar] [CrossRef]
  12. Shan, P.F.; Lai, X.P. Numerical Simulation of the fluid–solid coupling process during the failure of a fractured coal–rock mass based on the regional geostress. Transp. Porous Media 2018, 124, 1061–1079. [Google Scholar] [CrossRef]
  13. Wu, S.; Qu, H.; Tu, H.; Feng, H. Progresses towards the application of terahertz technologies. Appl. Electron. Tech. 2019, 45, 3–7+18. [Google Scholar]
  14. Yu, M.; Liu, W.; Wang, K.X.; Wu, Y.H.; Man, R.X. Research on metal surface uniformity detection based on terahertz time domain spectroscopy. Aeronaut. Sci. Technol. 2021, 32, 74–79. [Google Scholar]
  15. Tanno, T.; Oohashi, T.; Katsumata, I.; Katsumi, N.; Fujiwara, K.; Ogawa, N. Estimation of water content in coal using terahertz spectroscopy. Fuel 2013, 105, 769–770. [Google Scholar] [CrossRef]
  16. Bao, R.; Qin, F.; Chen, R.; Chen, S.; Zhan, H.L.; Zhao, K.; Yue, W.Z. Optical detection of oil bearing in reservoir rock: Terahertz spectroscopy investigation. IEEE Access 2019, 7, 121755–121759. [Google Scholar] [CrossRef]
  17. Wang, X.; Hu, K.X.; Zhang, L.; Yu, X.; Ding, E.J. Characterization and classification of coals and rocks using terahertz time-domain spectroscopy. J. Infrared Millim. Terahertz Waves 2017, 38, 248–260. [Google Scholar] [CrossRef]
  18. Yu, J.; Wang, X.; Ding, E.J.; Jing, J.B. A novel method of on-line coal-rock interface characterization using THz-TDs. IEEE Access 2021, 9, 25898–25910. [Google Scholar] [CrossRef]
  19. Zhao, H.; Zhang, L.; Huang, S.; Zhang, C. Terahertz wave generation from noble gas plasmas induced by a wavelength-tunable femtosecond laser. IEEE Trans. Terahertz Sci. Technol. 2018, 8, 299–304. [Google Scholar] [CrossRef]
  20. Zhan, H.L.; Li, N.; Zhao, K.; Zhang, Z.W.; Zhang, C.L.; Bao, R.M. Terahertz assessment of the atmospheric pollution during the first-ever red alert period in Beijing. Sci. China Phys. Mech. Astron. 2017, 60, 044221. [Google Scholar] [CrossRef]
  21. Zhan, H.L.; Zhao, K.; Bao, R.; Xiao, L.Z. Monitoring PM2.5 in the atmosphere by using terahertz time-domain spectroscopy. J. Infrared Millim. Terahertz Waves 2016, 37, 929–938. [Google Scholar] [CrossRef]
  22. Wright, A.S. Fresnel’s laws, ceteris paribus. Stud. Hist. Philos. Sci. 2017, 64, 38–52. [Google Scholar] [CrossRef]
  23. Hentschel, M.; Schomerus, H. Fresnel laws at curved dielectric interfaces of microresonators. Phys. Rev. E Stat. Nonlinear Soft Matter Phys. 2002, 65 Pt 2A, 045603. [Google Scholar] [CrossRef]
  24. Wiersig, J.; Main, J. Fractal Weyl law for chaotic microcavities: Fresnel’s laws imply multifractal scattering. Phys. Rev. E Stat. Nonlinear Soft Matter Phys. 2008, 77 Pt 2, 036205. [Google Scholar] [CrossRef] [PubMed]
  25. Duvillaret, L.; Garet, F.; Coutaz, J.L. Highly precise determination of optical constants and sample thickness in terahertz time-domain spectroscopy. Appl. Opt. 1999, 38, 409–415. [Google Scholar] [CrossRef] [PubMed]
  26. Dorney, T.D.; Baraniuk, R.G.; Mittleman, D.M. Material parameter estimation with terahertz time-domain spectroscopy. J. Opt. Soc. Am. A Opt. Image Sci. Vis. 2001, 18, 1562–1571. [Google Scholar] [CrossRef] [PubMed]
  27. Vieweg, N.; Rettich, F.; Deninger, A.; Roehle, H.; Dietz, R.; Göbel, T.; Schell, M. Terahertz time domain spectrometer with 90 dB peak dynamic range. J. Infrared Millim. Terahertz Waves 2014, 35, 823–832. [Google Scholar] [CrossRef]
  28. Deng, J.J. Fundamental Research on Real-Time Coal-Rock Interface Recognition Using Terahertz Technology. Ph.D. Thesis, China University of Mining and Technology, Xuzhou, China, 2021. [Google Scholar]
  29. Wang, X.; Zhao, R.; Ding, E.J. Coal-rock identification method based on terahertz spectroscopy technology. Coal Min. Technol. 2018, 23, 13–17+91. [Google Scholar]
  30. Xu, H.W. Measurement and test of seam electric parameter and study on relationship between seam electric parameter and coal petrology characteristics. Coal Sci. Technol. 2005, 3, 42–47. [Google Scholar]
Figure 1. Schematic diagram of THz wave transmission sample.
Applsci 14 01431 g001
Figure 2. The THz spectra of coal and rock. (a) Time-domain spectra. (b) Frequency domain spectra. (c) Refractive index spectra. (d) Absorption coefficient spectra.
Applsci 14 01431 g002
Figure 3. Quartz sandstone-Lignite. (a) Time-domain spectrum. (b) Frequency domain spectrum. (c) Refractive index. (d) Absorption coefficient of coal and rock mixture samples with different ratios of coal.
Applsci 14 01431 g003
Figure 4. Limestone-Lignite. (a) Time-domain spectrum. (b) Frequency domain spectrum. (c) Refractive index. (d) Absorption coefficient of coal and rock mixture samples with different ratios of coal.
Applsci 14 01431 g004
Figure 5. Quartz sandstone-Anthracite. (a) Time-domain spectrum. (b) Frequency domain spectrum. (c) Refractive index. (d) Absorption coefficient of coal and rock mixture samples with different ratios of coal.
Applsci 14 01431 g005aApplsci 14 01431 g005b
Figure 6. Limestone-Anthracite. (a) Time-domain spectrum. (b) Frequency domain spectrum. (c) Refractive index. (d) Absorption coefficient of coal and rock mixture samples with different ratios of coal.
Applsci 14 01431 g006
Figure 7. The flow chart of real-time assessments of coal–rock working faces.
Applsci 14 01431 g007
Figure 8. (a) THz waveform of anthracite flakes of different thicknesses. (b) Simulation results.
Applsci 14 01431 g008
Table 1. Coal and rock sample information. (coal and rock alone).
SampleAnthraciteLigniteQuartz SandstoneLimestone
Mass (g)0.200.200.200.20
Thickness (mm)1.02 1.02 1.000.95
Table 2. Coal and rock mixture information. (coal and rock mixed proportionally).
Proportion of CoalMass (g)Thickness (mm)
Quartz Sandstone-
Anthracite (Q-A)
Limestone-
Anthracite (L-A)
Quartz Sandstone-
Lignite (Q-L)
Limestone-
Lignite (L-L)
0.2 0.041.00 0.980.950.95
0.40.080.990.950.950.95
0.60.120.991.001.010.96
0.80.161.091.020.961.00
Table 3. Anthracite flake information.
Anthracite Flakes
(Af)
Mass (g)Thickness (mm)
First MeasureSecond MeasureThird MeasureAverage Value
Af14.103.723.773.833.77
Af22.903.483.433.493.47
Af33.573.804.023.783.87
Af44.534.734.684.544.65
Af53.353.913.873.973.92
Af63.714.043.974.084.03
Af72.973.483.343.613.48
Af86.615.155.275.115.18
Af94.283.953.874.063.96
Af103.103.743.813.833.79
Table 4. The thickness comparison between the experiment and simulation.
ExperimentSimulation
Anthracite Flakes (Af)Thickness (mm)Anthracite Flakes (Sr)Thickness (mm)
Af23.47Sr53.45
Af33.87Sr63.90
Af64.03Sr14.05
Af73.48Sr43.50
Disclaimer/Publisher’s Note: The statements, opinions and data contained in all publications are solely those of the individual author(s) and contributor(s) and not of MDPI and/or the editor(s). MDPI and/or the editor(s) disclaim responsibility for any injury to people or property resulting from any ideas, methods, instructions or products referred to in the content.

