Article

EMD-Based Noninvasive Blood Glucose Estimation from PPG Signals Using Machine Learning Algorithms

Department of Electronics Engineering, Kookmin University, Seoul 02707, Republic of Korea
*
Author to whom correspondence should be addressed.
Appl. Sci. 2024, 14(4), 1406; https://doi.org/10.3390/app14041406
Submission received: 27 December 2023 / Revised: 18 January 2024 / Accepted: 7 February 2024 / Published: 8 February 2024
(This article belongs to the Topic Machine Learning and Biomedical Sensors)

Abstract

:
Effective management of diabetes requires accurate monitoring of blood glucose levels. Traditional invasive methods for such monitoring can be cumbersome and uncomfortable for patients. In this study, we introduce a noninvasive approach to estimate blood glucose levels using photoplethysmography (PPG) signals. We have focused on blood glucose prediction using wrist PPG signals and explored various PPG waveform-based features, including AC to DC ratio (AC/DC) and intrinsic mode function (IMF)-based features derived from empirical mode decomposition (EMD). To the best of our knowledge, no studies have been found using EMD-based features to estimate blood glucose levels noninvasively. Additionally, feature importance-based selection has also been used to further improve the accuracy of the proposed model. Among the four machine learning algorithms considered in this study, CatBoost consistently outperformed XGBoost, LightGBM, and random forest across a wide number of features. The best performing model, CatBoost, achieved Pearson’s r of 0.96, MSE 0.08, R 2 score 0.92, and MAE 8.01 when considering the top 50 features selected from both PPG waveform-based features and IMF-based features. The p-values for all models were <0.001, indicating statistically significant correlations. Overall, this study provides valuable insights into the feasibility and effectiveness of noninvasive blood glucose monitoring using advanced machine learning techniques.

1. Introduction

Diabetes is a long-term health condition that currently impacts an estimated 537 million adults globally, and projections suggest this number could rise to 783 million by 2045 [1]. The disease becomes apparent when the body is either incapable of producing sufficient insulin or unable to efficiently utilize the insulin it produces. This results in increased blood glucose levels. Proper management of diabetes is necessary as there is no permanent cure and subsequent health complications associated with it.
The reliable monitoring of blood glucose levels serves as essential in the management of diabetes mellitus. Traditional methods for monitoring glucose rely on invasive blood sampling, posing discomfort and adherence challenges for patients. Minimally invasive methods allow for more continuous monitoring, but they also bring particular challenges. A micro-needle implant is often required to detect glucose levels in interstitial fluid. These approaches frequently result in reading delays, differences in actual glucose levels, and the added cost and hassle of recurrent needle changes [2]. Consequently, the quest for noninvasive monitoring technologies has been an area of significant interest and active research.
Recent advancements in photoplethysmography (PPG) technology present a promising view for noninvasive and economical choice of blood glucose monitoring. PPG is a noninvasive optical method of measuring blood volume fluctuations in the peripheral circulatory system. This study utilizes a wrist-worn PPG sensor that employs a reflective approach for signal detection. The radial arteries at the wrist, which is wider than the fingertip capillaries, provide better signal quality in reflective mode compared to the transmissive mode typically used at the fingertip [3]. Furthermore, the wrist serves as a more convenient location for data collection with wearable PPG devices compared to other potential sites such as the finger, earlobe [4]. Recent studies have shown varying degrees of success applying machine learning techniques to PPG data to estimate blood glucose levels. In our previous study [5,6,7], both transmissive and reflective PPG signals have been used for noninvasive HbA1c estimation.
In this study, we focused on noninvasively estimating blood glucose levels by using wrist PPG signals and applying empirical mode decomposition (EMD)-based machine learning algorithms. Algorithms such as random forest (RF), XGBoost, CatBoost, and LightGBM [8,9,10,11] have been applied to prediction models with the goal of achieving accurate glucose level estimation from PPG signals and diabetes datasets. However, some PPG-based estimations include external features such as BMI, SpO2, age, and other relevant factors to improve the accuracy of predictions. Although the application of machine learning algorithms for blood glucose prediction using PPG signals has yielded promising outcomes, there is still ample room for research, especially in the exploration and application of typical PPG-based features. This issue must be addressed to increase the accuracy and reliability of the approach. Previous studies have mainly applied EMD to PPG signals to estimate heart rate [12], respiratory rate [12,13]. However, this proposed work leverages EMD to identify key features of blood glucose estimation and expand its application scope beyond traditional vital signs monitoring.
In contrast to traditional invasive and minimally invasive methods, PPG technology presents a more patient-friendly solution for blood glucose monitoring. Current methods, such as finger-prick testing and microneedle implantation, often cause discomfort, adherence issues and are subject to delays in glucose readings. PPG overcomes many of these limitations by being noninvasive and wearable. It provides continuous, real-time monitoring without the inconvenience of painful skin penetration or frequent sensor replacement. Furthermore, the accuracy of PPG reflecting blood glucose variations has been improved through advanced algorithms and signal processing techniques, such as EMD, which were not applied to traditional methods. This study aims to demonstrate how PPG, particularly through a wrist-worn device, can improve patient compliance and diabetes management by providing a viable and user-friendly alternative to traditional blood glucose monitoring methods. In this study, we explore the application of wrist PPG data to estimate blood glucose levels, emphasizing only PPG signal-based features.
The contributions of this study can be stated as follows:
-
The study focuses on PPG-based features for blood glucose estimation, aiming to reduce dependence on conventional features by exclusively utilizing PPG waveform-based features including ratios (AC/DCs) and ratio of ratios across various wavelength combinations, and IMF-based features derived through empirical mode decomposition (EMD). Empirical mode decomposition has been newly applied to extract PPG signal features for blood glucose level estimation.
-
In this study, we have performed a detailed comparative analysis, measuring the performance of PPG-based features against well-established machine learning algorithms, including XGBoost, random forest, LightGBM, and CatBoost.
-
Improved and more reliable blood glucose predictions were achieved using only PPG signal-based features without the need for external information such as BMI, SpO2, and age.
-
The proposed study focuses on wrist PPG data with wearable applications in mind, while previous results [5,6,9] are based on fingertip PPG data.

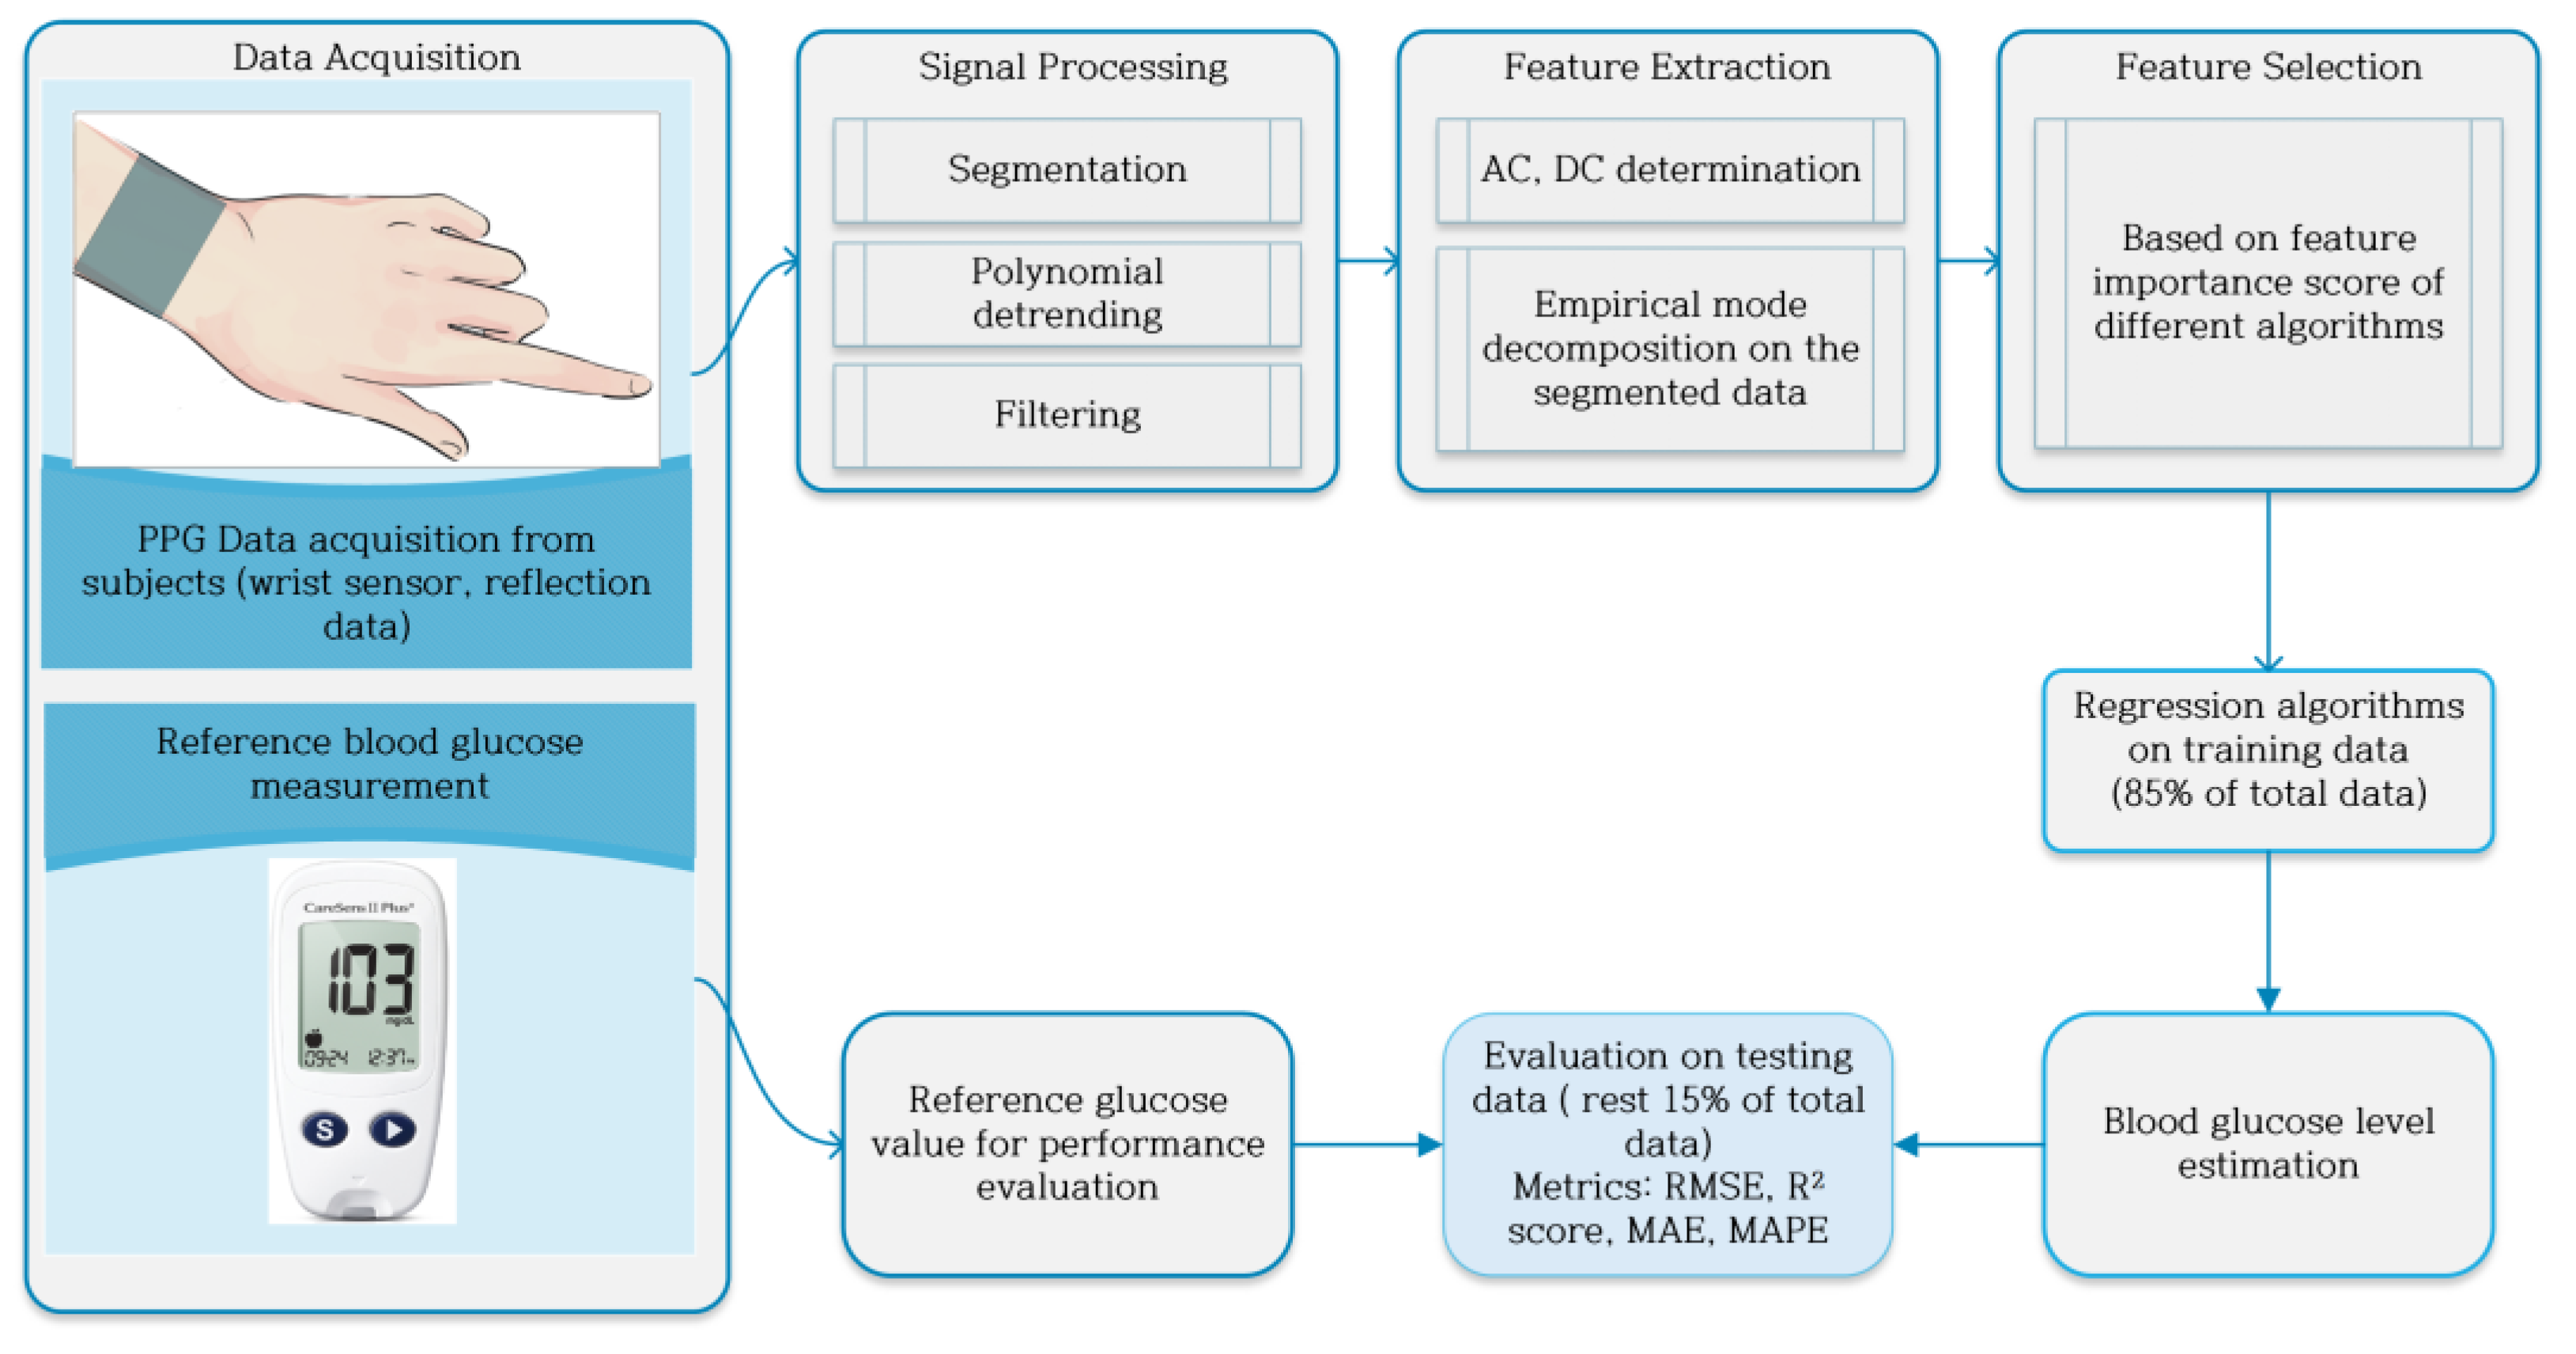
2. Materials and Methods

Figure 1 shows the system architecture for implementing the proposed method. The PPG signal is recorded using a wrist device and then undergoes the preprocessing steps. First, the data were segmented and filtered. Afterwards, a number of PPG waveform-based features were extracted and the EMD was also performed to obtain intrinsic mode functions (IMF). Both PPG –waveform-based and IMFs-based features were provided as input to the regression algorithm, and after feature selection, 50 features were selected to estimate the blood glucose levels. Results were evaluated on 15% test sample data and validated using reference glucometer data.

2.1. Data Acquisition

In this work, we employed a TMD 3719 sensor-based system containing a white LED (consisting of three wavelengths: blue (465 nm), green (525 nm), and red (615 nm)) and a photodetector. The CareSens II blood glucose meter was used to measure the actual corresponding blood glucose level and a simultaneous PPG signal was recorded for three minutes. The sampling rate for PPG data was 24 Hz. Data were collected from a total of 34 subjects. The entire data collection process was supervised and approved by the institutional review board (IRB) at Kookmin University, Seoul, Korea, and the IRB protocol number is KMU-202111-BR-286. Table 1 shows the dataset demographics of the 34 subjects. The male to female ratio of subjects is 50:50.

2.2. Segmentation

The PPG signal data are systematically segmented for feature analysis. The process begins with extracting data from CSV files, each containing PPG signal information including date, subject details, meal status, and blood glucose levels. The data are loaded into pandas DataFrames, and unnecessary columns are removed to focus only on the red, green, and blue (RGB) wavelength values. The segmentation process divides the continuous PPG signal into 30-s intervals. This is accomplished by splitting each complete DataFrame (the entire PPG signal record) into several smaller sub-DataFrames, each representing one of these 30-s windows. After removing certain columns, the data are converted to numpy arrays. These arrays are then layered to create a three-dimensional numpy array for each subject. This array captures the segmented RGB signal data over time. In the final step, we combine the data from all subjects into a standardized order. To maintain consistency, each subject’s data are truncated to the size of the smallest subject data length. The end result is a uniform three-dimensional array, containing segmented PPG signal data from all participants, ready for further analysis. With a sampling rate of 24 Hz, each of these smaller sub-DataFrames contains 720 samples, corresponding to a time span of 30 s.

2.3. Preprocessing

The raw PPG signal often contains noise and baseline drift due to factors such as breathing, motion artifacts, etc. To address this, polynomial detrending is used to remove the baseline drift, which is a low-frequency trend in the signal. This method involves fitting a polynomial (in our case a 3rd-order polynomial) to the raw data to match the slow drift, and then subtracting it to center the waveform. After detrending, high-frequency noise in PPG signal is smoothed using a 2nd order low-pass Butterworth filter with a cutoff frequency of 8 Hz. Additionally, residual low-frequency fluctuations are eliminated with a 2nd-order high pass filter with a cutoff frequency of 0.5 Hz.

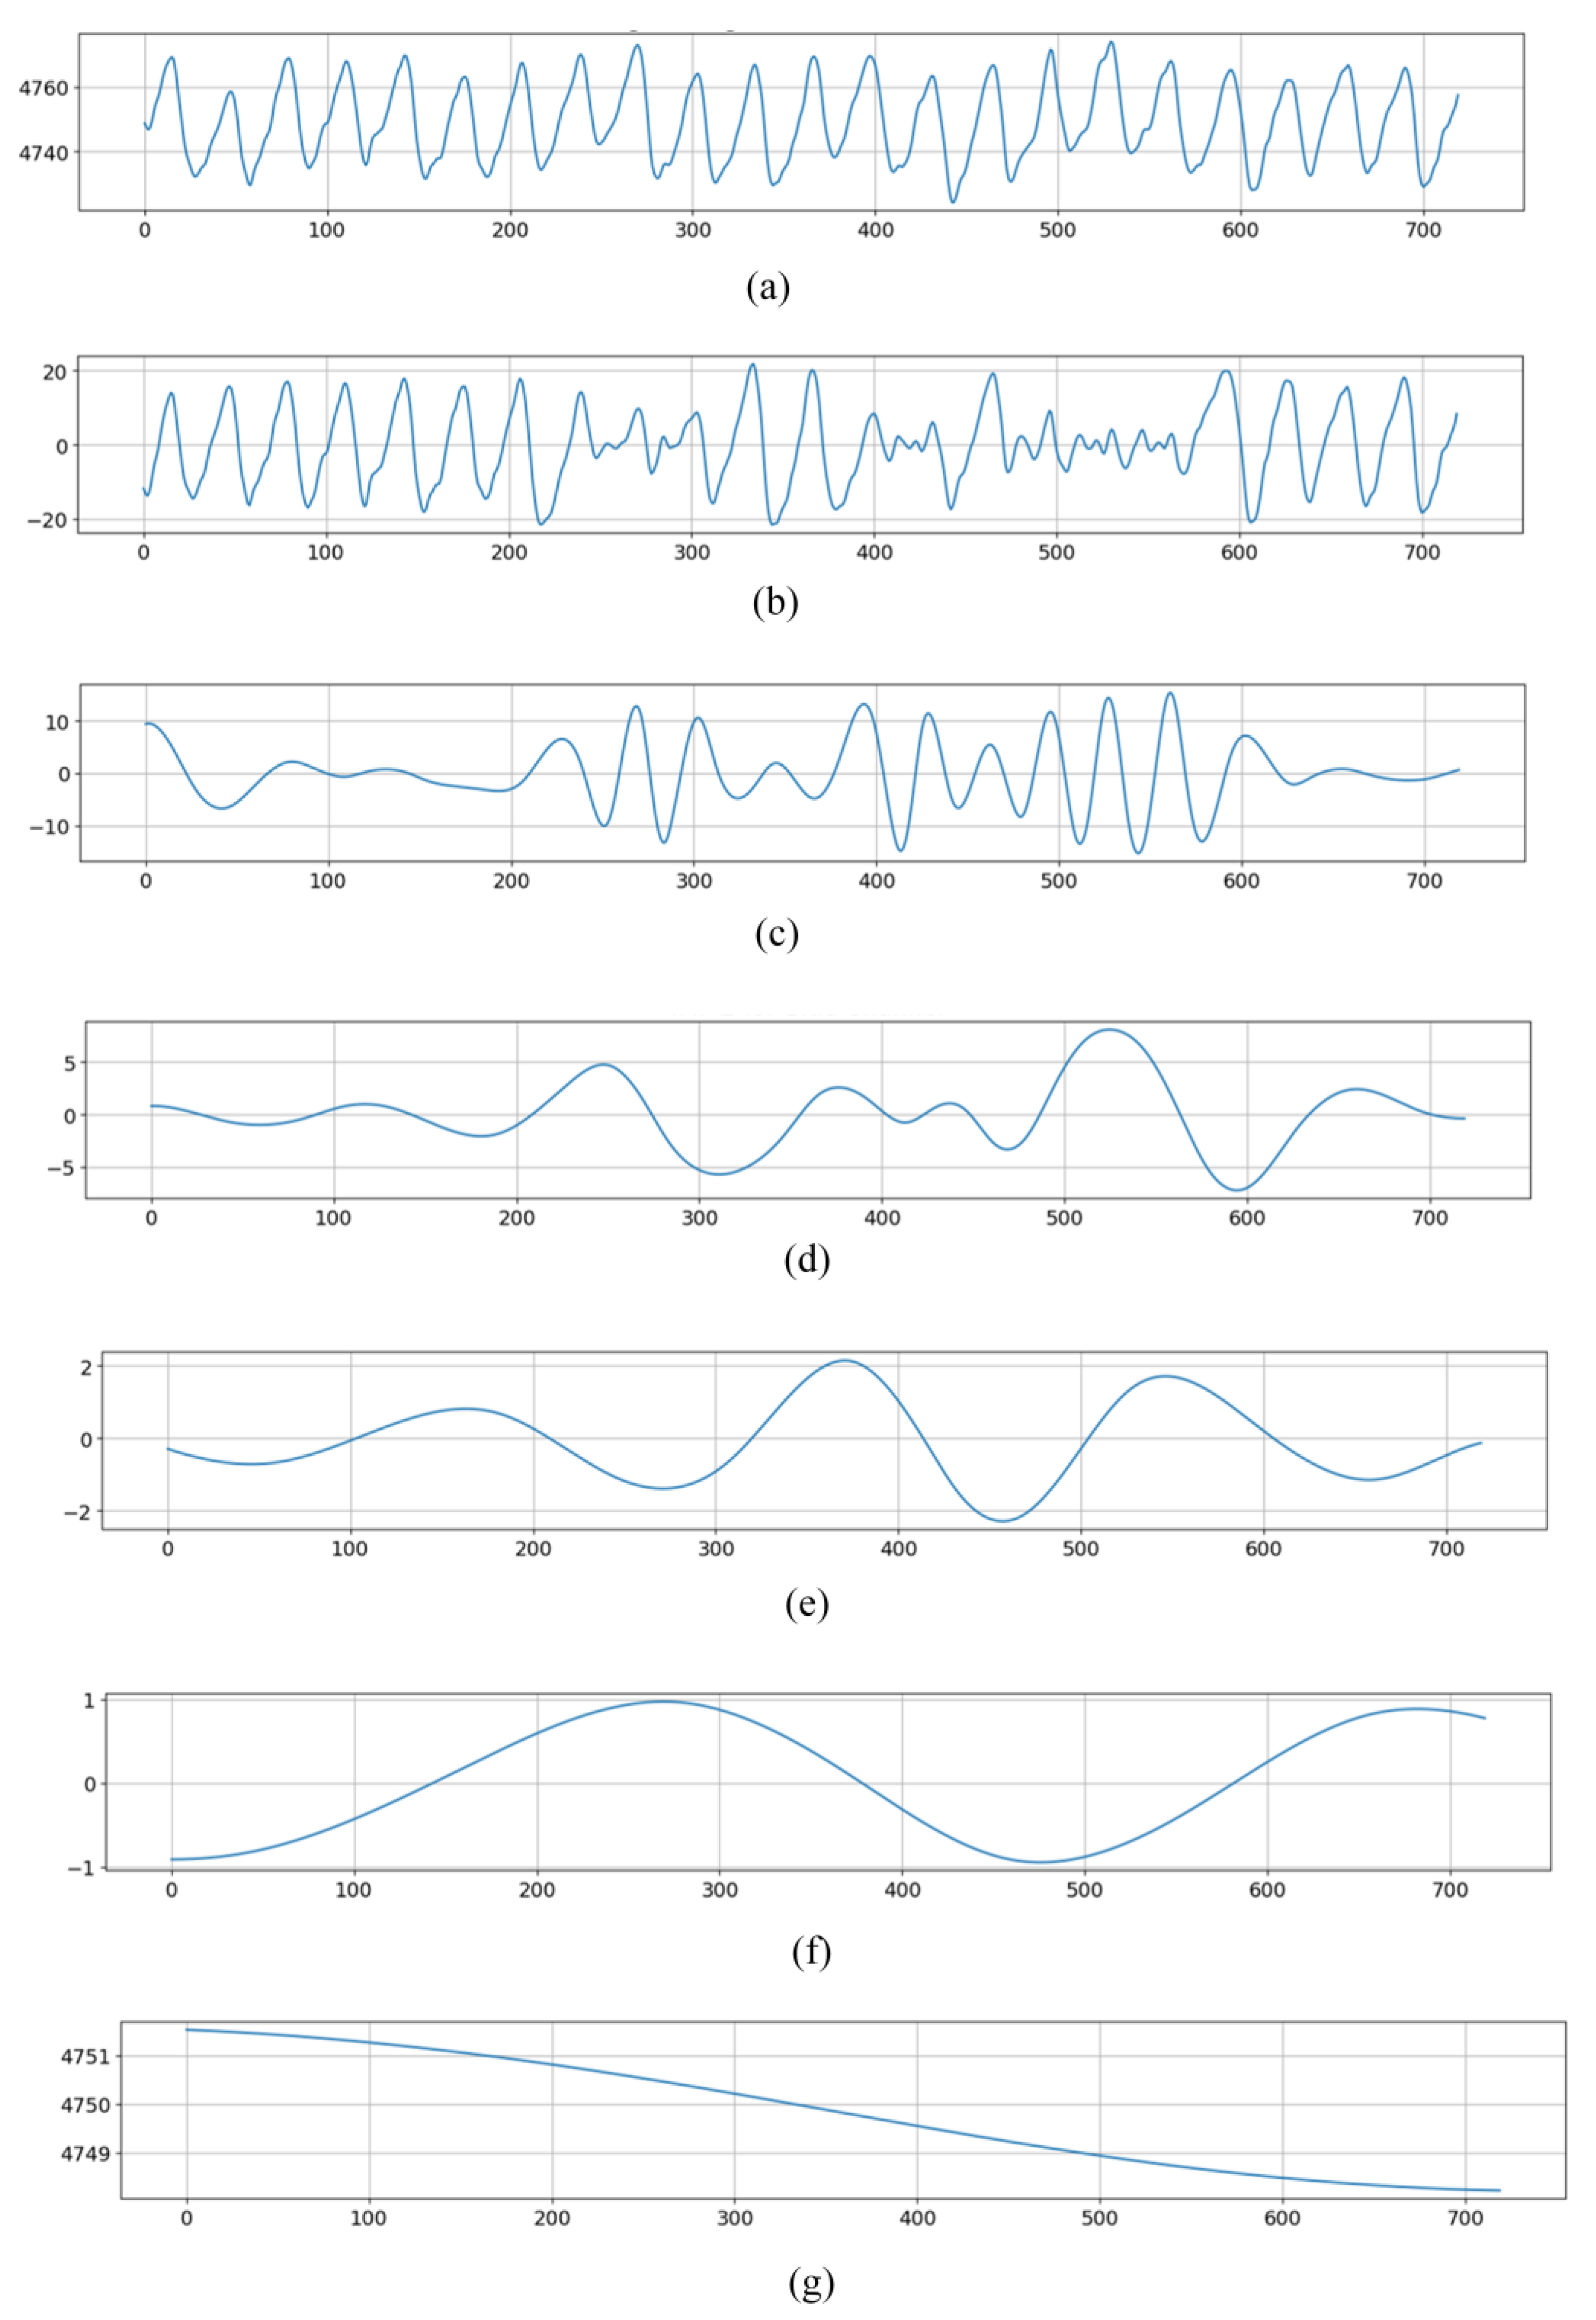
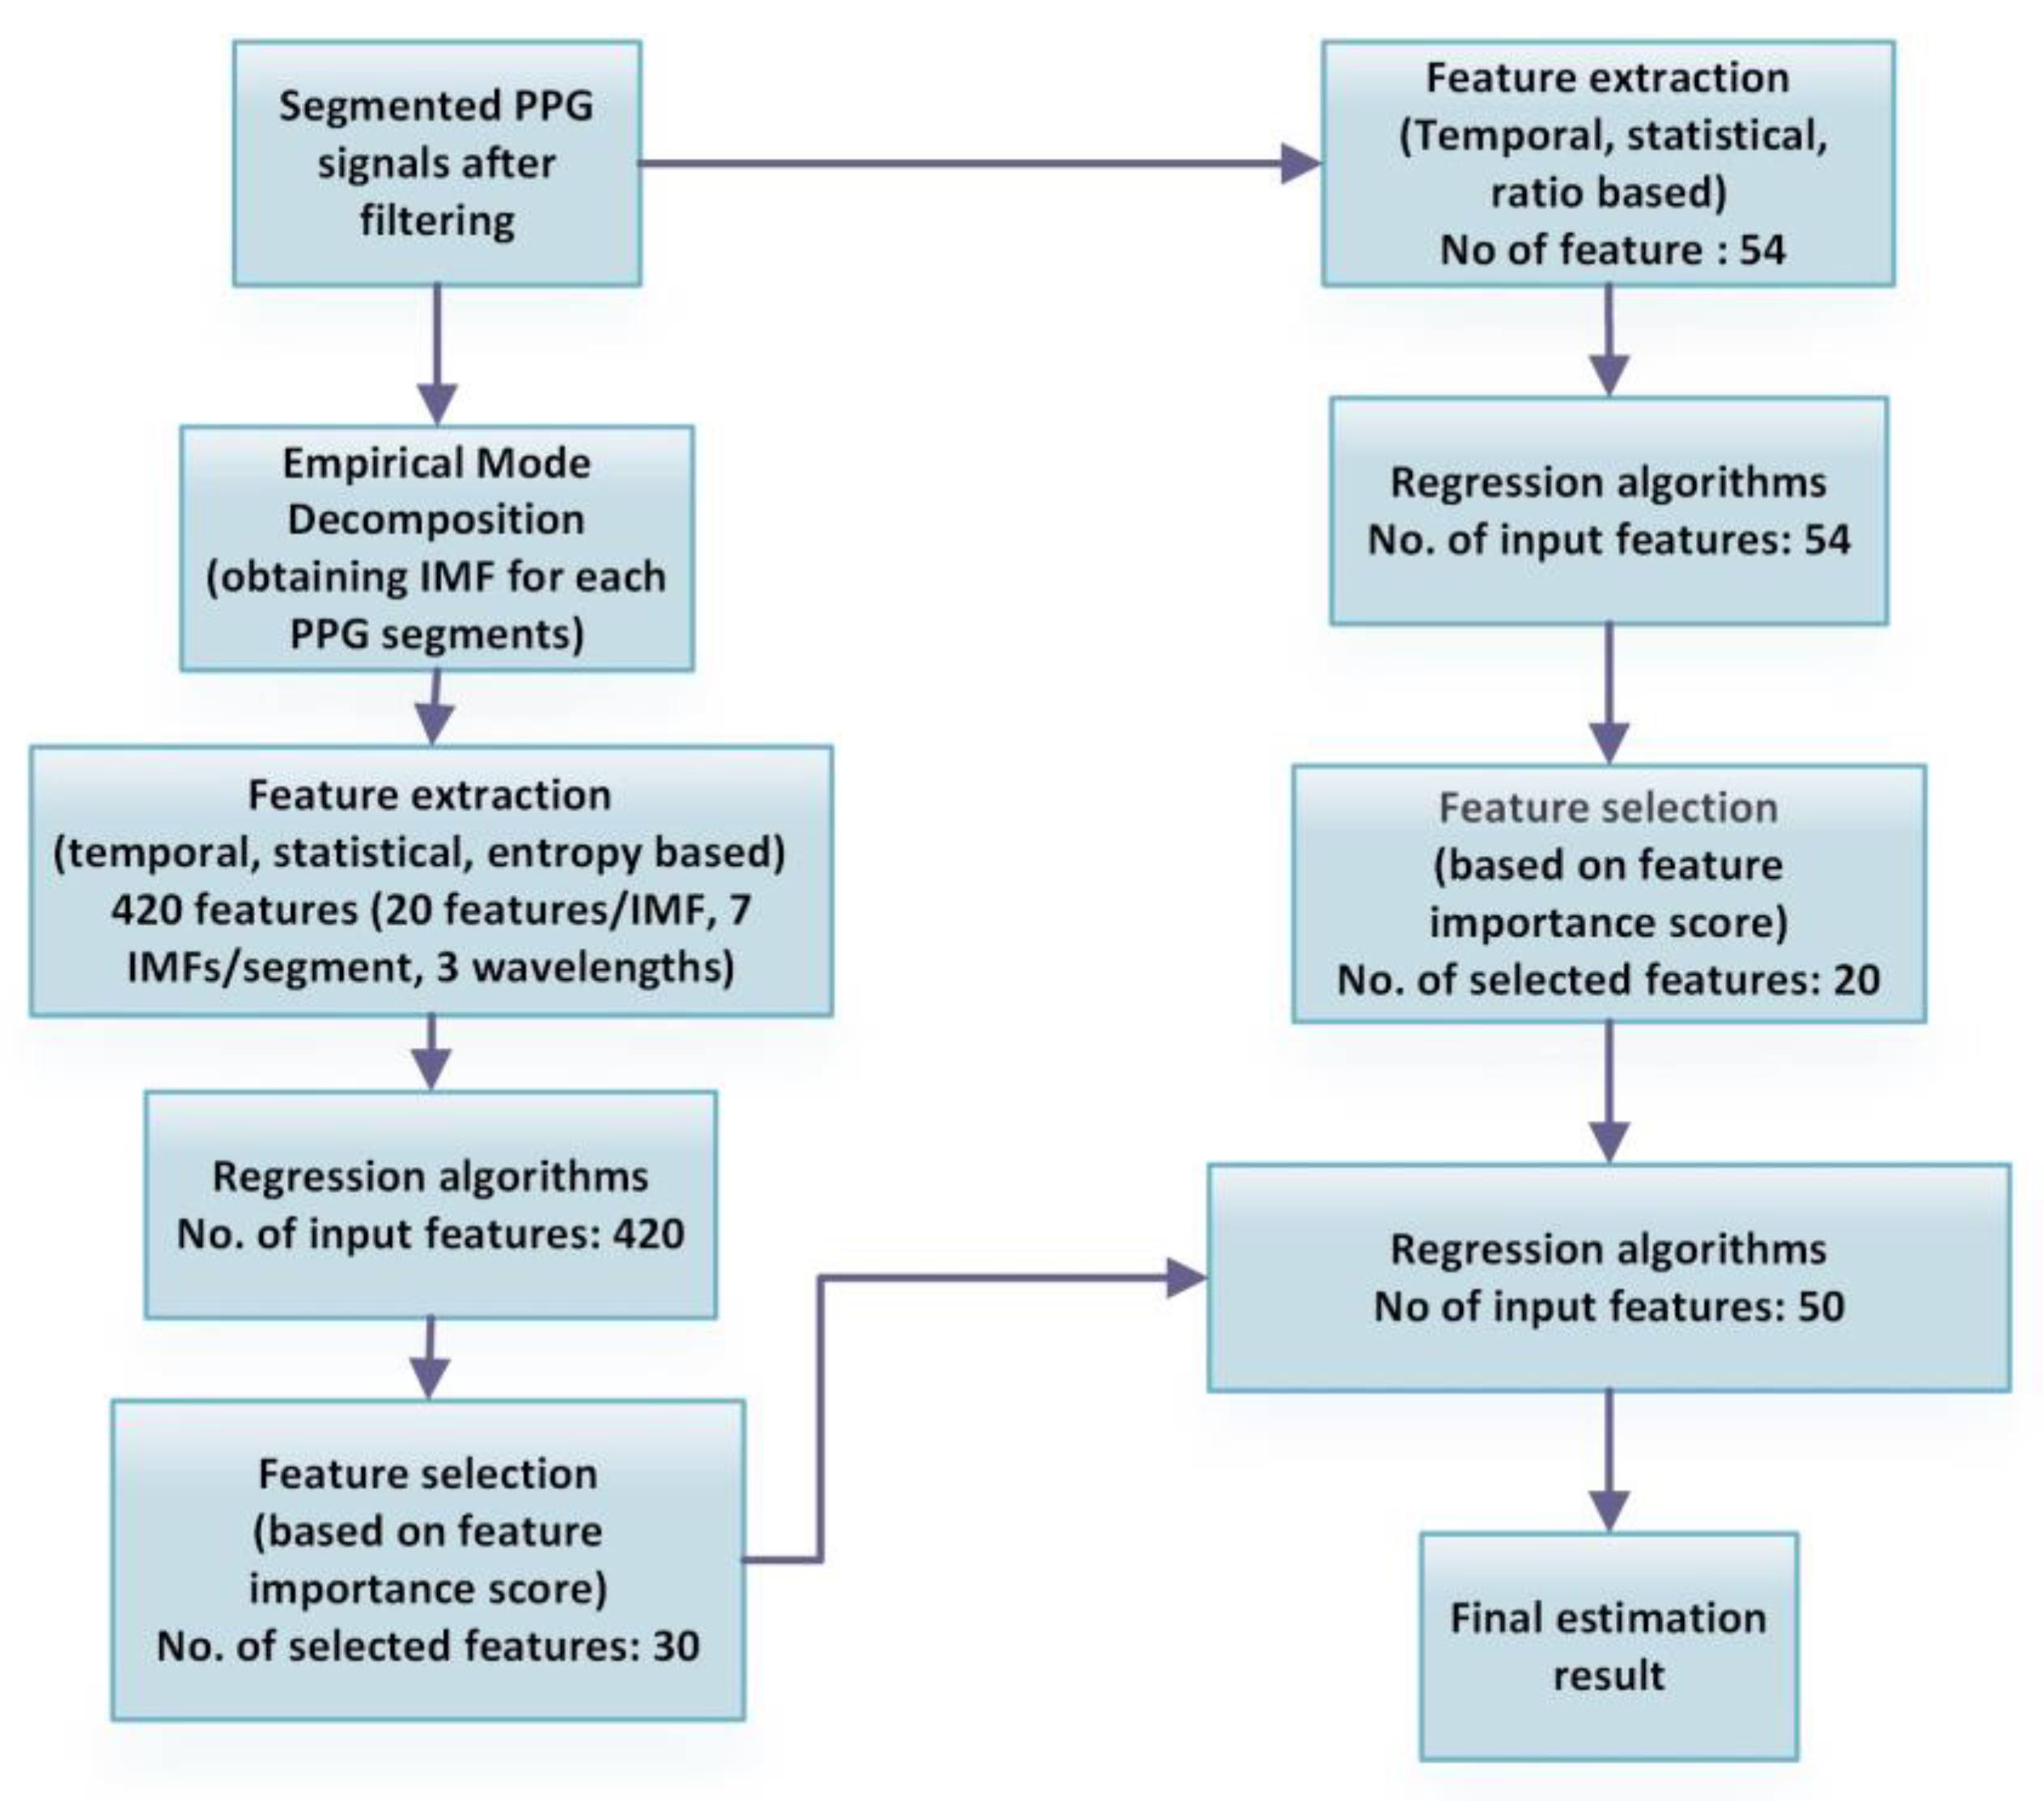
2.4. Empirical Mode Decomposition (EMD) on PPG Signals

EMD is a technique that decomposes a signal into its fundamental components, termed IMFs [14]. It employs a sifting process to identify peaks and troughs in the data to create upper and lower envelopes. The mean of these envelopes is then removed from the signal, isolating an IMF, which represents a basic oscillatory mode within the signal. Essentially, EMD aims to represent a signal as the sum of these IMFs and a residual. The ‘EMD’ class from the ‘PyEMD’ library was used to extract IMFs from the processed PPG signal. Each RGB channel of the segmented PPG data undergoes filtering before EMD is executed on each channel. Every IMF has certain characteristics: its upper and lower boundaries are symmetrical, and the number of points where they cross zero and the number of peaks (or troughs) differ by at most one. This means that the IMF must have at least one zero crossing and one peak (or trough). This condition ensures that the oscillatory characteristic of the IMF is consistent and regular. Figure 2 shows the decomposition of a blue channel signal of the first segment of subject 1 into its intrinsic mode functions (IMFs) as an example.
The initial IMF (IMF 1 at Figure 2b) captures the highest frequency oscillations with amplitudes around −20 to 20. Subsequent IMFs show progressively lower frequency oscillations and smaller amplitude ranges. IMF 2 at Figure 2c oscillates between about −10 to 10, IMF 3 at Figure 2d oscillates with smoother oscillations between −5 and 5, and IMF 4 depicted in at Figure 2e shows much wider oscillations within an amplitude of −2 to 2. The fifth IMF (IMF 5 at Figure 2f) has a very narrow amplitude ranging from −1 to 1, indicating very smooth oscillations. The last IMF or residual (Figure 2g) shows a nearly constant trend with amplitudes around 4750, indicating a low-frequency drift in the signal.

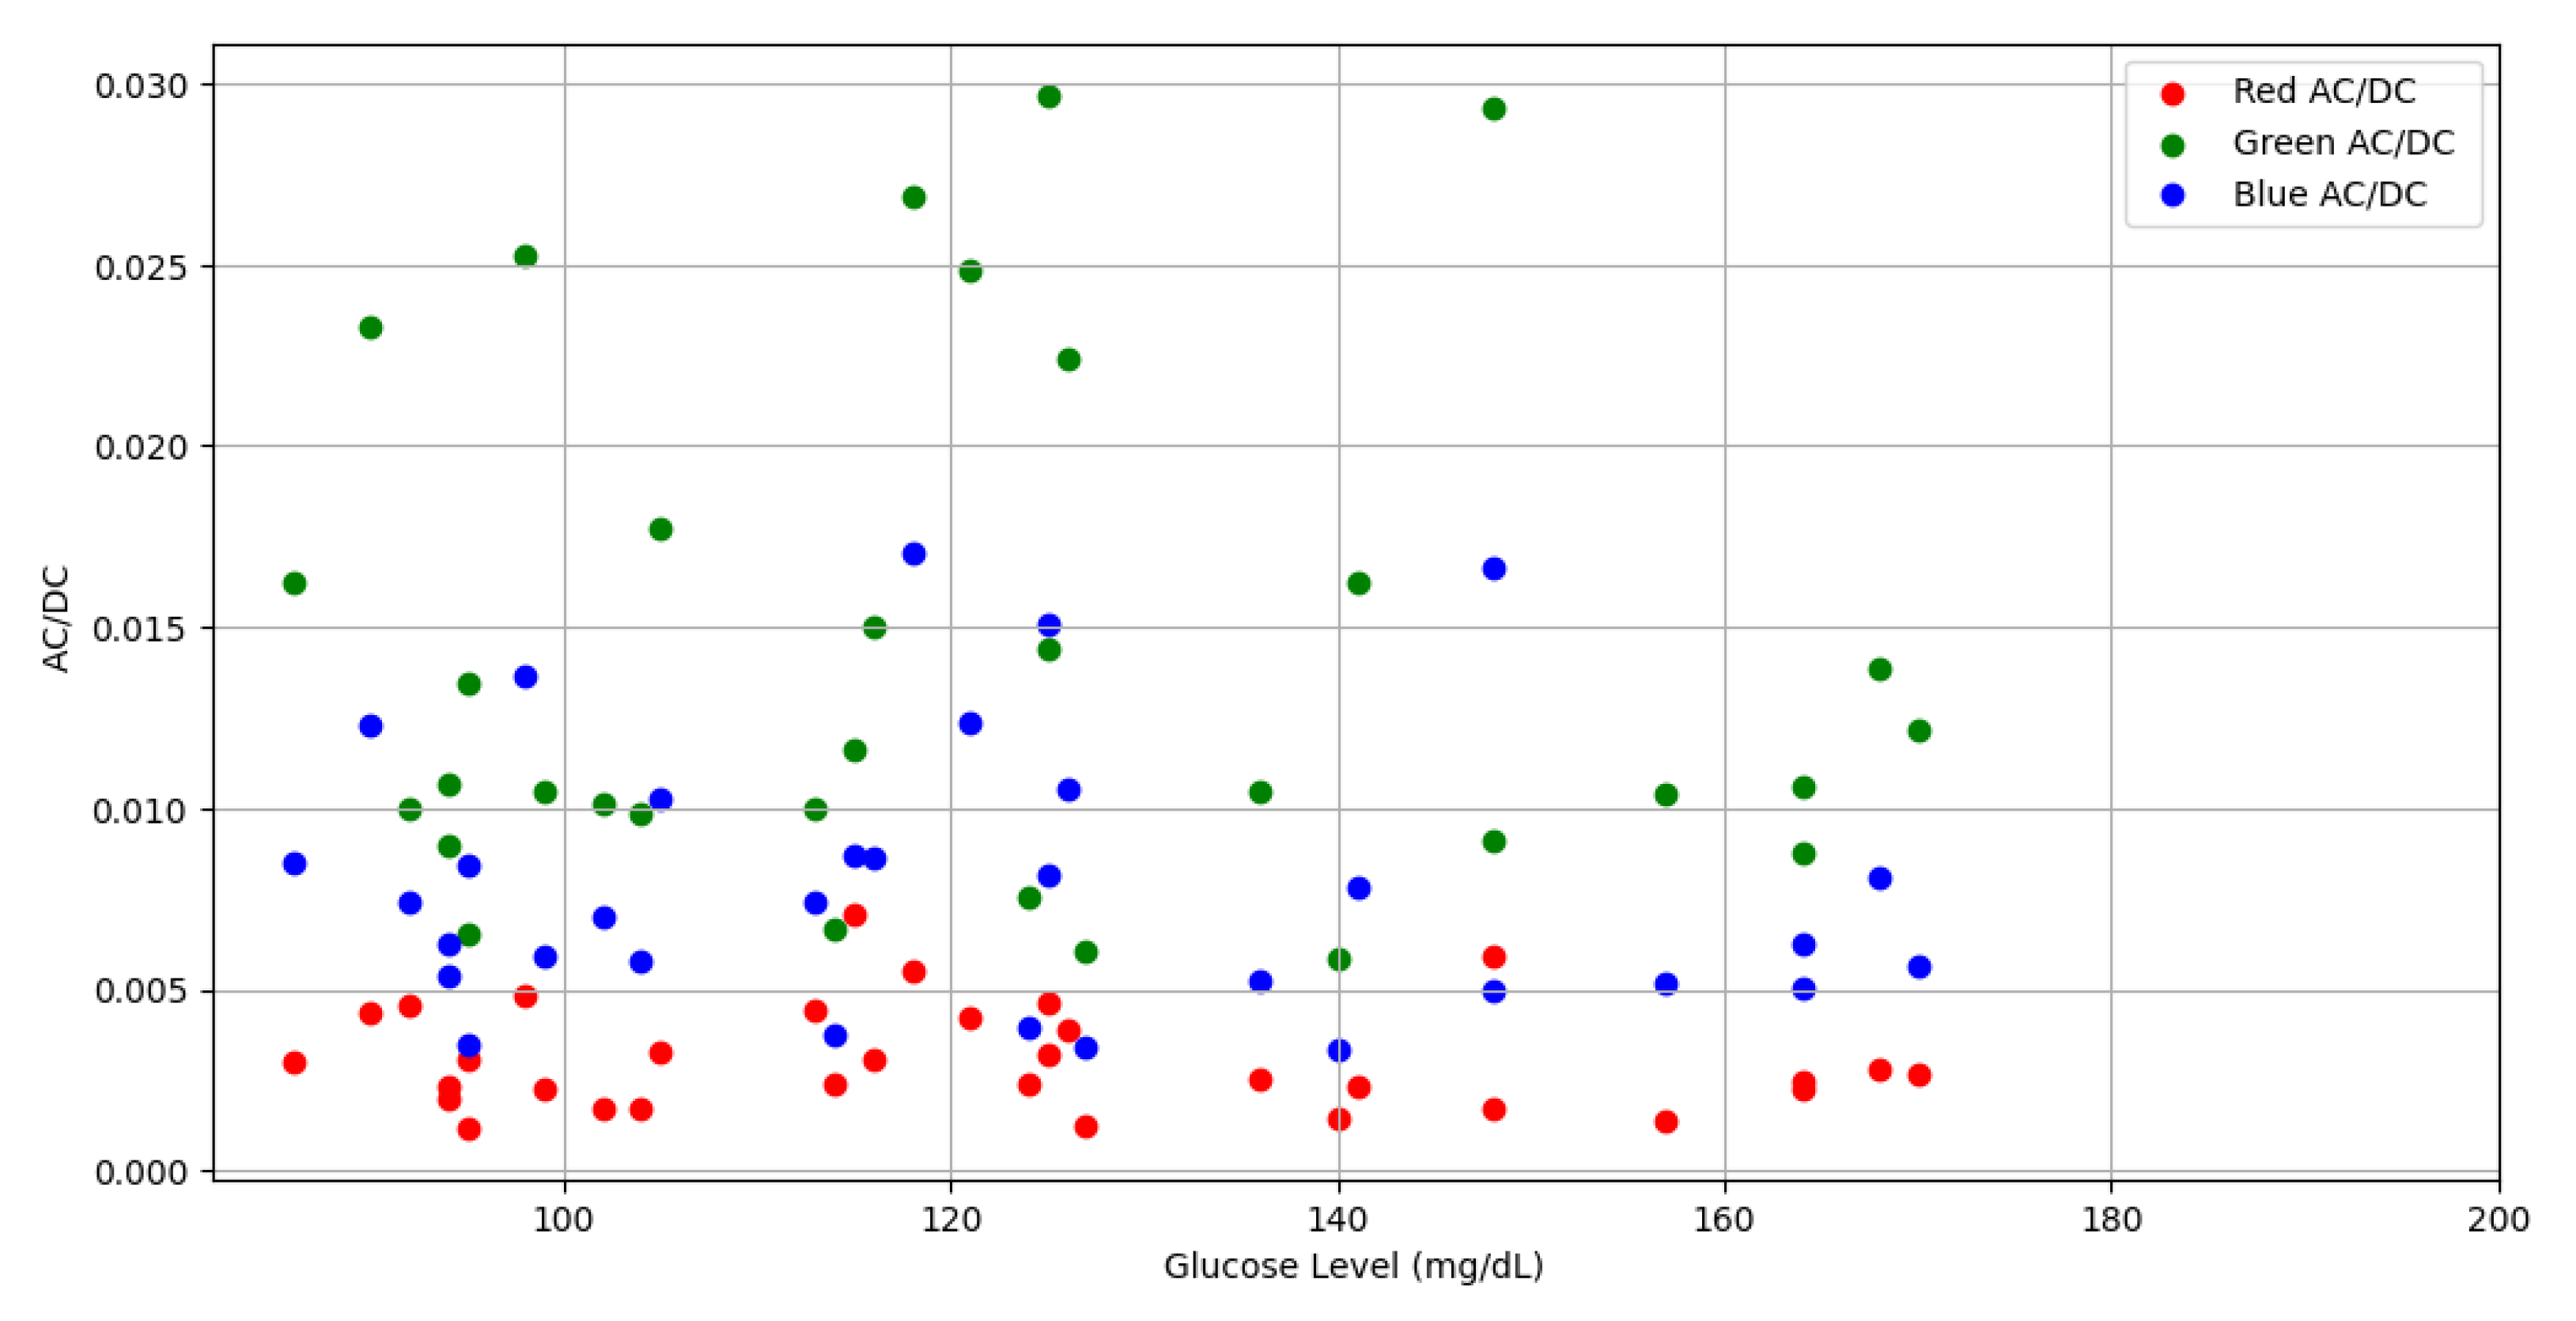
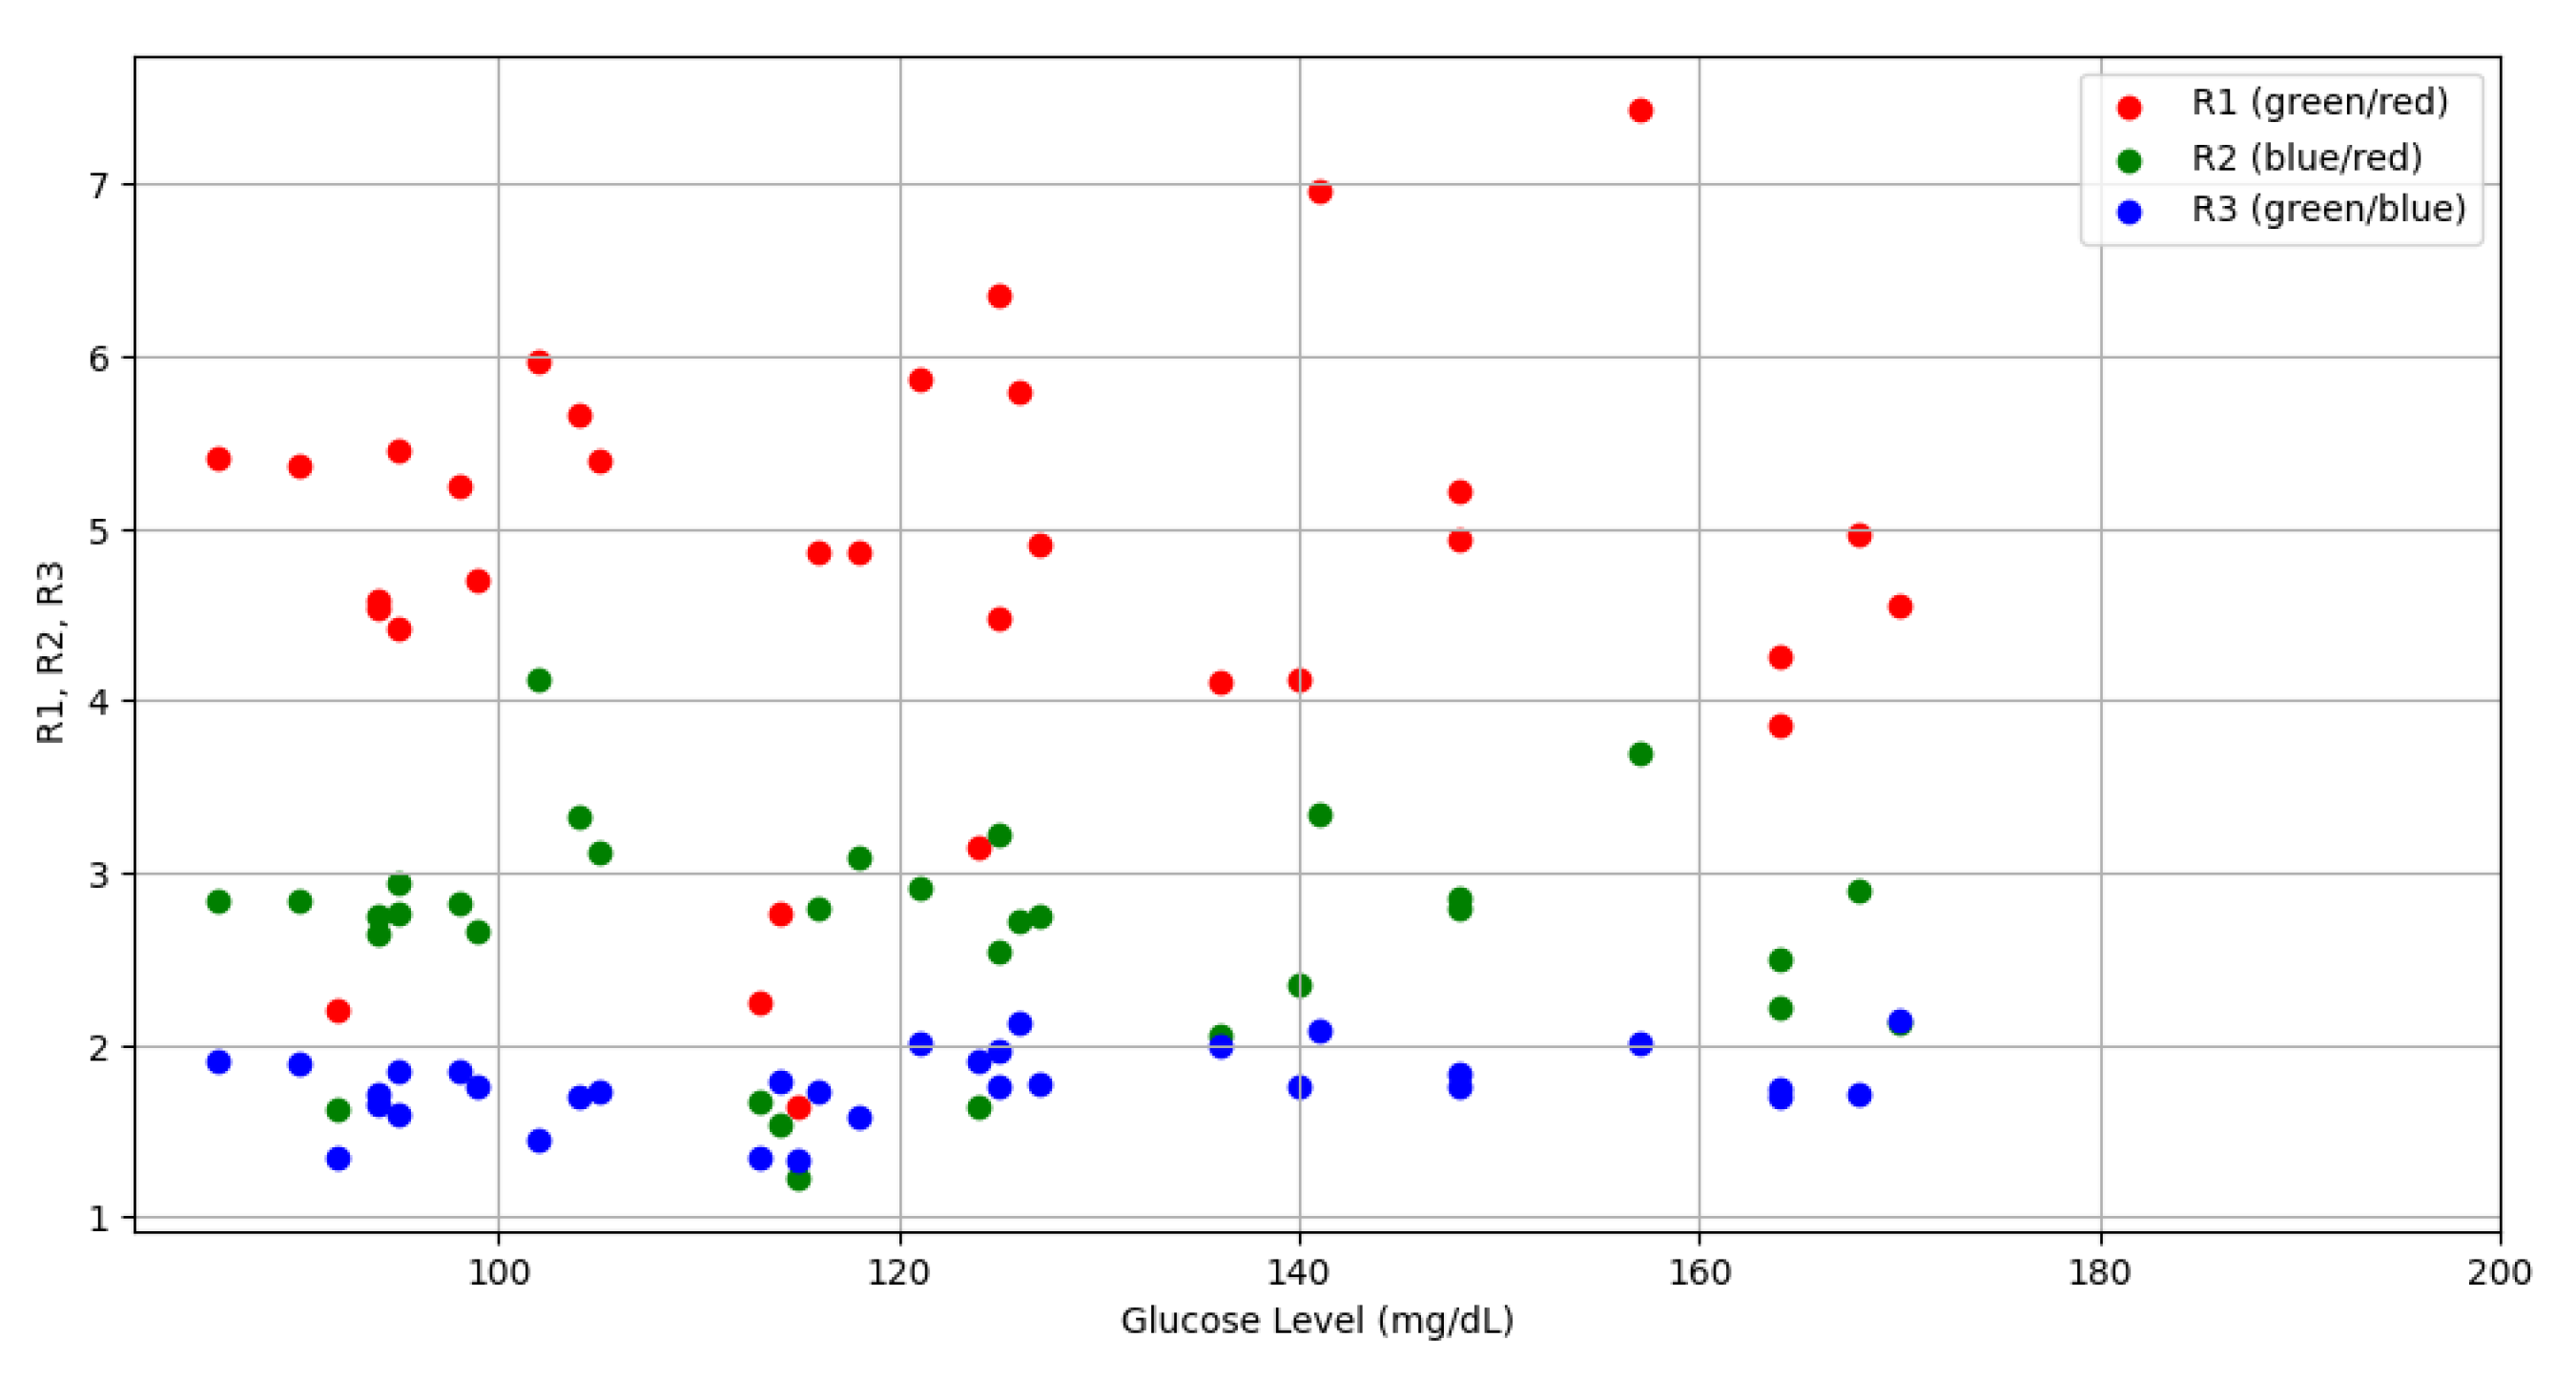
2.5. Ratio Features from PPG Signals

We used AC/DCs of the PPG signal as features and their ratios (ratios of different wavelength AC/DCs) also as features for effective blood glucose estimation.

2.5.1. AC/DCs as Features

The AC-to-DC ratio (AC/DC) represents the ratio of the pulsatile (i.e., AC) to the baseline or static (i.e., DC) component of the PPG signal. The relation between the AC/DC value and blood glucose level may be causal. However, there is not much research on this subject. A proportional association between AC/DC values and glucose levels was demonstrated in one study [15]. The relationship between blood glucose levels and AC/DC values of PPG signals was demonstrated in another study [16]. A recent study [17] showed a correlation between perfusion index (PI) and blood glucose concentration. The perfusion index is a measure of pulse strength in a specific area of the body and is a relative assessment of the blood flow to that area and similar to the AC/DC. They suggested that AC/DC as PI could be a reliable indicator for noninvasive blood glucose estimation. Blood glucose affects light scattering, and as glucose level in the blood rises, the amount of light scattered decreases. As a result, the total absorbed light decreases. PI, which depends linearly on the magnitude of the pulsatile component of blood flow, also decreases. They showed a negative linear correlation between PI and blood glucose concentration. The AC (or DC) detection from a PPG signal was performed using the AC (or DC) determination algorithm [18]. Figure 3 shows AC/DC values versus glucose levels for 34 subjects used in this study.
The observed characteristics of the PPG signal are influenced by the wavelength of the light used in PPG sensors. In Figure 3, we can see the higher AC/DC for green wavelength compared with red and blue wavelengths. The AC/DC value of the reflected PPG signal, which is a critical factor in determining the quality of the PPG signal, varies with the light wavelength. Specifically, green and yellow light yield higher AC/DC values, typically between 3 and 5%, while red and infrared (IR) light produce a significantly lower value, about 0.5 to 1% [19]. This variation is important because a higher AC/DC value generally indicates a stronger PPG signal. Also, the green light has an inherently higher perfusion index (PI), which correlates with a stronger PPG signal [20].

2.5.2. R1, R2, and R3 as Features

R1, R2, and R3 represent ratios of different AC/DC values of the PPG signal. It can also be defined as ratio of ratios [21]. For all three wavelengths used in this study, R1 was considered as the ratio of the green AC/DC to red AC/DC, R2 was considered as a ratio of the blue AC/DC to the red AC/DC and R3 was considered as a ratio of green AC/DC to the blue AC/DC. These are expressed in the following equations.
R 1 = A C D C g r e e n A C D C r e d
R 2 = A C D C b l u e A C D C r e d
R 3 = A C D C g r e e n A C D C b l u e
In PPG, the absorbance of light by blood is directly related to the amount of blood flowing through the tissue. This is because the light absorption changes with the pulsation of blood flow, which corresponds to the heartbeats. The PPG signal consists of both an AC component (a pulsatile component related to cardiac cycle) and a DC component (a non-pulsatile component related to tissue structure). The absorbance for each wavelength can be determined by the ratio of the AC component to the DC component of the PPG signal. This ratio reflects how much light is being absorbed by pulsating blood compared to the baseline blood volume. The term “ratio of ratios” comes from how SpO2 is calculated in the study [21]. It involves taking the ratio of the AC/DC value for red light and dividing it by the AC/DC value for infrared light. In that formula, each AC/DC value is a measure of absorbance at a specific wavelength, and thus the term “ratio of absorbances” is used. The division of these two AC to DC ratios (red and infrared) yields the “ratio of ratios”. These ratios are derived from the PPG signal and calculated on the basis of three different wavelengths and their combination in this study.
R1, R2, and R3 are important metrics in assessing the strength of a PPG signal as they provide a normalized comparison of the AC and DC components of the signal and can provide important information about cardiac output and peripheral perfusion. These calculated ratios, derived from multi-wavelength PPG data, have been utilized as features in this study to improve blood glucose level predictions. Figure 4 shows the trends of R1, R2, and R3 versus glucose levels for 34 subjects. As shown in Figure 4, the R3 value is the smallest compared to R1 and R2. As the red signal intensity is smaller, R1 and R2 are relatively larger than R3.

2.6. Feature Extraction from PPG Waveforms

Fifteen PPG-based general features were extracted at each of the three wavelengths. The 15 features are zero-crossing rate (ZCR), autocorrelation (ACR), kurtosis (kurt), variance (var), and mean of power spectral density (PSD); kurtosis (kurt), variance (var), mean, and skewness (skew) of Kaiser-Teager energy (KTE); kurtosis (kurt) and skewness (skew) of spectral analysis (spec); mean of wavelet analysis; autoregressive (AR) coefficients; skewness and sum of absolute difference (SAD). The feature vector and detailed explanation of these PPG waveform-based features can be found in [9]. One of these 15 features is auto- regressive coefficient feature, and we employed the Yule-Walker method to determine the auto-regressive coefficients with an order of 2, yielding 3 additional features. Therefore, a total of 48 PPG waveform-based features were extracted for three wavelengths, consisting of 16 features for each wavelength. In addition to this, 3 AC/DCs and 3 ratios (R1, R2, R3) were also included as features, and a total of 54 features were considered in this study. Figure 5 shows the top 20 important features out of PPG waveform-based 54 features.

2.7. Feature Extraction from IMF-Based Features Obtained through EMD

Each PPG signal segment was decomposed into intrinsic mode functions (IMFs) using empirical mode decomposition (EMD), from which time- and frequency-domain features were derived. Specifically, 20 features were computed for each IMF: mean ( I M F m e a n ) , variance ( I M F v a r ) , standard deviation ( I M F s t d ) , peak-to-peak amplitude (PTP), skewness ( I M F s k e w ) , kurtosis ( I M F k u r t ) , dominant frequency ( F d ) , total power ( P t ) mean amplitude envelope ( A E m e a n ) mean instantaneous frequency ( I F m e a n ) , zero crossing rate (ZCR), extrema (ext), mean power spectral density ( P S D m e a n ), PSD variance ( P S D v a r ) , spectral centroid (SC), spectral entropy (SE), spectral flatness (SF), peak to spectral energy ratio (PSER), spectral band energy (SBE), spectral slope (SS). Basic statistical and frequency domain features such as mean, variance, standard deviation, peak-to-peak amplitude, skewness, kurtosis, dominant frequency, total power, and zero crossings are computed using standard definitions that are well-established in the literature. For features related to power spectral density (PSD), we have adhered to the procedure described in [9]. Descriptions and computational methods for the specific IMF-based features are detailed in Appendix A.
Due to the varying number of IMFs across different wavelengths (red, green, and blue), zero padding was employed to equalize the feature sets. This ensured uniformity in cases where the number of IMFs observed in some signal segments did not reach the maximum of seven. For example, if six IMFs are generated from a red signal while seven IMFs are generated from a blue signal, the seventh IMF feature set of the red signal will be padded with zeros. Therefore, we have a total of 420 IMFs-based features for three wavelengths. From these extensive feature sets, we applied feature importance scores, and Figure 6 shows the top 30 important features out of 420 features for blood glucose estimation through EMD.
The overall feature extraction and selection procedure is illustrated in the flowchart of Figure 7. Feature selection is primarily guided by the importance of each feature, evaluated using different methods depending on the model. For random forest, the Gini importance method was used, while for XGBoost and CatBoost, gain-based approaches were employed. The evaluation of LightGBM included both split- and gain-based methods. We then improved the model’s performance by selecting the most significant features based on the feature importance.

2.8. Application of IMF-Based Features Obtained through EMD

Intrinsic mode functions (IMFs) derived from empirical mode decomposition (EMD) have been successfully applied in various studies to extract meaningful features from physiological signals for health parameter estimation. For instance, IMF-based features have been utilized for stress level and cognitive load detection from PPG signals [22]. Similarly, in the neurophysiology domain, features such as Shannon’s entropy, spectral entropy, standard deviation, skewness, and kurtosis extracted from IMFs have proven effective in diagnosing sleep disorders through electroencephalogram (EEG) signal analysis [23]. Furthermore, energy features derived from IMFs have been utilized in heart rate variability studies for stress detection [24]. These findings highlight the potential of IMF-based features obtained from EMD in capturing relevant information from physiological signals, including PPG, for the estimation of various health parameters. As IMF-based features have not previously been used specifically for blood glucose estimation, we intended to explore their potential for estimating blood glucose levels from PPG signals, given their demonstrated applications in related biomedical fields.

2.9. Comparative Analysis between Wavelet Transform-Based Features and EMD-Based Features for Blood Glucose Estimation from PPG Signals

Both EMD and wavelet transform are suitable techniques for analyzing nonlinear and nonstationary signals. While EMD adaptively decomposes a signal into its intrinsic oscillatory modes, the wavelet transform decomposes the signal into components in various frequency bands. EMD is completely data-driven and does not require a predefined basis function, whereas the wavelet transform is more mathematically defined and allows for multi-resolution analysis. A recent study [25] has gathered various noninvasive technologies for blood glucose measurement, highlighting a range of features that can be used effectively for glucose level estimation. The study demonstrated the extraction of features from PPG signals shown in different research and discussed the application of machine learning techniques to predict blood glucose levels. A detailed description about wavelet transform-based feature wavelet entropy can also be found in [25]. The wavelet transform provides detailed insights into PPG signal features by decomposing it into wavelet coefficients providing multi-resolution analysis. On the other hand, the EMD analysis proposed in this study is an adaptive method that decomposes the signal into intrinsic mode functions that represent simple oscillations. It is especially effective for nonlinear, nonstationary data, working directly with the data without a fixed basis. The key advantage of EMD over wavelet transform lies in its adaptability and direct extraction of data-driven features. Another study [26] utilized wavelet transform for denoising and removal of baseline drift. EMD can also be an alternative to signal preprocessing for noise reduction by selectively excluding high- and low-frequency noise from the IMF representation.

3. Results and Discussion

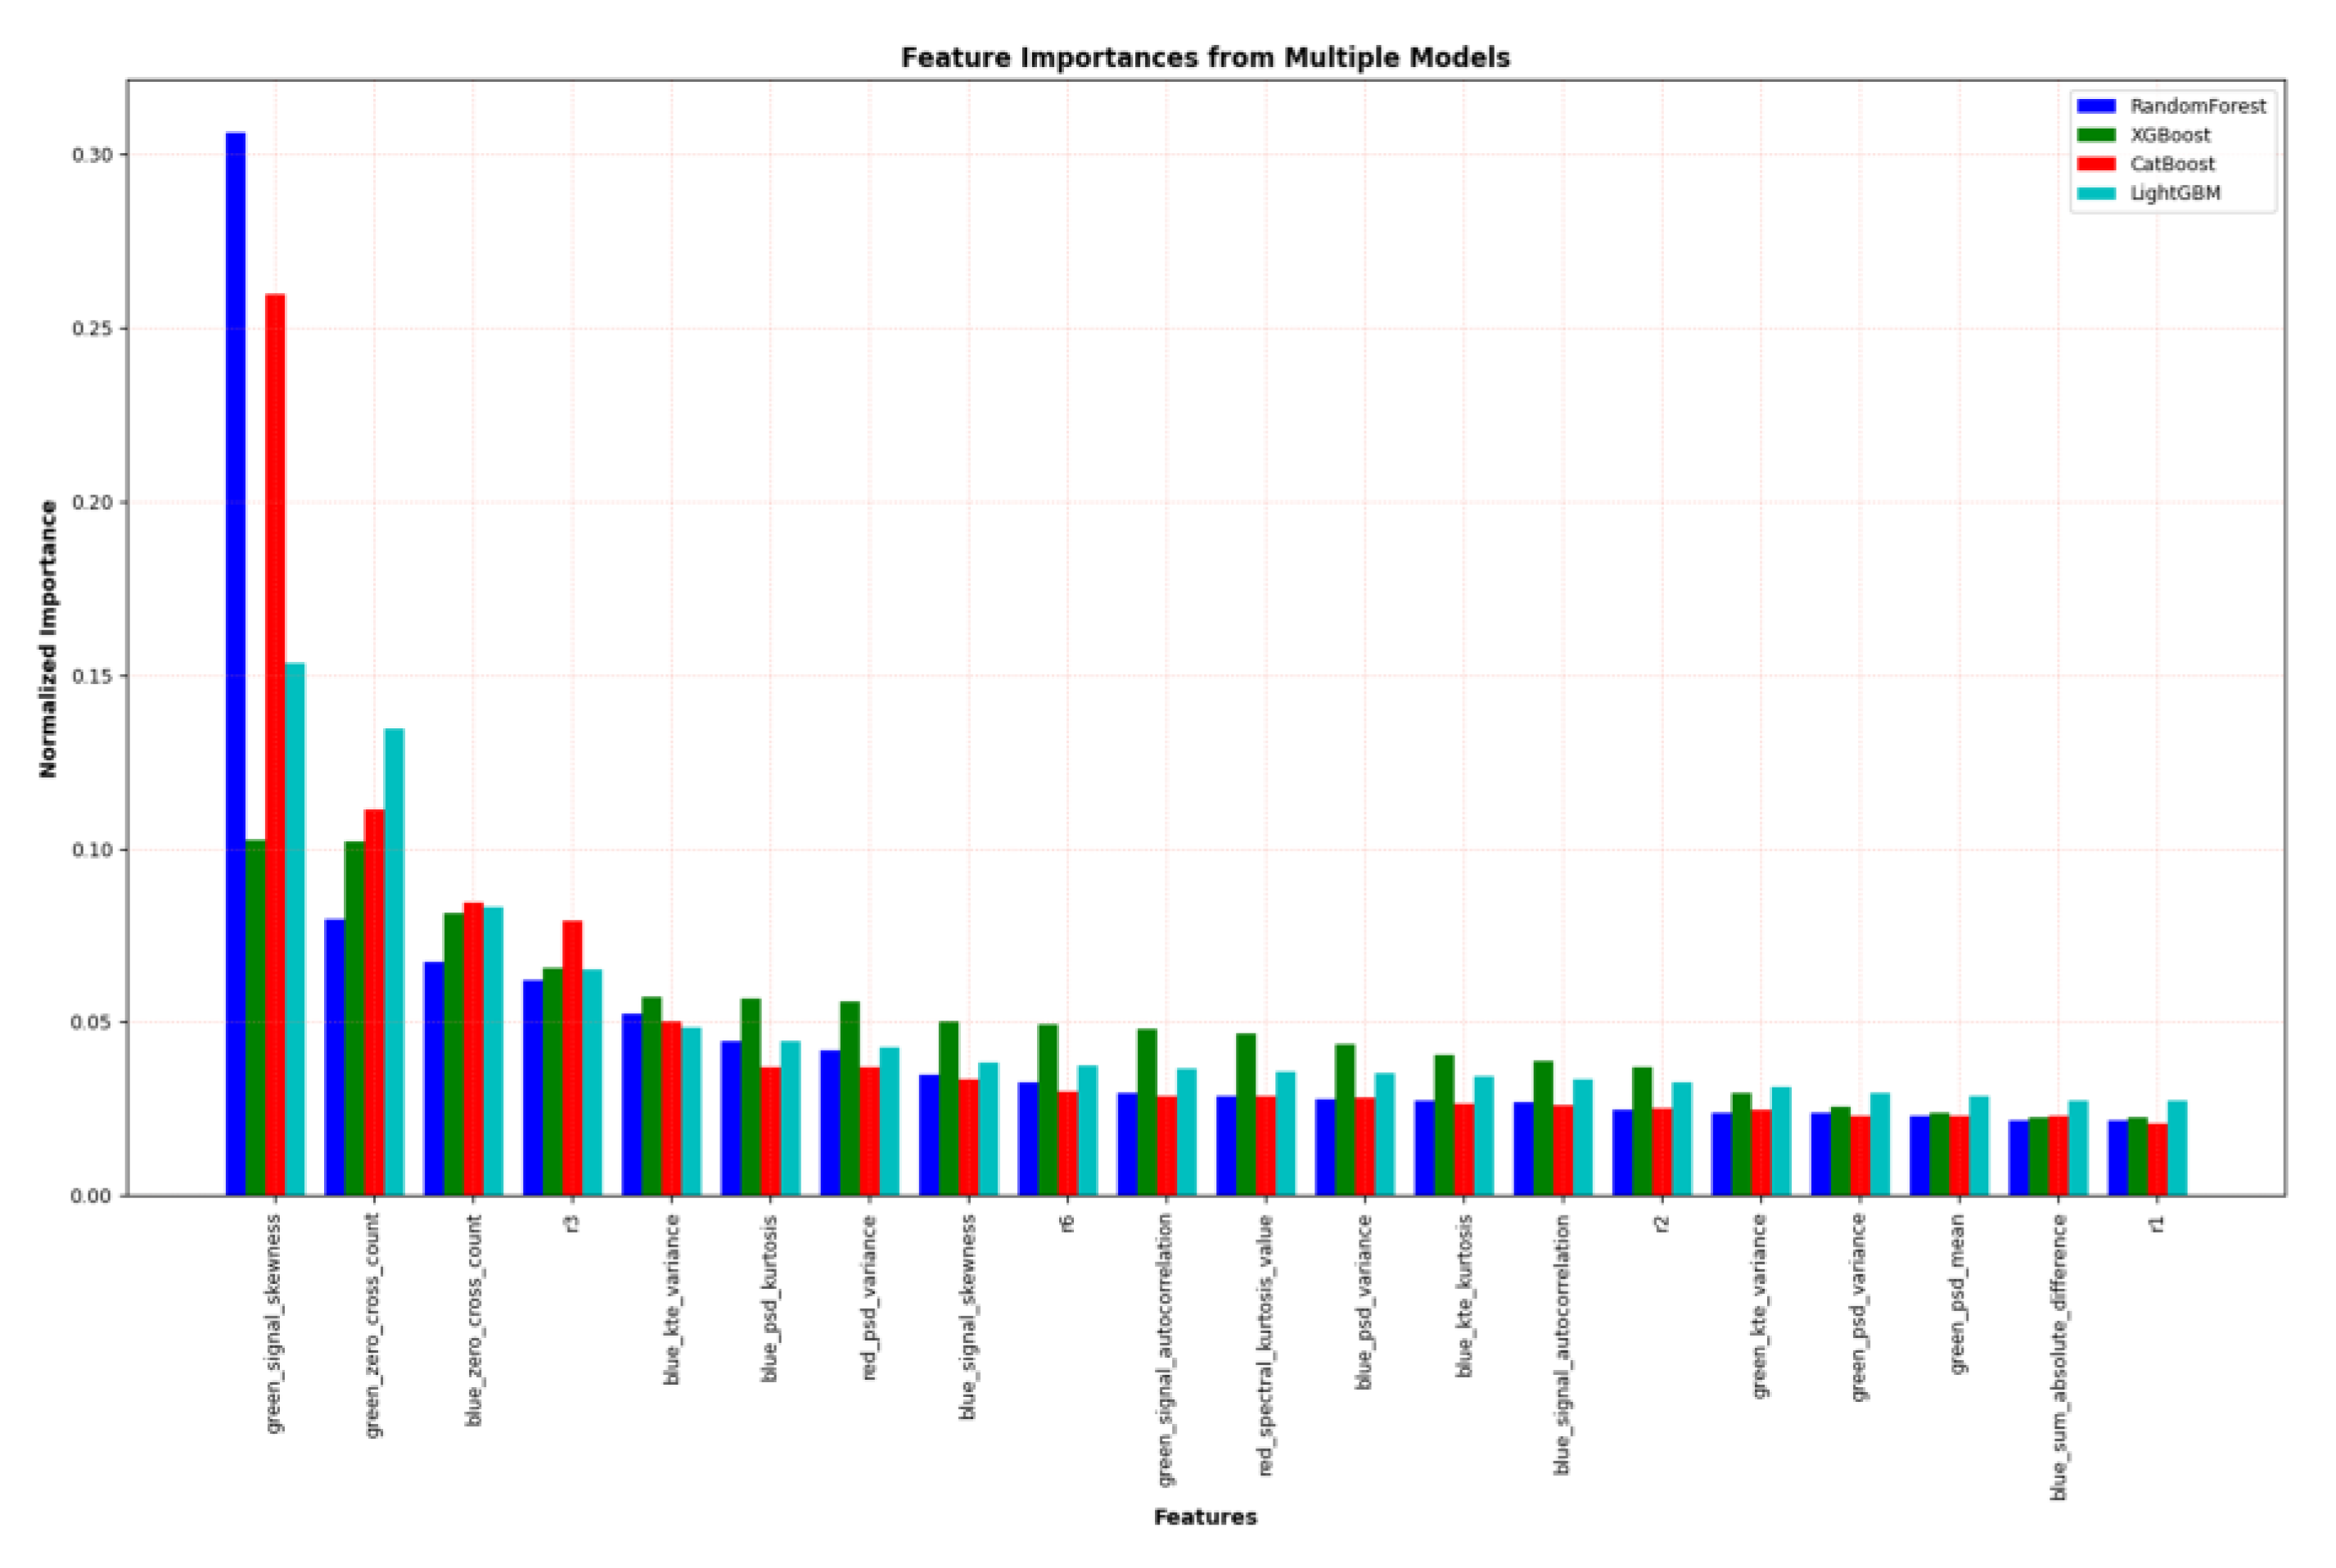
3.1. Performance Using PPG Waveform-Based Features

The dataset provided in Table 1 was used to evaluate the performance of four machine learning models: random forest (RF), XGBoost, LightGBM, and CatBoost in estimating blood glucose levels. These specific algorithms were selected based on their proven effectiveness in comparable prediction tasks [27,28]. Their robust nature and ability to identify complex patterns in data, mentioned in [29], also contributed to their selection. To reduce the risk of overfitting, careful adjustment of hyperparameters was undertaken. Additionally, the separation of training and testing data allowed for close monitoring of both training and testing errors. It was observed that in no instances did the training error fall below the testing error which indicates the overfitting. These four algorithms were evaluated utilizing a set of 54 features on the test dataset and leave one out cross validation (LOOCV) method was used for training dataset. Table 2 displays the relationship between predicted and actual blood glucose values using various regression metrics. This includes the Pearson correlation coefficient (Pearson’s r), along with other important measures such as root mean squared error (RMSE), R2 score, mean absolute percentage error (MAPE) and mean absolute error (MAE).
From Table 2, we can see that the CatBoost algorithm performs better than other algorithms when we use PPG waveform-based features. The fact that the random forest (RF) model exhibits a lower mean absolute error (MAE) and MAPE compared to other algorithms may be attributed to the variance in performance variation over a wide range of glucose values. Afterwards, feature importance-based selection was done for four algorithms. The 20 features depicted in Figure 5 were applied as input to the regression algorithms and results are shown in Table 3.
After feature selection, the performance of RF, XGB, and CatBoost improved, however the performance of LightGBM was almost the same. LightGBM is known for handling large sets of features well due to its efficient implementation of gradient boosting, and its performance does not improve much when the number of features is reduced.

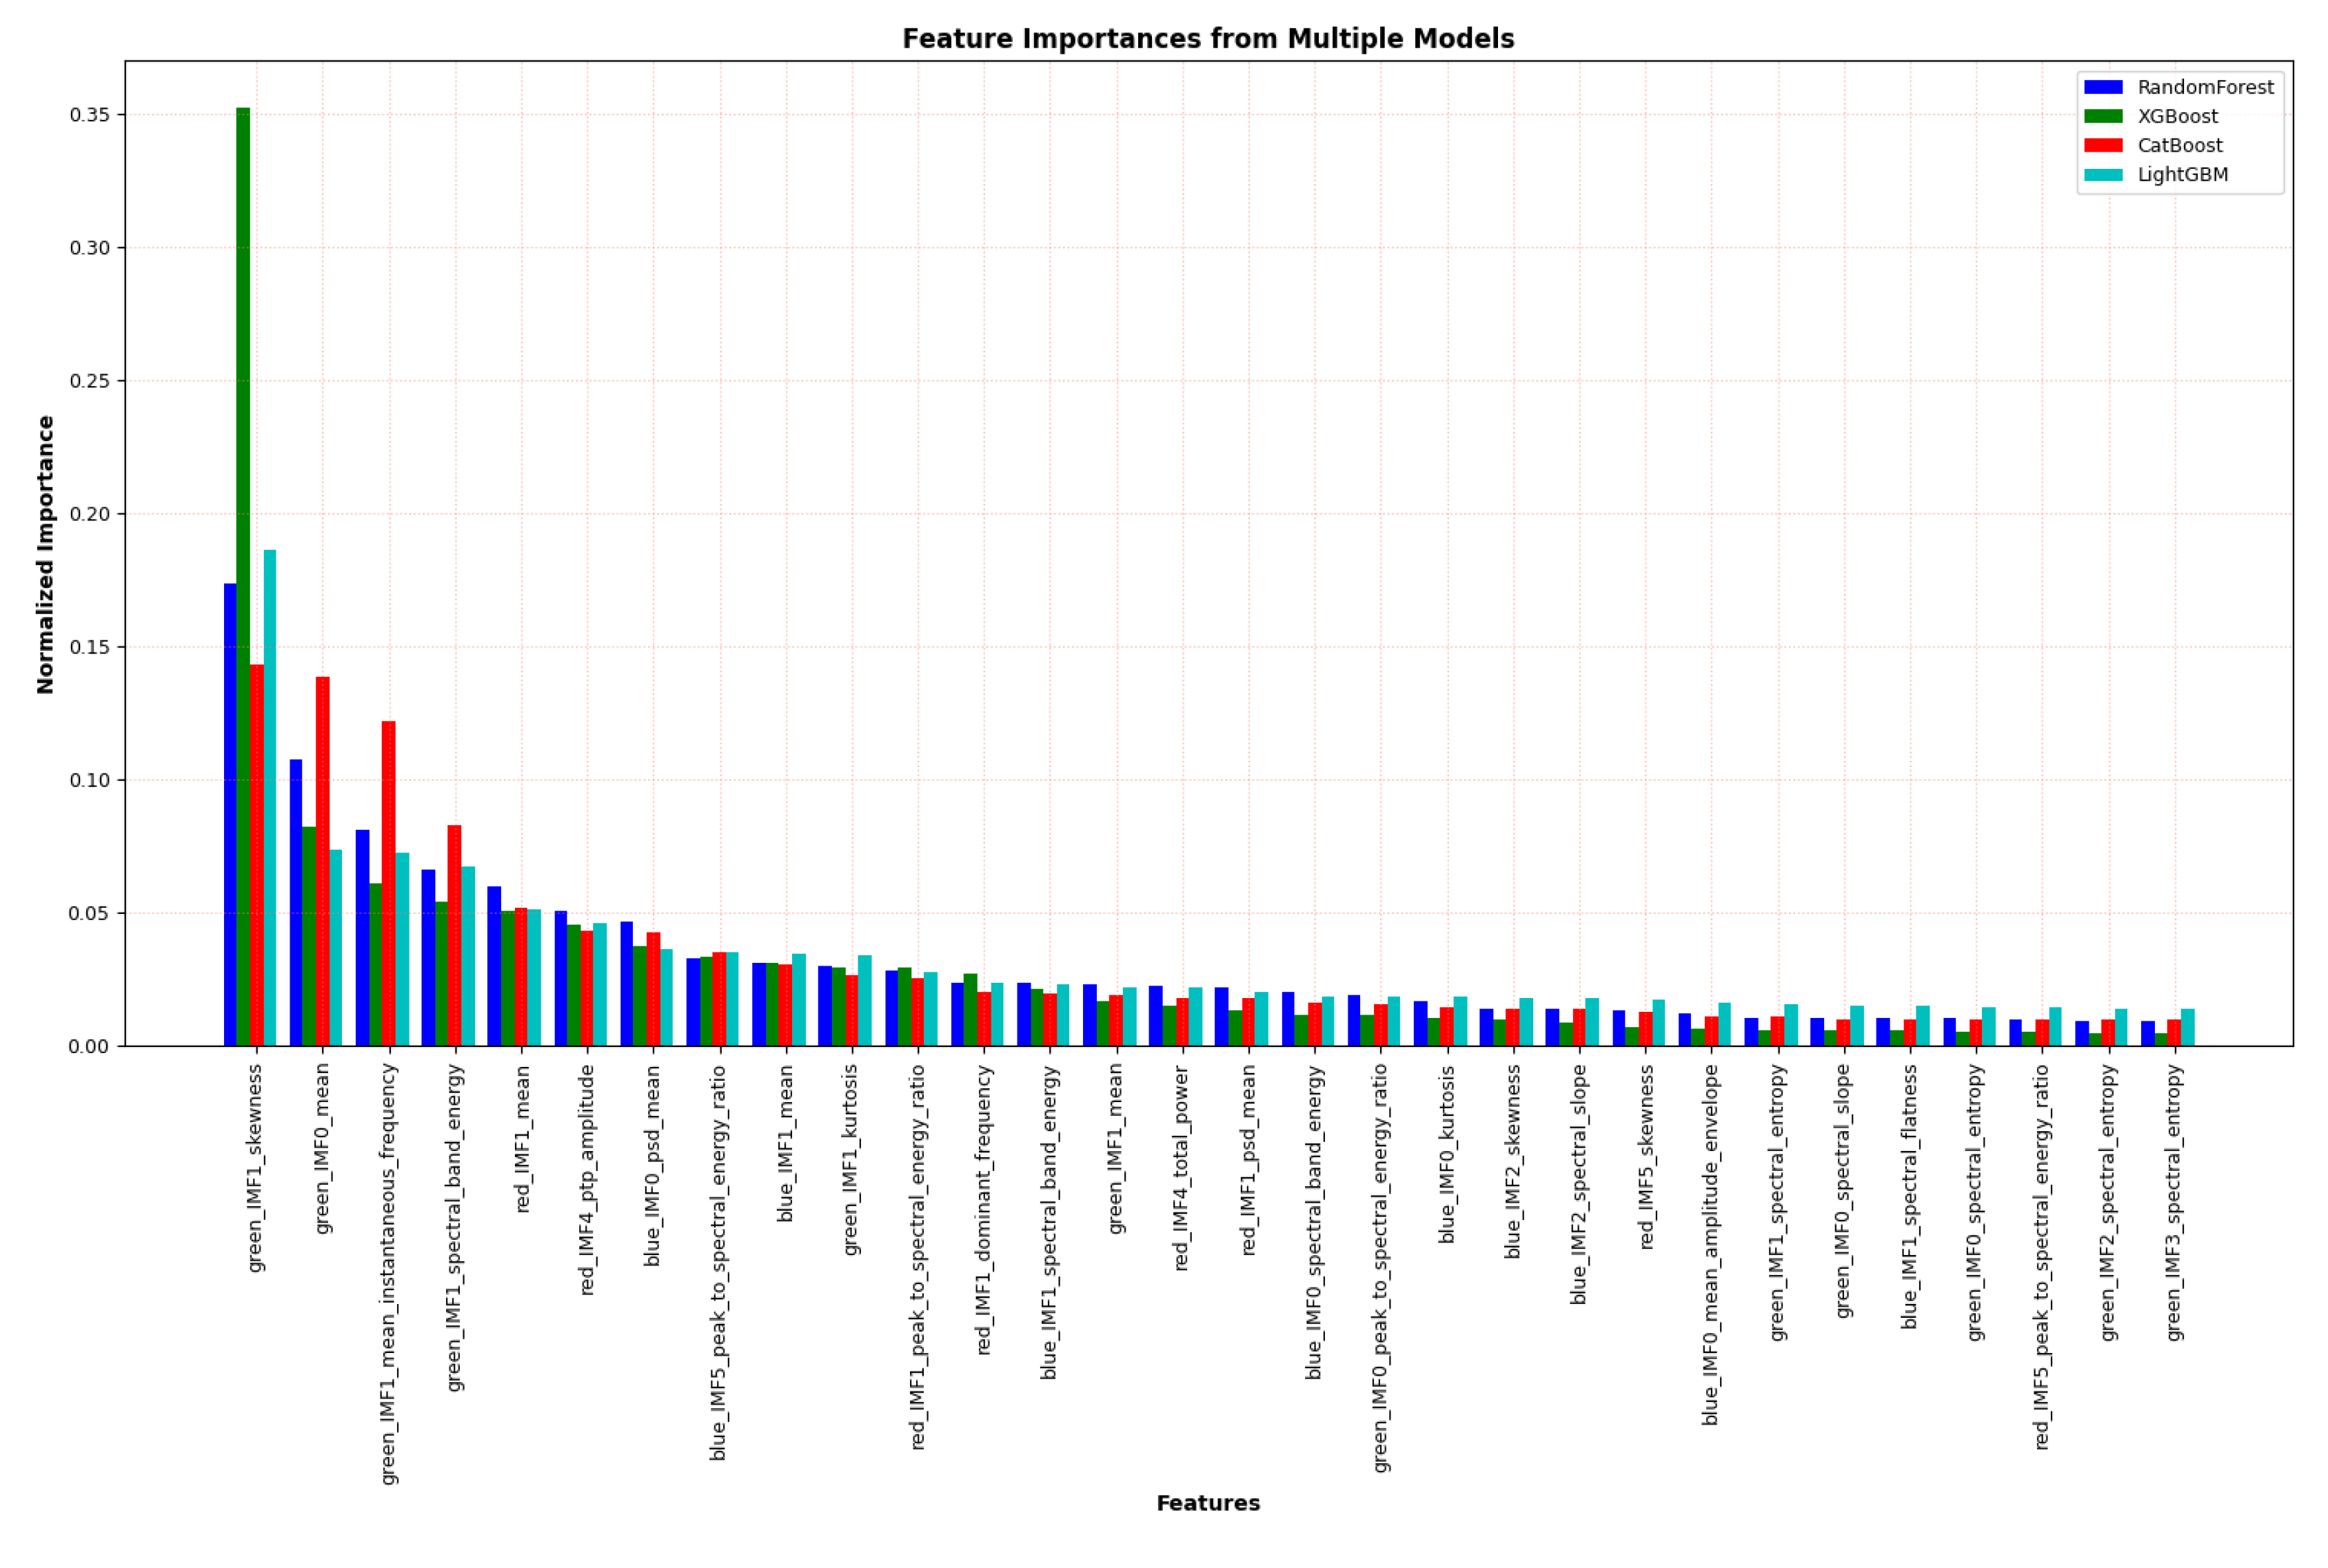
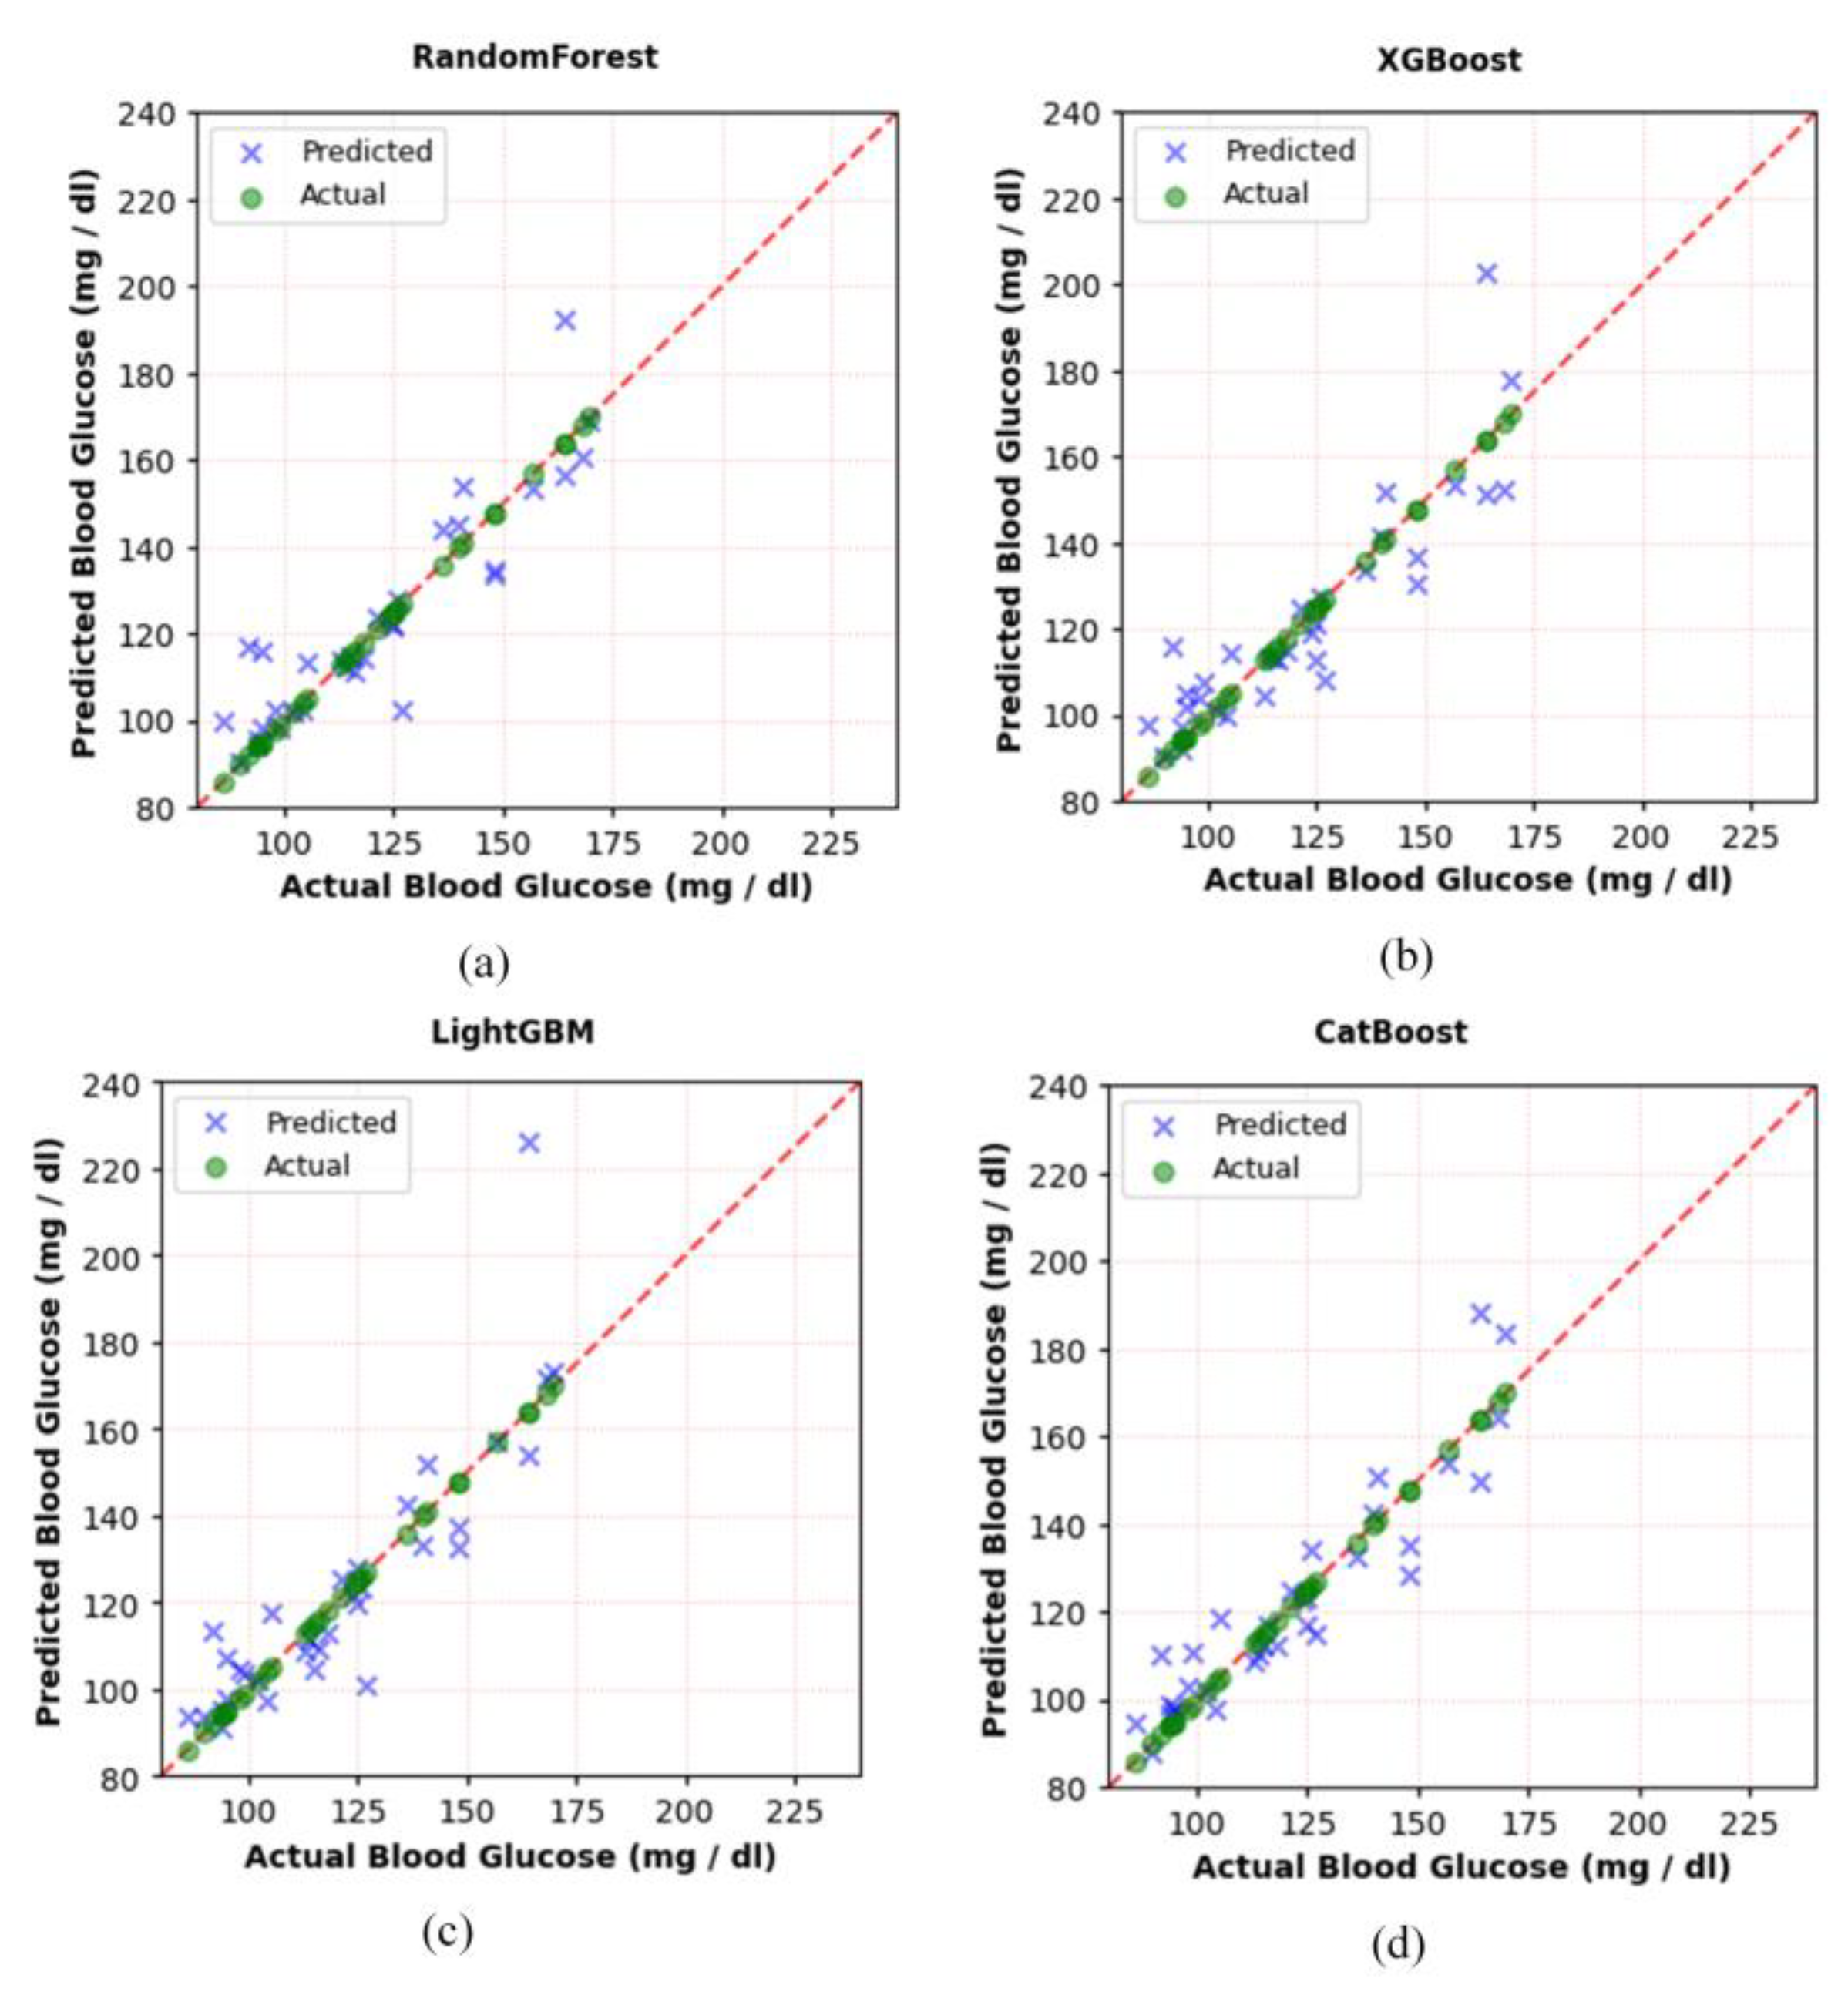
3.2. Performance Using 50 Features (Combining Top 20 PPG Waveform-Based Features with Top 30 IMF-Based Features)

In the context of this study, features derived from intrinsic mode functions (IMFs) are utilized to encapsulate the intrinsic oscillatory modes inherent in PPG signals. In contrast, features based on the PPG waveform primarily capture the overall characteristics of the signal. Integrating these two types of features is intended to provide a comprehensive representation of the information content of the signal. Towards this goal, the feature set was expanded to include 50 features, consisting of the top 20 PPG waveform-based features illustrated in Figure 5 along with the top 30 IMF-based features in Figure 6.
Expanding the feature set to 50 by combining PPG waveform-based features and IMF-based features significantly improved the performance of random forest, with Pearson’s r of 0.94, as shown in Table 4. The performance improvement observed with XGBoost having Pearson’s r of 0.95 indicates that the inclusion of additional features provided valuable insights. Similarly, LightGBM also showed notable improvement, with Pearson’s drift r performance increasing from 0.89 to 0.93. Pearson’s r of CatBoost improved to 0.96, maintaining its best performance position with the expanded feature set.
CatBoost enhances its performance using oblivious tress as a base learner, which creates symmetrical decision trees by grouping features into single splits. The feature grouping method in decision trees helps neatly organize data and avoid overfitting, leading to more accurate predictions. CatBoost’s design also minimizes the need for extensive hyperparameter tuning and provides superior performance despite longer training periods than models such as XGBoost and random forest. This is a testament to its efficiency in handling feature interactions. Conversely, XGBoost and random forest have progressed with expanded features, but fall short of CatBoost’s proficiency. LightGBM also demonstrated a performance improvement after using these combined features from the PPG waveform and IMFs.
Note that 15% of the total data were reserved for testing at the initial stage, and the results in Table 2, Table 3 and Table 4 were based on the test set, so the performance indicates that the models are generalized well.
A scatter diagram of the predicted and actual (reference) glucose level values using 50 features obtained by combining PPG waveform-based features with IMFs-based features is shown in Figure 8. The scatter plots in Figure 8 compare the performance of four machine learning models (RF, XGBoost, LightGBM, CatBoost) in predicting blood glucose levels. The RF model shows variability, especially at lower glucose values. XGBoost demonstrates higher accuracy, notably in lower glucose ranges. LightGBM exhibits some accuracy but with notable deviation in high glucose level. CatBoost, however, displays most predictions closely aligned with the ideal line indicating superior accuracy in its predictions.
The commonly utilized Clarke’s error grid analysis (EGA) has been carried out to confirm the clinical safety of the proposed noninvasive blood glucose estimation method. Figure 9 displays the EGA plot with selected features. In the EGA, Zone A represents the values within 20% of the reference sensor. Zone B contains points that are outside of 20% but would not lead to inappropriate treatment. Zone C are those points leading to unnecessary treatment. Zone D are those points indicating a potentially dangerous failure to detect hypoglycemia or hyperglycemia. Zone E are those points that would confuse treatment of hypoglycemia for hyperglycemia. And the green dots in the EGA represent data points. Most of the data points in case of RF, XGB, and LightGBM are in zone A, while a very small percentage of data are in zone B. In this analysis, especially CatBoost, all data points exist in zone A, supporting the better accuracy and reliability of the method proposed in this study.
In our study, we conducted a comparative analysis of our proposed method against two established methods for blood glucose estimation. The approach detailed in reference [30] employs a single pulse analysis (SPA) technique for feature extraction from PPG signals to estimate blood glucose levels. In study [31], the authors utilized machine learning algorithms on PPG signals, employing KTE, heart rate, AR coefficient-based features for blood glucose level estimation. Our method, as demonstrated in Table 5, achieved a high R2 score compared with other methods.

4. Conclusions

In this study, we investigated the feasibility of noninvasive blood glucose monitoring through the analysis of PPG signals, utilizing a diverse array of features. This study highlighted the importance of intrinsic mode function (IMF)-based features and ratio-based features derived from red, green, and blue wavelength signals. Combining the PPG waveform-based top 20 features and IMF-based top 30 features significantly improved the overall prediction accuracy of the model, indicating the complementary nature of the two feature sets. The results show that the quality and type of features (top 50 features based on both PPG waveform and IMFs) play an important role in model performance. After selecting those 50 features, the Pearson’s r values for RF, XGB, LightGBM, CatBoost were 0.94, 0.95, 0.93, and 0.96, respectively. Regardless of whether PPG waveform-based feature selection or IMFs-based feature selection was applied, CatBoost consistently outperformed the XGBoost, LightGBM, and RF algorithm in this specific application.
Our findings in this study suggest that the proposed noninvasive blood glucose measurement system has the potential to provide accurate and reliable measurements of blood glucose levels, which may have important clinical implications for patients with diabetes. In the future, we plan to improve the performance of the proposed method by collaborating with medical institutions to acquire additional clinical data and improve and expand the proposed method through deep learning.

Author Contributions

S.S.: conceptualization, methodology, software, writing—original draft preparation, validation. M.S.T.: methodology, software, review. T.-H.K.: methodology, software, review. K.-D.K.: conceptualization, methodology, writing—original draft preparation, supervision, funding acquisition. All authors have read and agreed to the published version of the manuscript.

Funding

This work was supported by the National Research Foundation (NRF) of Korea funded by the Ministry of Science and ICT (2022R1A5A7000765) and was also supported by Basic Science Research Program through the National Research Foundation (NRF) of Korea funded by the Ministry of Education (NRF-2022R1A2C2010298).

Institutional Review Board Statement

All protocols and procedures in this study were approved by the Institutional Review Board (IRB) of Kookmin University, Seoul, Korea (approval date: 17 July 2020). The procedures followed the Helsinki Declaration of 1975, as revised in 2008. All human participants agreed in advance to participate and share data for academic research purposes. The IRB protocol number is: KMU-202006-HR-237.

Informed Consent Statement

Informed consent was obtained from all subjects involved in the study.

Data Availability Statement

We have created our own dataset for this study. Since further research is underway, we are unable to publish the dataset at present.

Conflicts of Interest

The authors declare that they have no conflicts of interest. The funders had no role in the design of the study; in the collection, analyses, or interpretation of data; in the writing of the manuscript; or in the publication of the results.

Appendix A. Computational Methods for Specific IMF-Based Features Obtained through EMD

Spectral centroid: The spectral centroid of an IMF is computed to quantify the center frequency of the power spectrum of that IMF, effectively indicating the “gravity” of its spectrum [32]. It is determined by first applying the fast Fourier transform (FFT) to the IMF to obtain the frequency domain representation. The spectral centroid is then calculated as the weighted mean of the frequencies present in the signal, with the magnitudes of the FFT serving as the weights. Mathematically, the spectral centroid for an IMF is given by:
S C = ( f i F F T i ) | F F T i |
Here, f i represents the frequency corresponding to the ith bin, which is derived from the FFT frequency bin associated with the IMF, and ∣FFT(i)∣ is the magnitude of the FFT at the ith bin.
Spectral entropy: It is defined as the entropy of the power spectral density (PSD) of the IMF, which can be computed as in [33]:
SE = ( PSD n × log ( PSD n ) )
where PSDn means a normalized PSD.
Spectral flatness: It is calculated as the geometric mean of the FFT values of IMF divided by their arithmetic mean [34].
SF   G e o m e t r i c   m e a n   o f | F F T ( i ) | A r i t h m e t i c   m e a n   o f | F F T ( i ) |
Peak to spectral energy ratio: It is a measure of how much of the signal’s energy is packed into a single frequency component relative to the entire spectrum of frequencies. The maximum magnitude of the FFT of the IMF is divided by total power P t of the spectrum calculated by summing the squared magnitudes of all FFT components.
PSER = max ( F F T ( i ) ) P t
where
P t = ( FFT ( i ) ) 2
Spectral band energy: It is calculated to assess the distribution of power within a predefined frequency band of a signal’s power spectrum. The spectral band energy for a given frequency band f m i n   t o   f m a x   is given by:
SBE = f m i n f m a x ( F F T ( i ) ) 2
where f m i n   a n d   f m a x are the indices corresponding to the lower and upper bounds of the frequency band of interest.
Spectral slope: It can be calculated using a linear regression fit on the log-transformed power spectrum [34] as follows:
SS = d ( log F F T f ) d ( log f )
Here, log(f) represents the natural logarithm of the frequency bins, starting from the first non-zero bin to avoid the singularity at zero. log(∣FFT(f)∣) is the natural logarithm of the magnitude of the FFT components, also starting from the first non-zero bin. Numpy polyfit is used to perform the linear regression on the log-transformed frequency bins and FFT magnitudes, and then the [0] index is used to select the slope coefficient from the fit results.
Mean amplitude envelope: The mean amplitude envelope, A E m e a n , of a signal captures the absolute value of the analytic signal A(t) (which is the output of the Hilbert transform H applied to the IMF(t)). The Hilbert transform was performed using SciPy’s signal.hilbert.
A E m e a n = 1 T 0 T | A t | d t
where T is the total duration of the signal.
Mean instantaneous frequency: The phase angle of the analytic signal θ(t) was calculated using numpy ‘angle’ library and then used ‘unwrap’ for correction of phase angle values. Then the derivative of unwrapped phase angle was computed with respect to time to get the instantaneous frequency f(t). Finally, the mean value was calculated to get the mean instantaneous frequency.
I F m e a n = 1 T 0 T f ( t ) d t
where
f ( t ) = 1 2 π d θ t d t
and θ(t) is the unwrapped phase of A(t).
20 distinct features were computed for each IMF. In our analysis, we have constructed a feature vector X f i from each IMF. This vector is denoted as
X f i = [ I M F m e a n , I M F v a r , I M F s t d , P T P , I M F s k e w , I M F k u r t , F d , P t , A E m e a n , I F m e a n , Z C R , e x t , P S D m e a n , P S D v a r , S C , S E , S F , P S E R , S B E , S S ]

References

  1. Saeedi, P.; Petersohn, I.; Salpea, P.; Malanda, B.; Karuranga, S.; Unwin, N.; Colagiuri, S.; Guariguata, L.; Motala, A.A.; Ogurtsova, K.; et al. Global and Regional Diabetes Prevalence Estimates for 2019 and Projections for 2030 and 2045: Results from the International Diabetes Federation Diabetes Atlas, 9th Edition. Diabetes Res. Clin. Pract. 2019, 157, 107843. [Google Scholar] [CrossRef] [PubMed]
  2. Garg, S.K.; Voelmle, M.; Gottlieb, P.A. Time Lag Characterization of Two Continuous Glucose Monitoring Systems. Diabetes Res. Clin. Pract. 2010, 87, 348–353. [Google Scholar] [CrossRef] [PubMed]
  3. Kao, Y.-H.; Chao, P.C.-P.; Wey, C.-L. Design and Validation of a New PPG Module to Acquire High-Quality Physiological Signals for High-Accuracy Biomedical Sensing. IEEE J. Select. Top. Quantum Electron. 2019, 25, 69000210. [Google Scholar] [CrossRef]
  4. Ghamari, M. A Review on Wearable Photoplethysmography Sensors and Their Potential Future Applications in Health Care. IJBSBE 2018, 4, 195. [Google Scholar] [CrossRef] [PubMed]
  5. Hossain, S.; Gupta, S.S.; Kwon, T.H.; Kim, K.D. Derivation and Validation of Gray-Box Models to Estimate Noninvasive In-Vivo Percentage Glycated Hemoglobin Using Digital Volume Pulse Waveform. Sci. Rep. 2021, 11, 12169. [Google Scholar] [CrossRef] [PubMed]
  6. Hossain, M.S.; Kim, K.-D. Noninvasive Estimation of Glycated Hemoglobin In-Vivo Based on Photon Diffusion Theory and Genetic Symbolic Regression Models. IEEE Trans. Biomed. Eng. 2021, 69, 2053–2064. [Google Scholar] [CrossRef] [PubMed]
  7. Turja, M.S.; Kwon, T.H.; Kim, H.; Kim, K.D. Noninvasive In Vivo Estimation of HbA1c Based on the Beer–Lambert Model from Photoplethysmogram Using Only Two Wavelengths. Appl. Sci. 2023, 13, 3626. [Google Scholar] [CrossRef]
  8. Shi, B. BGEMTM: Assessing Elevated Blood Glucose Levels Using Machine Learning and Wearable Photo Plethysmography Sensors; JMIR: Toronto, ON, Canada, 2022. [Google Scholar]
  9. Sen Gupta, S.; Kwon, T.-H.; Hossain, S.; Kim, K.-D. Towards Non-Invasive Blood Glucose Measurement Using Machine Learning: An All-Purpose PPG System Design. Biomed. Signal Process. Control 2021, 68, 102706. [Google Scholar] [CrossRef]
  10. Wang, Y.; Wang, T. Application of Improved LightGBM Model in Blood Glucose Prediction. Appl. Sci. 2020, 10, 3227. [Google Scholar] [CrossRef]
  11. Prabha, A.; Yadav, J.; Rani, A.; Singh, V. Intelligent Estimation of Blood Glucose Level Using Wristband PPG Signal and Physiological Parameters. Biomed. Signal Process. Control 2022, 78, 103876. [Google Scholar] [CrossRef]
  12. Garde, A.; Karlen, W.; Dehkordi, P.; Ansermino, J.M.; Dumont, G.A. Empirical mode decomposition for respiratory and heart rate estimation from the photoplethysmogram. In Proceedings of the 2013 Computing in Cardiology Conference (CinC 2013), Zaragoza, Spain, 22–25 September 2013; IEEE: New York, NY, USA, 2013; Volume 40, pp. 799–802. [Google Scholar]
  13. Hadiyoso, S.; Dewi, E.M.; Wijayanto, I. Comparison of EMD, VMD and EEMD Methods in Respiration Wave Extraction Based on PPG Waves. J. Phys. Conf. Ser. 2020, 1577, 012040. [Google Scholar] [CrossRef]
  14. Huang, N.E.; Shen, Z.; Long, S.R.; Wu, M.C.; Shih, H.H.; Zheng, Q.; Yen, N.-C.; Tung, C.C.; Liu, H.H. The Empirical Mode Decomposition and the Hilbert Spectrum for Nonlinear and Non-Stationary Time Series Analysis. Proc. R. Soc. Lond. A 1998, 454, 903–995. [Google Scholar] [CrossRef]
  15. Bagal, T.; Bhole, K. Calibration of an Optical Sensor for in Vivo Blood Glucose Maeasurenaent. In Proceedings of the 2019 2nd International Conference on Intelligent Computing, Instrumentation and Control Technologies (ICICICT), Kannur, India, 5–6 July 2019; IEEE: New York, NY, USA, 2019; pp. 1029–1032. [Google Scholar]
  16. Singha, S.K.; Ahmad, M.; Islam, M.R. Multiple Regression Analysis Based Non-Invasive Blood Glucose Level Estimation Using Photoplethysmography. In Proceedings of the 2021 International Conference on Automation, Control and Mechatronics for Industry 4.0 (ACMI), Rajshahi, Bangladesh, 8 July 2021; IEEE: New York, NY, USA, 2021; pp. 1–5. [Google Scholar]
  17. Argüello-Prada, E.J.; Bolaños, S.M. On the Role of Perfusion Index for Estimating Blood Glucose Levels with Ultrasound-Assisted and Conventional Finger Photoplethysmography in the near-Infrared Wavelength Range. Biomed. Signal Process. Control 2023, 86, 105338. [Google Scholar] [CrossRef]
  18. Satter, S.; Kwon, T.-H.; Kim, K.-D. A Comparative Analysis of Various Machine Learning Algorithms to Improve the Accuracy of HbA1c Estimation Using Wrist PPG Data. Sensors 2023, 23, 7231. [Google Scholar] [CrossRef] [PubMed]
  19. Crowe, J.A.; Damianou, D. The Wavelength Dependence of the Photoplethysmogram and Its Implication to Pulse Oximetry. In Proceedings of the Annual International Conference of the IEEE Engineering in Medicine and Biology Society, Paris, France, 29 October–1 November 1992; IEEE: New York, NY, USA, 1992; pp. 2423–2424. [Google Scholar]
  20. Caizzone, A.; Boukhayma, A.; Enz, C. AC/DC Ratio Enhancement in Photoplethysmography Using a Pinned Photodiode. IEEE Electron Device Lett. 2019, 40, 1828–1831. [Google Scholar] [CrossRef]
  21. Solé Morillo, Á.; Lambert Cause, J.; Baciu, V.-E.; da Silva, B.; Garcia-Naranjo, J.C.; Stiens, J. PPG EduKit: An Adjustable Photoplethysmography Evaluation System for Educational Activities. Sensors 2022, 22, 1389. [Google Scholar] [CrossRef] [PubMed]
  22. Feradov, F.; Ganchev, T.; Markova, V.; Kalcheva, N. EMD-Based Features for Cognitive Load and Stress Assessment from PPG Signals. In Proceedings of the 2021 International Conference on Biomedical Innovations and Applications (BIA), Varna, Bulgaria, 2 June 2022; IEEE: New York, NY, USA, 2022; pp. 62–65. [Google Scholar]
  23. Islam, M.R.; Rahim, M.A.; Akter, H.; Kabir, R.; Shin, J. Optimal IMF Selection of EMD for Sleep Disorder Diagnosis Using EEG Signals. In Proceedings of the 3rd International Conference on Applications in Information Technology, Aizu-Wakamatsu Japan, 1–3 November 2018; ACM: New York, NY, USA, 2018; pp. 96–101. [Google Scholar]
  24. Lee, S.; Hwang, H.B.; Park, S.; Kim, S.; Ha, J.H.; Jang, Y.; Hwang, S.; Park, H.-K.; Lee, J.; Kim, I.Y. Mental Stress Assessment Using Ultra Short Term HRV Analysis Based on Non-Linear Method. Biosensors 2022, 12, 465. [Google Scholar] [CrossRef]
  25. Hina, A.; Saadeh, W. Noninvasive Blood Glucose Monitoring Systems Using Near-Infrared Technology—A Review. Sensors 2022, 22, 4855. [Google Scholar] [CrossRef]
  26. Deng, H.; Zhang, L.; Xie, Y.; Mo, S. Research on Estimation of Blood Glucose Based on PPG and Deep Neural Networks. IOP Conf. Ser. Earth Environ. Sci. 2021, 693, 012046. [Google Scholar] [CrossRef]
  27. Kopitar, L.; Kocbek, P.; Cilar, L.; Sheikh, A.; Stiglic, G. Early Detection of Type 2 Diabetes Mellitus Using Machine Learning-Based Prediction Models. Sci Rep 2020, 10, 11981. [Google Scholar] [CrossRef]
  28. Afsaneh, E.; Sharifdini, A.; Ghazzaghi, H.; Ghobadi, M.Z. Recent Applications of Machine Learning and Deep Learning Models in the Prediction, Diagnosis, and Management of Diabetes: A Comprehensive Review. Diabetol. Metab. Syndr. 2022, 14, 196. [Google Scholar] [CrossRef]
  29. Bentéjac, C.; Csörgő, A.; Martínez-Muñoz, G. A Comparative Analysis of Gradient Boosting Algorithms. Artif. Intell. Rev. 2021, 54, 1937–1967. [Google Scholar] [CrossRef]
  30. Habbu, S.; Dale, M.; Ghongade, R. Estimation of Blood Glucose by Non-Invasive Method Using Photoplethysmography. Sādhanā 2019, 44, 135. [Google Scholar] [CrossRef]
  31. Monte-Moreno, E. Non-Invasive Estimate of Blood Glucose and Blood Pressure from a Photoplethysmograph by Means of Machine Learning Techniques. Artif. Intell. Med. 2011, 53, 127–138. [Google Scholar] [CrossRef]
  32. Giannakopoulos, T.; Pikrakis, A. Audio Features. In Introduction to Audio Analysis; Elsevier: Amsterdam, The Netherlands, 2014; pp. 59–103. ISBN 978-0-08-099388-1. [Google Scholar]
  33. Acharya, U.R.; Fujita, H.; Sudarshan, V.K.; Bhat, S.; Koh, J.E.W. Application of Entropies for Automated Diagnosis of Epilepsy Using EEG Signals: A Review. Knowl.-Based Syst. 2015, 88, 85–96. [Google Scholar] [CrossRef]
  34. Hassan, A.R.; Bashar, S.K.; Bhuiyan, M.I.H. On the Classification of Sleep States by Means of Statistical and Spectral Features from Single Channel Electroencephalogram. In Proceedings of the 2015 International Conference on Advances in Computing, Communications and Informatics (ICACCI), Kochi, India, 10–13 August 2015; IEEE: New York, NY, USA, 2015; pp. 2238–2243. [Google Scholar]
Figure 1. Proposed system architecture.
Applsci 14 01406 g001
Figure 2. IMFs for the blue channel of the first segment of subject 1 obtained through EMD. (a) original signal, (b) IMF 1, (c) IMF 2, (d) IMF 3, (e) IMF 4, (f) IMF 5, (g) residual.
Applsci 14 01406 g002
Figure 3. AC/DC values vs. Glucose levels.
Applsci 14 01406 g003
Figure 4. R1, R2, and R3 versus Glucose levels for 34 subjects.
Applsci 14 01406 g004
Figure 5. Top 20 features extracted from the PPG waveform.
Applsci 14 01406 g005
Figure 6. Top 30 important features extracted from IMFs.
Applsci 14 01406 g006
Figure 7. Flow chart of feature extraction and selection procedure.
Applsci 14 01406 g007
Figure 8. Scatter plots for blood glucose estimation using a PPG signal. (a) RF, (b) XGB, (c) LightGBM, (d) CatBoost.
Applsci 14 01406 g008
Figure 9. EGA plots for blood glucose estimation using PPG signals. (a) RF, (b) XGB, (c) LightGBM, (d) CatBoost.
Applsci 14 01406 g009
Table 1. Dataset description.
MeasurementBlood Glucose (mg/dL)Age (Years)HbA1c (%)
Min86235.1
Max170868.8
Mean ± SD120.82 ± 25.1255 ± 21.925.87 ± 0.63
Table 2. Results for the RGB combination of wavelengths using the 54 features.
Combination of WavelengthsMetricsRandom ForestXGBoostLightGBMCatBoost
RGBPearson’s r0.850.880.840.91
RMSE (mg/dL)22.3718.7520.8916.38
R2 score0.670.760.720.81
MAE (mg/dL)10.4512.6015.2512.03
MAPE (mg/dL)7.028.7711.548.99
Best values are in boldface font.
Table 3. Results for the RGB combination of wavelengths using selected 20 features out of 54 features.
Combination of WavelengthsMetricsRandom ForestXGBoostLightGBMCatBoost
RGBPearson’s r0.890.920.840.93
RMSE (mg/dL)15.7213.8319.414.02
R2 score0.810.840.720.86
MAE (mg/dL)10.2310.9615.2010.46
MAPE (mg/dL)7.788.4611.548.64
Best values are in boldface font.
Table 4. Results when we use 50 features after combining top IMF-based and waveform-based features.
Combination of WavelengthsMetricsRandom ForestXGBoostLightGBMCatBoost
RGBPearson’s r0.940.950.930.96
RMSE (mg/dL)13.3711.8614.6310.94
R2 score0.880.910.860.92
MAE (mg/dL)8.27.059.218.01
MAPE (mg/dL)6.116.667.026.04
Best values are in boldface font.
Table 5. Comparison of the performance between glucose estimation methods.
MethodMain FeaturesMachine Learning AlgorithmR2 Score
Method [27]SPA-based featuresNeural network0.91
Method [28]KTE, AR, Heart rate statistics, Sp O 2 rangeRandom forest0.90
Our MethodExtracted from IMFs, ratio features from PPGRF, XGB, CB, LightGBM0.92
Disclaimer/Publisher’s Note: The statements, opinions and data contained in all publications are solely those of the individual author(s) and contributor(s) and not of MDPI and/or the editor(s). MDPI and/or the editor(s) disclaim responsibility for any injury to people or property resulting from any ideas, methods, instructions or products referred to in the content.

