1. Introduction
In the marine industry, MCPs comprise about 15% to 20% of all machinery and equipment [
1]. MCPs are very critical for the operation of the entire ship: MCP failure, while causing economic losses, also affects the safety of ship navigation, endangering the safety of personnel, so it is particularly important to accurately identify the statuses of MCPs.
Condition monitoring of MCPs has always been the focus of research on marine machinery and equipment. For example, Ning [
2] implemented an MCP condition monitoring and analysis system with the help of LabVIEW2009 programming software. In the system, signal analysis and performance curves can be drawn, and real-time display and condition monitoring of MCP performance parameters can be realized. Peng [
3] also implemented the MCP monitoring system with the help of LabVIWE2009 programming software. In this system, the vibration signal of an MCP and whether it was abnormal was judged online through spectrum analysis, and the vibration level of the MCP was determined according to the mean square value of velocity. Liu et al. [
4] established a mathematical model for online monitoring of centrifugal pump status and fault diagnosis. Using online monitoring of the centrifugal pump flow, pressure, head, and other performance parameters, Liu et al. identified the four states of cavitation, loosening, rotor misalignment, and rotor unbalance according to threshold comparison method. Luo et al. [
5] established the relationship between characteristics and state by analyzing the time domain and frequency domain characteristics of the vibration signal of the centrifugal pump. Cao et al. [
6] extracted 15 characteristic indexes of the vibration acceleration signal of the centrifugal pump, established the relationship between cavitation and characteristic indexes, and realized cavitation state monitoring of the centrifugal pump according to the characteristics of the vibration signal. By calculating the vibration signal characteristics of an MCP, Cheng et al. [
7] realized the recognition of different statuses of the MCP by using multi-dimensional characteristic indexes. In the above literature, some scholars developed an online monitoring system for condition monitoring of MCPs, and realized online status identification of MCPs. Some scholars extract different features for state recognition according to the different states of centrifugal pumps, among which, vibration signal feature extraction is the most common.
Condition monitoring via vibration signals is an important method for condition assessments of mechanical equipment that depends on feature extraction of the vibration signals of mechanical equipment. Common feature extraction methods mainly extract fault features from the time domain and frequency domain. The fault information of the equipment is hidden in the original time domain vibration data, and the fault information can be mined by calculating the time domain characteristic index [
8]. Li et al. [
9] proposed two new time domain indicators based on existing time domain eigenvalues, namely, the TALAF index based on the RMS value and kurtosis coefficient, and the THIKAT index based on kurtosis, RMS, and peak values, and used probabilistic neural networks to classify the health status of rolling bearings. Jing Liu et al. [
10] calculated 25 statistical features of vibration signals in the time domain, used the Pearson correlation coefficient to determine the valid features among the 25 statistical features, and proposed a new method for diagnosing the spalling fault of ball bearings. Long Wen et al. [
11] converted their original vibration data into grayscale graphs through time domain calculations for feature extraction, and input them into the proposed LeNet-5-based convolutional neural network to identify the health status of bearings. A variety of frequency domain characteristics can be obtained from the frequency domain, such as the mean square frequency, frequency variance, root mean square frequency, frequency amplitude variance, etc. Appana et al. [
12] used the envelope spectrum of vibration data as the feature input for their convolutional neural network; Shaobo Li et al. [
13] used RMS mapping of the fast Fourier transform of vibration data collected by two sensors as the feature input for their convolutional neural network. Wentao Mao et al. [
14] used fast Fourier transform results of vibration data as a feature input to a multi-layer extreme learning machine. Feature extraction using time domain and frequency domain processing is better in stationary vibration signals than in non-stationary vibration signals. Because an MCP is affected by load, turbulence, friction, and other factors, its vibration signal will show a non-stationary and non-linear situation relative to flow, pressure, and other signals, so the traditional time domain and frequency domain feature extraction is not suitable for MCP vibration signal feature extraction.
In order to better extract equipment operation features contained in non-stationary vibration signals, some scholars choose to use the time–frequency analysis method to extract features from original vibration signals. Common methods include short-time Fourier transform (STFT), wavelet transform (WT), and wavelet packet transform (WPT). Hongmei Liu et al. [
15] chose to use the time spectrum diagram of STFT as a feature to achieve fault diagnosis for rolling bearings. Chen et al. [
16] chose to use WT as a feature and input it into a diagnostic model combining a convolutional neural network and extreme learning machine for further analysis and processing, so as to realize the diagnosis of rolling bearing health status. Islam M et al. [
17] used discrete WPT and quantified each sub-band of the signal by defining a new evaluation index defect ratio, and finally input it into a new adaptive deep convolutional neural network to realize the identification of bearing health status. Zhang et al. [
18] carried out wavelet packet decomposition of vibration signals, selected the optimal frequency band, and calculated their respective Renyi entropy to form feature vectors to complete the performance degradation evaluation of rolling bearings. Sun et al. [
19] used the Hilbert–Huang transform (HHT) to extract the characteristic information of the monitoring signal, and obtained the mean amplitude of the inherent mode function and the maximum value point of the marginal spectrum as the characteristic parameters of tool wear, so as to identify a tool’s state. David et al. [
20] simultaneously used three time–frequency analysis methods (including STFT, WT, and HHT) to obtain a time–frequency spectrum diagram to obtain an image representation of the original vibration signal, and used this feature to input a deep convolutional neural network to identify the health state of a bearing, while comparing the diagnostic performance of the three methods. RAI et al. [
21] proposed a fault degradation assessment method combining empirical mode decomposition (EMD) feature extraction and K-means clustering, which achieved feature index extraction well. Wang et al. [
22] used variational mode decomposition (VMD) to extract component singular values, combined with root mean square values and sample entropy to form feature indicators, and verified the effectiveness of feature extraction through performance degradation assessments. Xiao et al. [
23] identified the fault type by calculating the fuzzy entropy of vibration signal components of three-phase asynchronous motors, and their results show that the accuracy of fuzzy entropy feature identification is high. Aiming to solve the problems of sensitive parameters and insufficient noise suppression in traditional feature extraction, Chen et al. [
24] extracted a multi-scale high-dimensional mapping entropy (MHDME) feature extraction algorithm, which can identify different states of reciprocating compressor bearings. However, the process of these methods is more complicated, and some methods rely on analyses of the mechanisms of the equipment, and the parameter setting depends on human experience. Thus, when the amount of data is too large, the processing time is too long.
With the rise of artificial intelligence, deep learning methods have deep structures and strong non-linear feature extraction abilities, thus can realize feature extraction from non-stationary vibration signals, and are increasingly applied in signal feature extraction. Zhao et al. [
25] proposed a universal fault feature extraction and diagnosis method based on a deep confidence network. Cheng et al. [
26] input the normalized amplitude spectrum of vibration signals into a deep belief network (DBN) for feature extraction, and evaluated the performance degradation of rolling bearings through the features. Their results show that this method can extract all stages of bearing degradation. Cao et al. [
27] used convolutional neural network (CNN) adaptive feature extraction to further explore the hidden micro features in the signals by deepening the network. Zhang et al. [
28] used an SSAE to extract the fault features of spiral bevel gear with strong non-linear and non-stationary characteristics, and input the fault features into multiple classifiers for classification training. Through their experiments, the recognition accuracy of this method was verified. Through the above research, it can be seen that feature extraction methods for vibration signals based on deep learning have a good effect and can extract weak features reflecting the state of the device in the signal, and their state recognition effect is good.
To summarize, in view of the non-stationary and non-linear characteristics of MCP vibration signals, this paper built an MCP test bench to collect vibration signals under different statuses of an MCP, divided the vibration signal dataset into a training set and a test set, trained the SSAE model with the training set, input the extracted features into the classifier training, and verified the model according to the test set. At the same time, two other methods were selected for comparative verification: One involves extracting the time domain characteristics [
29] of MCP vibration signals for status recognition. The other involves decomposing the MCP vibration signal via VMD, and calculating the fuzzy entropy characteristics [
30] of each modal component after decomposition to identify the state.
Finally, the validity of the proposed method was judged according to the accuracy of its status recognition.
2. SSAE Model
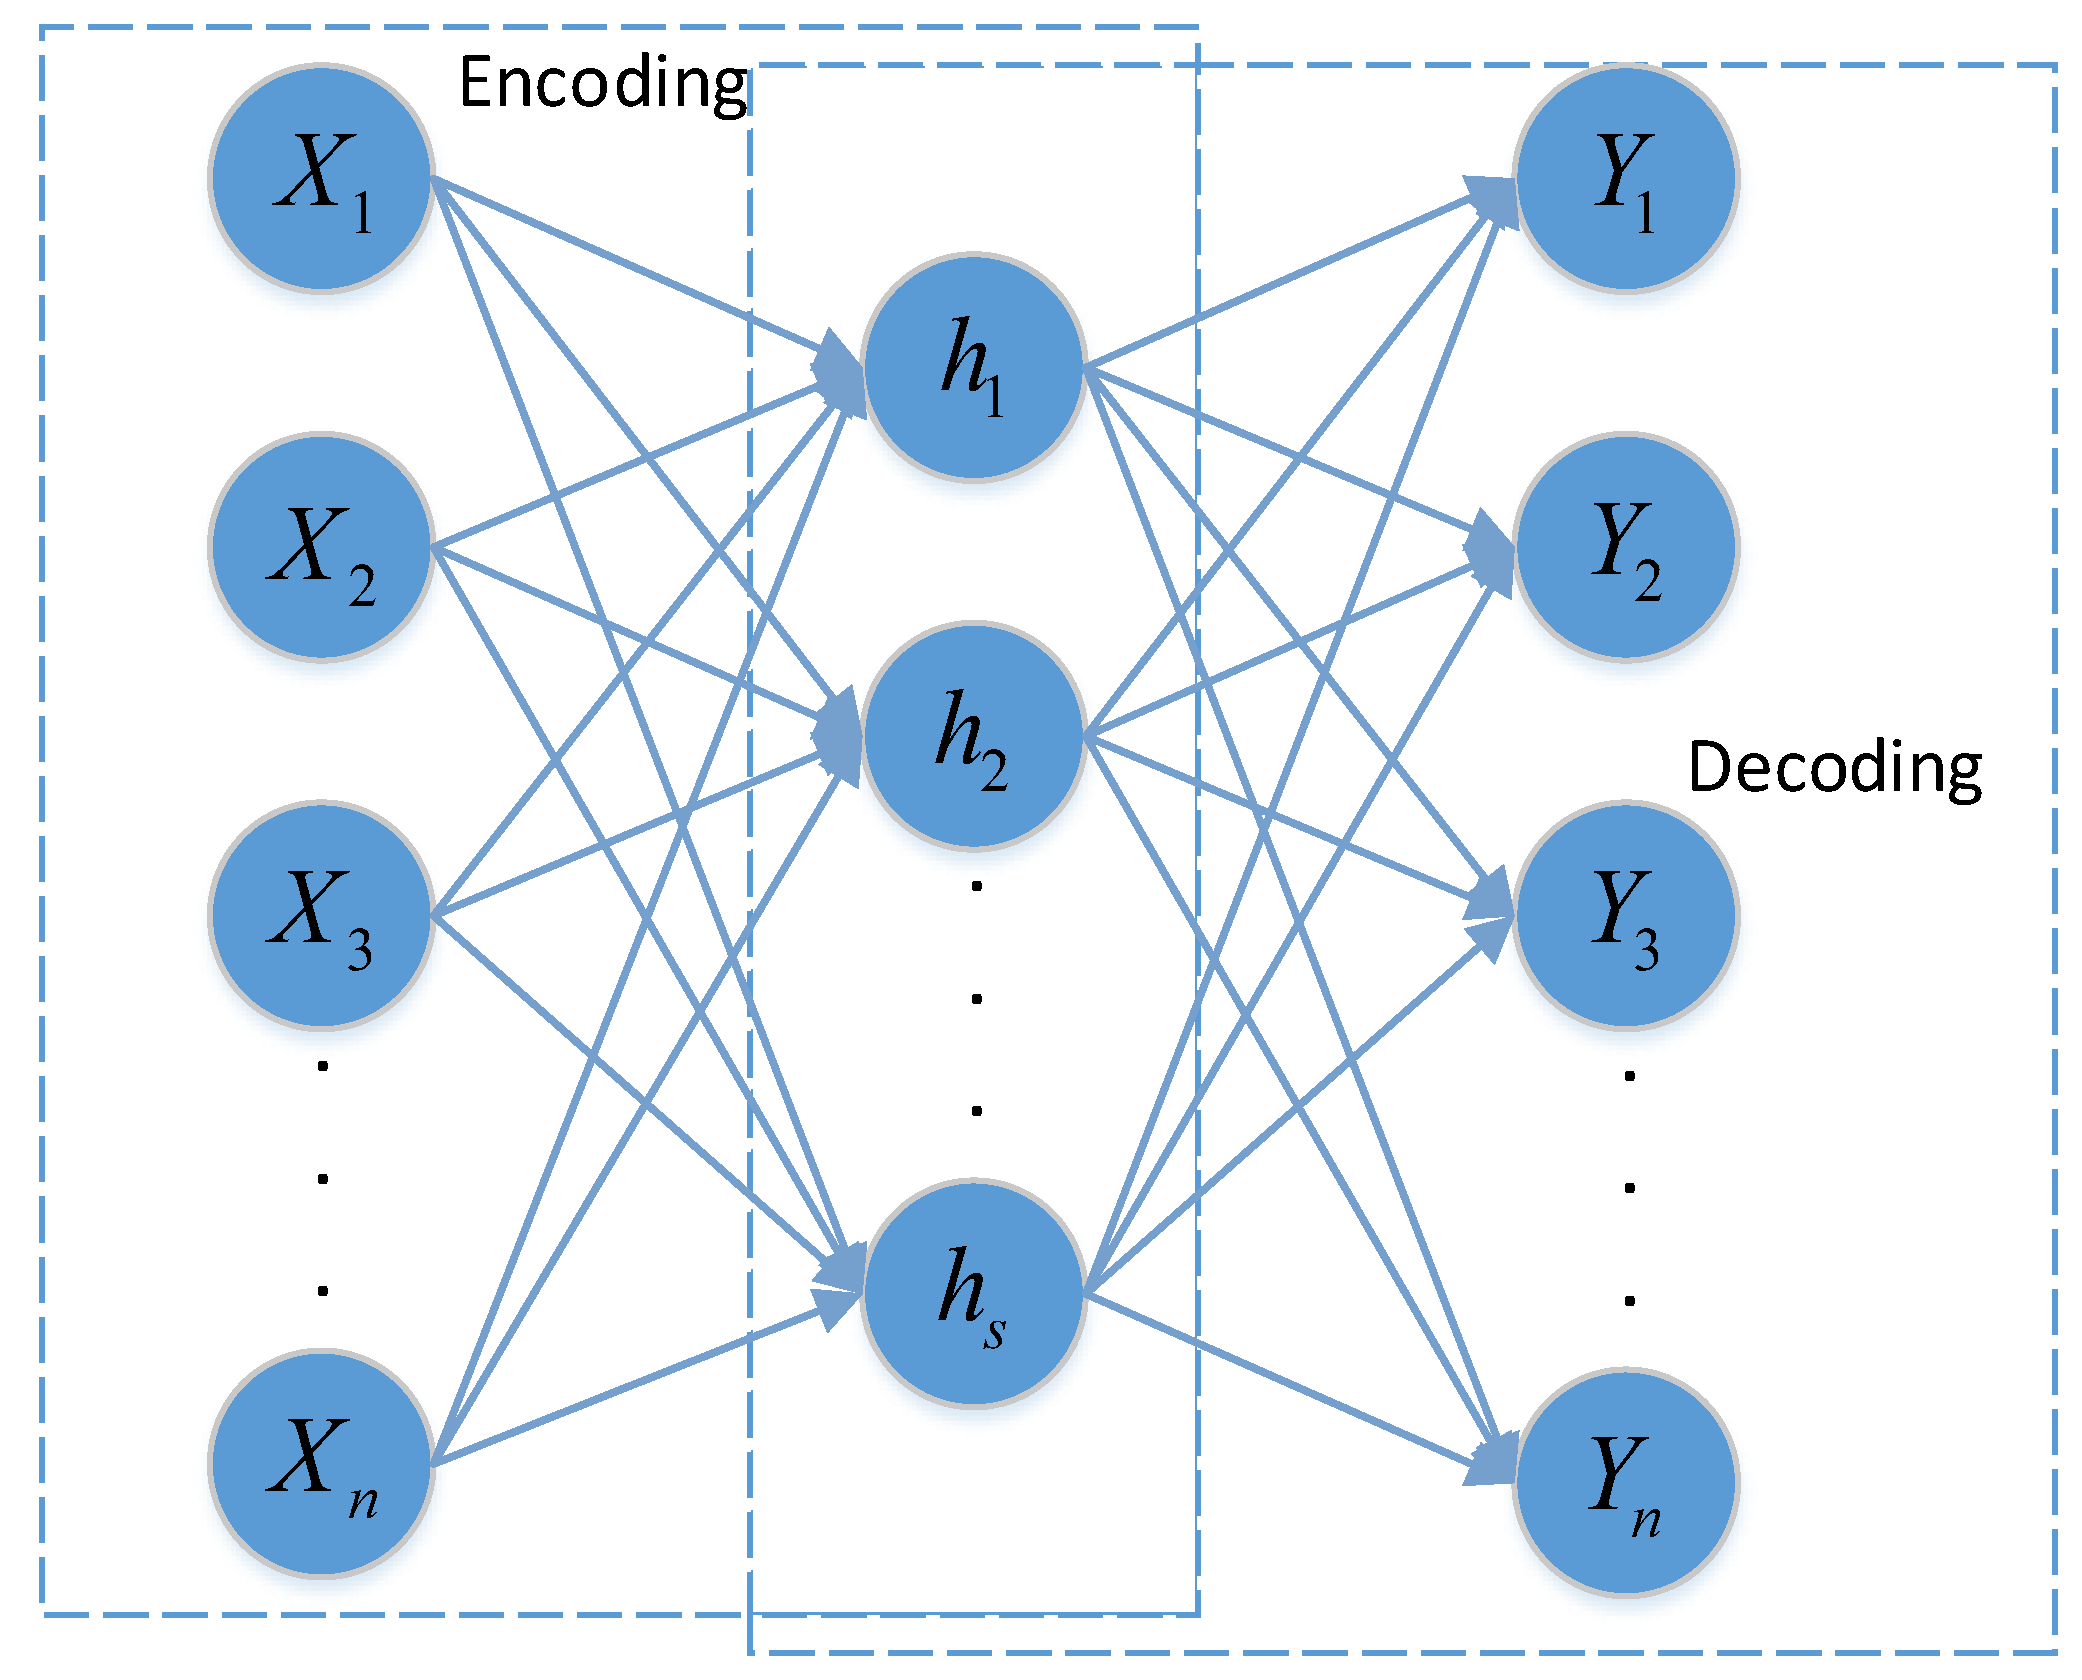
An auto-encoder (AE) [
31] is an unsupervised learning neural network model that automatically learns the features of raw data and consists of input, hidden, and output layers. Its network structure is shown in
Figure 1. The coding network is composed of an input layer and a hidden layer, and the decoding network is composed of a hidden layer and an output layer. The coding network extracts the features from the original data, and the decoding network restores the input data through the features.
In
Figure 1,
is the input to the network, and
is the number of nodes in the input layer of the network, representing the sample data dimension. The hidden feature
of the original data
obtained through the coded network is calculated as follows:
where
is the feature parameter extracted by coding;
is the activation function used in the coding process, for which Sigmoid is generally selected;
are the weights and biases used in the coding phase, respectively; and the dimension of
is
, where
is the dimension of the feature parameter.
The decoding network is used to reconstruct the original input data, and the reconstructed data
can be obtained after decoding the hidden feature
of the data, as follows:
where
is the network’s output data;
is the activation function used in the decoding process, for which Sigmoid is generally selected;
and
are the weights and biases used in the coding phase, respectively; and
.
The AE uses backpropagation and stochastic gradient descent algorithms to optimize the parameter set
in order to minimize errors between input and output data. In general, the mean square error function is defined as a loss function, which is as follows:
where
is the total number of training samples; and
are the original data and output data of the
sample, respectively.
The sparse auto-encoder (SAE) [
32] is constructed by adding a sparse penalty term to the cost function of an AE. The SAE can learn more abstract and representative compression features and has great potential. The sparse penalty term is defined as follows:
In Formula (4), is the sparse penalty factor, which is used to control the weight of the sparse penalty term in the loss function; is the dimension of the hidden layer; is the average activation value of the hidden unit; and is the sparse parameter.
Formula (5) is the relative entropy calculation formula, which is used to measure the degree of deviation between the two distributions.
Formula (6) calculates the average activation value of the hidden unit, where indicates the amount of activity in the unit of the hidden layer.
Formula (7) is the loss function of the SAE; the first term is the mean square error function, the second term is the sparse penalty term.
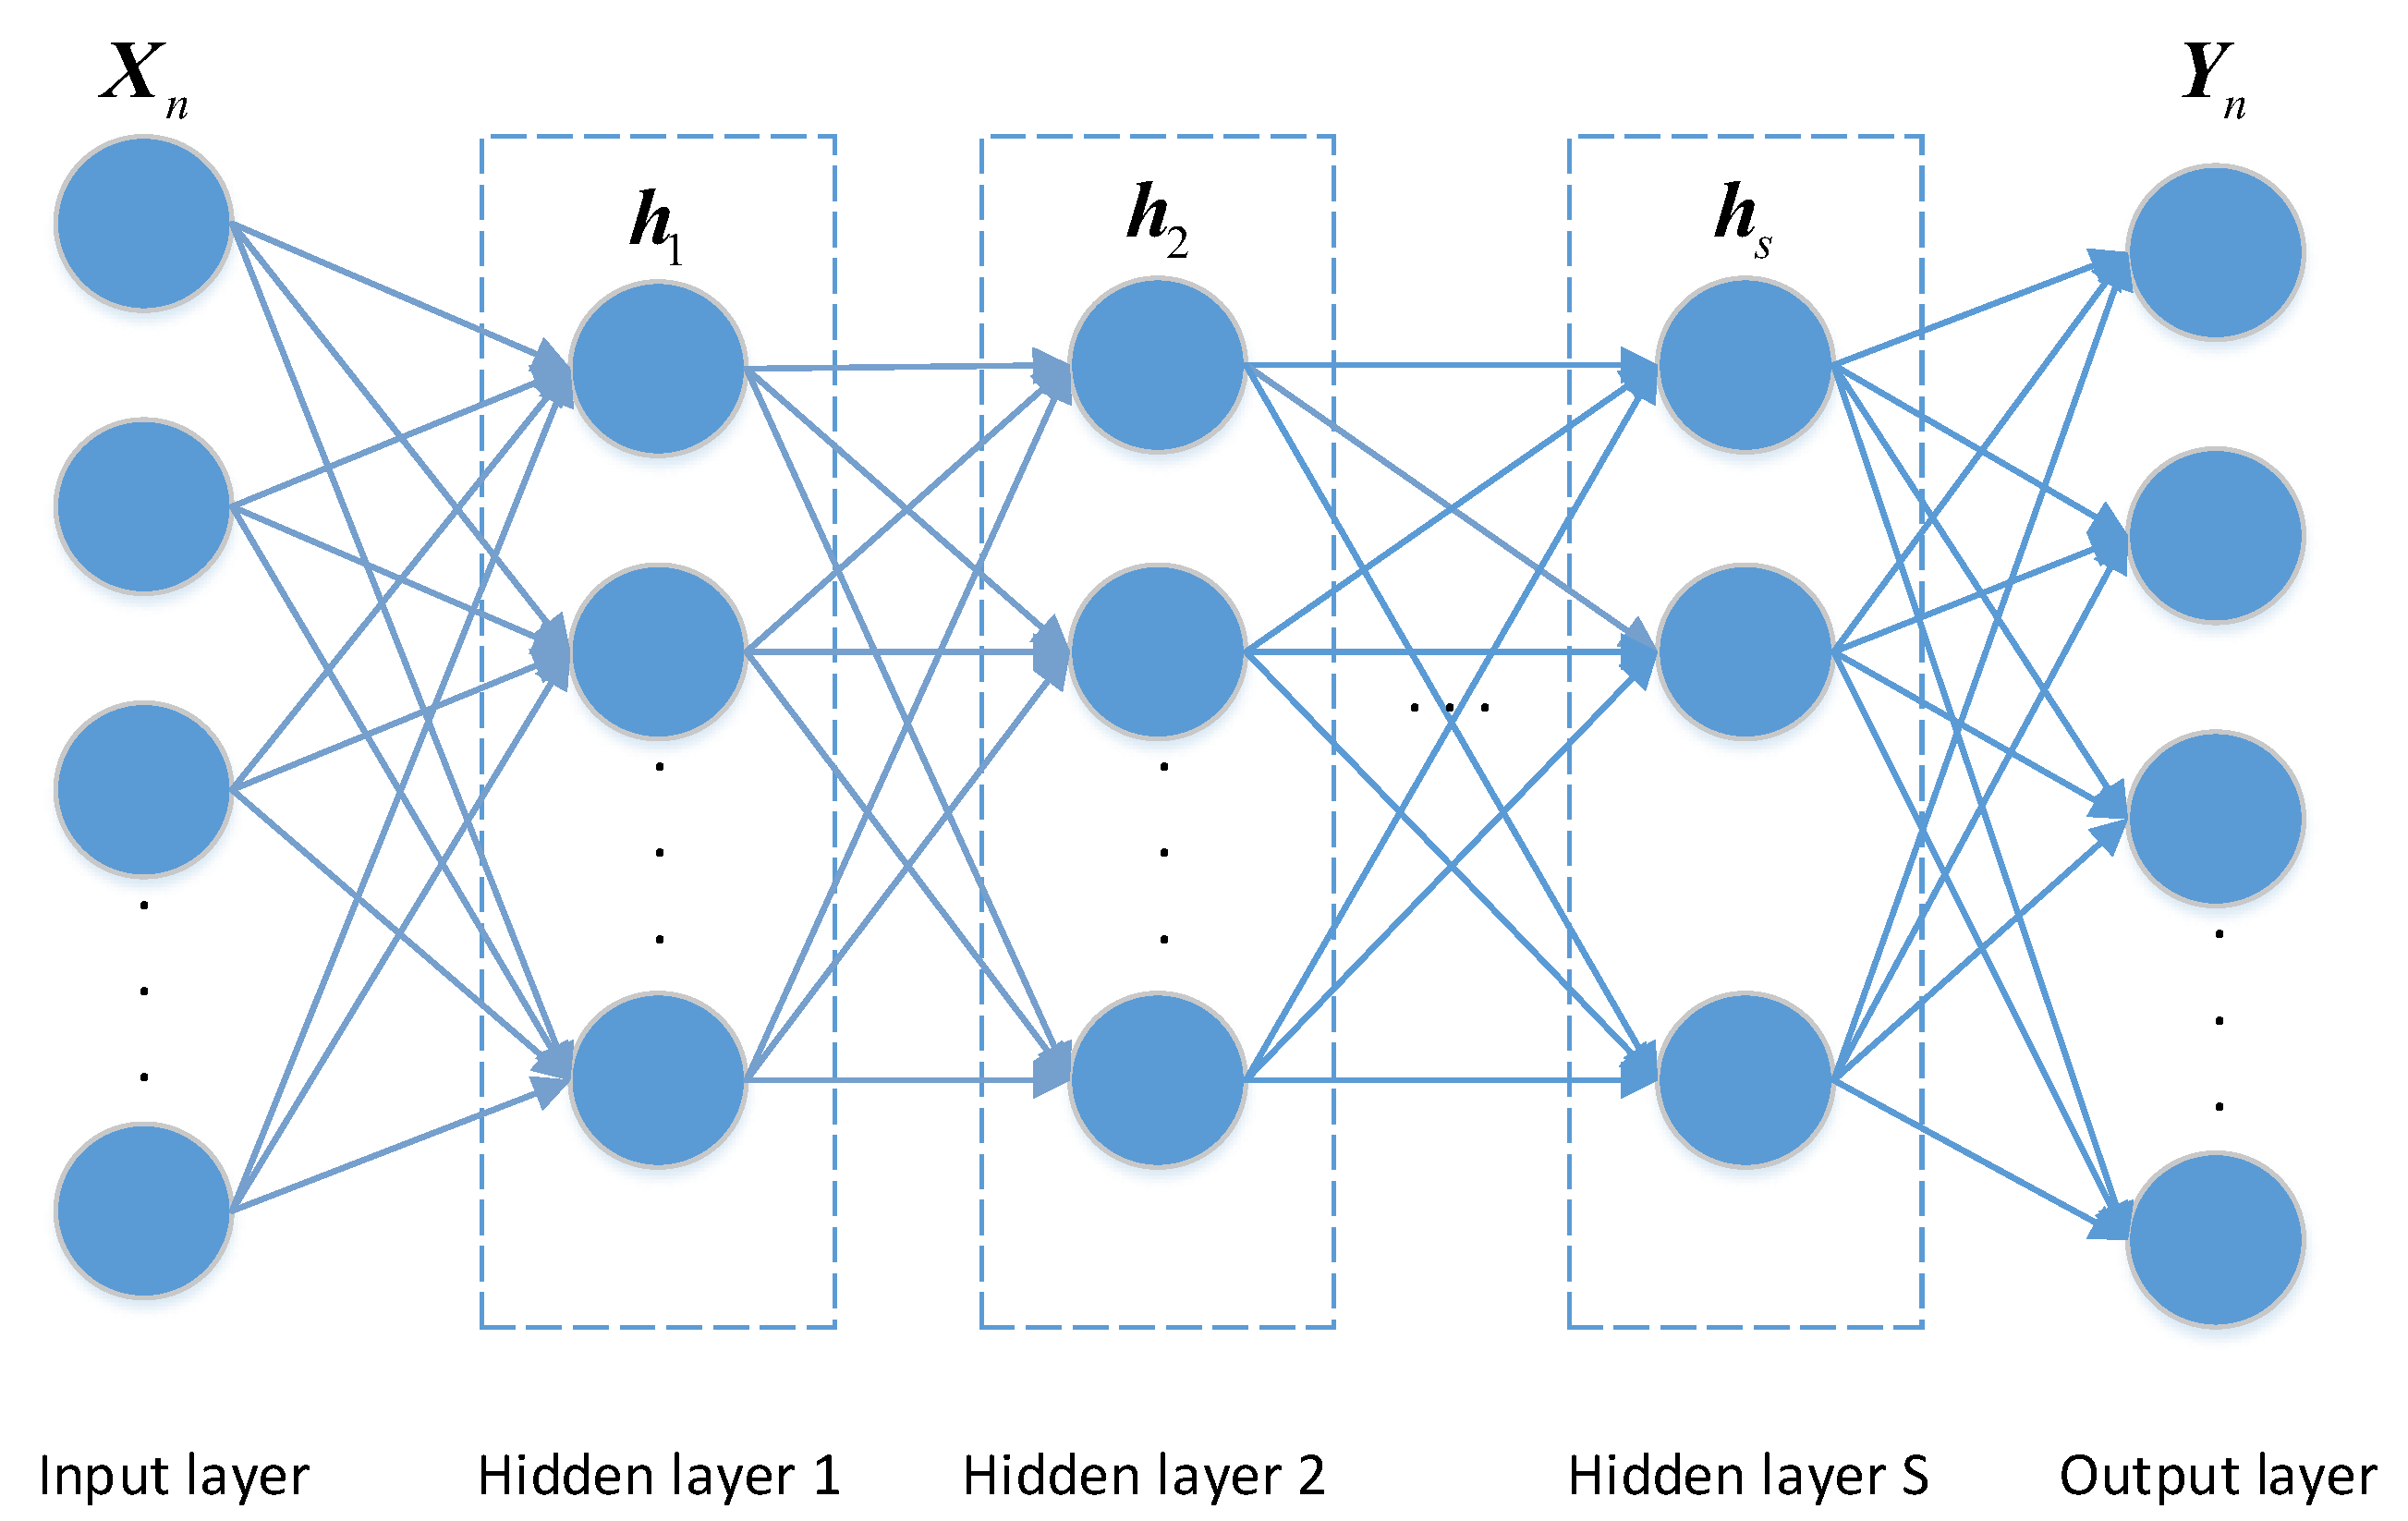
An SSAE is a deep neural network model composed of multiple SAEs. By taking the hidden layer of the previous SAE as the input of the next SAE, each hidden layer is a non-linear mapping representation of the output of the previous layer. With each additional hidden layer, the network can calculate a more complex non-linear mapping relationship. It can obtain the deeper and lower-dimensional features of the original data, and this model has a strong feature mining and expression ability. Its network structure is shown in
Figure 2.
In this paper, the deep characteristics of MCP vibration signals are extracted by stacking multiple SAEs, wherein the hidden layer of the last SAE is taken as the output of the SSAE model, and is the extracted vibration signal characteristic parameter of the MCP.
4. Experiment and Analyses
There are many types of faults that can occur in MCPs in actual operation, and the factors that cause these faults are also various. The common faults of MCPs include rotor unbalance, rotor misalignment, impeller cavitation, rolling bearing failure, and mechanical seal failure. At present, most scholars are focusing on different faults of MCPs for fault identification. However, in the actual operation process, it is impossible to replace the impeller immediately after cavitation occurs, and in most cases, the impeller is damaged to a certain extent before replacement. Therefore, this paper mainly identifies the degree of damage caused by MCP impeller cavitation to the impeller, and determines whether to replace the impeller according to the degree of damage.
In order to verify the effectiveness of the MCP status recognition method proposed in this paper, an MCP test bench was built. A vibration acceleration sensor was used to collect the vibration signals of the MCP under different degrees of cavitation damage, and status recognition was carried out using the method proposed in this paper. The experimental bench is shown in
Figure 4.
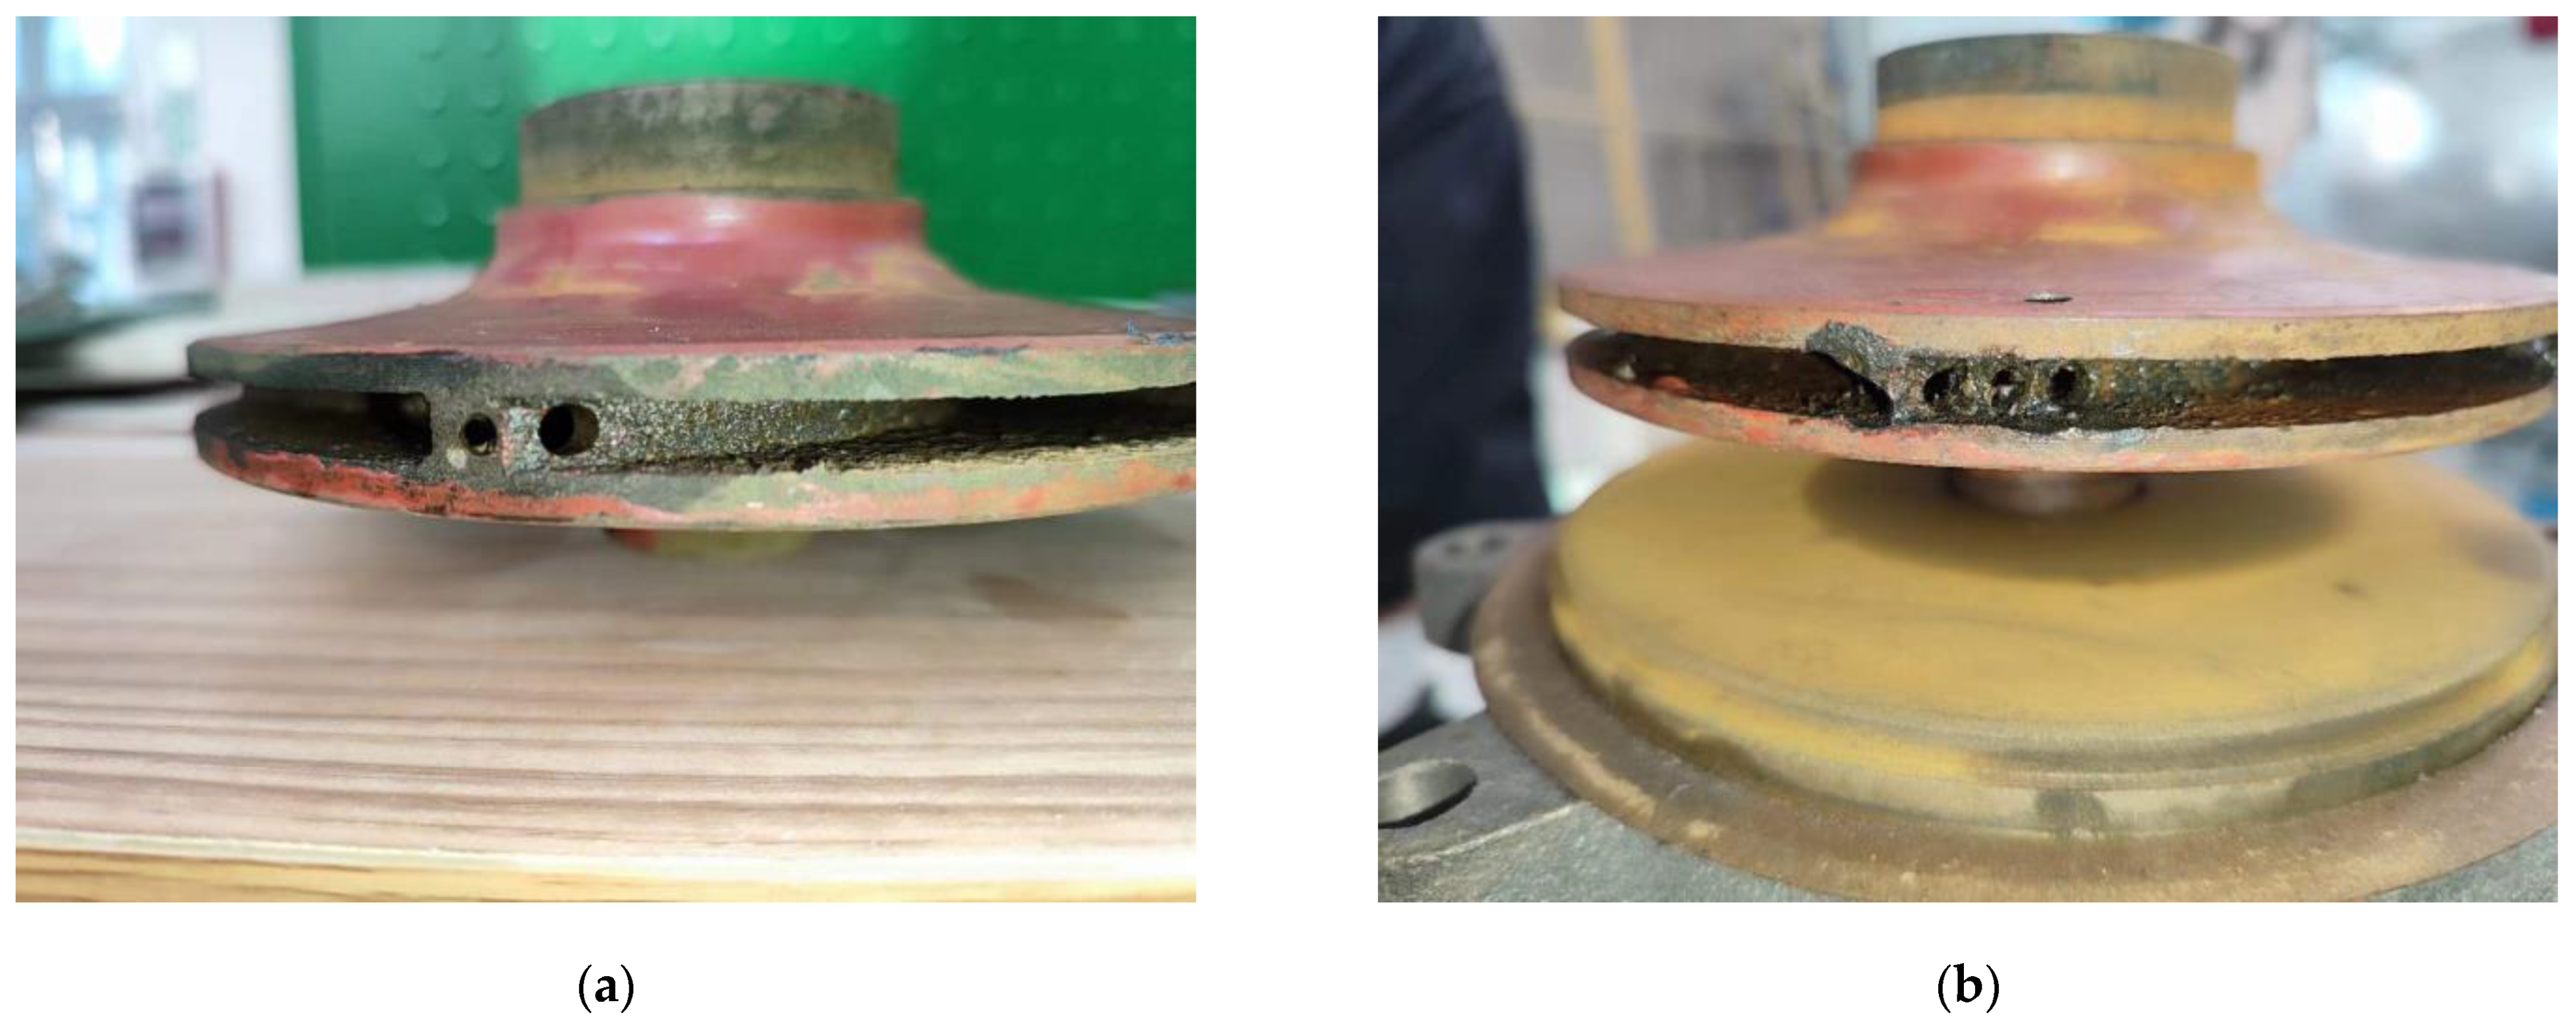
A unidirectional acceleration sensor was arranged in the MCP volute on the test bench. The sampling frequency was 20,000 Hz, and the sampling time was 0.1 s. First, the vibration signal under the normal state (S1) of the MCP was collected. The operating condition was rated and the speed was 2900 r/min. In order to simulate the MCP impeller cavitation, the MCP impeller was drilled and the cavitation degree of the MCP was defined according to the number of holes drilled in the impeller. These were either 1 hole in the impeller (S2), 2 holes in the impeller (S3), 2.5 holes in the impeller (S4), 3 holes in the impeller (S5), 4 holes in the impeller (S6), 5 holes in the impeller (S7), 6 holes in the impeller (S8), or 6 holes in the impeller with side wear of the impeller (S9). The operating conditions remained the same as S1, and the MCP vibration signals under these 8 states were collected successively. A total of 250 sets of vibration signal data were collected in each state.
Figure 5 shows the impellers in S3 and S9.
The time domain signals under each MCP state are shown in
Figure 6, below. From the perspective of vibration amplitude, the vibration amplitude of an MCP under different states does not increase; regarding the trend of the waveform, only the S5 state is abnormal, and the differentiation in other statuses is not large.
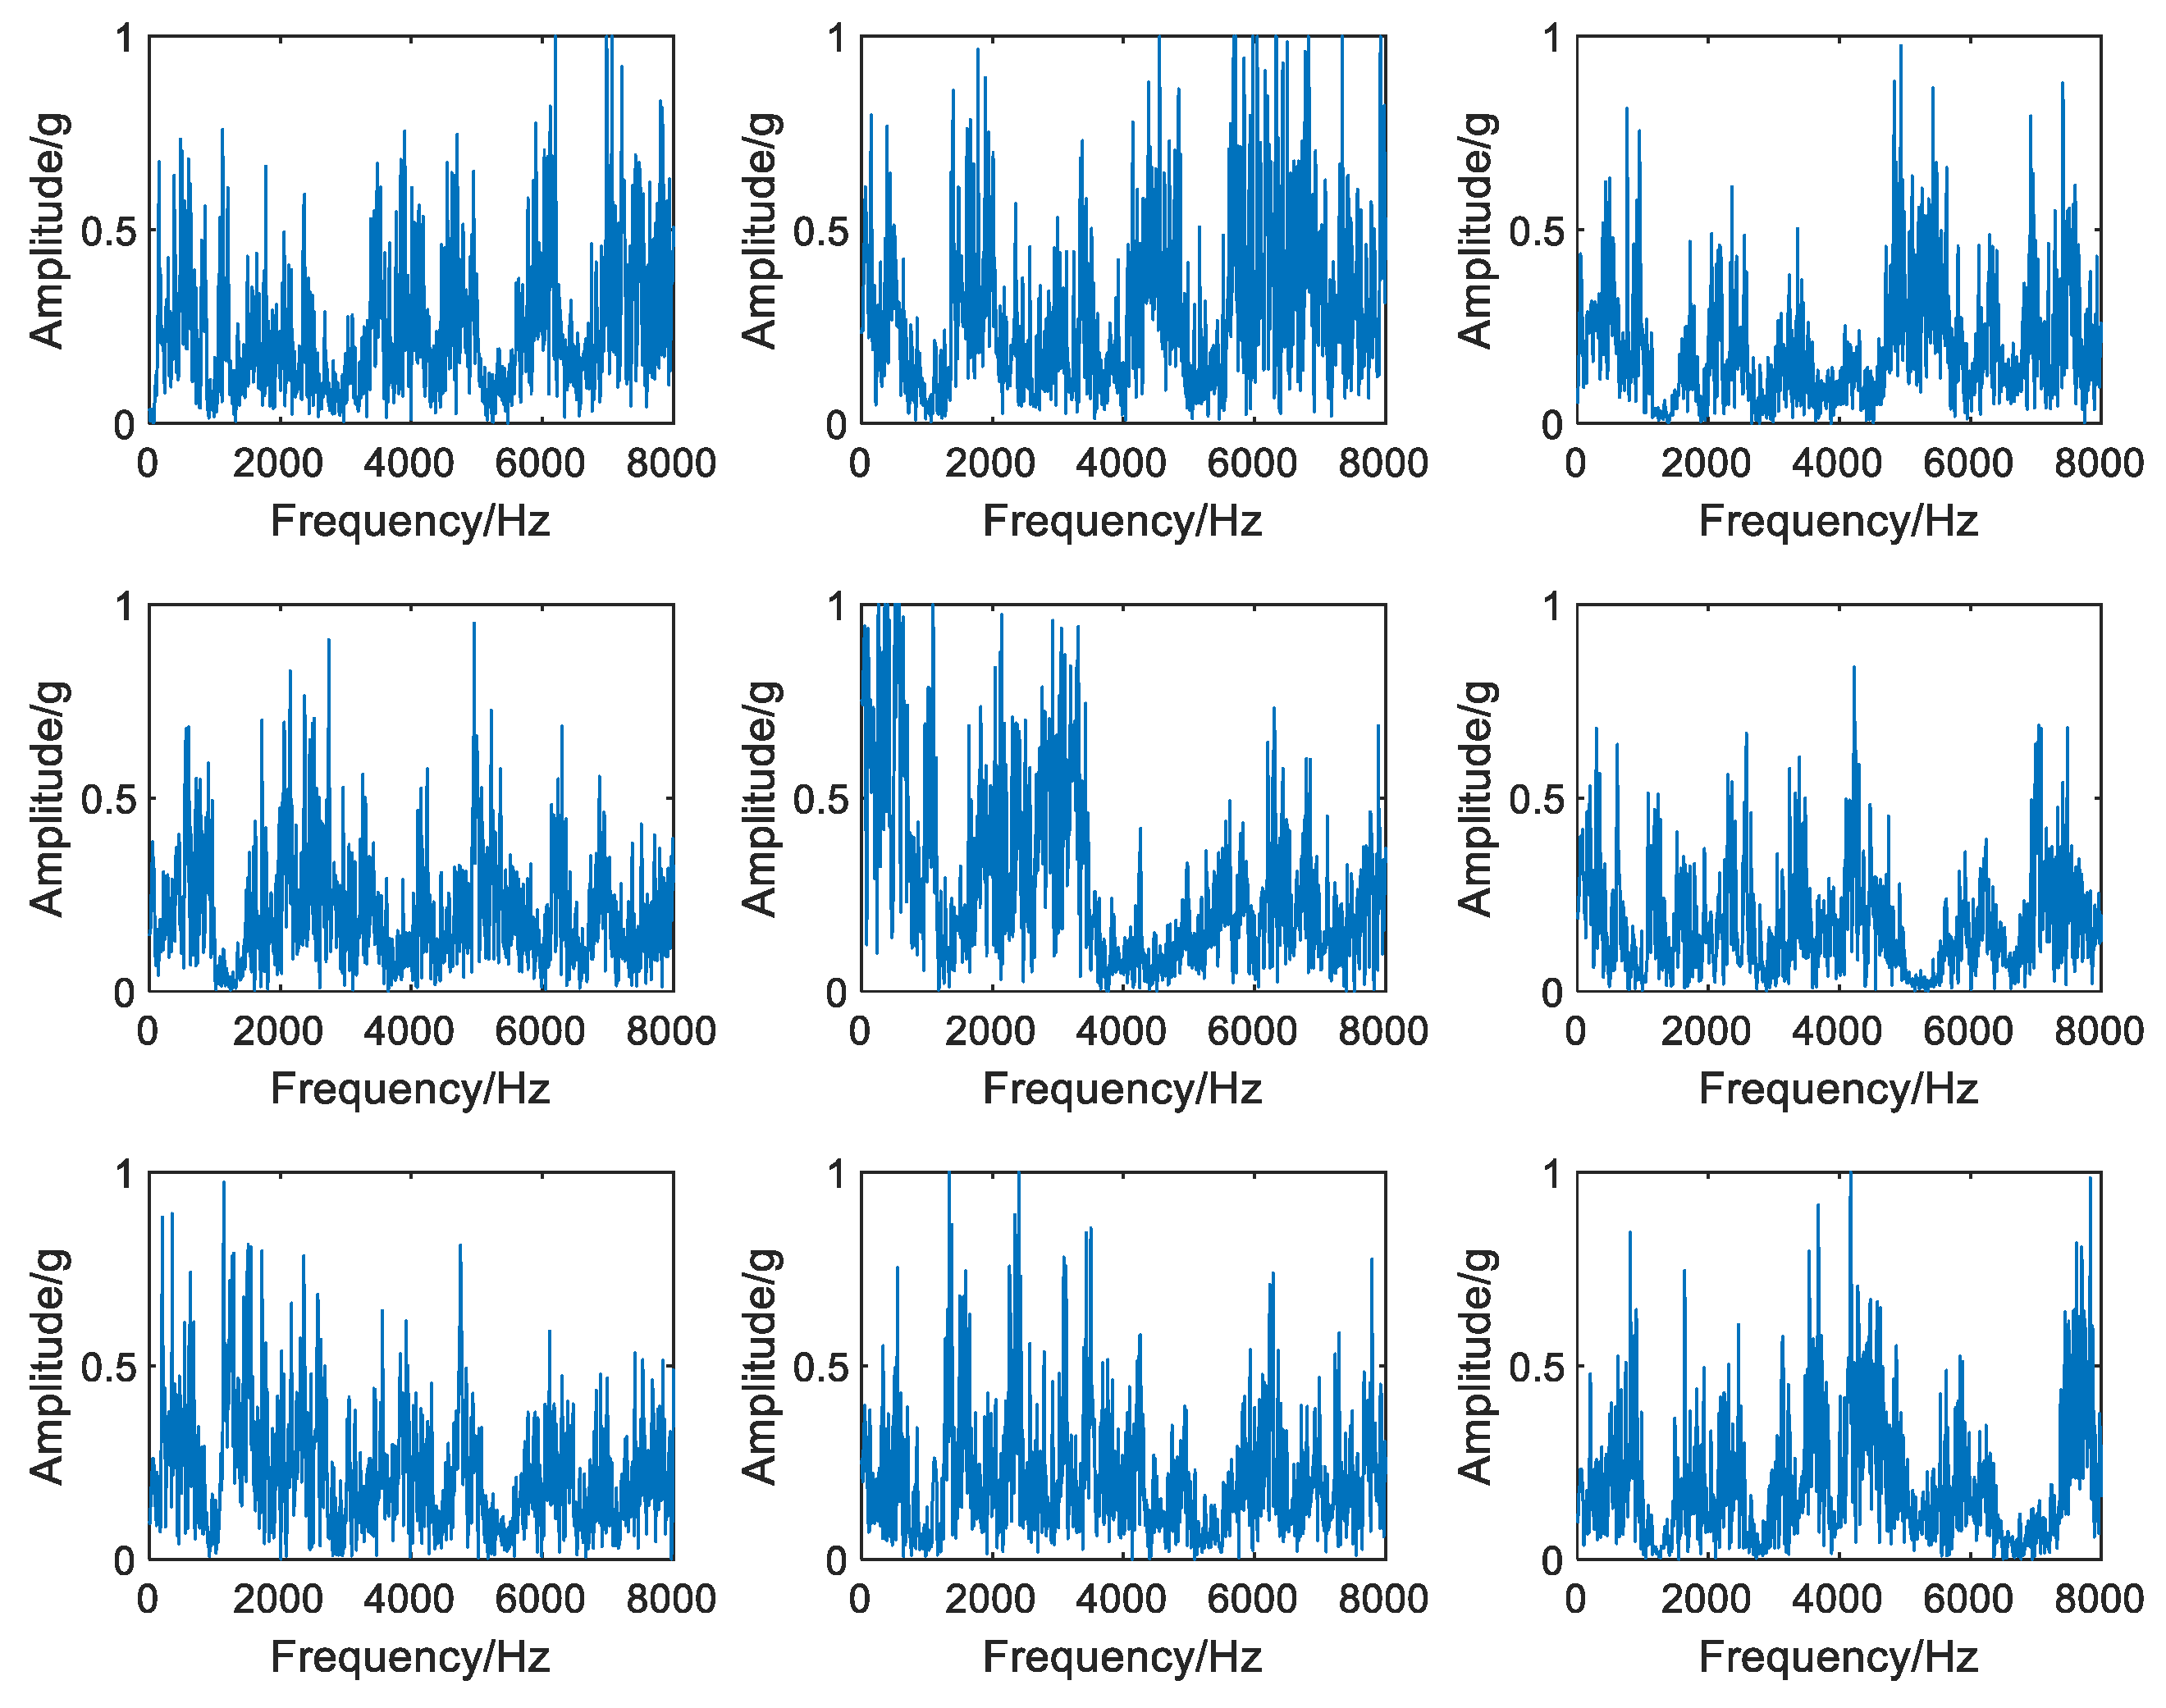
The normalized amplitude spectra in the frequency domain under each MCP state are shown in
Figure 7, below. As can be seen from this figure, each normalized amplitude spectrum of an MCP under different states has its own characteristics, and several states can be identified with the naked eye, which is also the reason why in this paper we chose to extract MCP features from frequency domain signals.
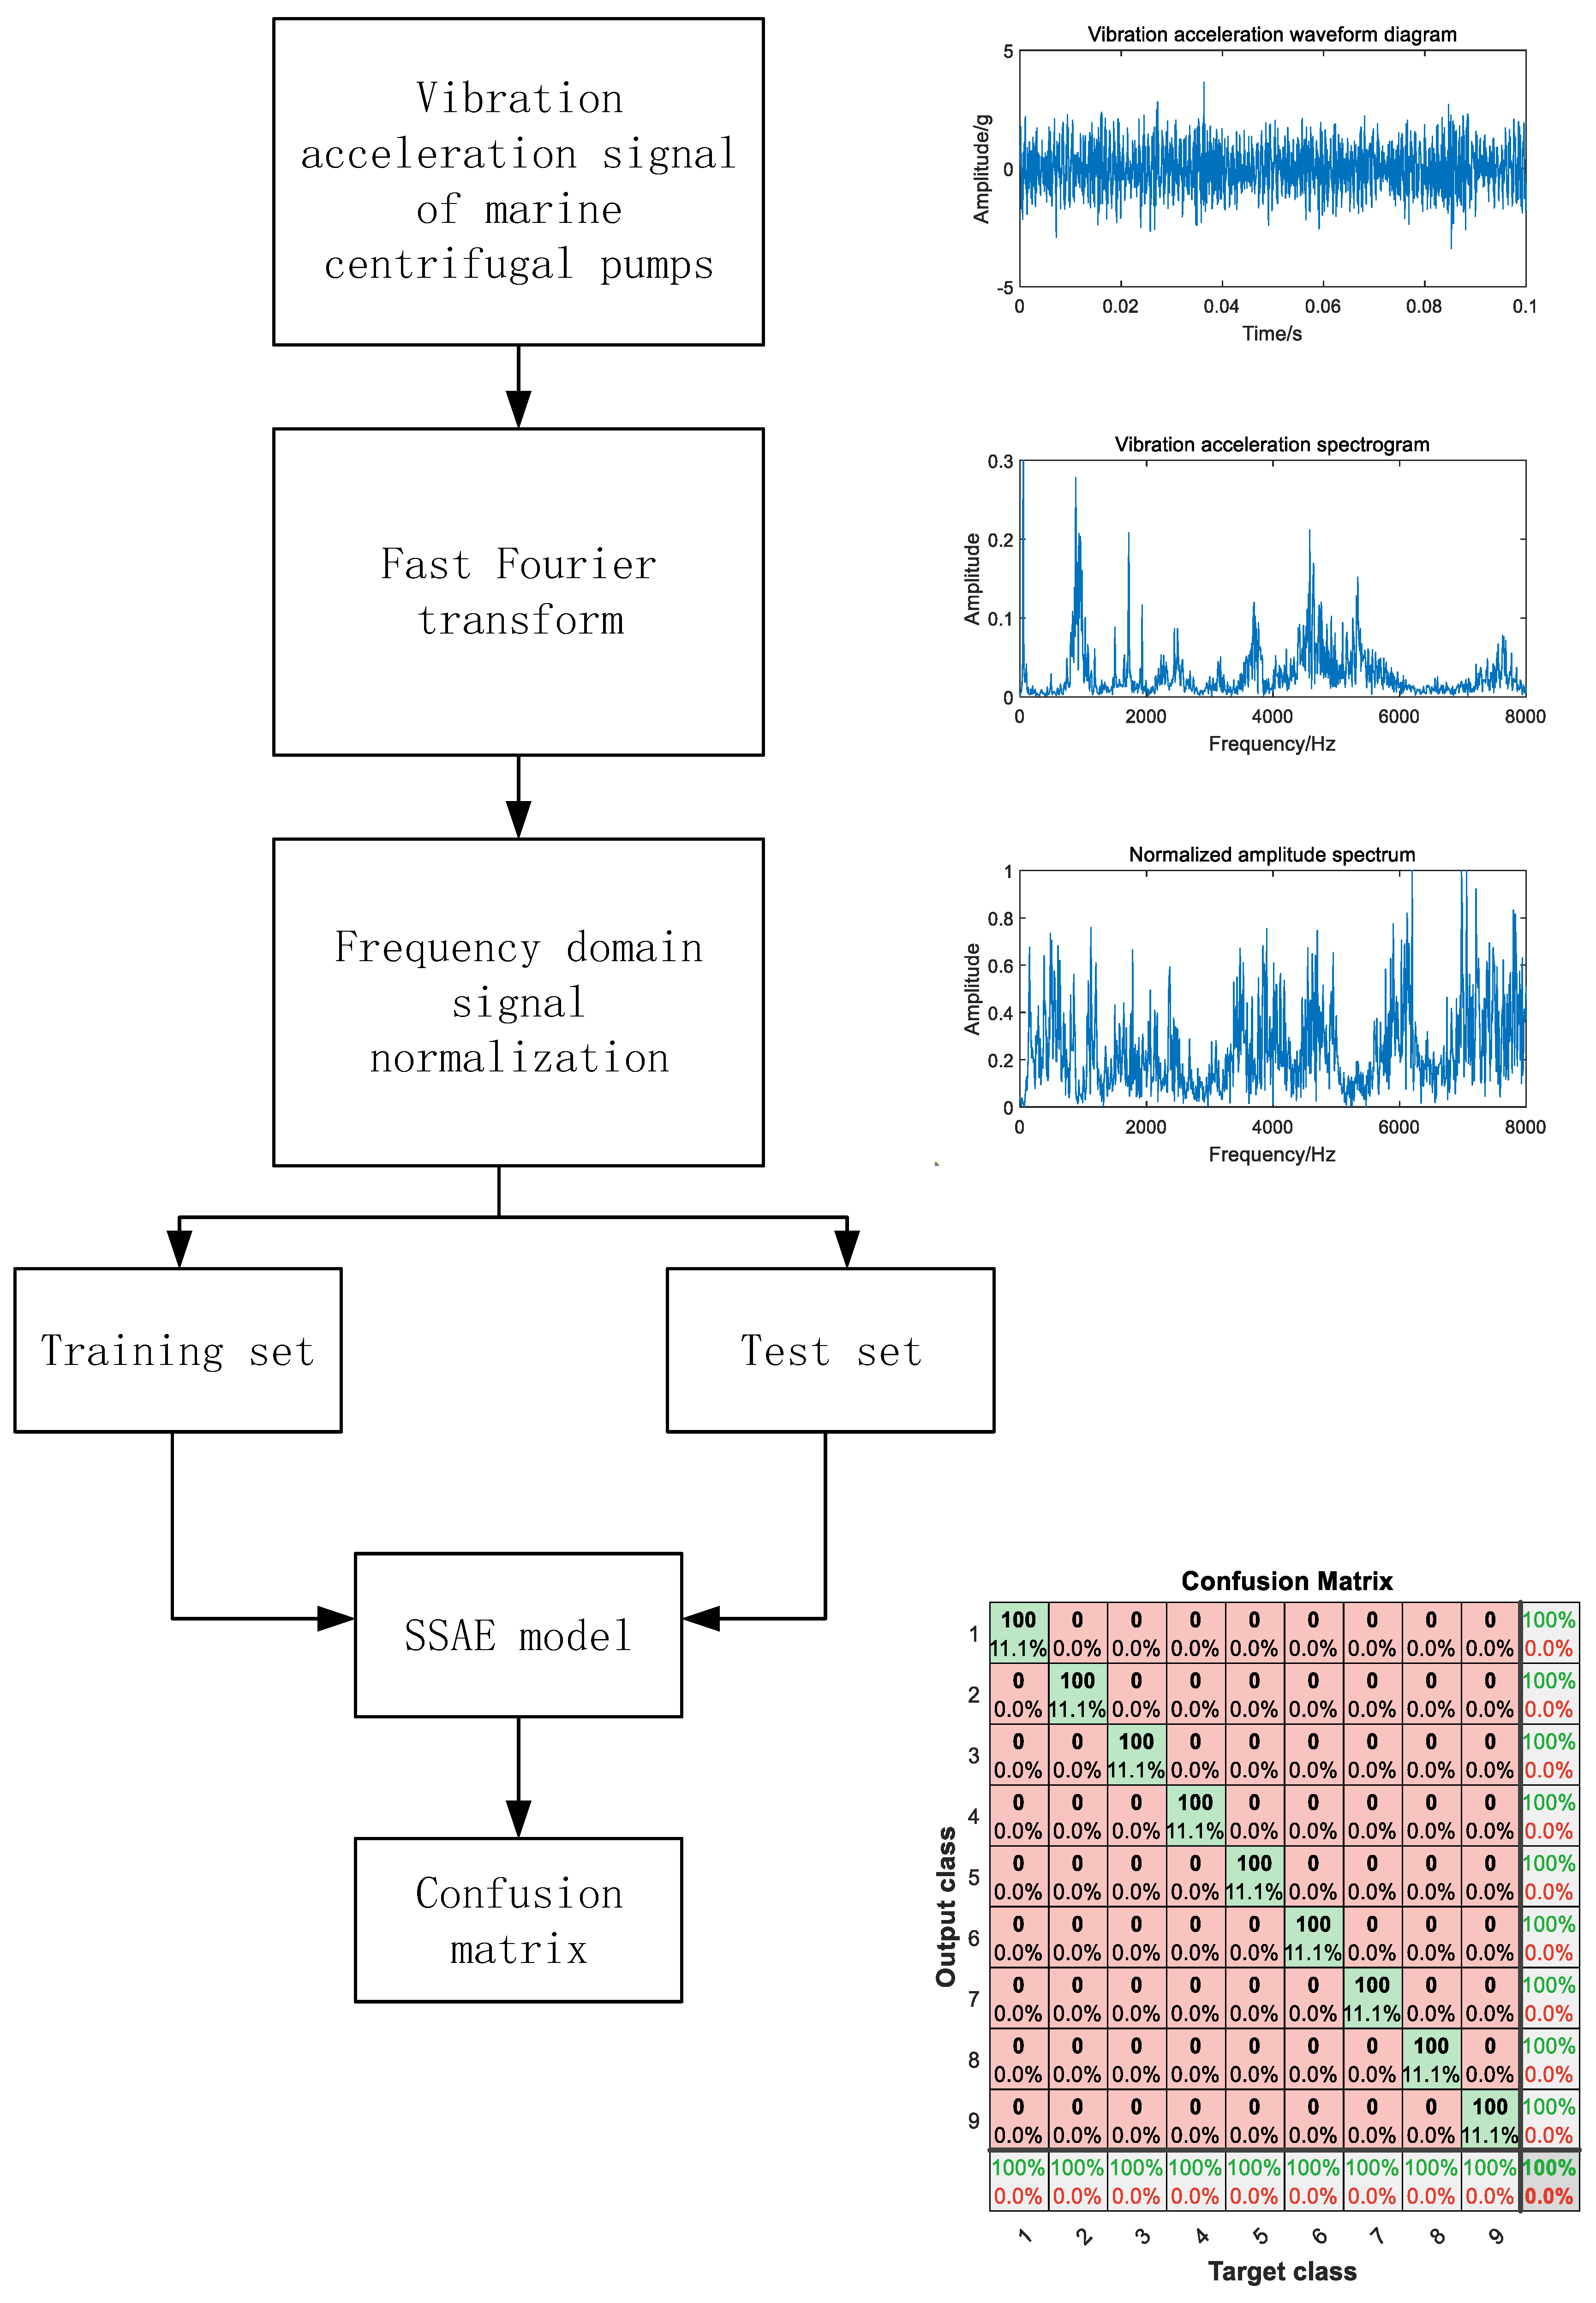
A total of 2250 sets of time domain signals were collected under the 9 states of MCP. Since the acquisition time was 0.1 s, the length of each set of time domain signals was 2000 and the data matrix was 2250 × 2000. The time domain signal was transformed via fast Fourier transform and normalized, and the data matrix became 2250 × 1000. Then, 150 samples in each state were randomly selected as the training set, and the remaining 100 samples were the test set. The training set matrix was 1350 × 1000 and the test set matrix was 900 × 1000. The specific division results are shown in
Table 1.
The training set matrix was input into the SSAE model for feature extraction, and the parameters of the SSAE model were set as described in
Table 2.
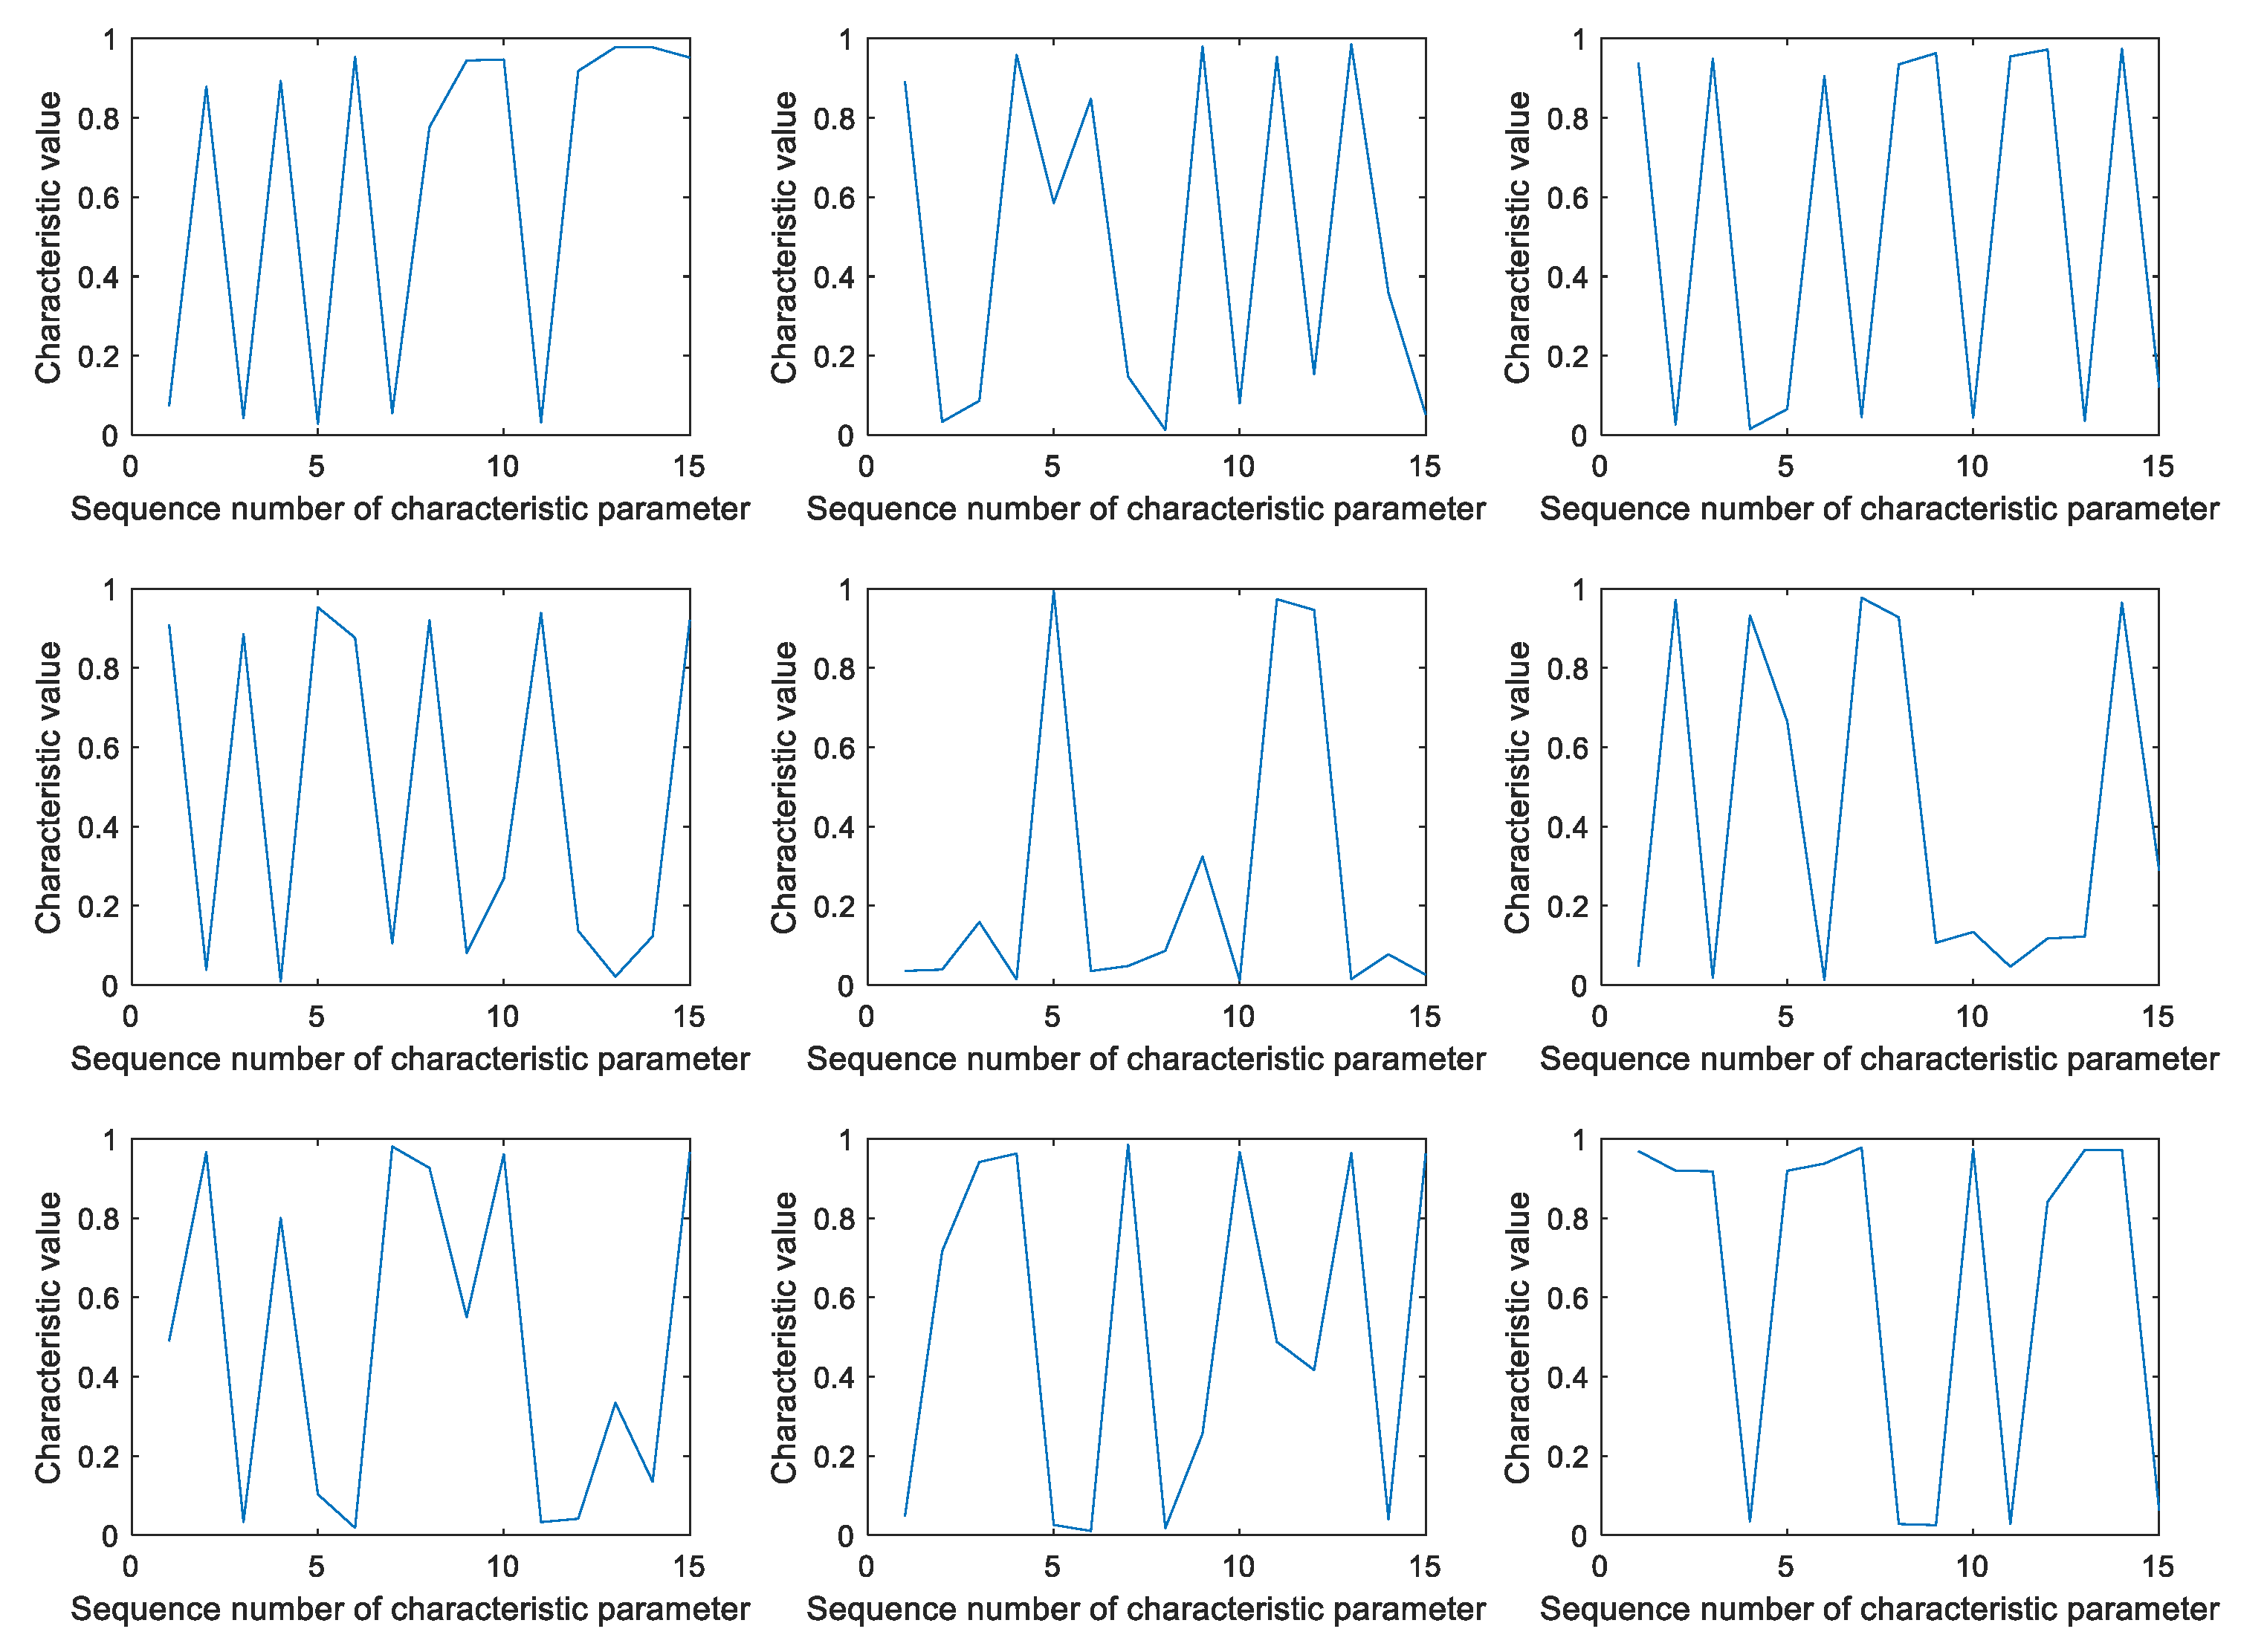
Fifteen characteristic parameters extracted under the nine MCP states have been randomly selected for display, as shown in
Figure 8 below. It can be seen from this figure that the characteristics in the MCP vibration signals extracted with the SSAE can reflect their different statuses.
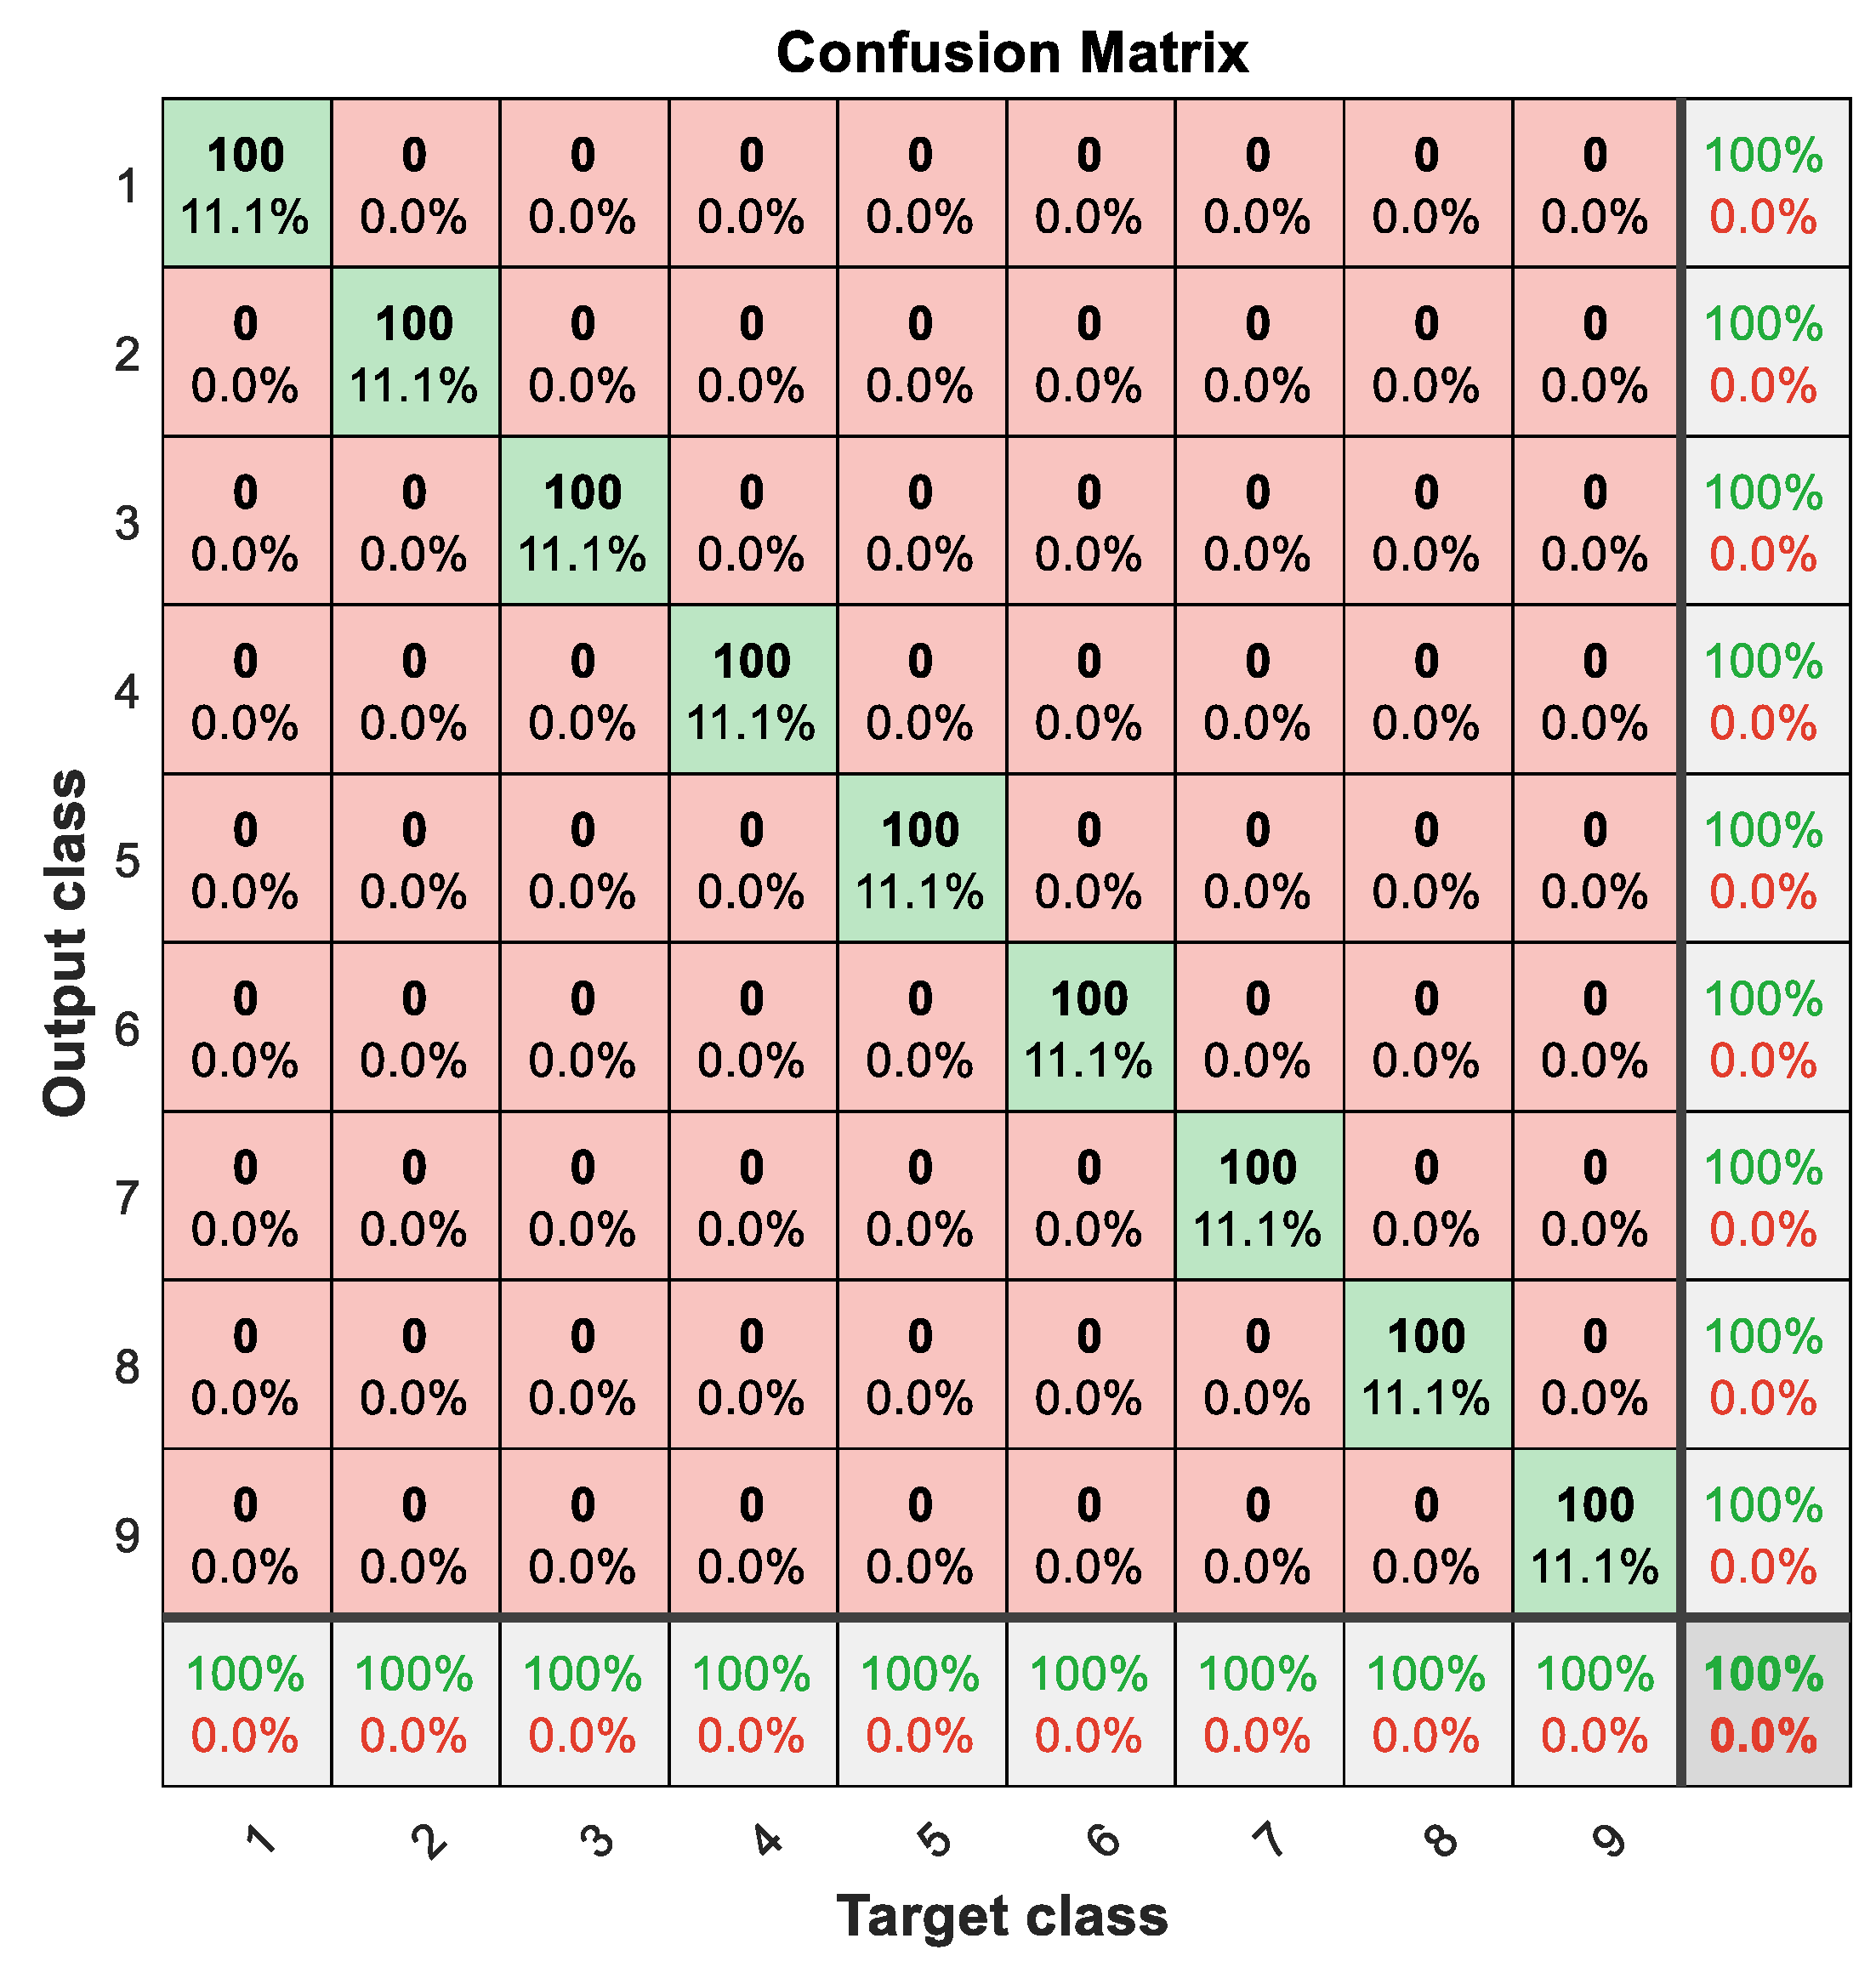
The extracted feature parameters were input into the classifier for classification training and verified through the test set. The verification matrix is shown in
Figure 9. As can be seen from
Figure 9, after feature extraction via the SSAE, the MCP status recognition accuracy reaches 100%, and the effect is very good.
In order to compare the advantages and disadvantages of the proposed method with other methods, two other methods have been selected for comparison. The first method is to extract 16 time domain characteristics of MCP vibration signals under different states, including the peak-to-peak value, variance, kurtosis, skewness, waveform factor, peak factor, margin factor, etc. The 16 features of the training set are input to the classifier for classification training and verified with the test set. The second method is to decompose each vibration signal of the MCP in different statuses into five modal components using VMD, and calculate the fuzzy entropy of the five modal components as its characteristics. The fuzzy entropy of modal components in each state of the training set is input to the classifier for classification training and verified using the test set.
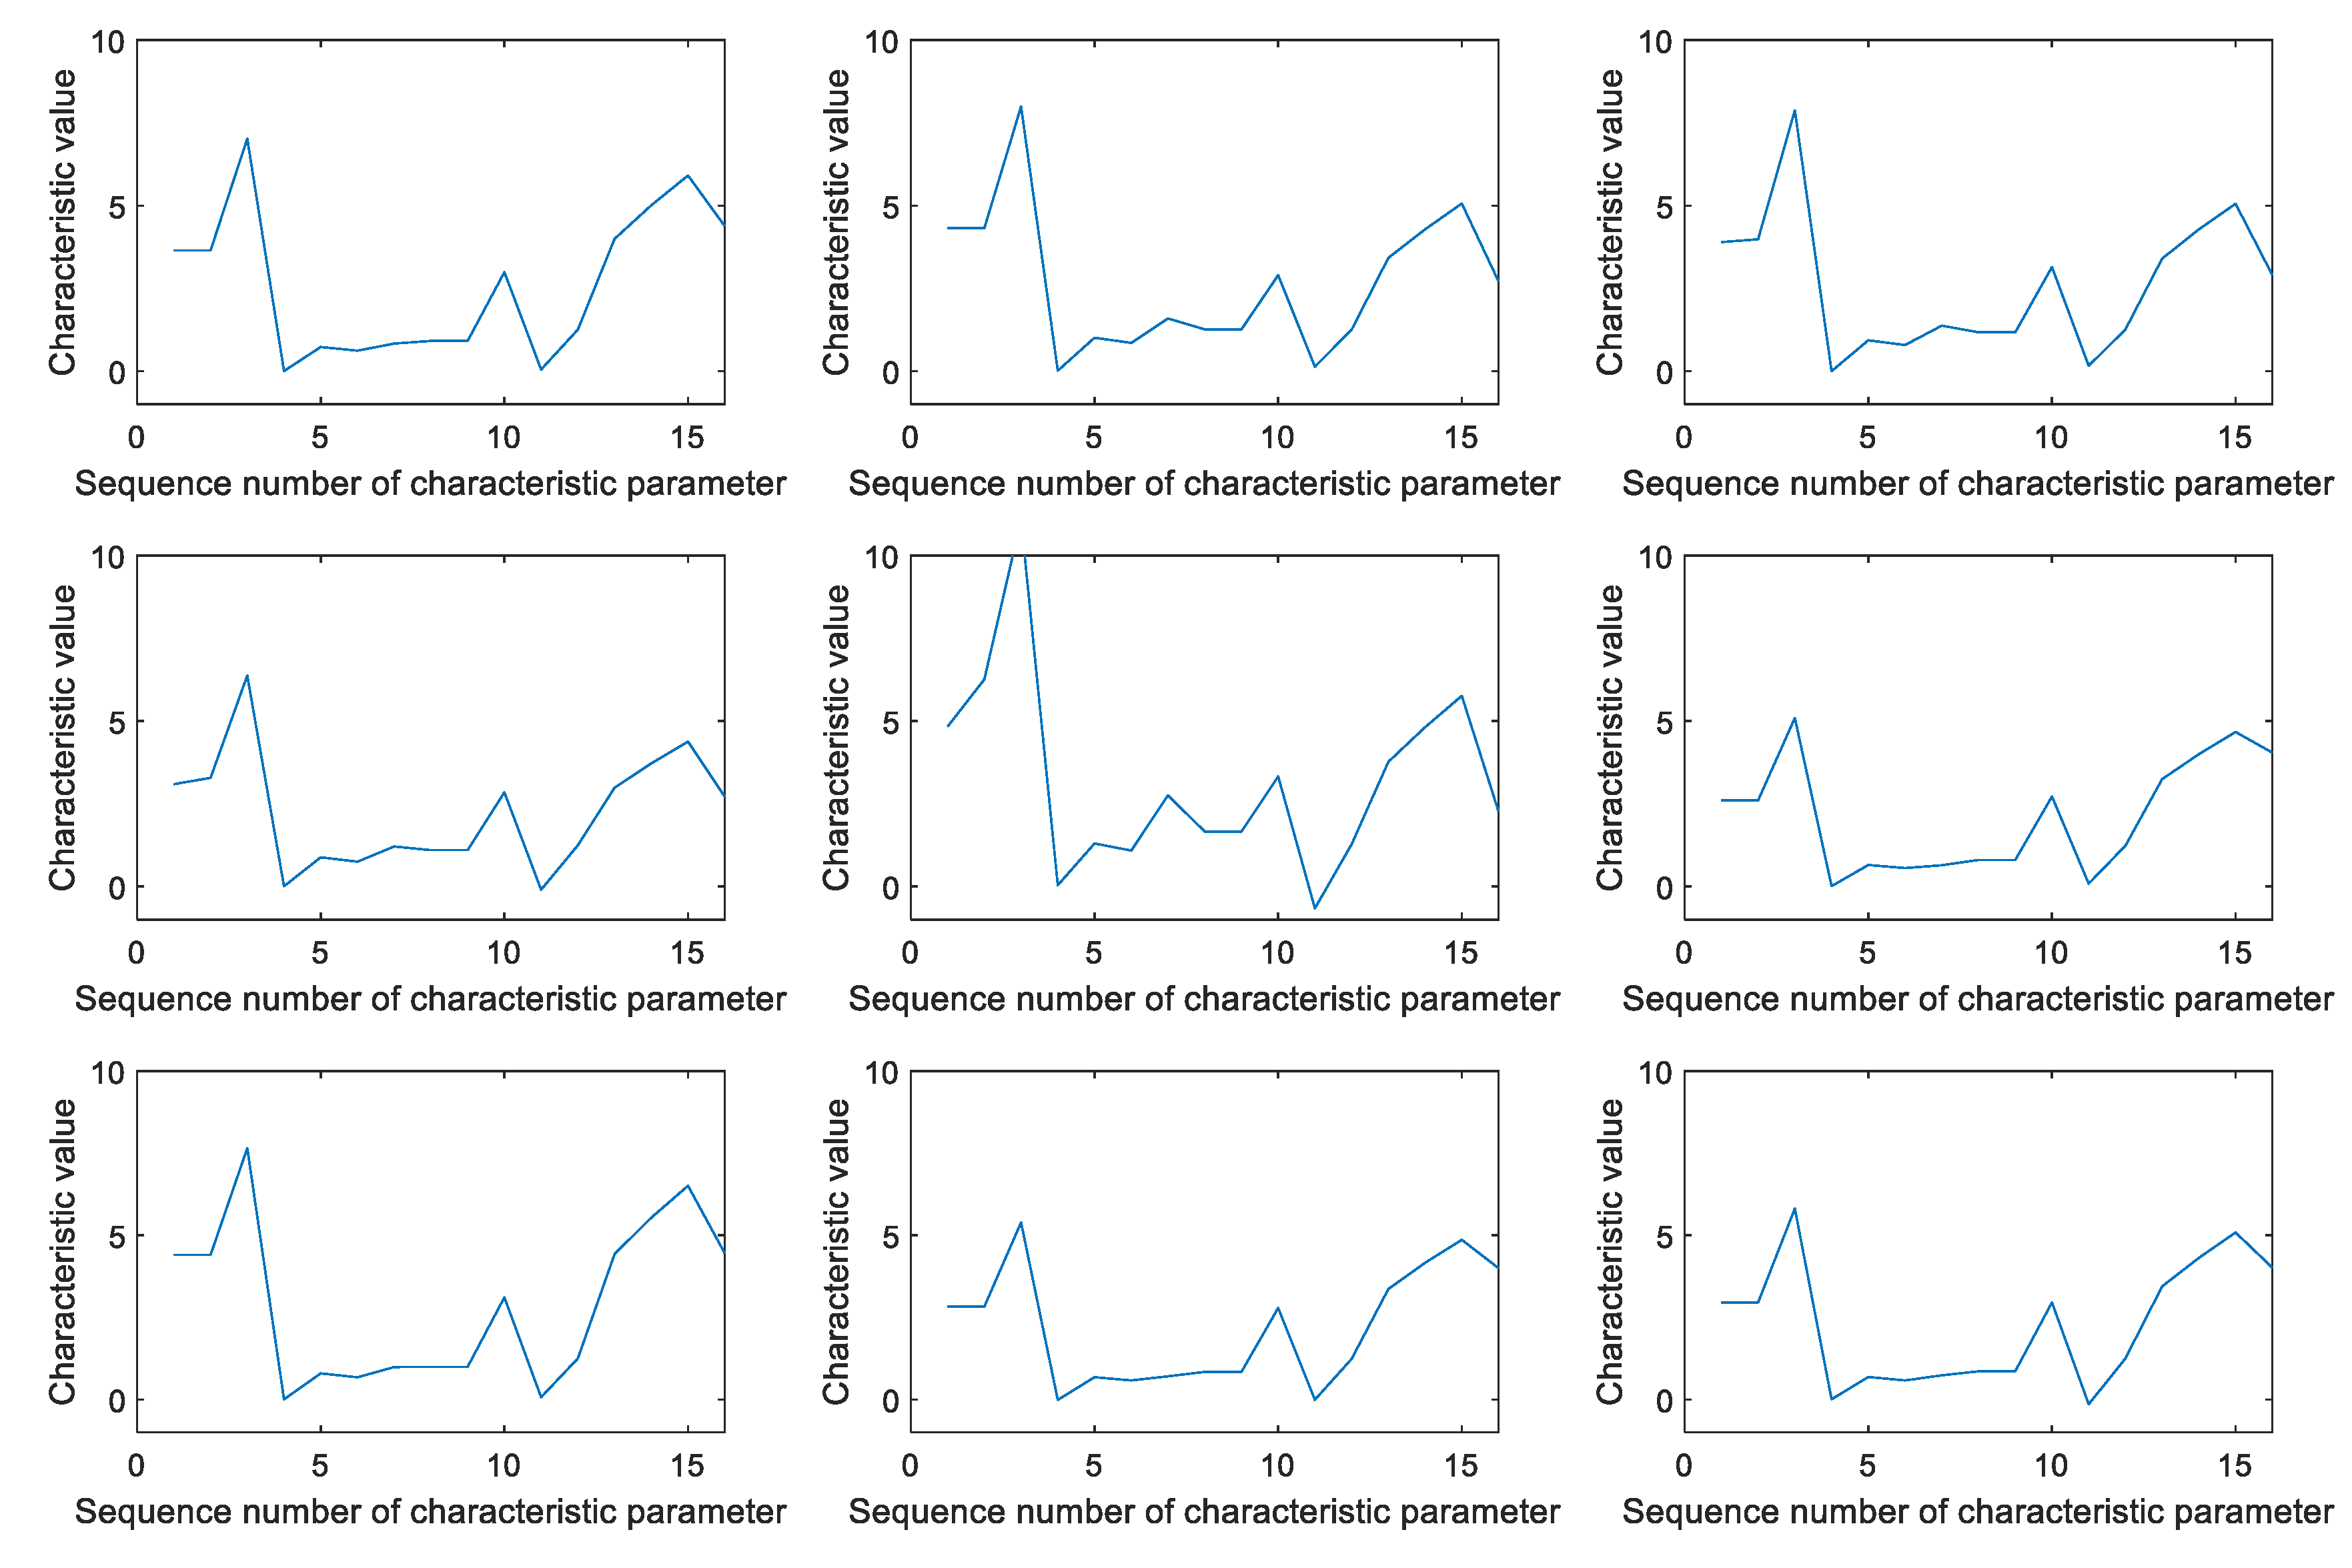
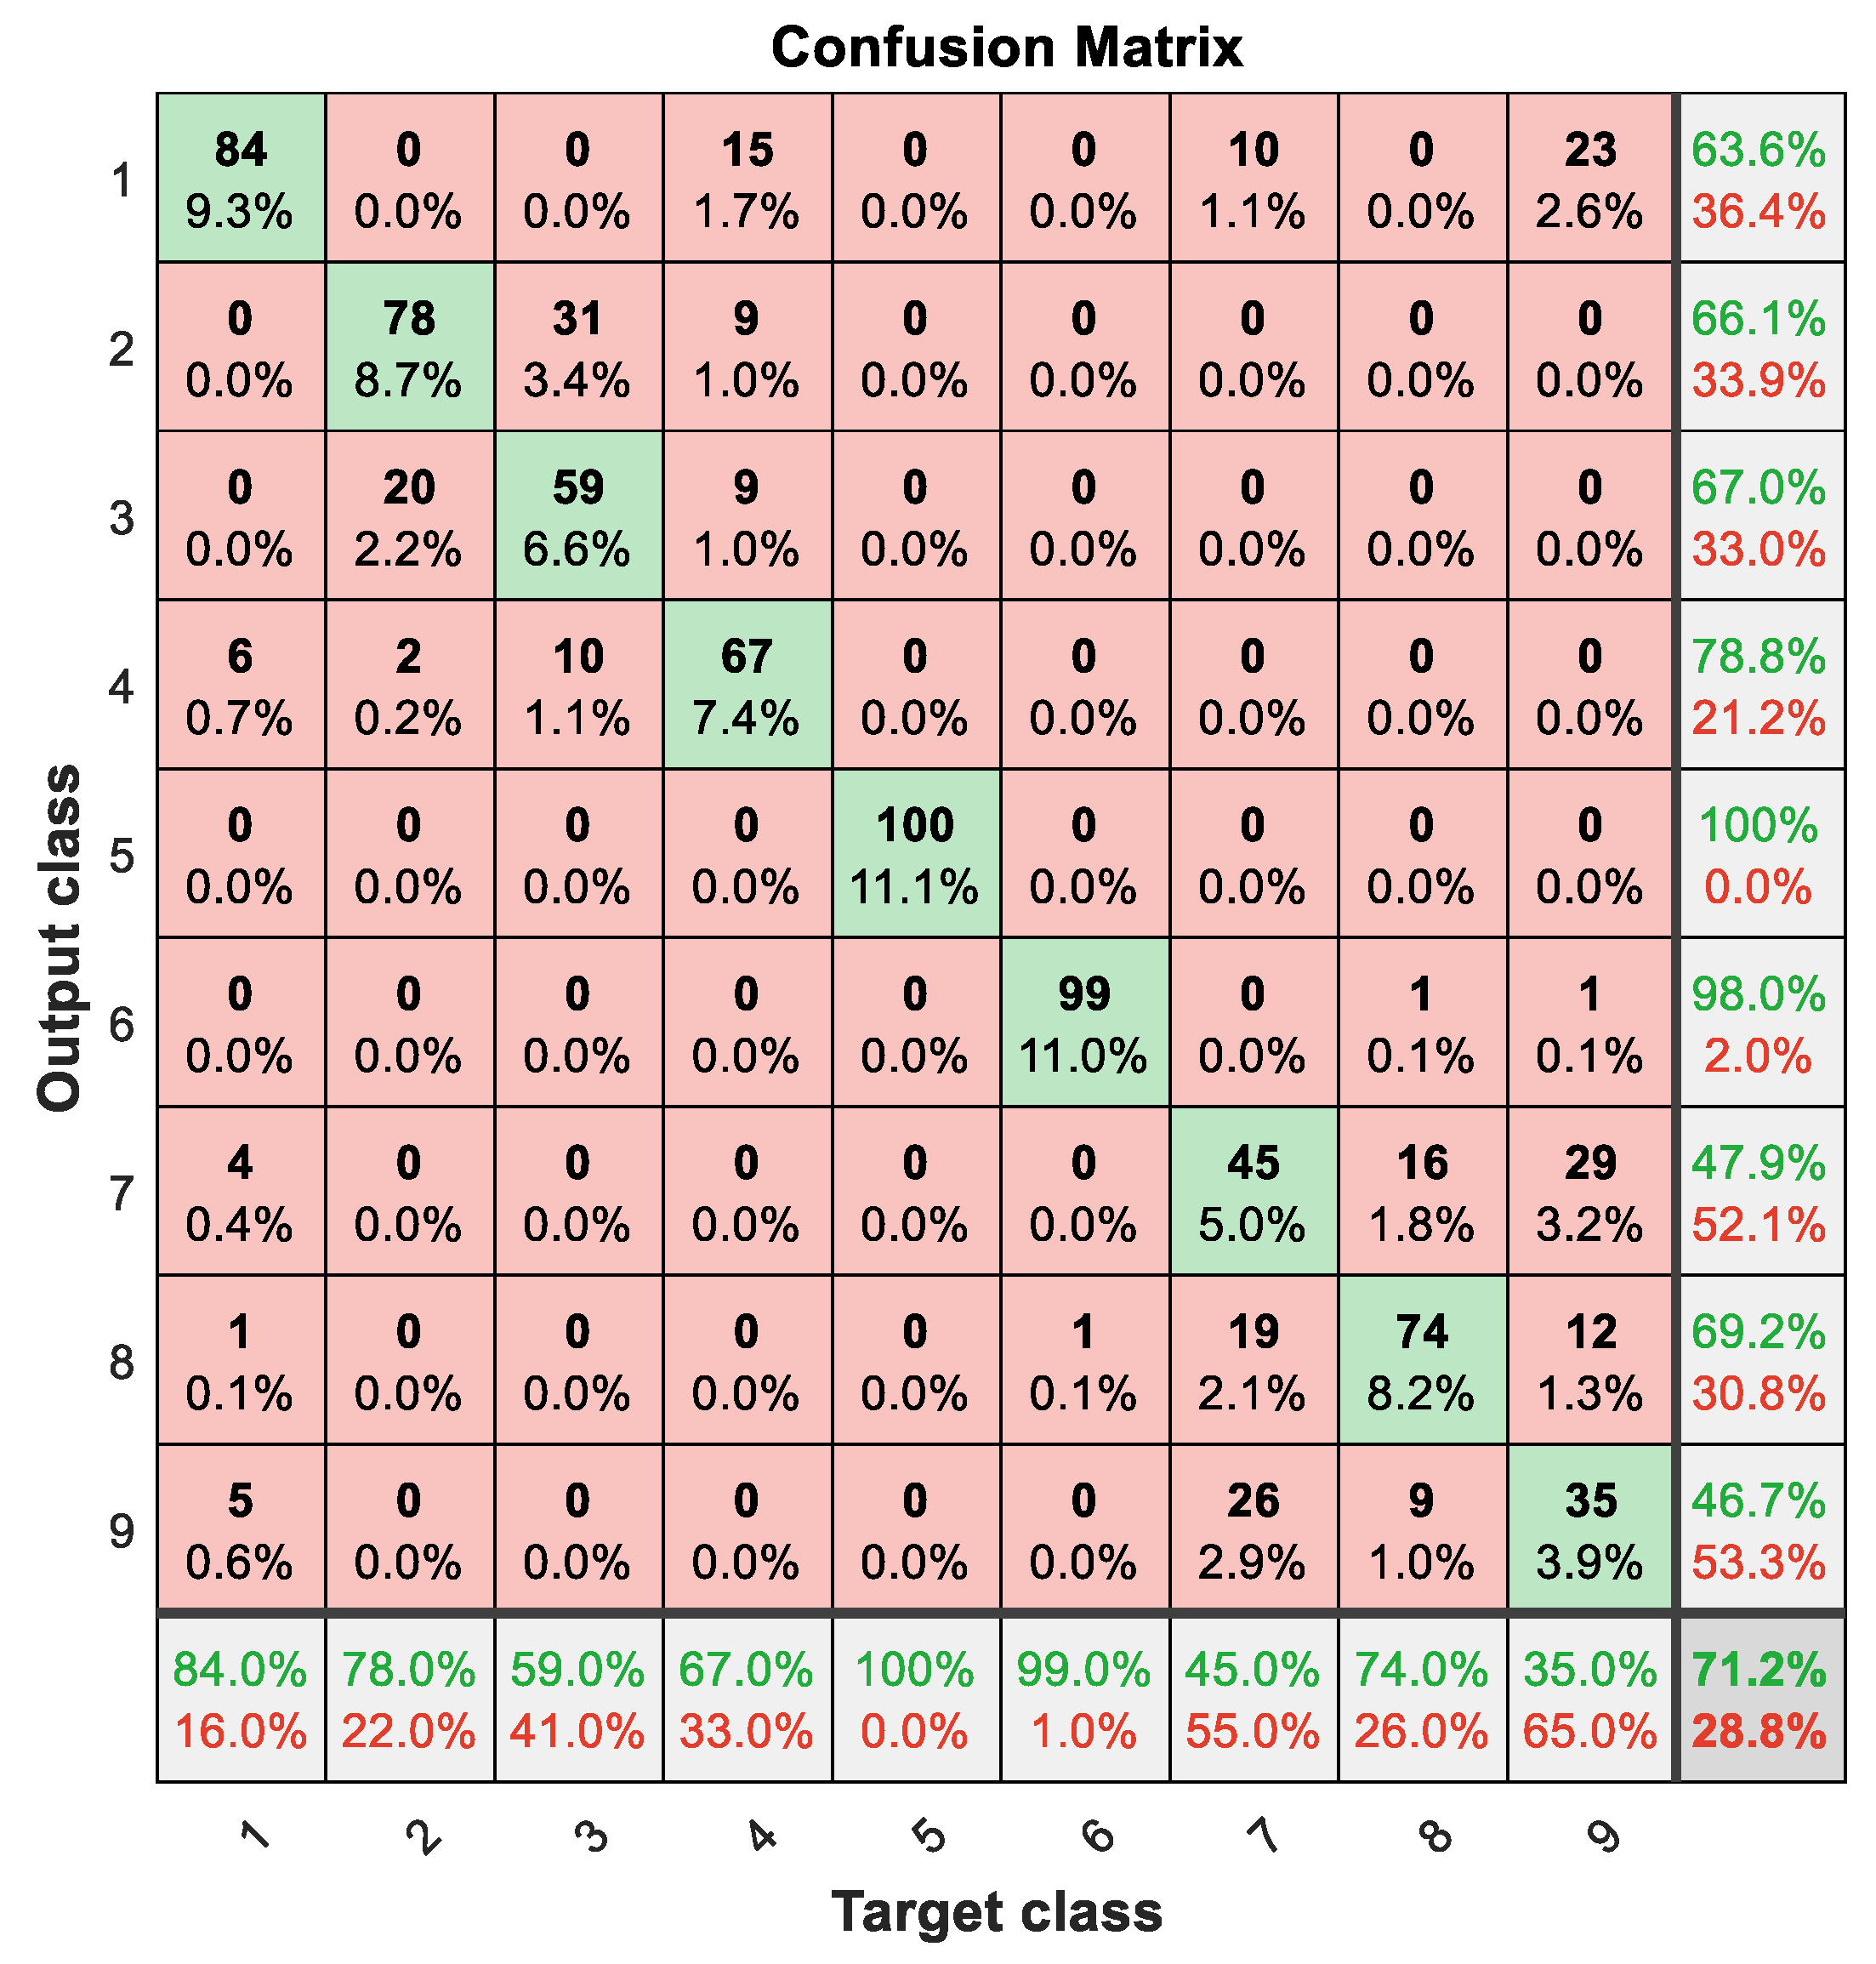
The time domain features of nine statuses have been randomly selected for display, as shown in
Figure 10. As can be seen from
Figure 10, the time domain feature differentiation between different MCP statuses is very poor. The 16 time domain features of the training set were input into the classifier for classification training. The confusion matrix verified with the test set is shown in
Figure 10. As can be seen from
Figure 11, the overall accuracy of MCP status recognition using this method is only 71.2%, and the effect is not good.
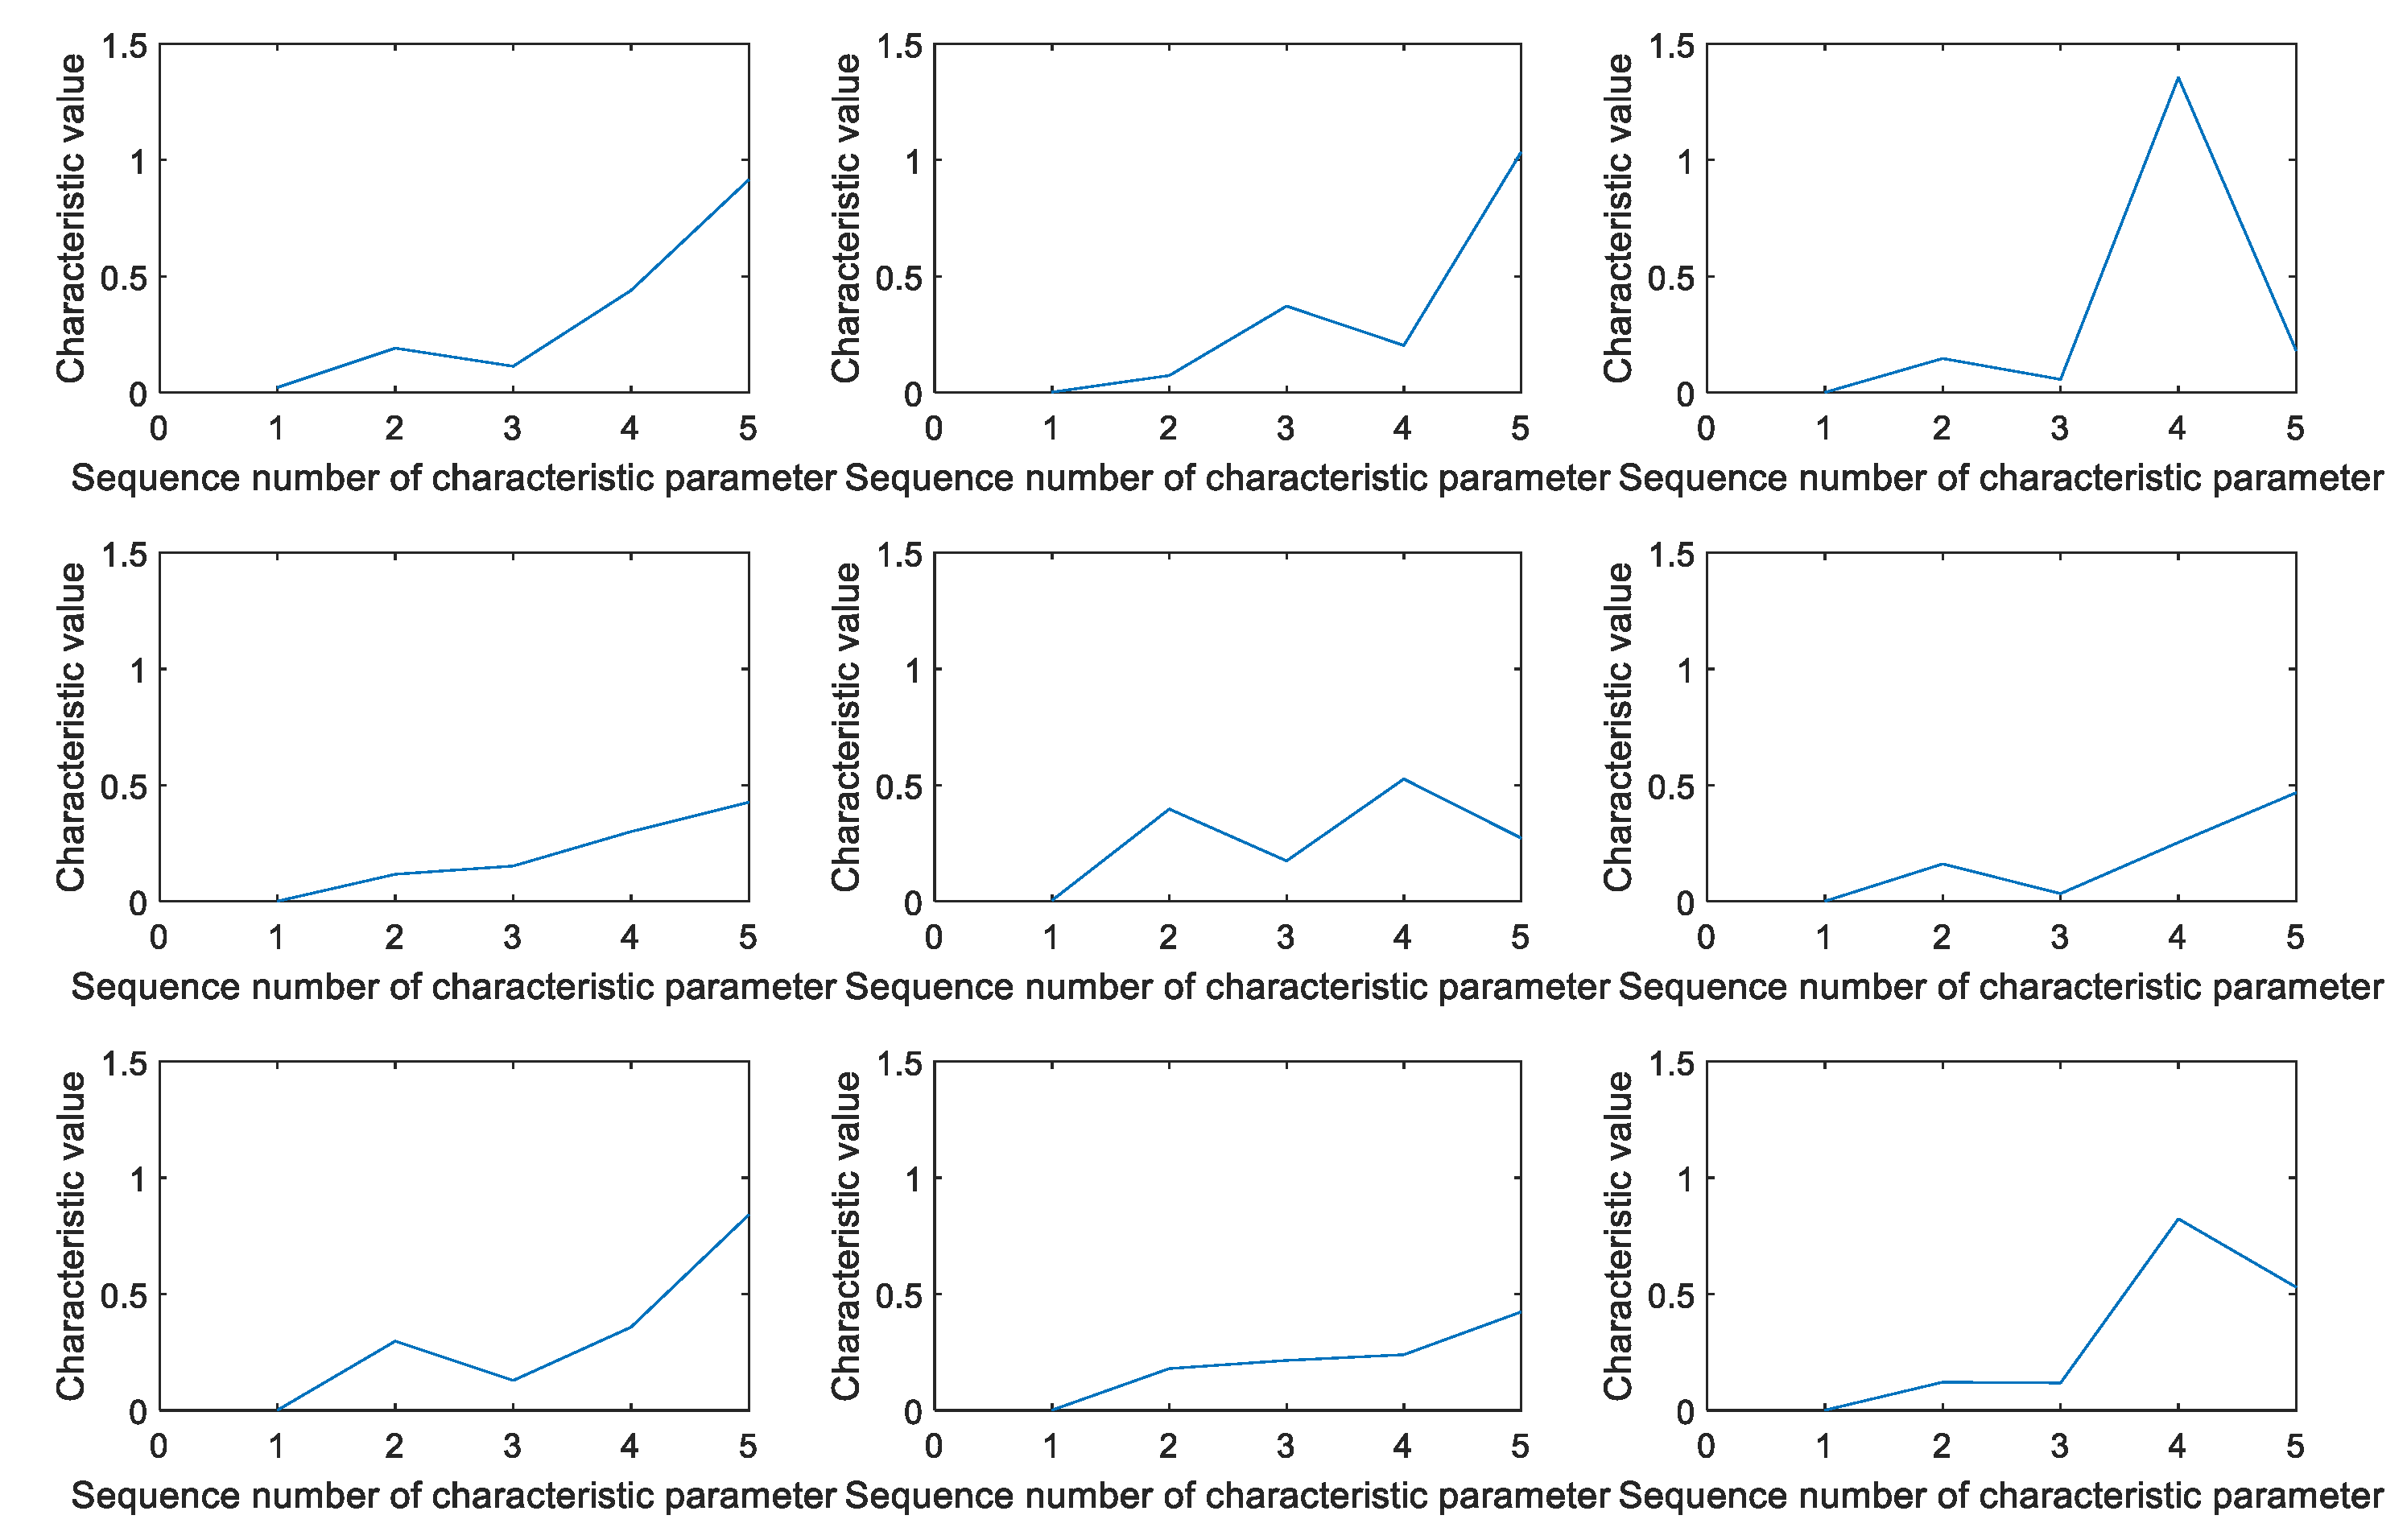
The training set was decomposed into VMD: each signal was decomposed into five modal components, and the fuzzy entropy of the five modal components was calculated. The fuzzy entropy trends under nine states are shown in
Figure 12, below. It can be seen from
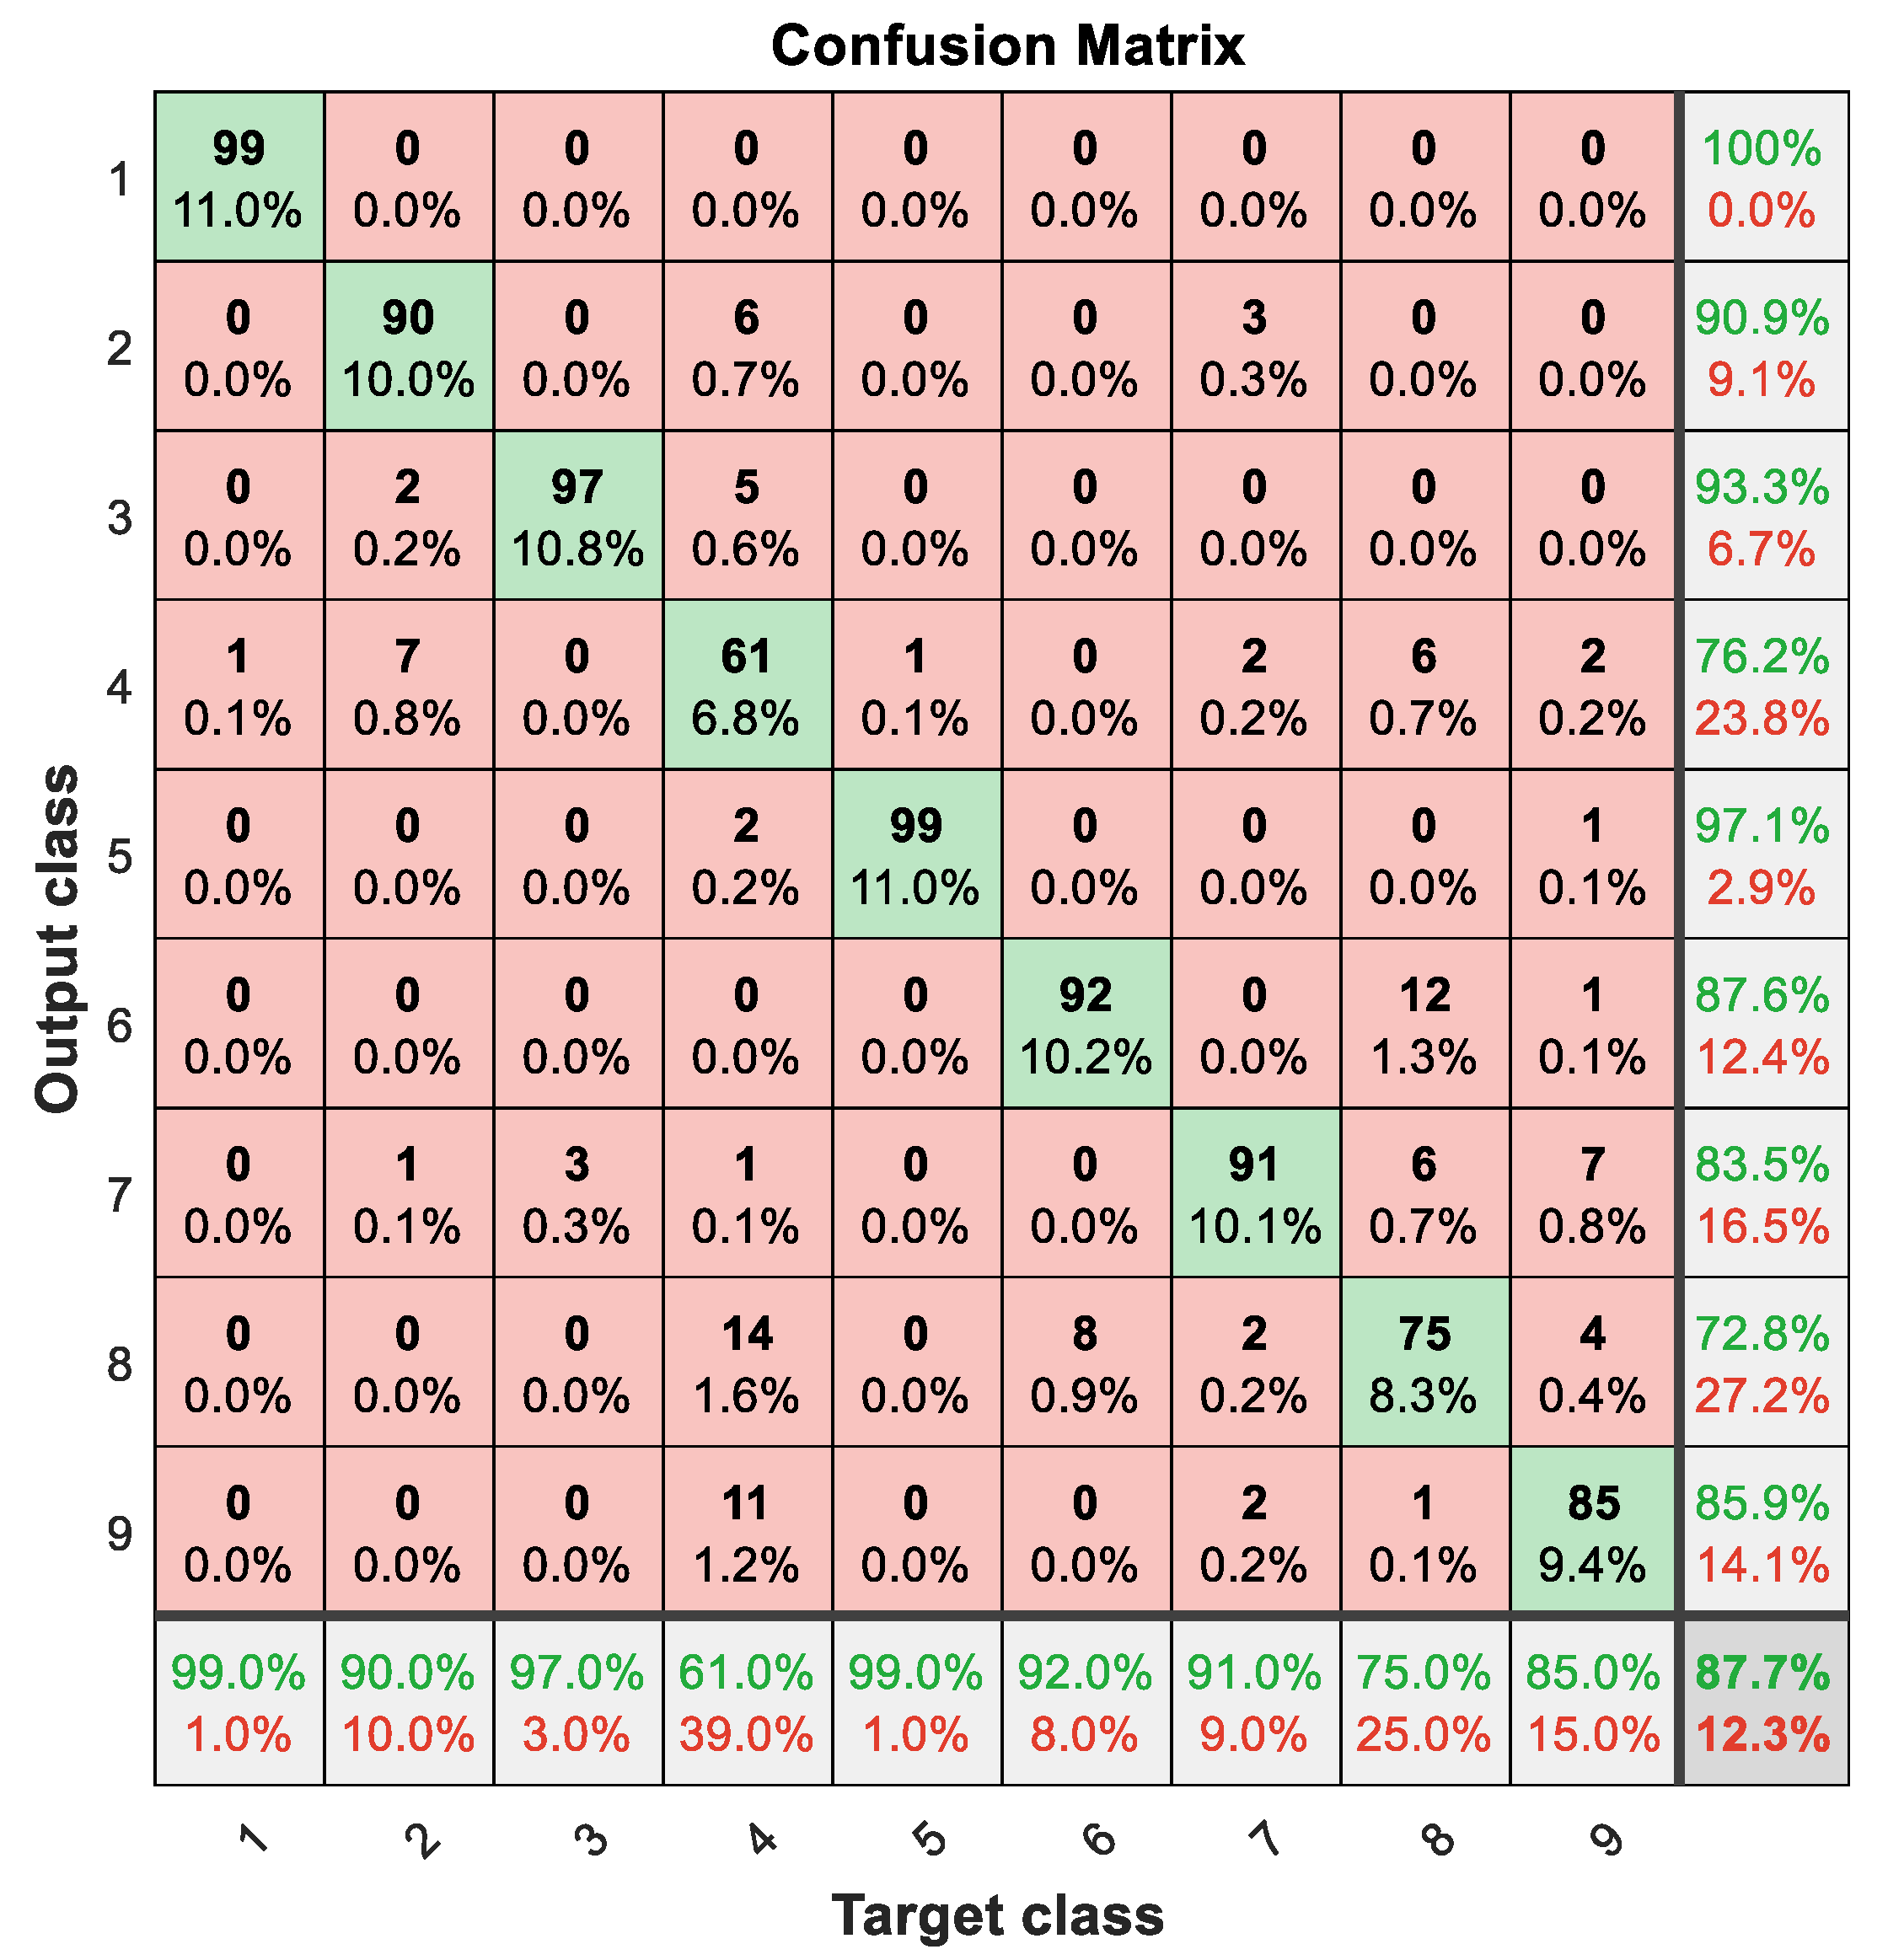
Figure 11 that the trend of fuzzy entropy can roughly distinguish between different statuses of the MCP, but the fuzzy entropy trends in the S1 state and S6 state are close. Five fuzzy entropy features in each state of the training set were input to the classifier as features for training. The confusion matrix verified with the test set is shown on then
Figure 12. As can be seen from
Figure 13, the overall accuracy of MCP status recognition with this method is 87.7%, and the effect is much better than that of the time domain characteristics method.
Status recognition of an MCP based on the SSAE, MCP status recognition based on time domain features, and MCP status recognition based on fuzzy entropy features have been compared. The accuracy of the MCP status recognition method based on time domain features is the lowest, followed by the accuracy of the MCP status recognition method based on fuzzy entropy features; the MCP status recognition accuracy of on the SSAE-based method is up to 100%, and its effect is the best.


