
Enhancement of GUI Display Error Detection Using Improved Faster R-CNN and Multi-Scale Attention Mechanism


Abstract
:1. Introduction
2. Related Work
3. Preliminaries
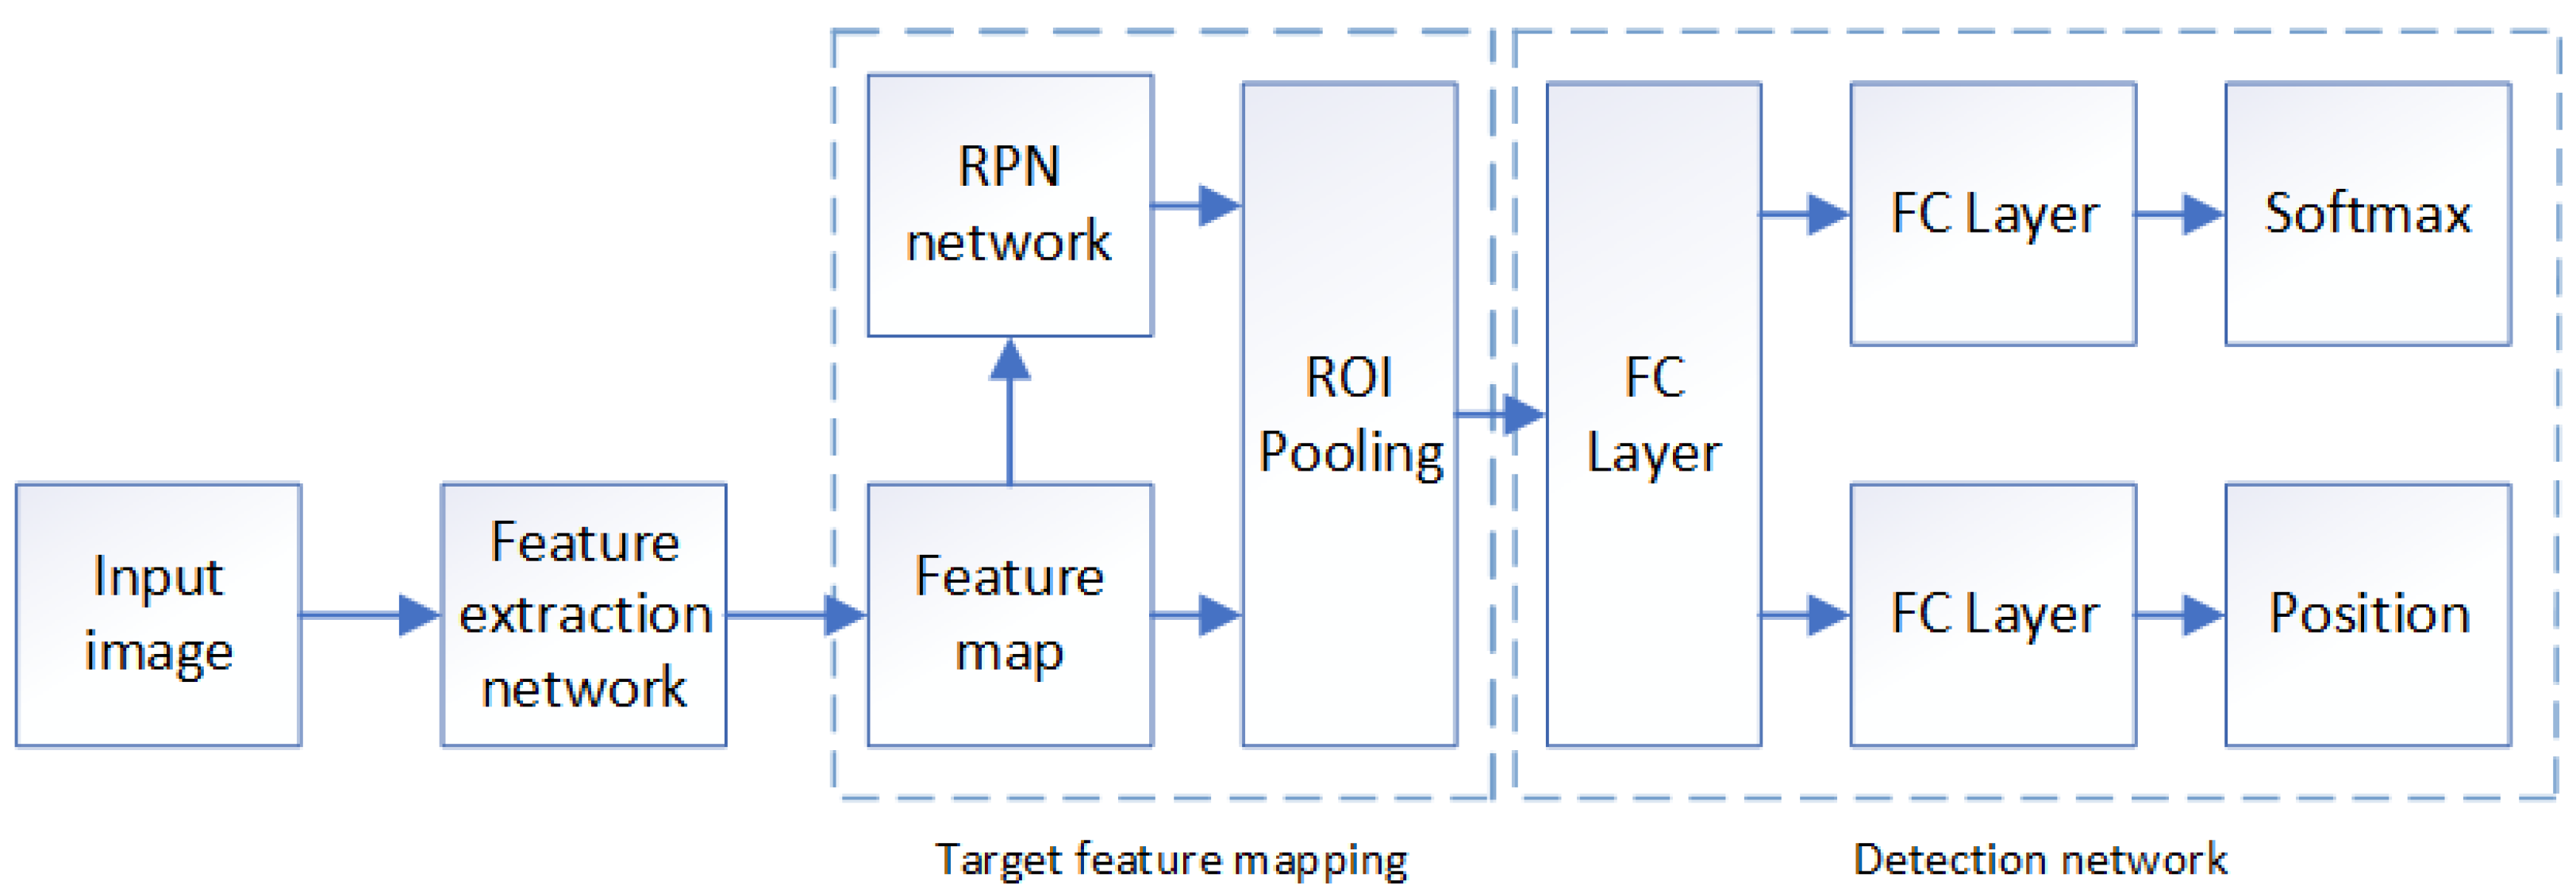
3.1. Faster R-CNN
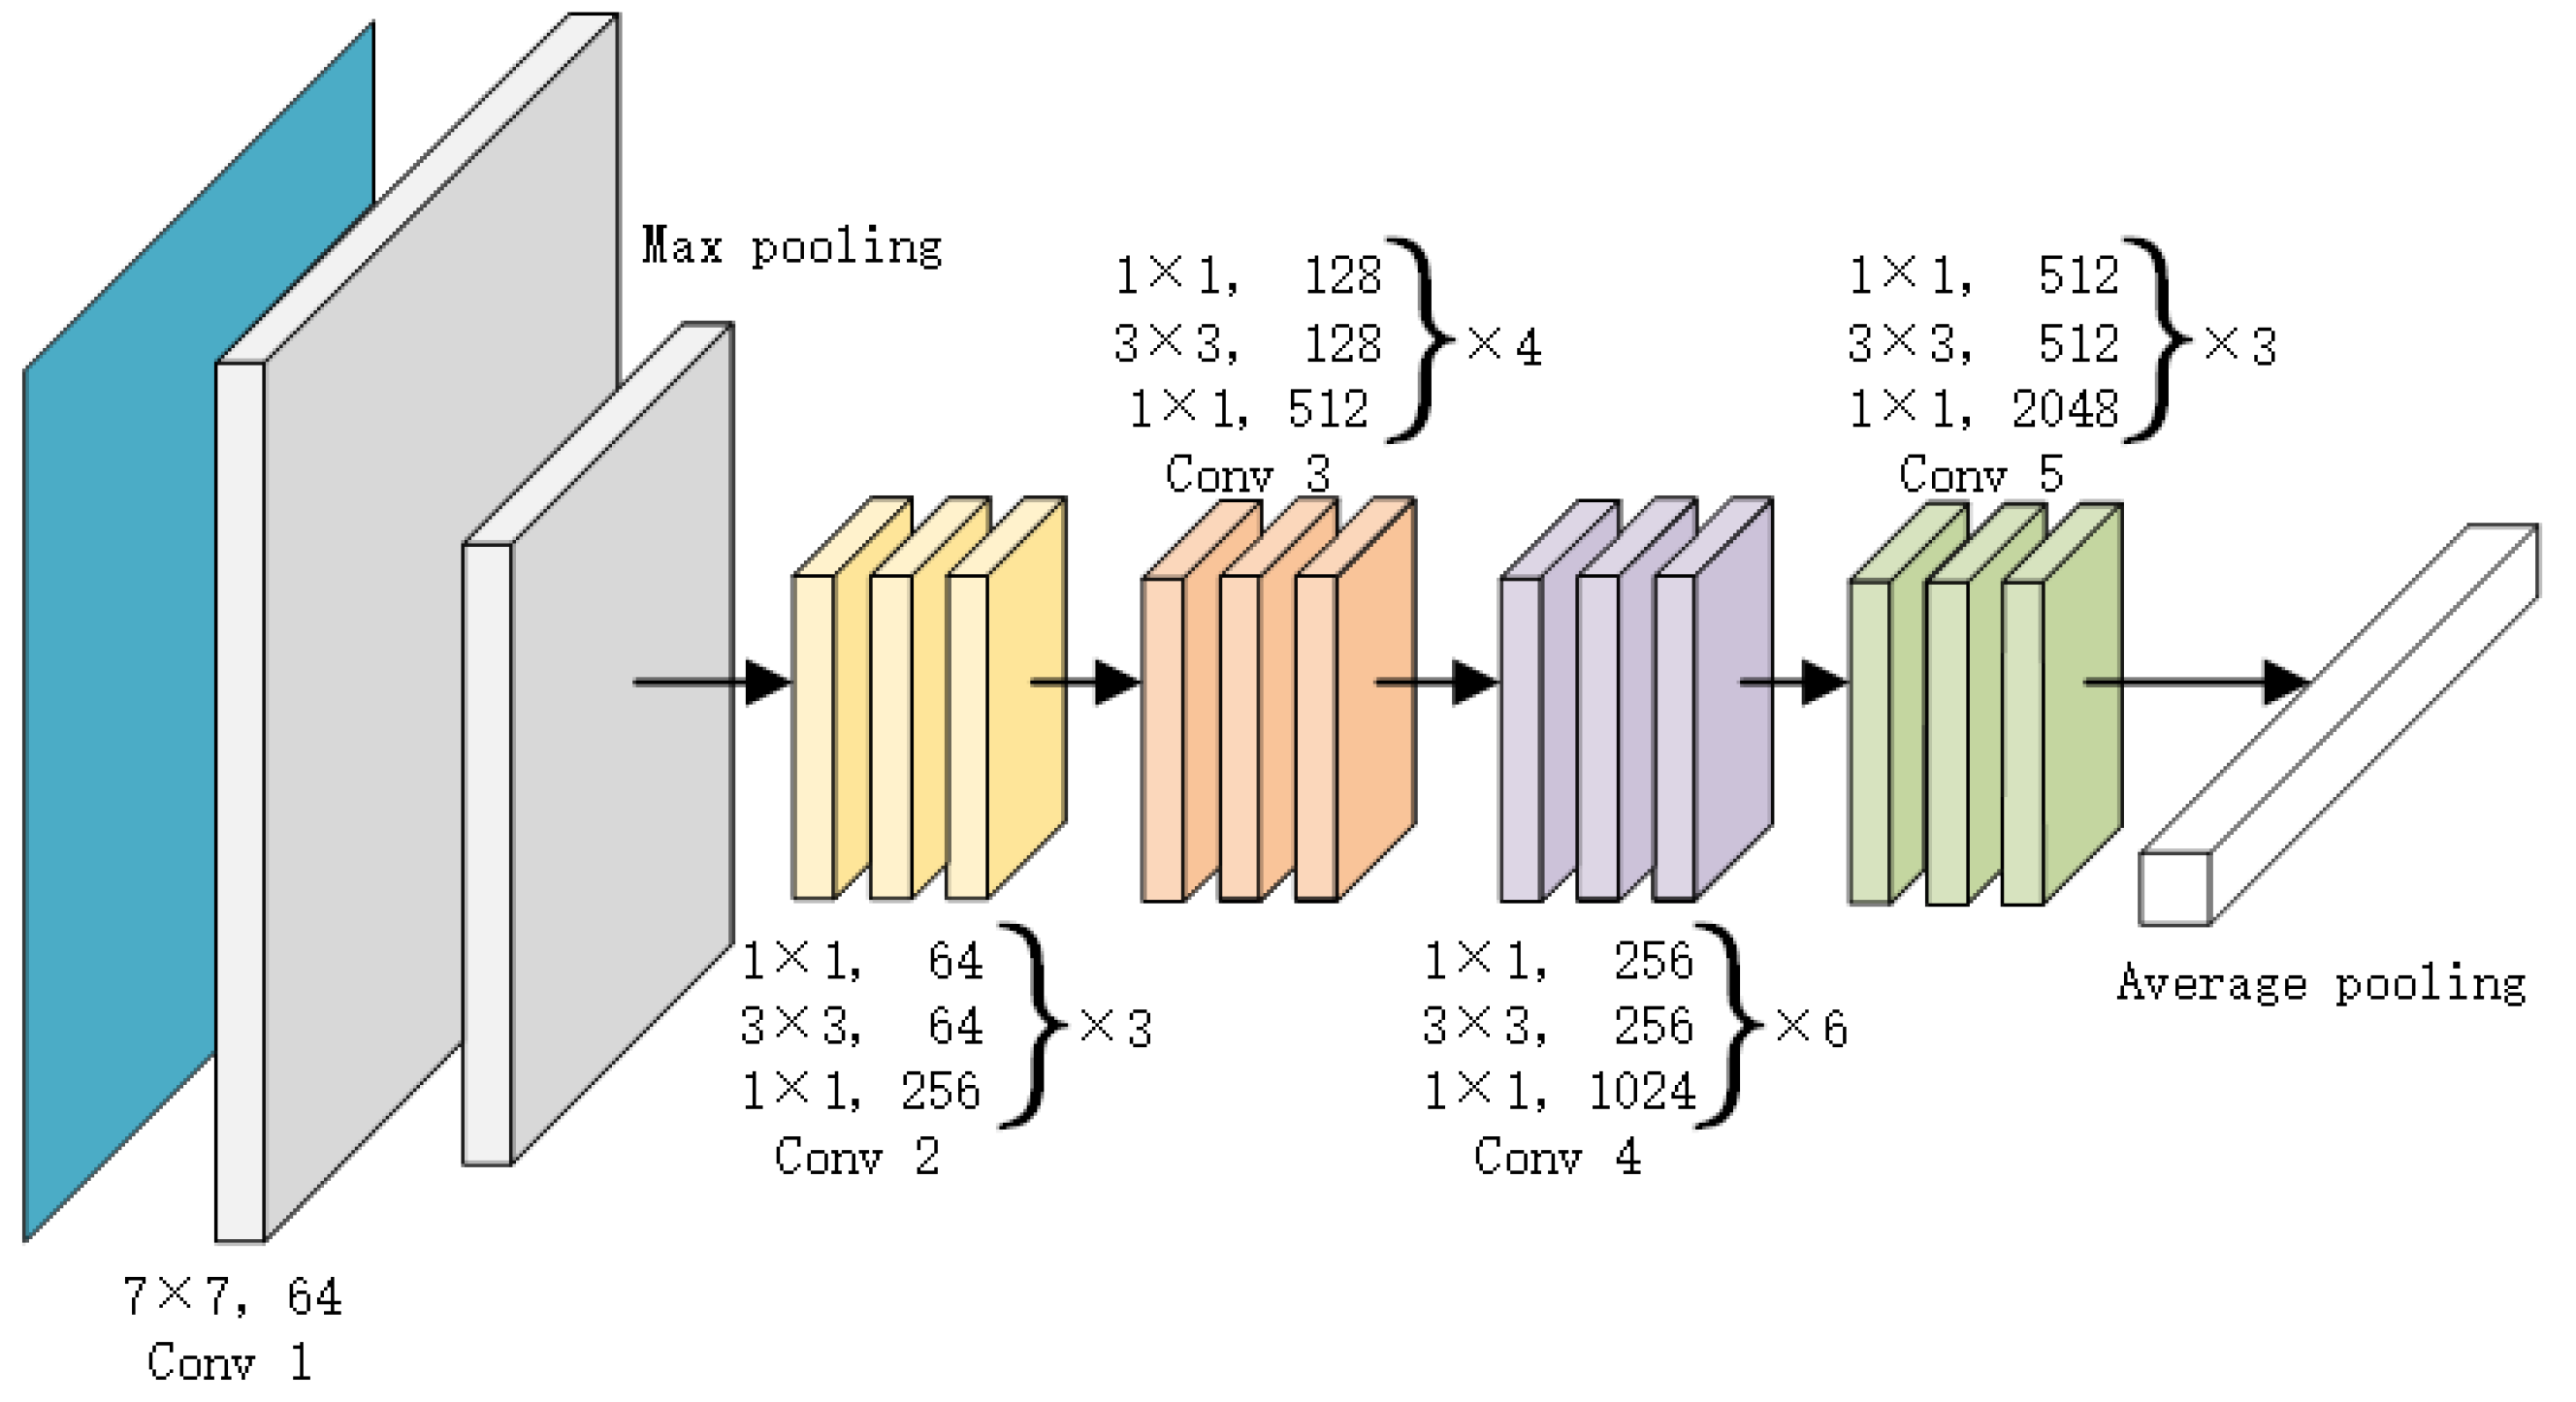
3.2. ResNet-50
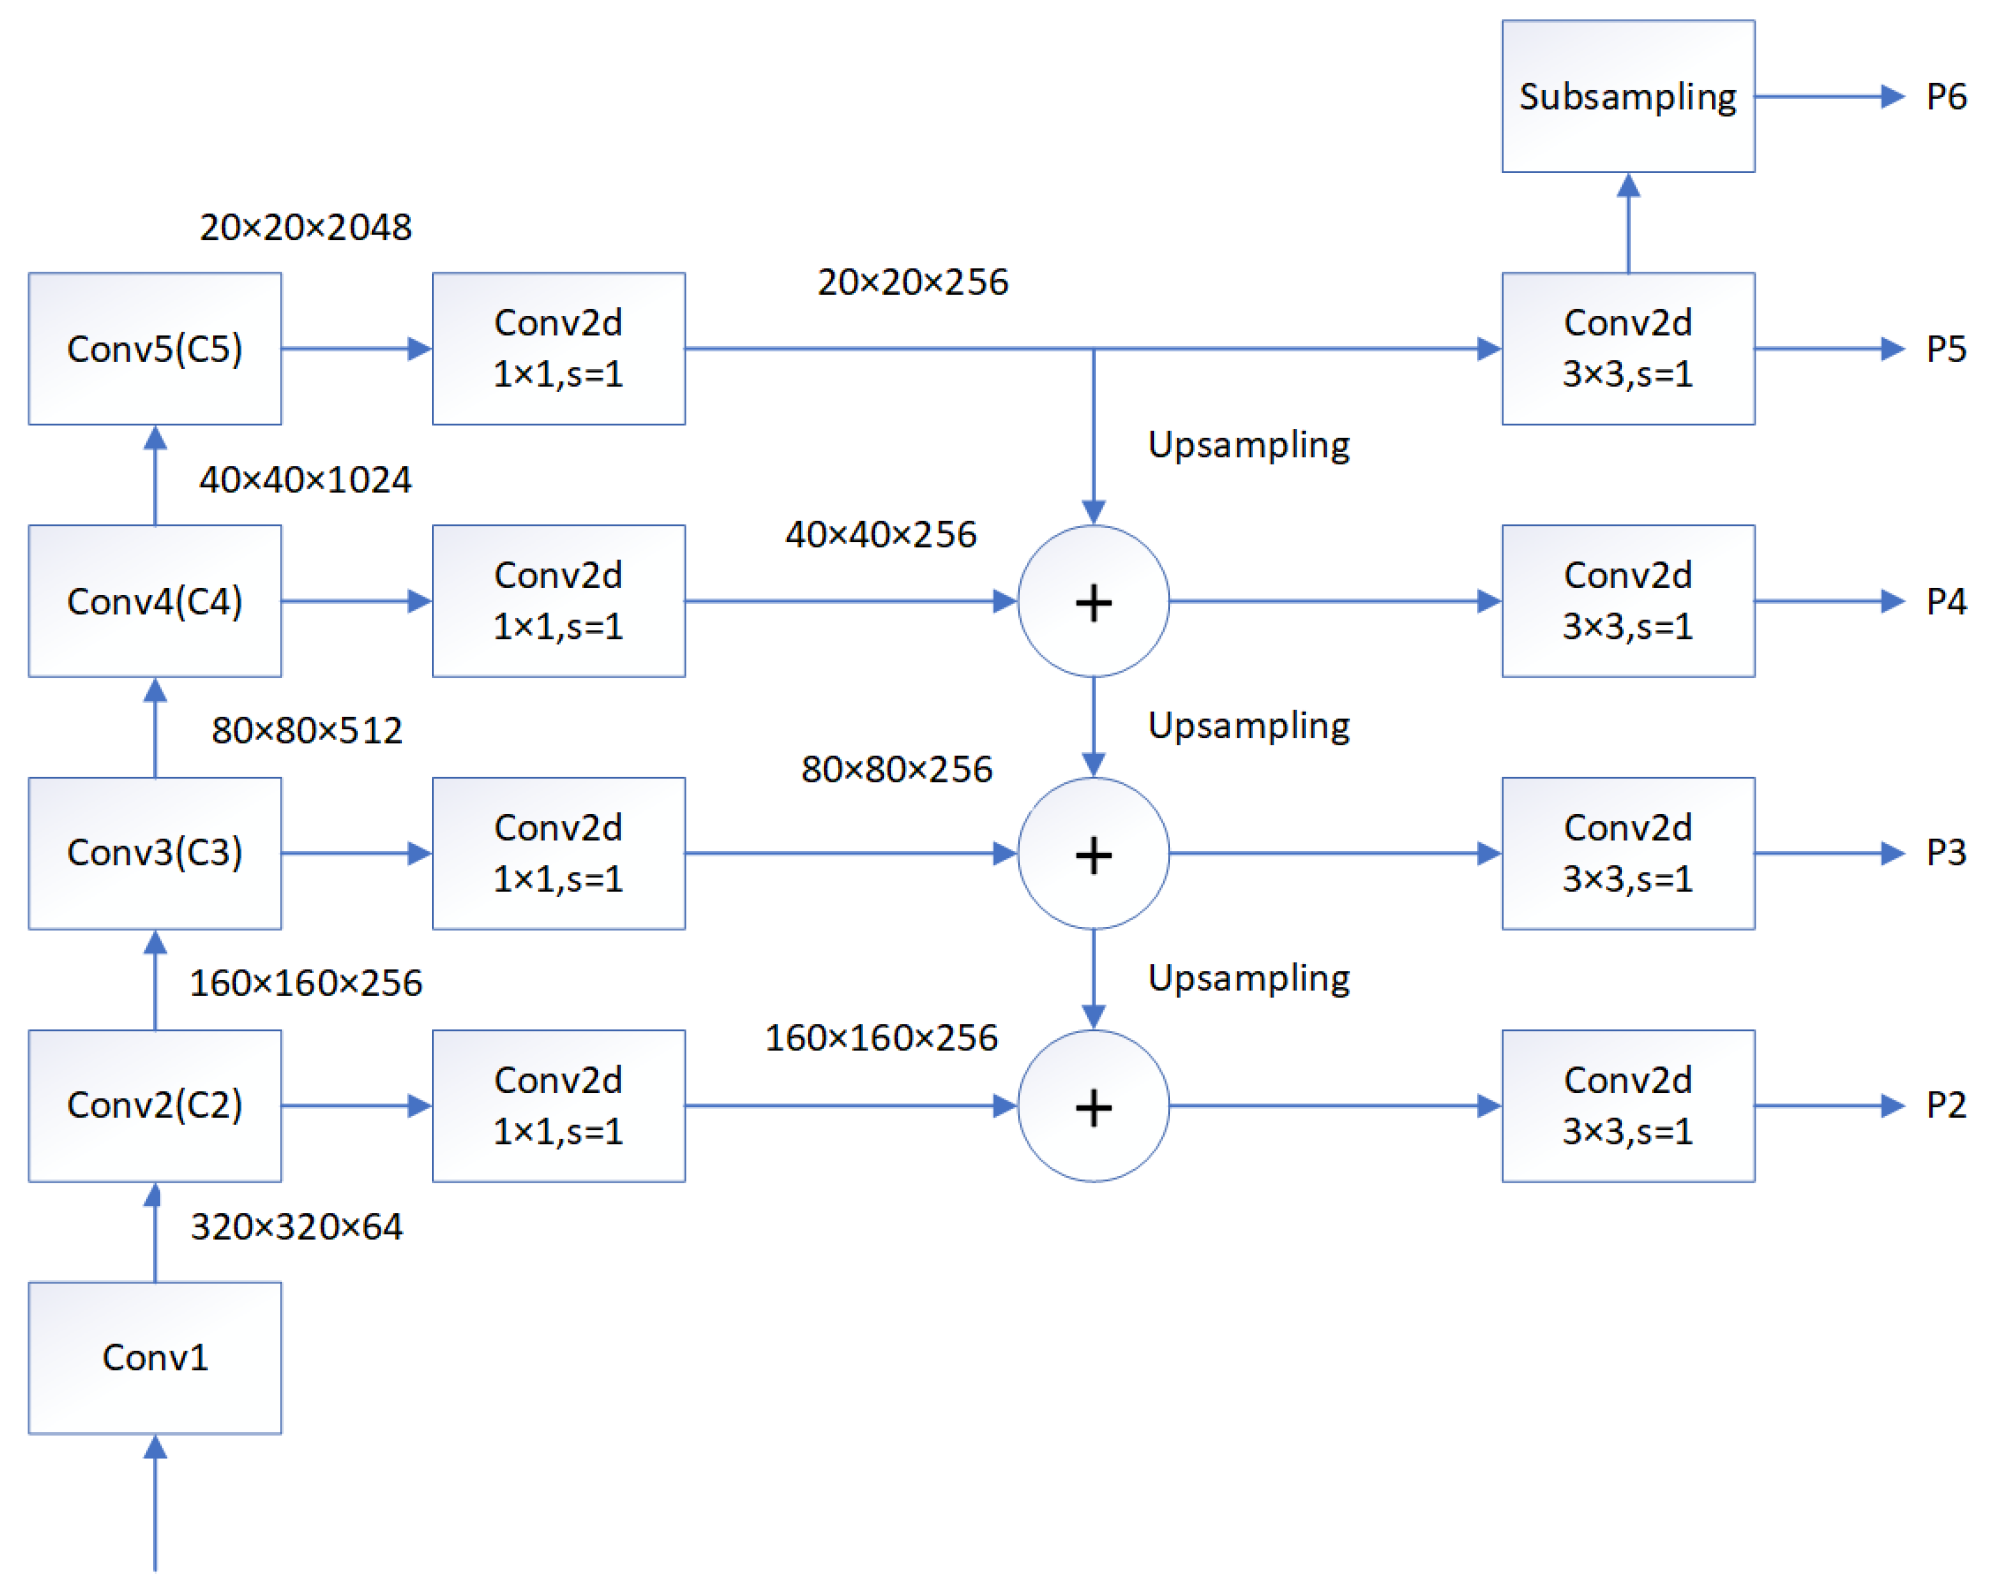
3.3. Feature Pyramid Networks
4. Research Method
4.1. Motivation
4.2. Automatic Training Data Generation
| Algorithm 1: Heuristic-based training data auto-generation. |
 |
4.3. Improved Faster R-CNN with Multi-Scale Attention Mechanism
4.3.1. Overall Framework
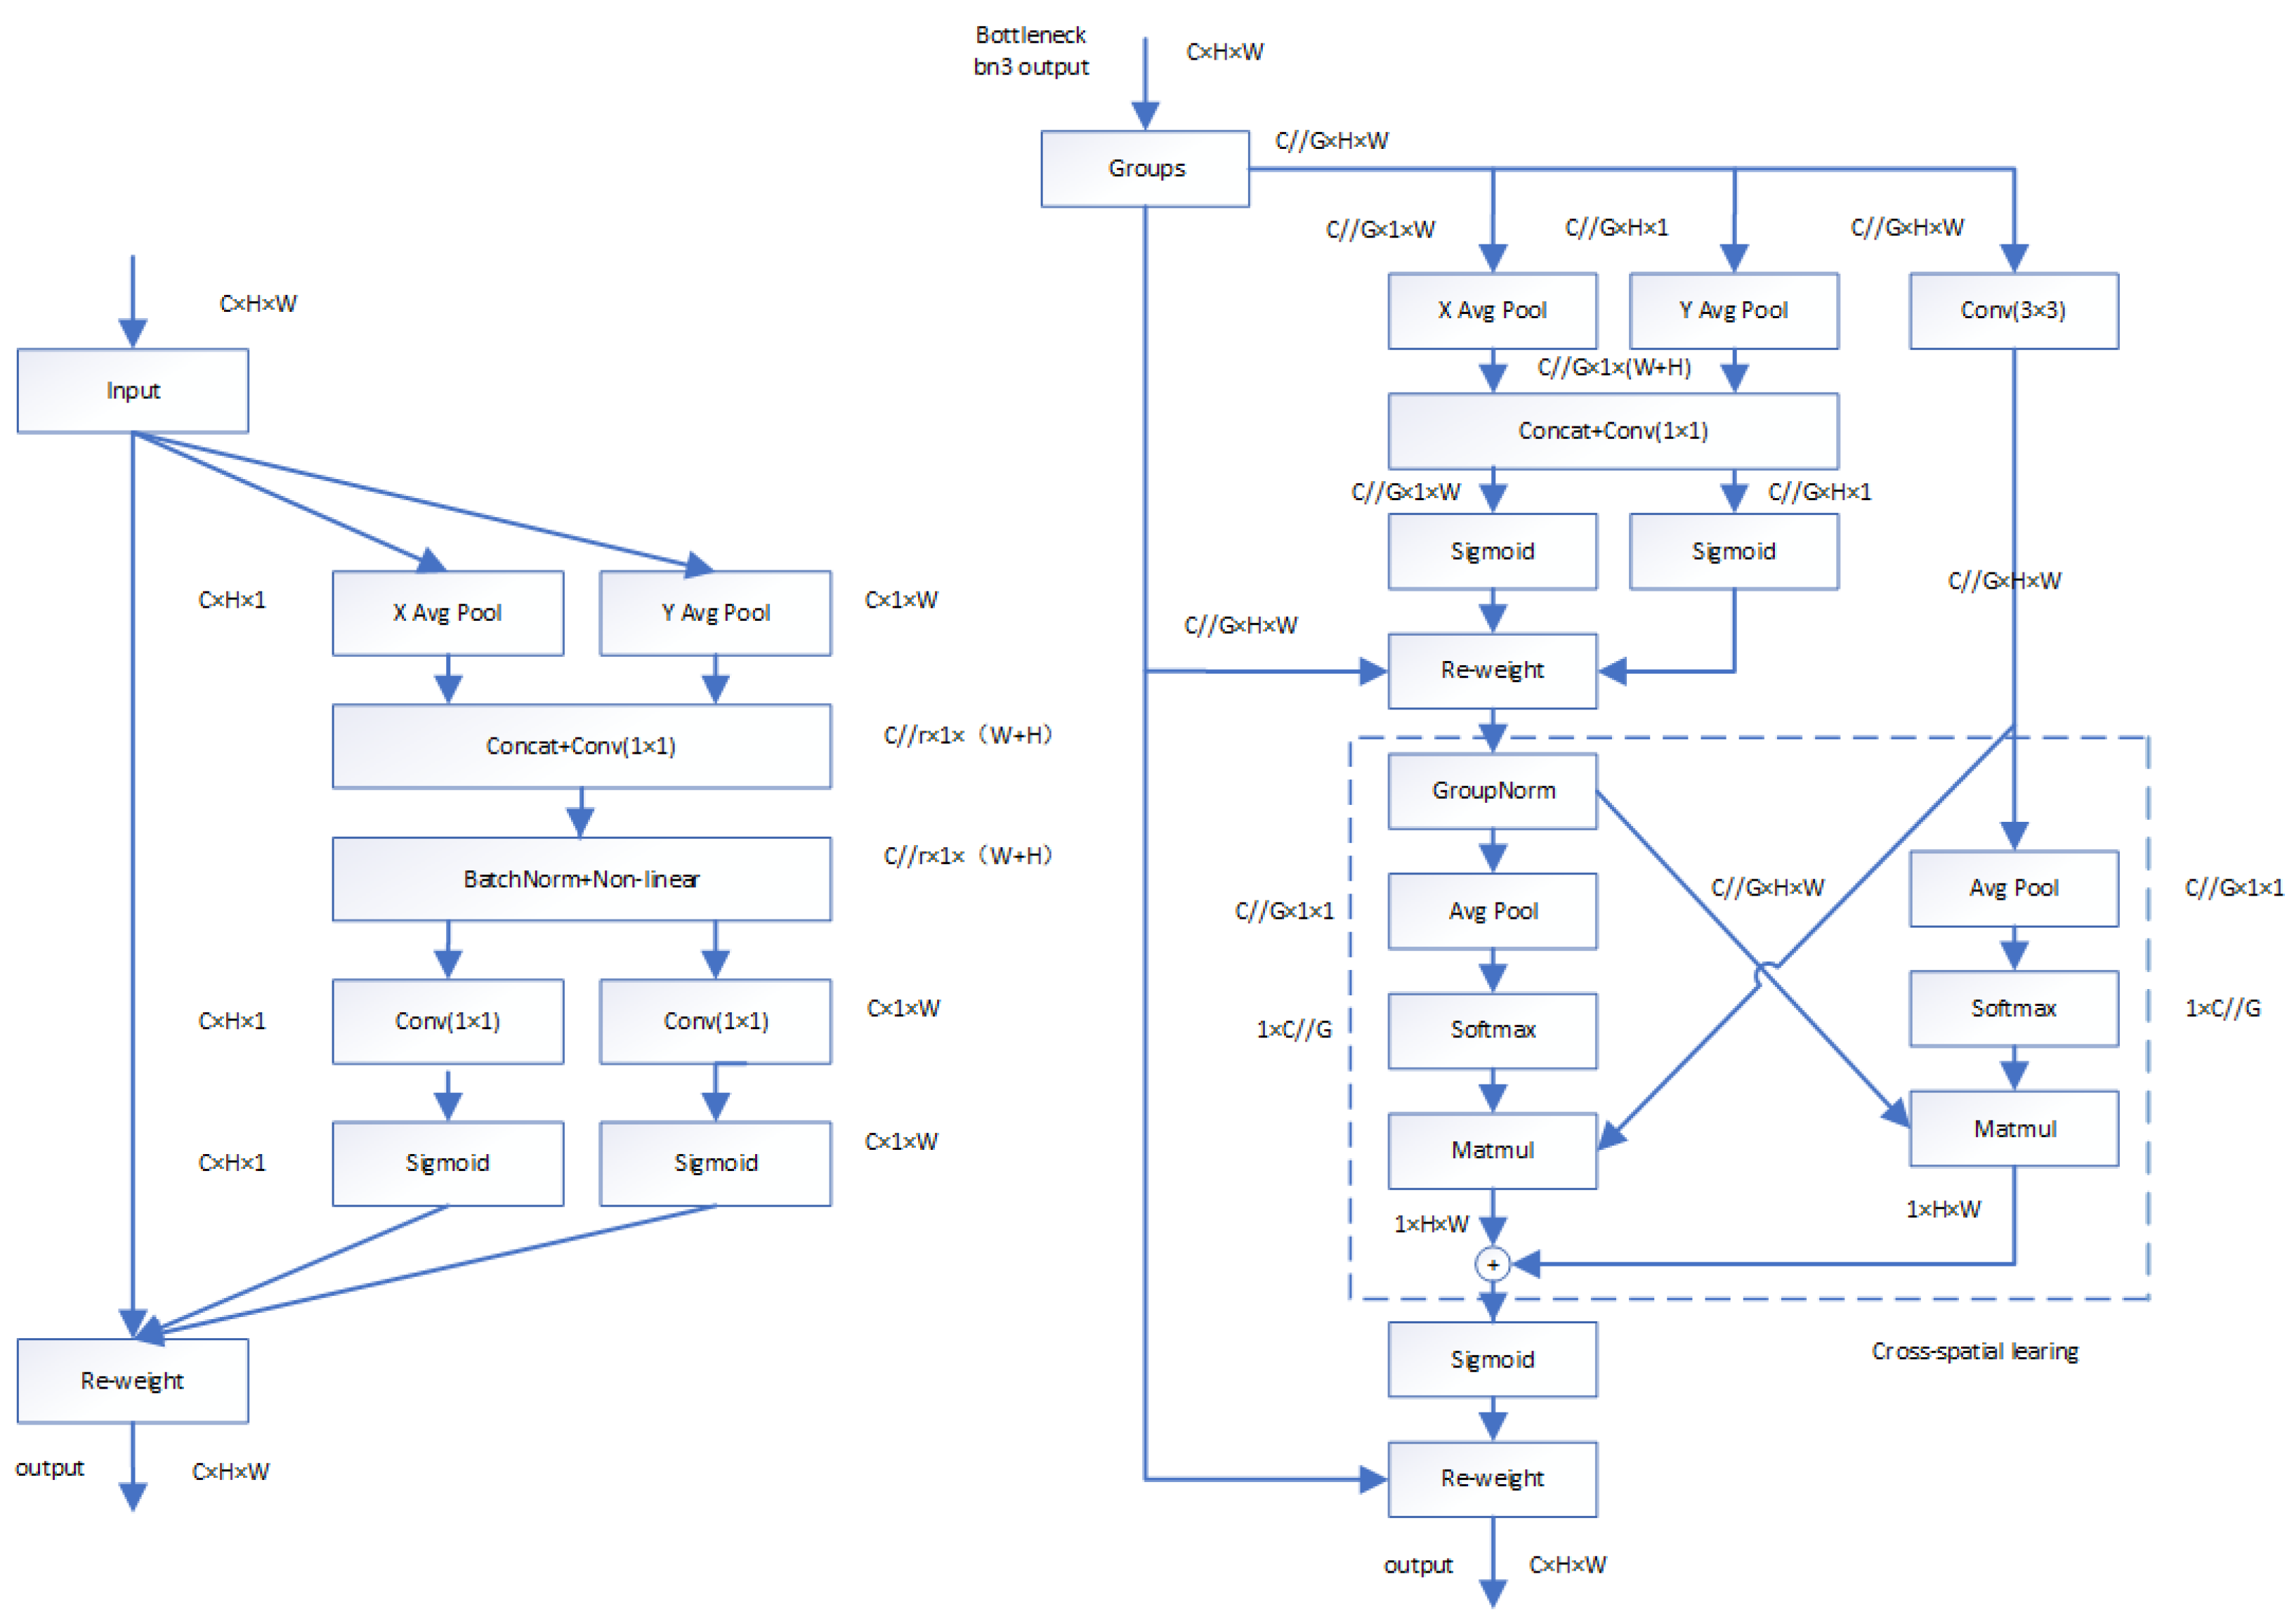
4.3.2. Multi-Scale Attention Mechanism
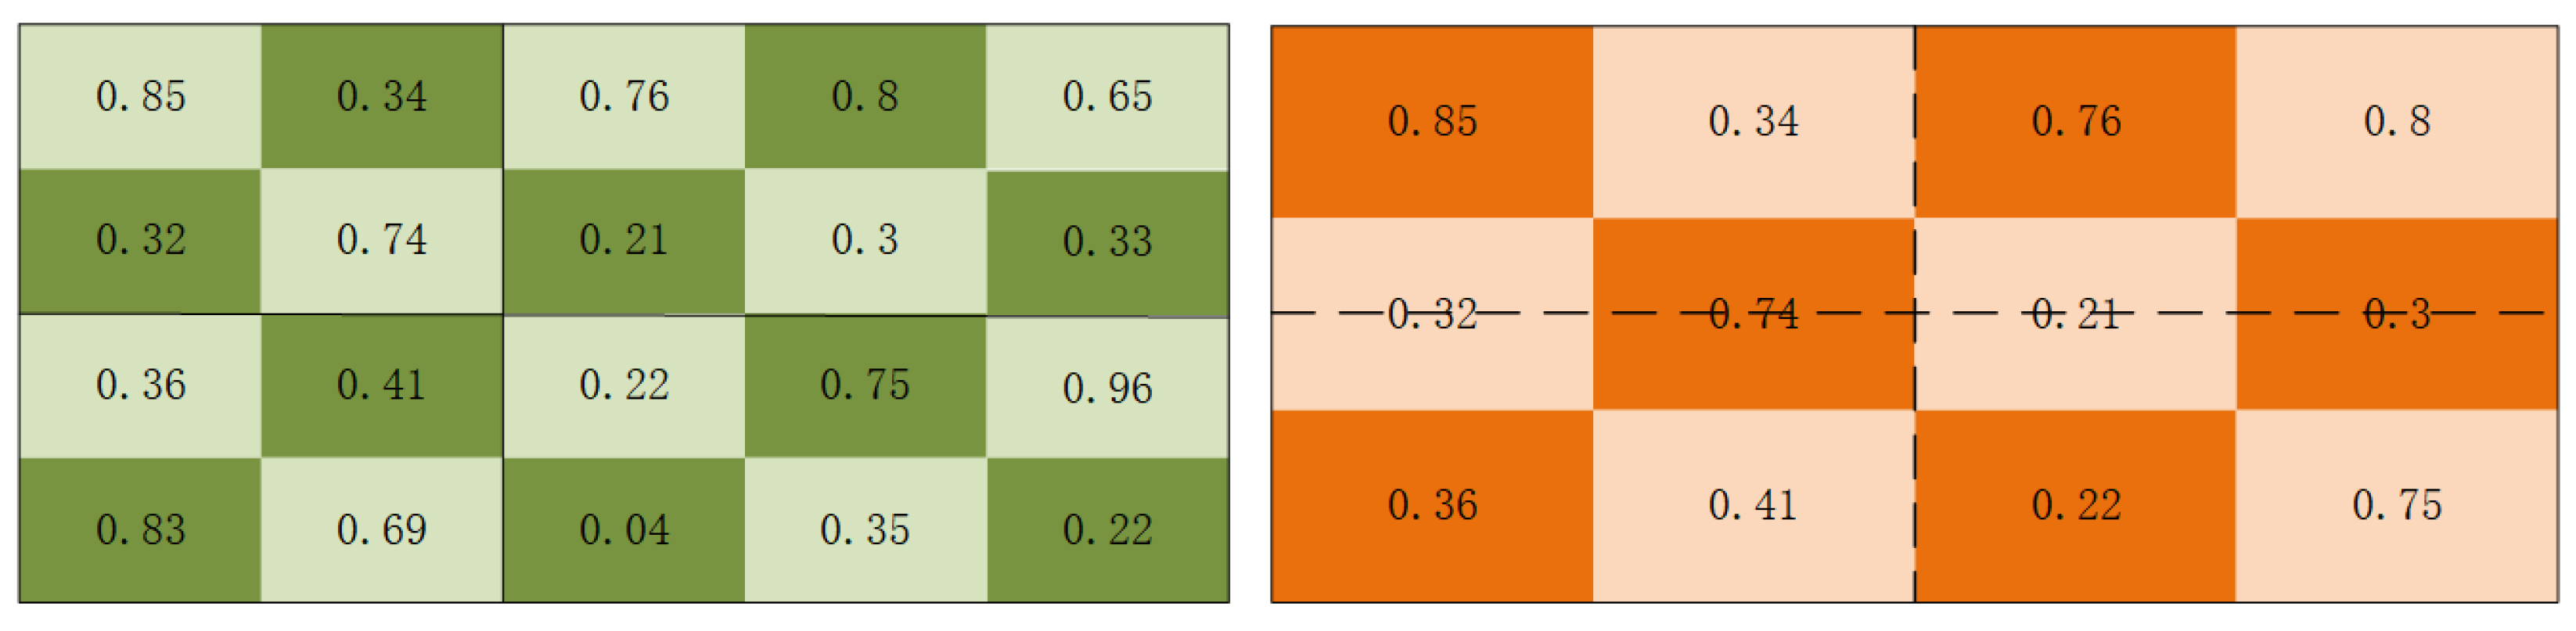
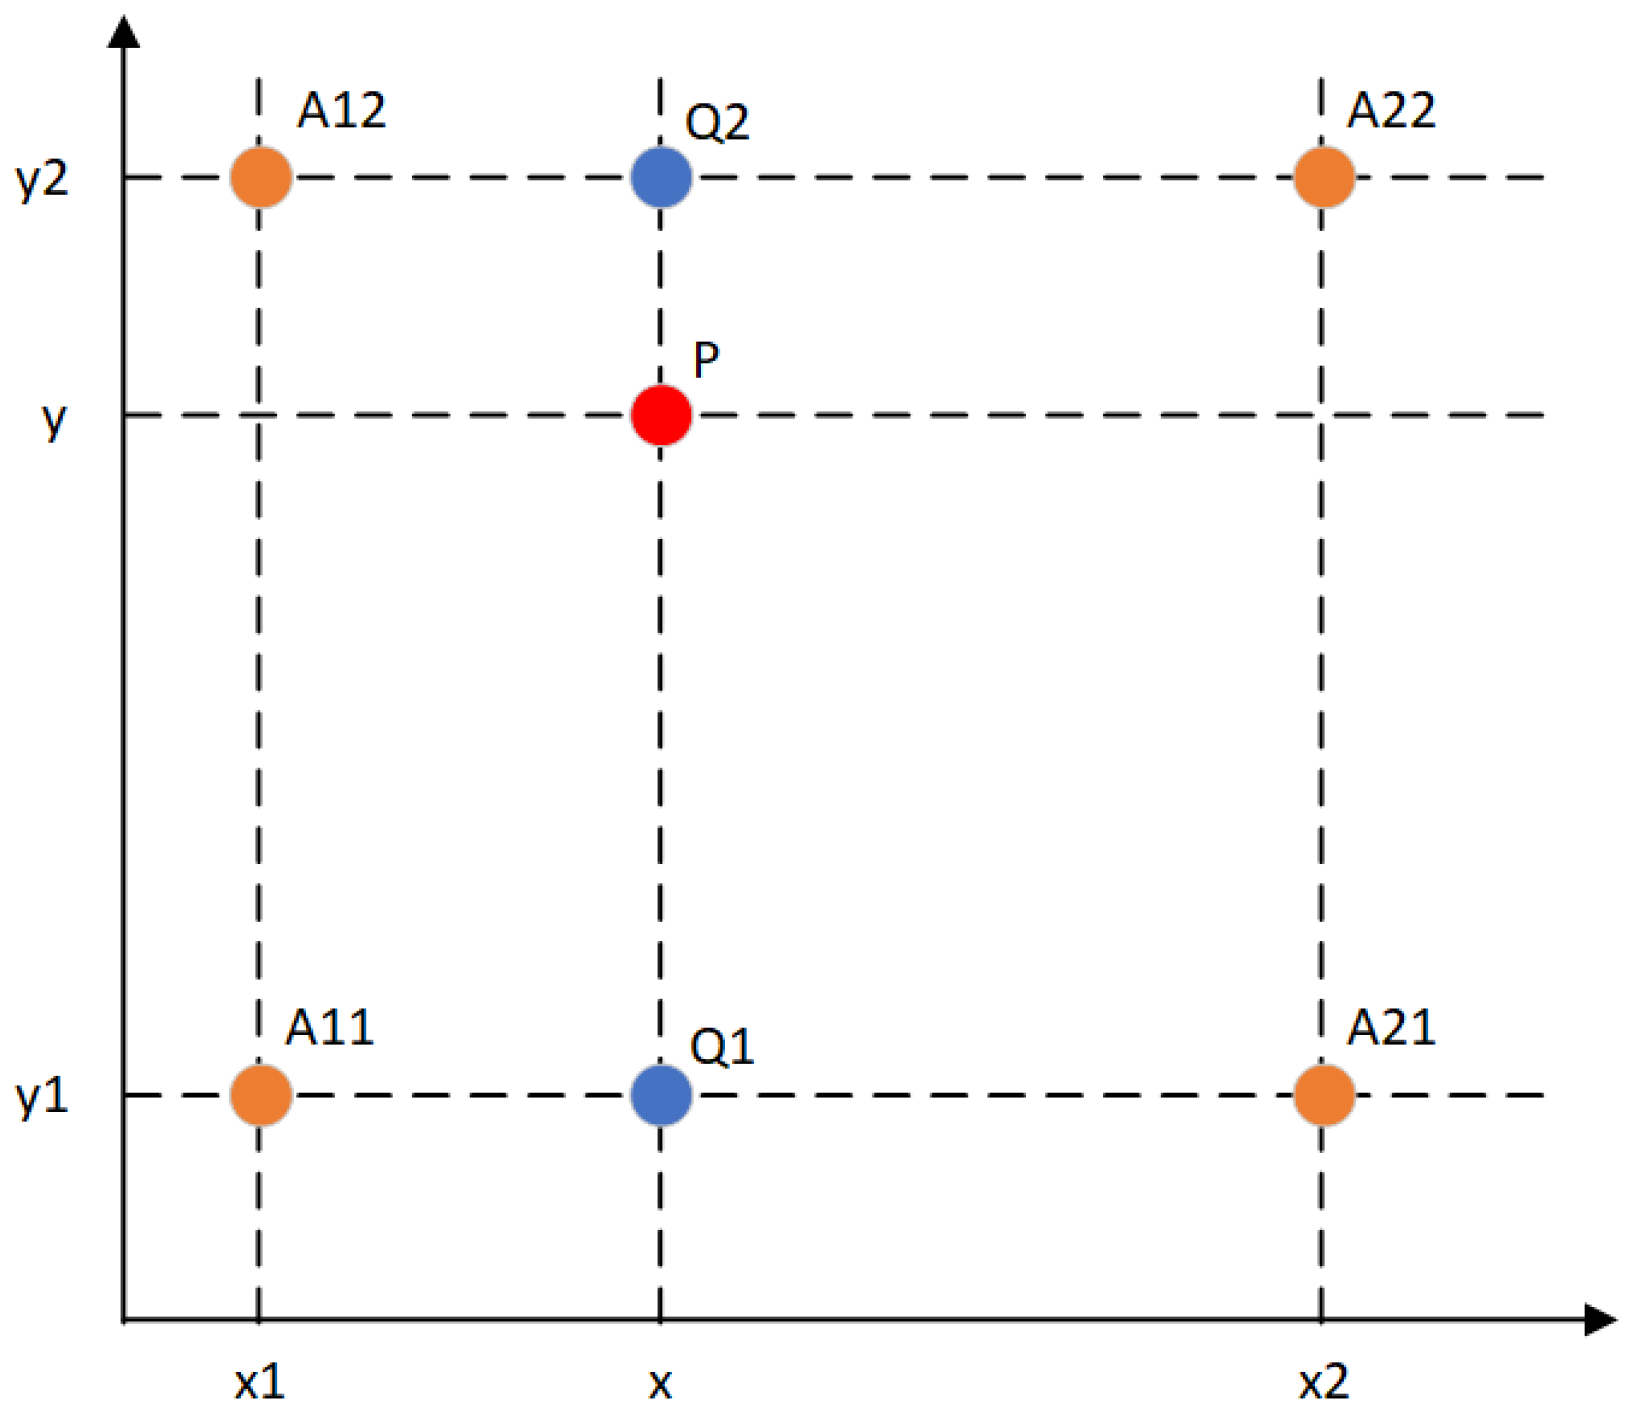
4.3.3. Improved ROI-Alignment
4.3.4. Evaluation Metrics
5. Experiments
5.1. Experiment Settings
5.2. Experiment Result Analysis
Discussions
6. Conclusions and Future Work
Author Contributions
Funding
Institutional Review Board Statement
Informed Consent Statement
Data Availability Statement
Conflicts of Interest
References
- Arnatovich, Y.L.; Ngo, M.N.; Kuan, T.H.B.; Soh, C. Achieving high code coverage in android UI testing via automated widget exercising. In Proceedings of the 2016 23rd Asia-Pacific Software Engineering Conference (APSEC), Hamilton, New Zealand, 6–9 December 2016; pp. 193–200. [Google Scholar]
- Wetzlmaier, T.; Ramler, R. Hybrid monkey testing: Enhancing automated GUI tests with random test generation. In Proceedings of the 8th ACM SIGSOFT International Workshop on Automated Software Testing, Paderborn, Germany, 4–5 September 2017; pp. 5–10. [Google Scholar]
- Machiry, A.; Tahiliani, R.; Naik, M. Dynodroid: An input generation system for android apps. In Proceedings of the 2013 9th Joint Meeting on Foundations of Software Engineering, Saint Petersburg, Russia, 18–26 August 2013; pp. 224–234. [Google Scholar]
- Reiss, S.P. Seeking the user interface. In Proceedings of the 29th ACM/IEEE International Conference on Automated Software Engineering, Vasteras, Sweden, 15–19 September 2014; pp. 103–114. [Google Scholar]
- Behrang, F.; Reiss, S.P.; Orso, A. GUIfetch: Supporting app design and development through GUI search. In Proceedings of the 5th International Conference on Mobile Software Engineering and Systems, Gothenburg, Sweden, 27–28 May 2018; pp. 236–246. [Google Scholar]
- Yang, B.; Xing, Z.; Xia, X.; Chen, C.; Ye, D.; Li, S. UIS-hunter: Detecting UI design smells in Android apps. In Proceedings of the 2021 IEEE/ACM 43rd International Conference on Software Engineering: Companion Proceedings (ICSE-Companion), Madrid, Spain, 25–28 May 2021; pp. 89–92. [Google Scholar]
- Yeh, T.; Chang, T.H.; Miller, R.C. Sikuli: Using GUI screenshots for search and automation. In Proceedings of the 22nd Annual ACM Symposium on User Interface Software and Technology, Victoria, BC, Canada, 4–7 October 2009; pp. 183–192. [Google Scholar]
- Qian, J.; Shang, Z.; Yan, S.; Wang, Y.; Chen, L. Roscript: A visual script driven truly non-intrusive robotic testing system for touch screen applications. In Proceedings of the ACM/IEEE 42nd International Conference on Software Engineering, Seoul, Republic of Korea, 27 June 2020–19 July 2020; pp. 297–308. [Google Scholar]
- Chen, C.; Feng, S.; Liu, Z.; Xing, Z.; Zhao, S. From lost to found: Discover missing ui design semantics through recovering missing tags. Proc. ACM Hum.-Comput. Interact. 2020, 4, 1–22. [Google Scholar] [CrossRef]
- Chen, J.; Xie, M.; Xing, Z.; Chen, C.; Xu, X.; Zhu, L.; Li, G. Object detection for graphical user interface: Old fashioned or deep learning or a combination? In Proceedings of the 28th ACM Joint Meeting on European Software Engineering Conference and Symposium on the Foundations of Software Engineering, Virtual, 8–13 November 2020; pp. 1202–1214. [Google Scholar]
- Moran, K.; Li, B.; Bernal-Cárdenas, C.; Jelf, D.; Poshyvanyk, D. Automated reporting of GUI design violations for mobile apps. In Proceedings of the 40th International Conference on Software Engineering, Gothenburg, Sweden, 27 May 2018–3 June 2018; pp. 165–175. [Google Scholar]
- Moran, K.; Watson, C.; Hoskins, J.; Purnell, G.; Poshyvanyk, D. Detecting and summarizing GUI changes in evolving mobile apps. In Proceedings of the 33rd ACM/IEEE International Conference on Automated Software Engineering, Montpellier, France, 3–7 September 2018; pp. 543–553. [Google Scholar]
- Li, B.; Hu, W.; Wu, T.; Zhu, S.C. Modeling occlusion by discriminative and-or structures. In Proceedings of the IEEE International Conference on Computer Vision, Sydney, Australia, 1–8 December 2013; pp. 2560–2567. [Google Scholar]
- Vogel, D.; Balakrishnan, R. Occlusion-aware interfaces. In Proceedings of the SIGCHI Conference on Human Factors in Computing Systems, Atlanta, GA, USA, 10–15 April 2010; pp. 263–272. [Google Scholar]
- Zhu, C.; Zhu, Z.; Xie, Y.; Jiang, W.; Zhang, G. Evaluation of machine learning approaches for android energy bugs detection with revision commits. IEEE Access 2019, 7, 85241–85252. [Google Scholar] [CrossRef]
- Li, W.; Jiang, Y.; Xu, C.; Liu, Y.; Ma, X.; Lü, J. Characterizing and detecting inefficient image displaying issues in Android apps. In Proceedings of the 2019 IEEE 26th International Conference on Software Analysis, Evolution and Reengineering (SANER), Hangzhou, China, 24–27 February 2019; pp. 355–365. [Google Scholar]
- Kim, J.H.; Kong, K.; Kang, S.J. Image demoireing via U-Net for detection of display defects. IEEE Access 2022, 10, 68645–68654. [Google Scholar] [CrossRef]
- Liu, Z.; Chen, C.; Wang, J.; Huang, Y.; Hu, J.; Wang, Q. Nighthawk: Fully automated localizing UI display issues via visual understanding. IEEE Trans. Softw. Eng. 2022, 49, 403–418. [Google Scholar] [CrossRef]
- Mirzaei, N.; Garcia, J.; Bagheri, H.; Sadeghi, A.; Malek, S. Reducing combinatorics in GUI testing of android applications. In Proceedings of the 38th International Conference on Software Engineering, Austin, TX, USA, 14–22 May 2016; pp. 559–570. [Google Scholar]
- Baek, Y.M.; Bae, D.H. Automated model-based android gui testing using multi-level gui comparison criteria. In Proceedings of the 31st IEEE/ACM International Conference on Automated Software Engineering, Singapore, 3–7 September 2016; pp. 238–249. [Google Scholar]
- Su, T.; Meng, G.; Chen, Y.; Wu, K.; Yang, W.; Yao, Y.; Pu, G.; Liu, Y.; Su, Z. Guided, stochastic model-based GUI testing of Android apps. In Proceedings of the 2017 11th Joint Meeting on Foundations of Software Engineering, Paderborn, Germany, 4–8 September 2017; pp. 245–256. [Google Scholar]
- Gao, Y.; Luo, Y.; Chen, D.; Huang, H.; Dong, W.; Xia, M.; Liu, X.; Bu, J. Every pixel counts: Fine-grained UI rendering analysis for mobile applications. In Proceedings of the IEEE INFOCOM 2017-IEEE Conference on Computer Communications, Atlanta, GA, USA, 1–4 May 2017; pp. 1–9. [Google Scholar]
- White, T.D.; Fraser, G.; Brown, G.J. Improving random GUI testing with image-based widget detection. In Proceedings of the 28th ACM SIGSOFT International Symposium on Software Testing and Analysis, Beijing China, 15–19 July 2019; pp. 307–317. [Google Scholar]
- Degott, C.; Borges Jr, N.P.; Zeller, A. Learning user interface element interactions. In Proceedings of the 28th ACM SIGSOFT International Symposium on Software Testing and Analysis, Beijing China, 15–19 July 2019; pp. 296–306. [Google Scholar]
- Khadka, K.; Chandrasekaran, J.; Lei, Y.; Kacker, R.N.; Kuhn, D.R. Synthetic Data Generation Using Combinatorial Testing and Variational Autoencoder. In Proceedings of the 2023 IEEE International Conference on Software Testing, Verification and Validation Workshops (ICSTW), Dublin, Ireland, 16–20 April 2023; pp. 228–236. [Google Scholar]
- Manco, G.; Ritacco, E.; Rullo, A.; Saccà, D.; Serra, E. Machine learning methods for generating high dimensional discrete datasets. Wiley Interdiscip. Rev. Data Min. Knowl. Discov. 2022, 12, e1450. [Google Scholar] [CrossRef]
- Allen, C.; Bartók, A.P. Optimal data generation for machine learned interatomic potentials. Mach. Learn. Sci. Technol. 2022, 3, 045031. [Google Scholar] [CrossRef]
- Ren, S.; He, K.; Girshick, R.; Sun, J. Faster R-CNN: Towards real-time object detection with region proposal networks. Adv. Neural Inf. Process. Syst. 2015, 28. [Google Scholar] [CrossRef] [PubMed]
- Girshick, R.; Donahue, J.; Darrell, T.; Malik, J. Rich feature hierarchies for accurate object detection and semantic segmentation. In Proceedings of the IEEE Conference on Computer Vision and Pattern Recognition, Columbus, OH, USA, 28 June 2014; pp. 580–587. [Google Scholar]
- Redmon, J.; Divvala, S.; Girshick, R.; Farhadi, A. You only look once: Unified, real-time object detection. In Proceedings of the IEEE conference on computer vision and pattern recognition, Las Vegas, NV, USA, 26 June –1 July 2016; pp. 779–788. [Google Scholar]
- Liu, W.; Anguelov, D.; Erhan, D.; Szegedy, C.; Reed, S.; Fu, C.Y.; Berg, A.C. Ssd: Single shot multibox detector. In Proceedings of the Computer Vision—ECCV 2016: 14th European Conference, Amsterdam, The Netherlands, 11–14 October 2016; Proceedings, Part I 14. Springer: Berlin/Heidelberg, Germany, 2016; pp. 21–37. [Google Scholar]
- He, K.; Zhang, X.; Ren, S.; Sun, J. Deep residual learning for image recognition. In Proceedings of the IEEE Conference on Computer Vision and Pattern Recognition, Las Vegas, NV, USA, 26 June 2016–1 July 2016; pp. 770–778. [Google Scholar]
- Lin, T.Y.; Dollár, P.; Girshick, R.; He, K.; Hariharan, B.; Belongie, S. Feature pyramid networks for object detection. In Proceedings of the IEEE Conference on Computer Vision and Pattern Recognition, Honolulu, HI, USA, 21 July 2017–26 July 2017; pp. 2117–2125. [Google Scholar]
- Deka, B.; Huang, Z.; Franzen, C.; Hibschman, J.; Afergan, D.; Li, Y.; Nichols, J.; Kumar, R. Rico: A mobile app dataset for building data-driven design applications. In Proceedings of the 30th Annual ACM Symposium on User Interface Software and Technology, Québec City, QC, Canada, 22–25 October 2017; pp. 845–854. [Google Scholar]
- Ouyang, D.; He, S.; Zhang, G.; Luo, M.; Guo, H.; Zhan, J.; Huang, Z. Efficient Multi-Scale Attention Module with Cross-Spatial Learning. In Proceedings of the ICASSP 2023–2023 IEEE International Conference on Acoustics, Speech and Signal Processing (ICASSP), Rhodes Island, Greece, 4–10 June 2023; pp. 1–5. [Google Scholar]
- Hou, Q.; Zhou, D.; Feng, J. Coordinate attention for efficient mobile network design. In Proceedings of the IEEE/CVF Conference on Computer Vision and Pattern Recognition, Nashville, TN, USA, 20–25 June 2021; pp. 13713–13722. [Google Scholar]
- He, K.; Gkioxari, G.; Dollár, P.; Girshick, R. Mask r-cnn. In Proceedings of the IEEE International Conference on Computer Vision, Venice, Italy, 22–29 October 2017; pp. 2961–2969. [Google Scholar]


| Text Overlap | Image Missing | Component Occlusion | Empty Values | |
|---|---|---|---|---|
| Training Set | 8000 | 8000 | 8000 | 8000 |
| Validation Set | 1000 | 1000 | 1000 | 1000 |
| Test Set | 1000 | 1000 | 1000 | 1000 |
| Sum | 10,000 | 10,000 | 10,000 | 10,000 |
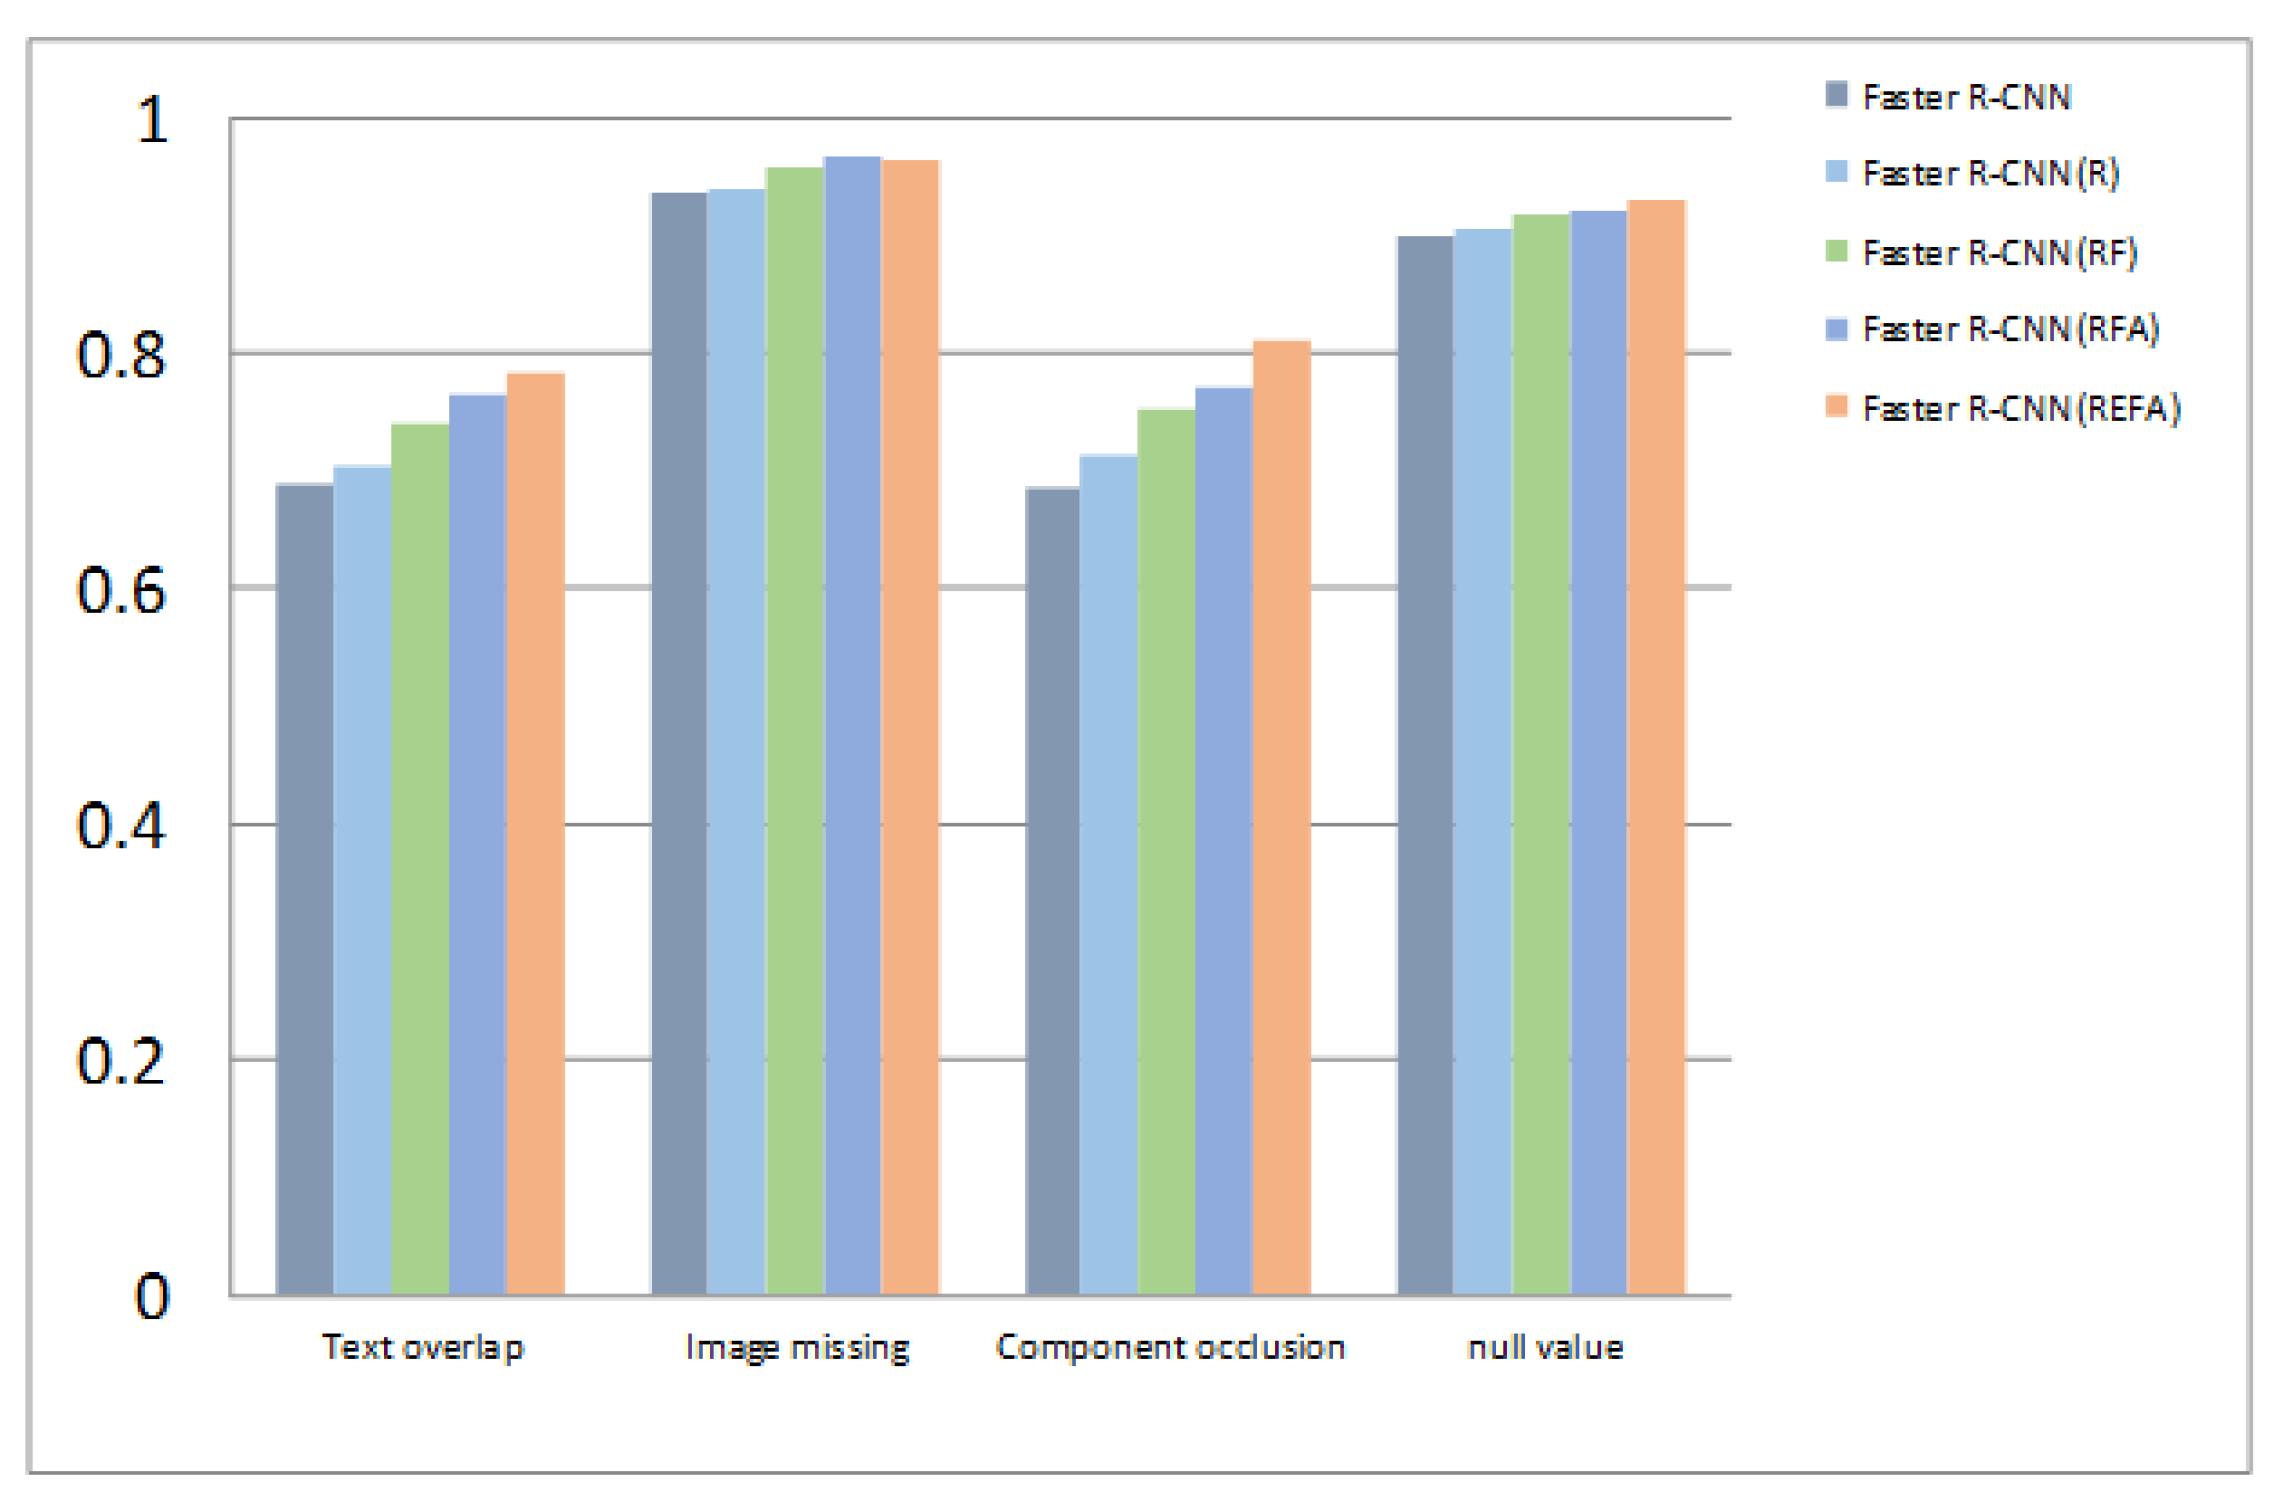
| Algorithm | Average Accuracy AP/% | mAP/% | |||
|---|---|---|---|---|---|
| Text Overlap | Image Missing | Component Occlusion | Empty Values | ||
| Faster R-CNN | 0.69 | 0.936 | 0.686 | 0.899 | 0.803 |
| Faster R-CNN(R) | 0.703 | 0.94 | 0.714 | 0.907 | 0.816 |
| Faster R-CNN(RF) | 0.741 | 0.959 | 0.753 | 0.917 | 0.843 |
| Faster R-CNN(RFA) | 0.766 | 0.966 | 0.771 | 0.922 | 0.856 |
| Faster R-CNN(REFA) | 0.784 | 0.964 | 0.812 | 0.93 | 0.873 |
| Algorithm | mAP/% |
|---|---|
| Faster R-CNN | 0.803 |
| YOLOv3 | 0.792 |
| Improved Faster R-CNN | 0.873 |
Disclaimer/Publisher’s Note: The statements, opinions and data contained in all publications are solely those of the individual author(s) and contributor(s) and not of MDPI and/or the editor(s). MDPI and/or the editor(s) disclaim responsibility for any injury to people or property resulting from any ideas, methods, instructions or products referred to in the content. |
© 2024 by the authors. Licensee MDPI, Basel, Switzerland. This article is an open access article distributed under the terms and conditions of the Creative Commons Attribution (CC BY) license (https://creativecommons.org/licenses/by/4.0/).
Share and Cite
Pan, X.; Huan, Z.; Li, Y.; Cao, Y. Enhancement of GUI Display Error Detection Using Improved Faster R-CNN and Multi-Scale Attention Mechanism. Appl. Sci. 2024, 14, 1144. https://doi.org/10.3390/app14031144
Pan X, Huan Z, Li Y, Cao Y. Enhancement of GUI Display Error Detection Using Improved Faster R-CNN and Multi-Scale Attention Mechanism. Applied Sciences. 2024; 14(3):1144. https://doi.org/10.3390/app14031144
Chicago/Turabian StylePan, Xi, Zhan Huan, Yimang Li, and Yingying Cao. 2024. "Enhancement of GUI Display Error Detection Using Improved Faster R-CNN and Multi-Scale Attention Mechanism" Applied Sciences 14, no. 3: 1144. https://doi.org/10.3390/app14031144