
Investigation of the Inverse Magnus Effect on a Rotating Sphere in Hypersonic Rarefied Flow

Abstract
:1. Introduction
2. The Numerical Method
2.1. The Direct Simulation Monte Carlo Method
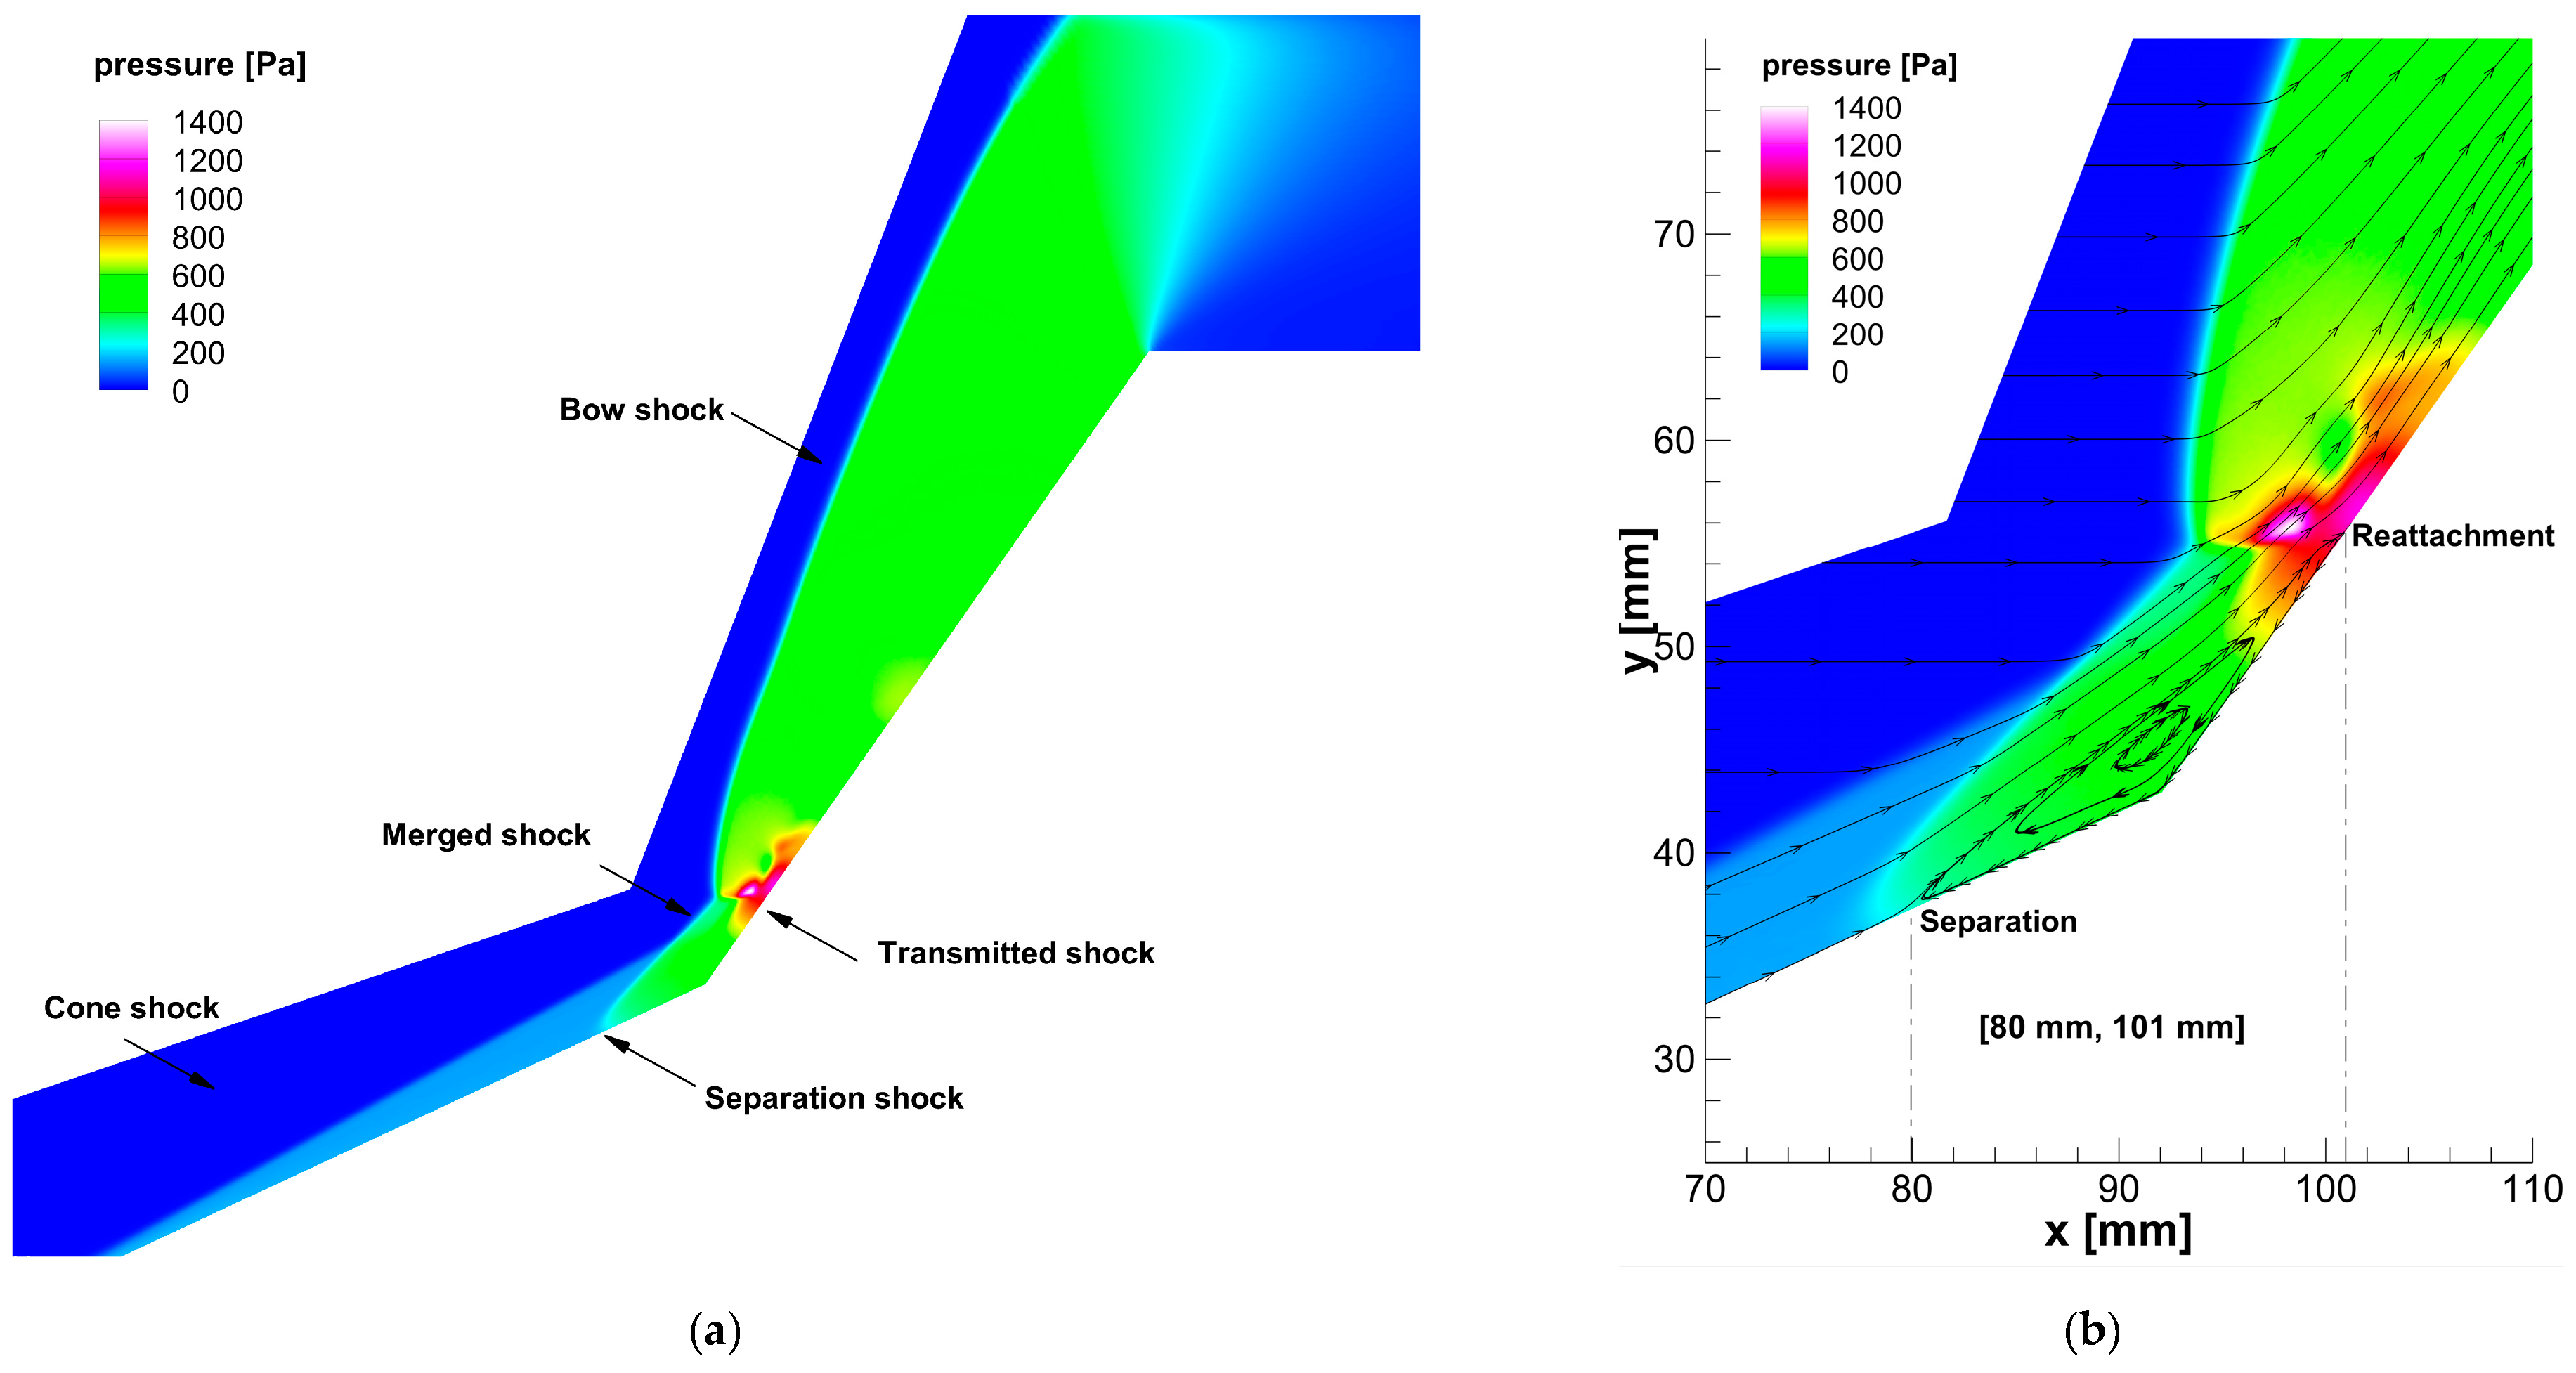
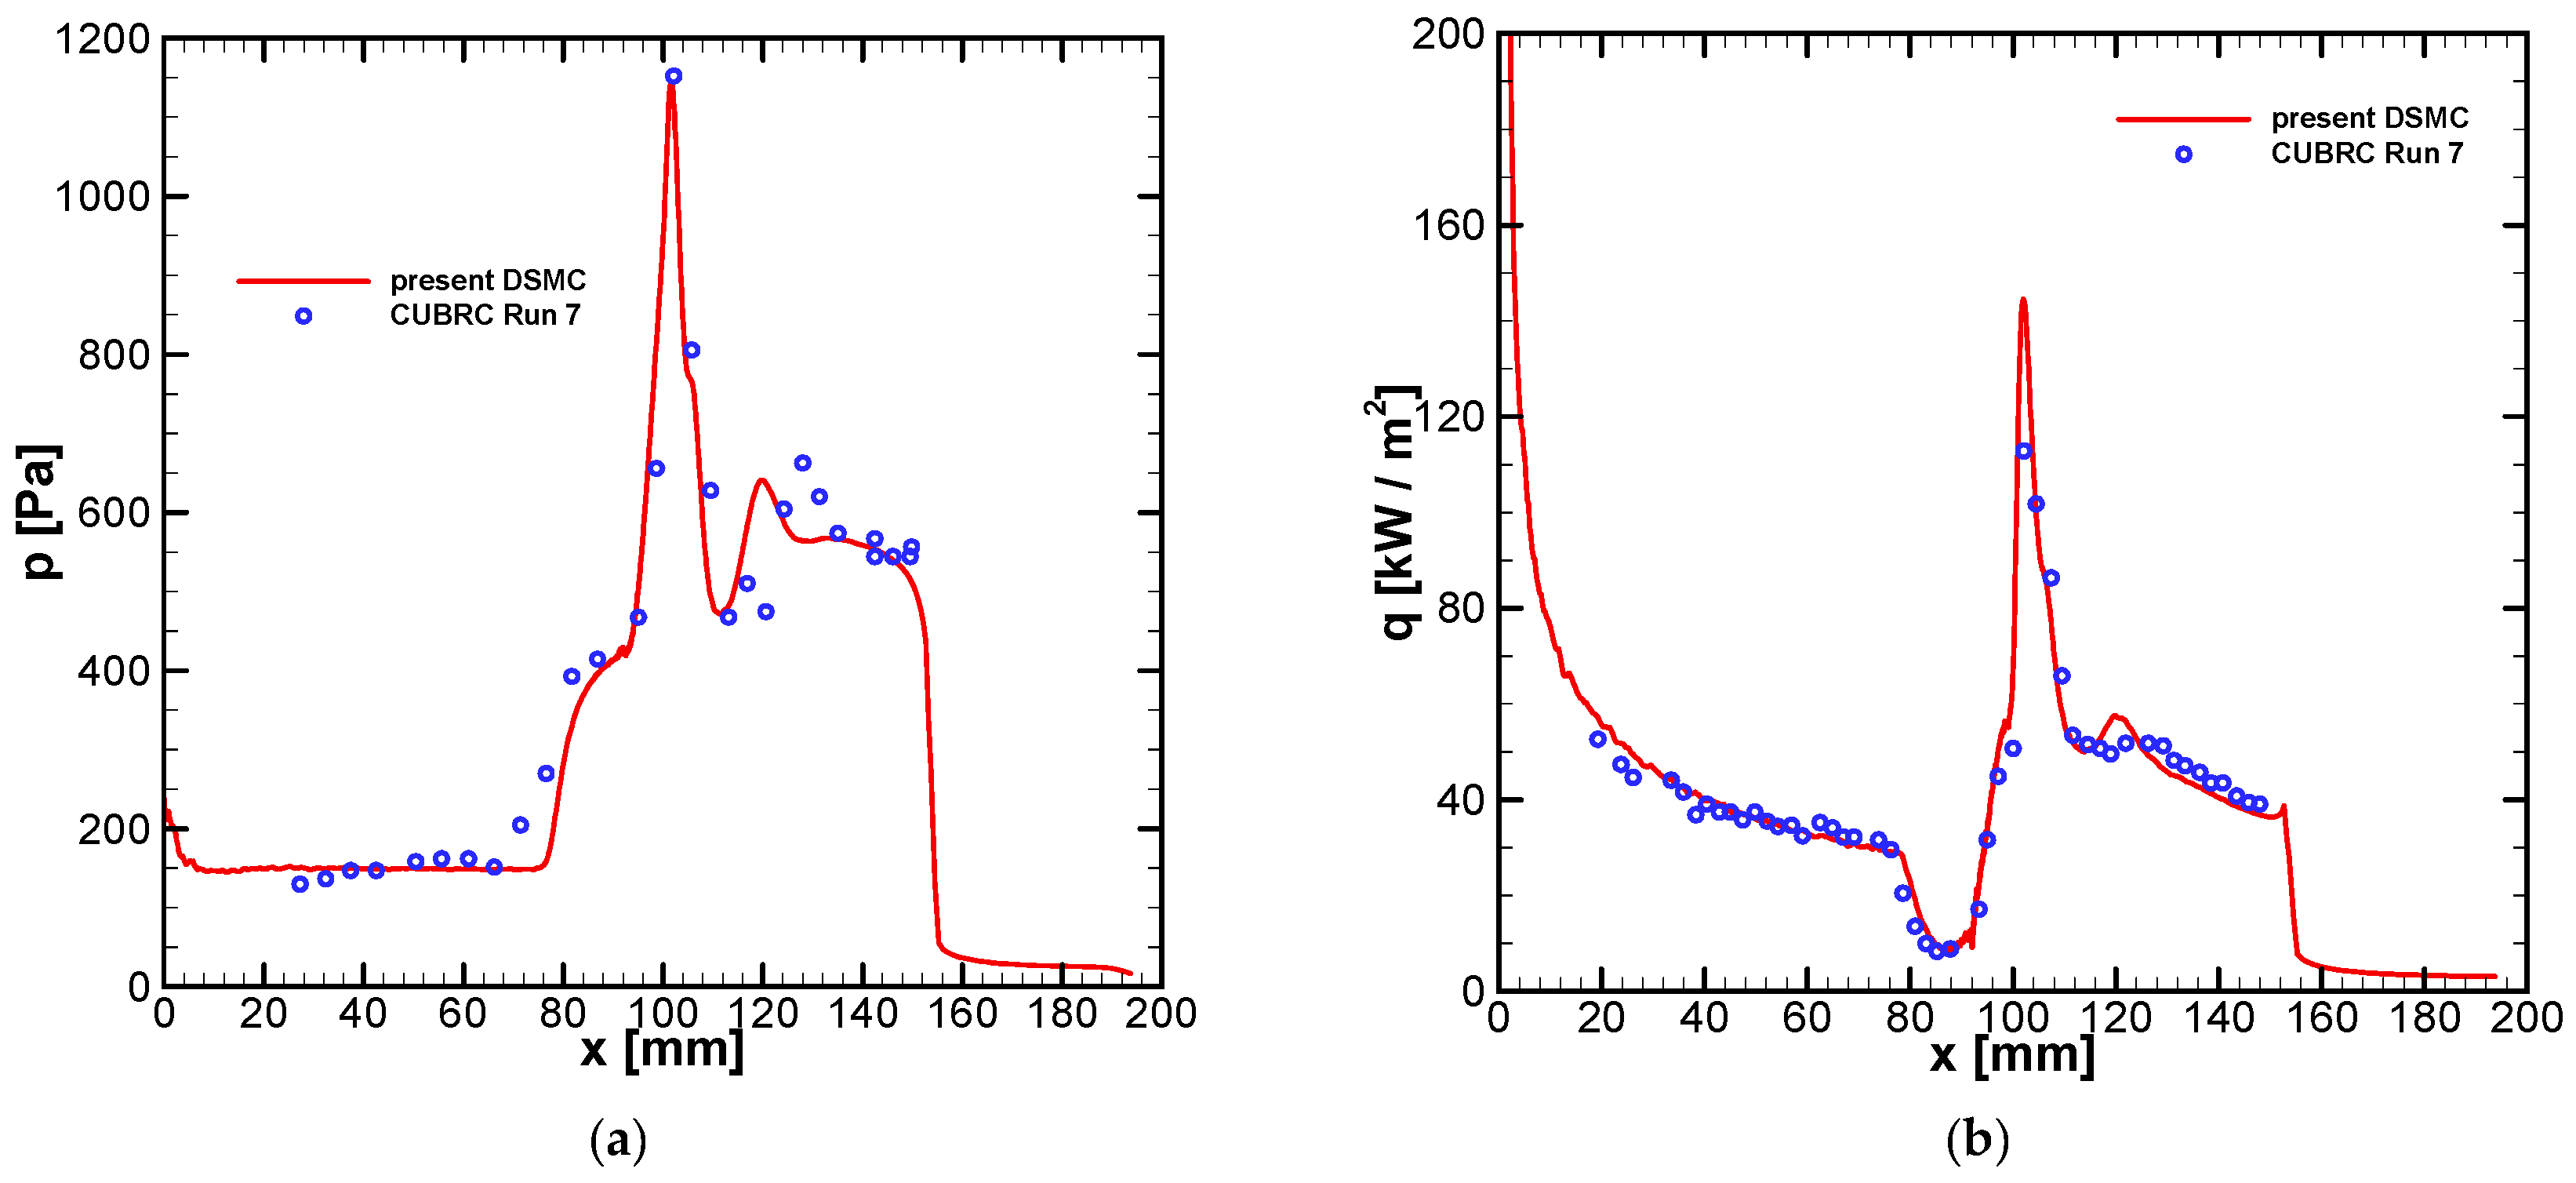
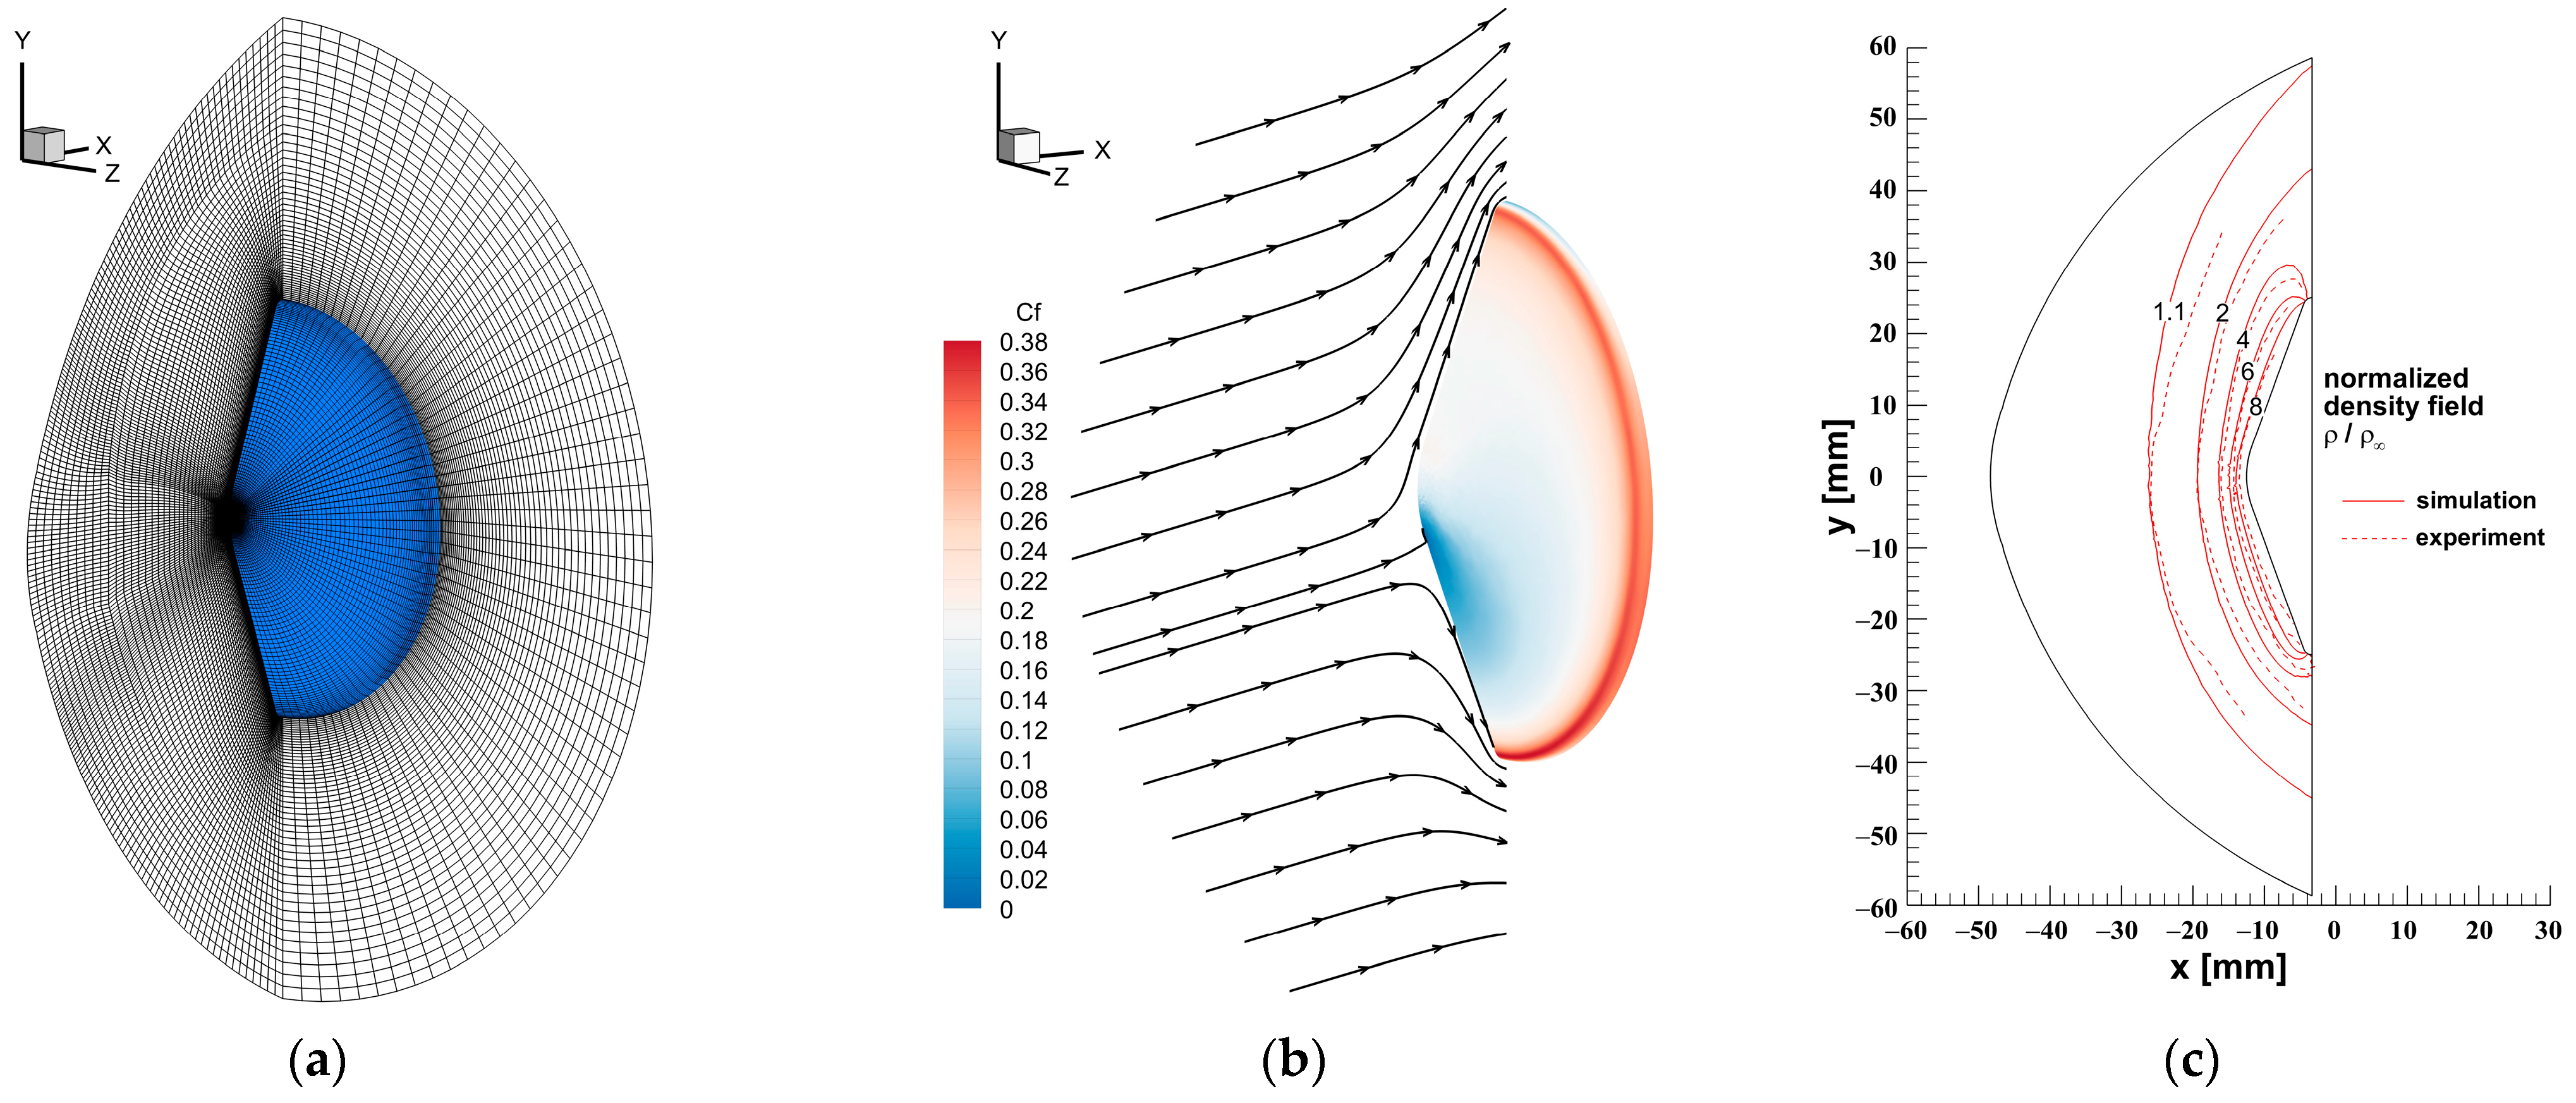
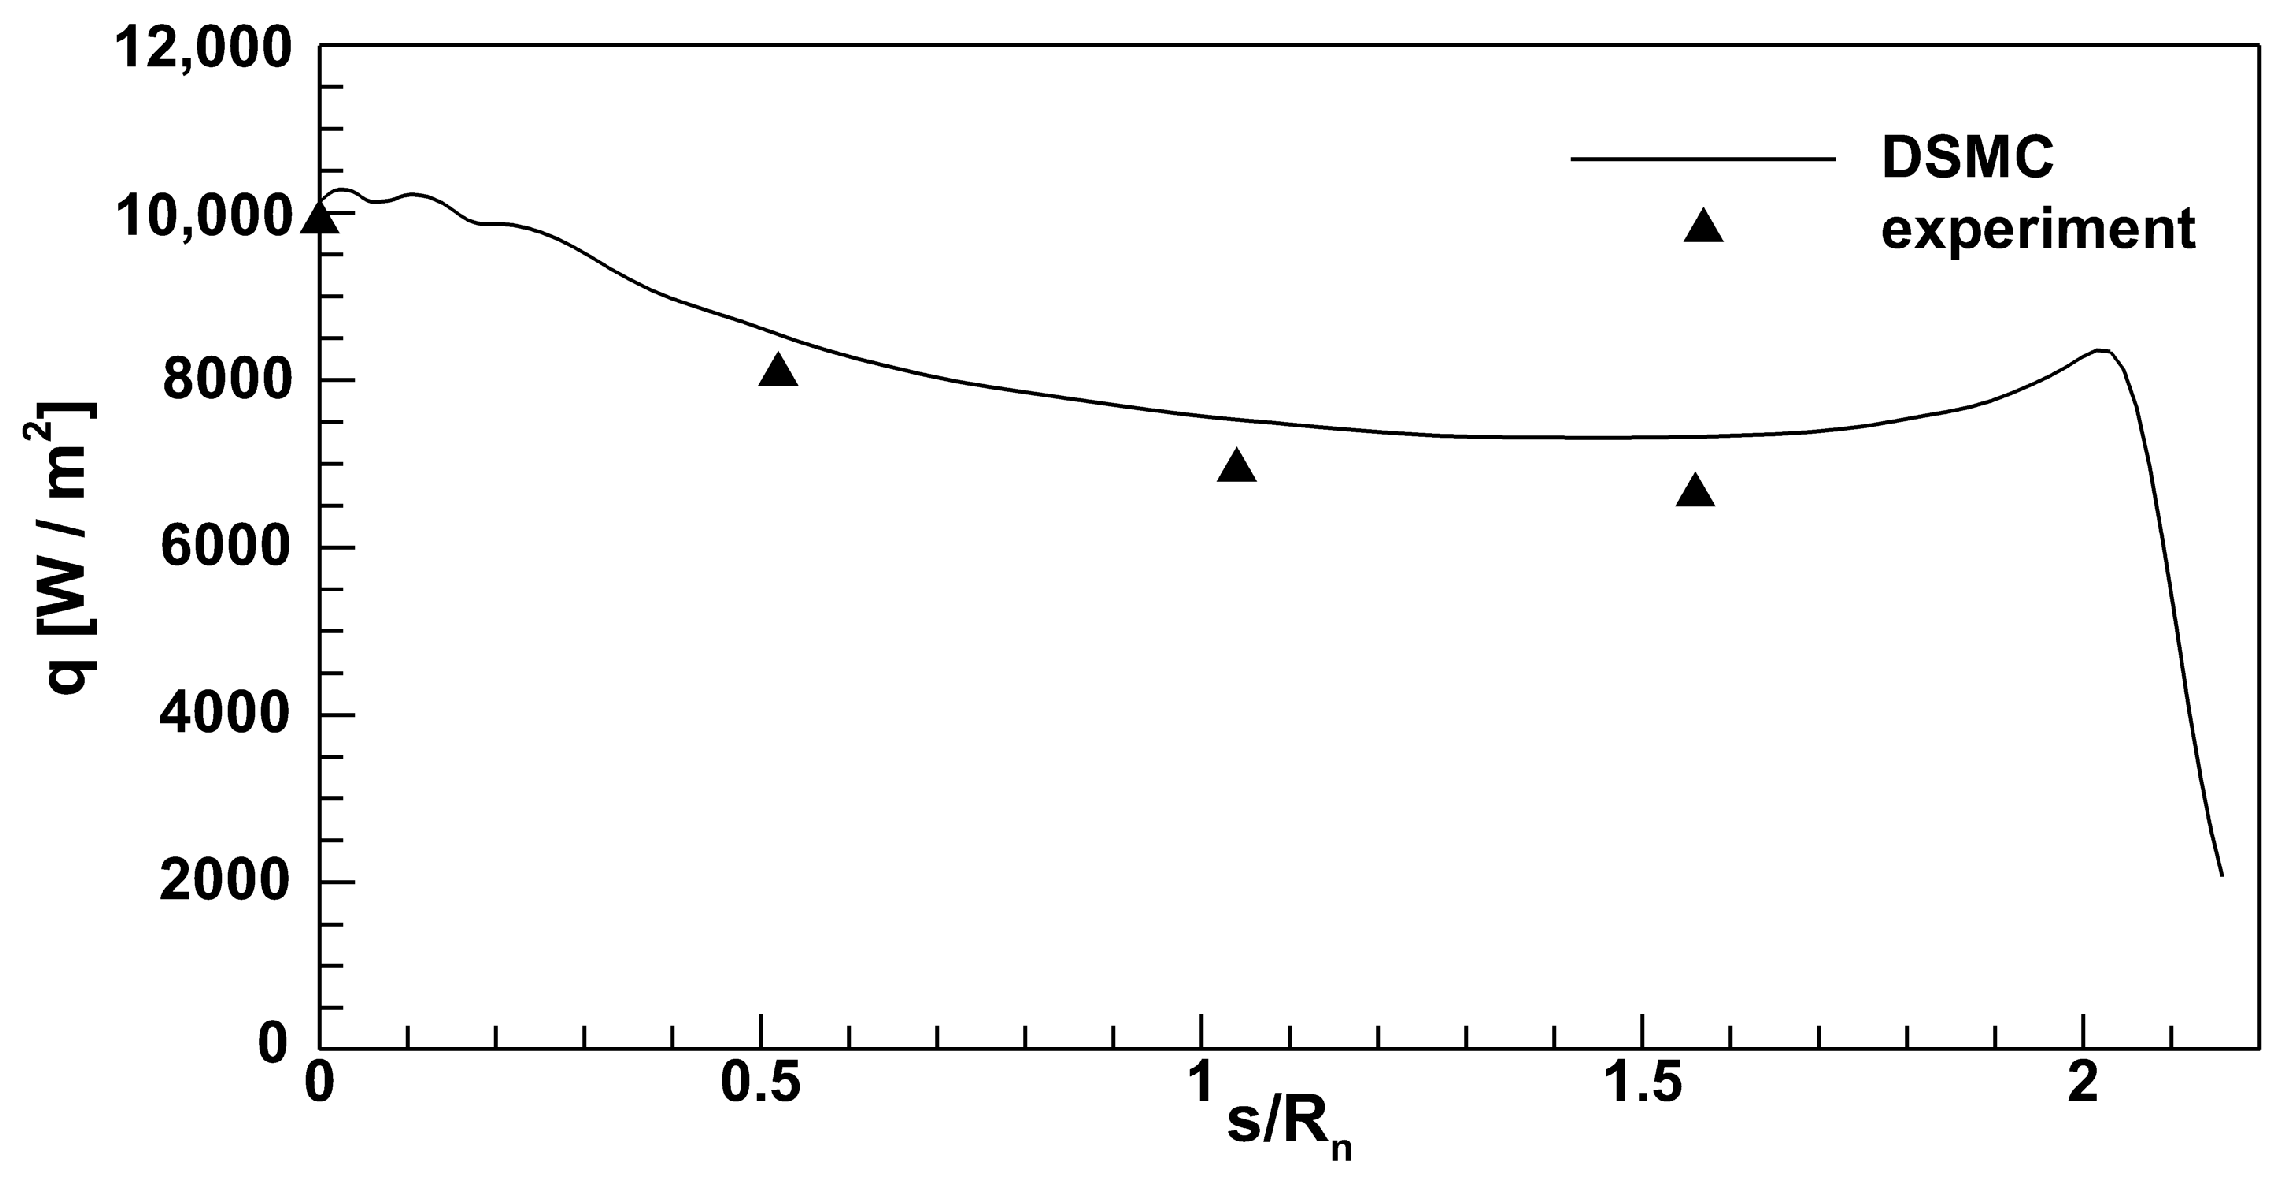
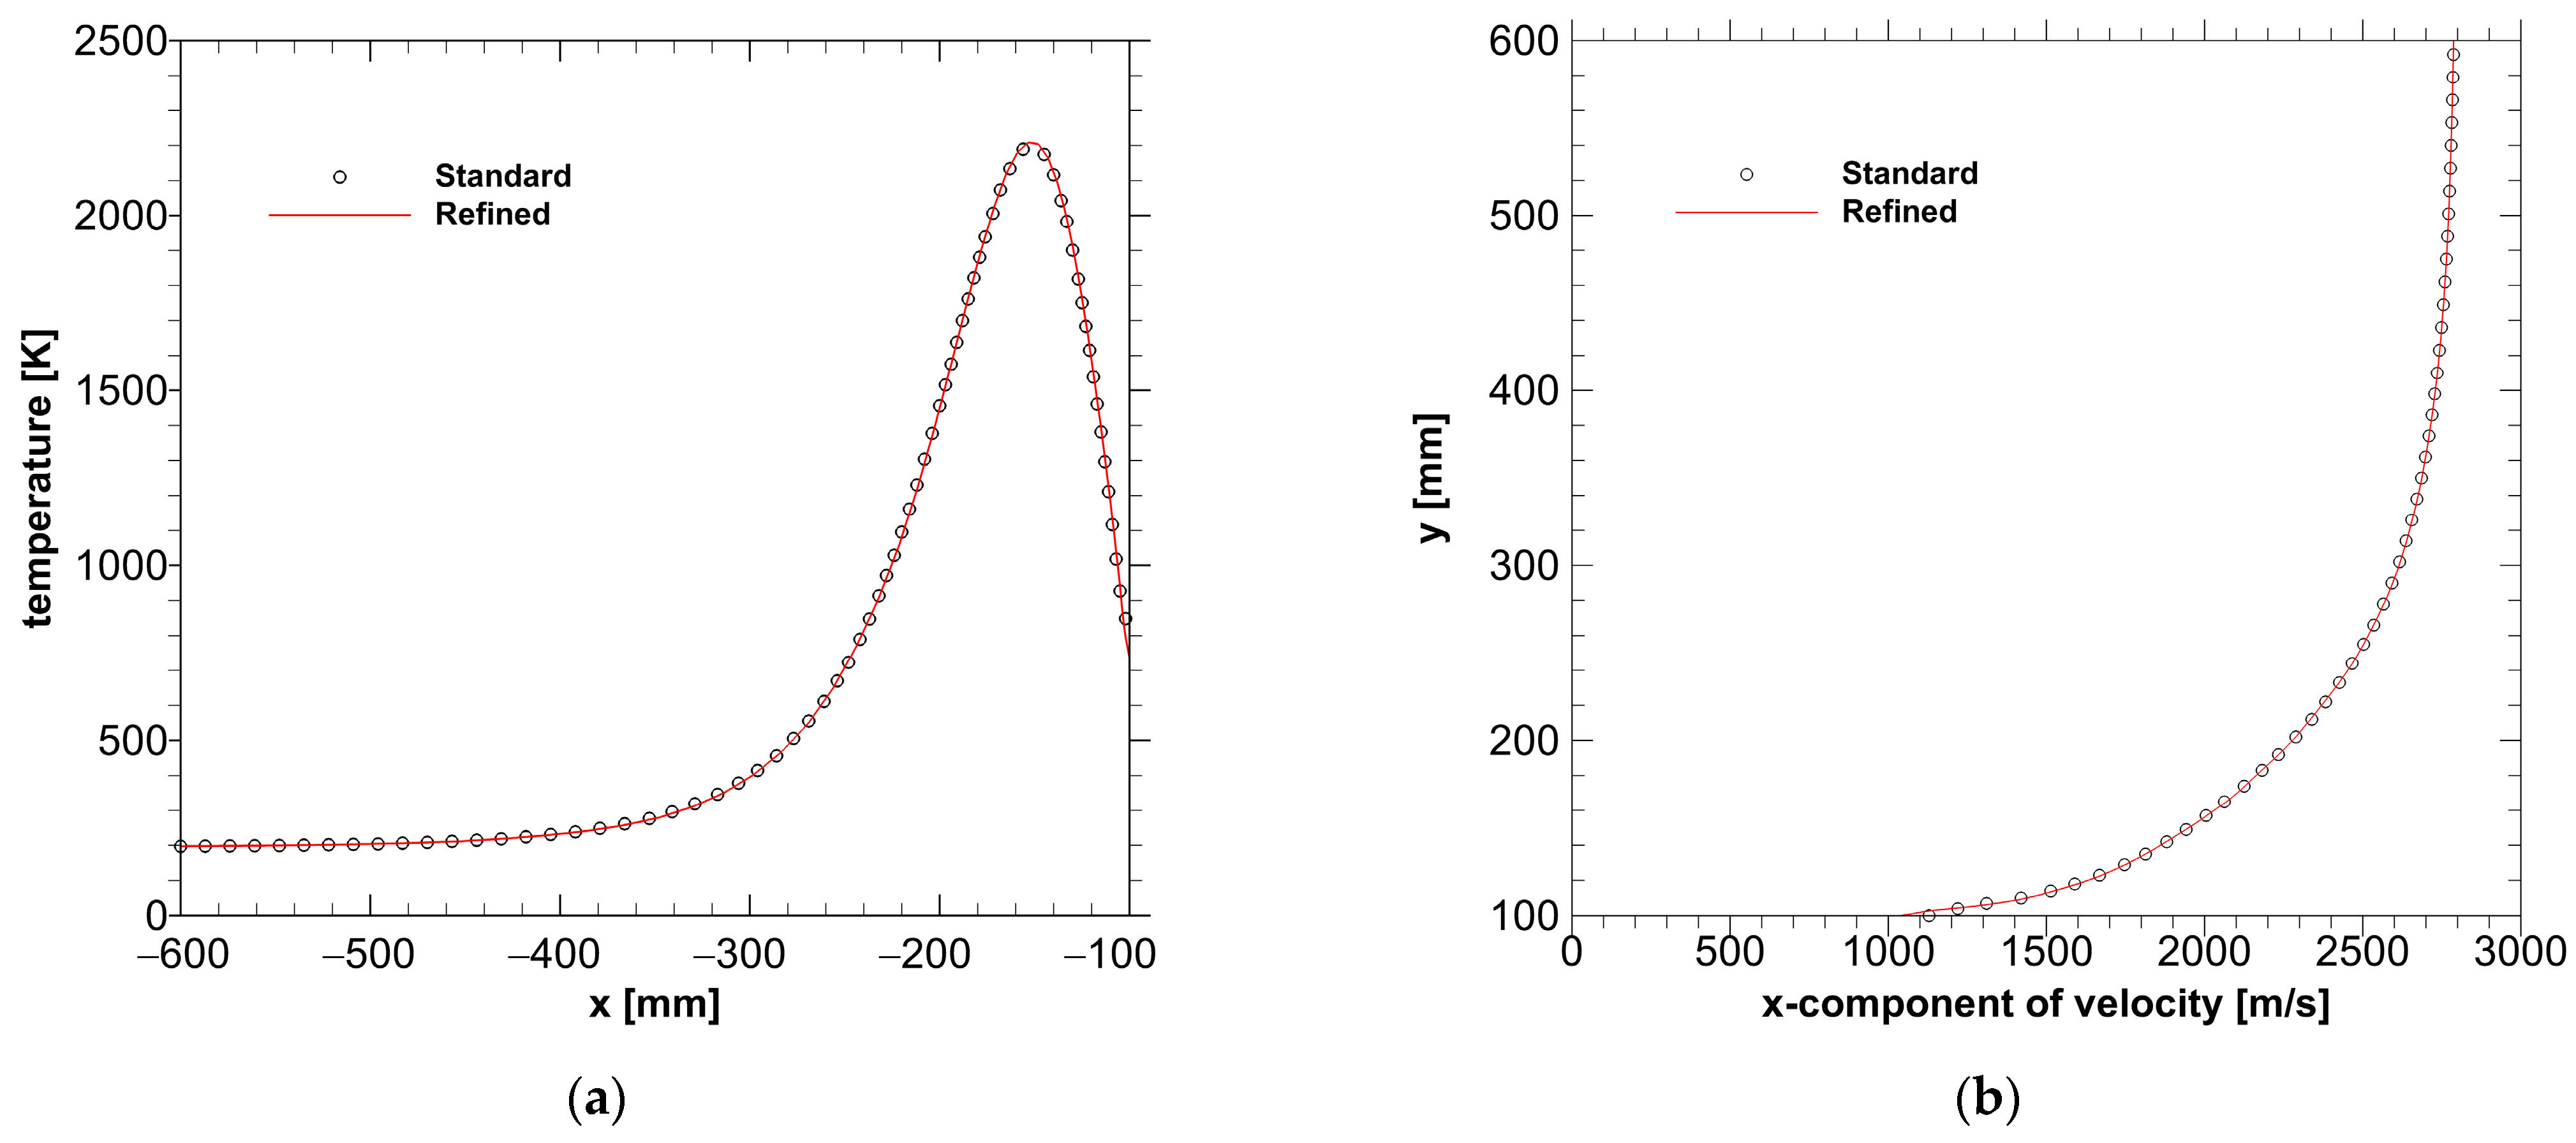
2.2. Code Validation
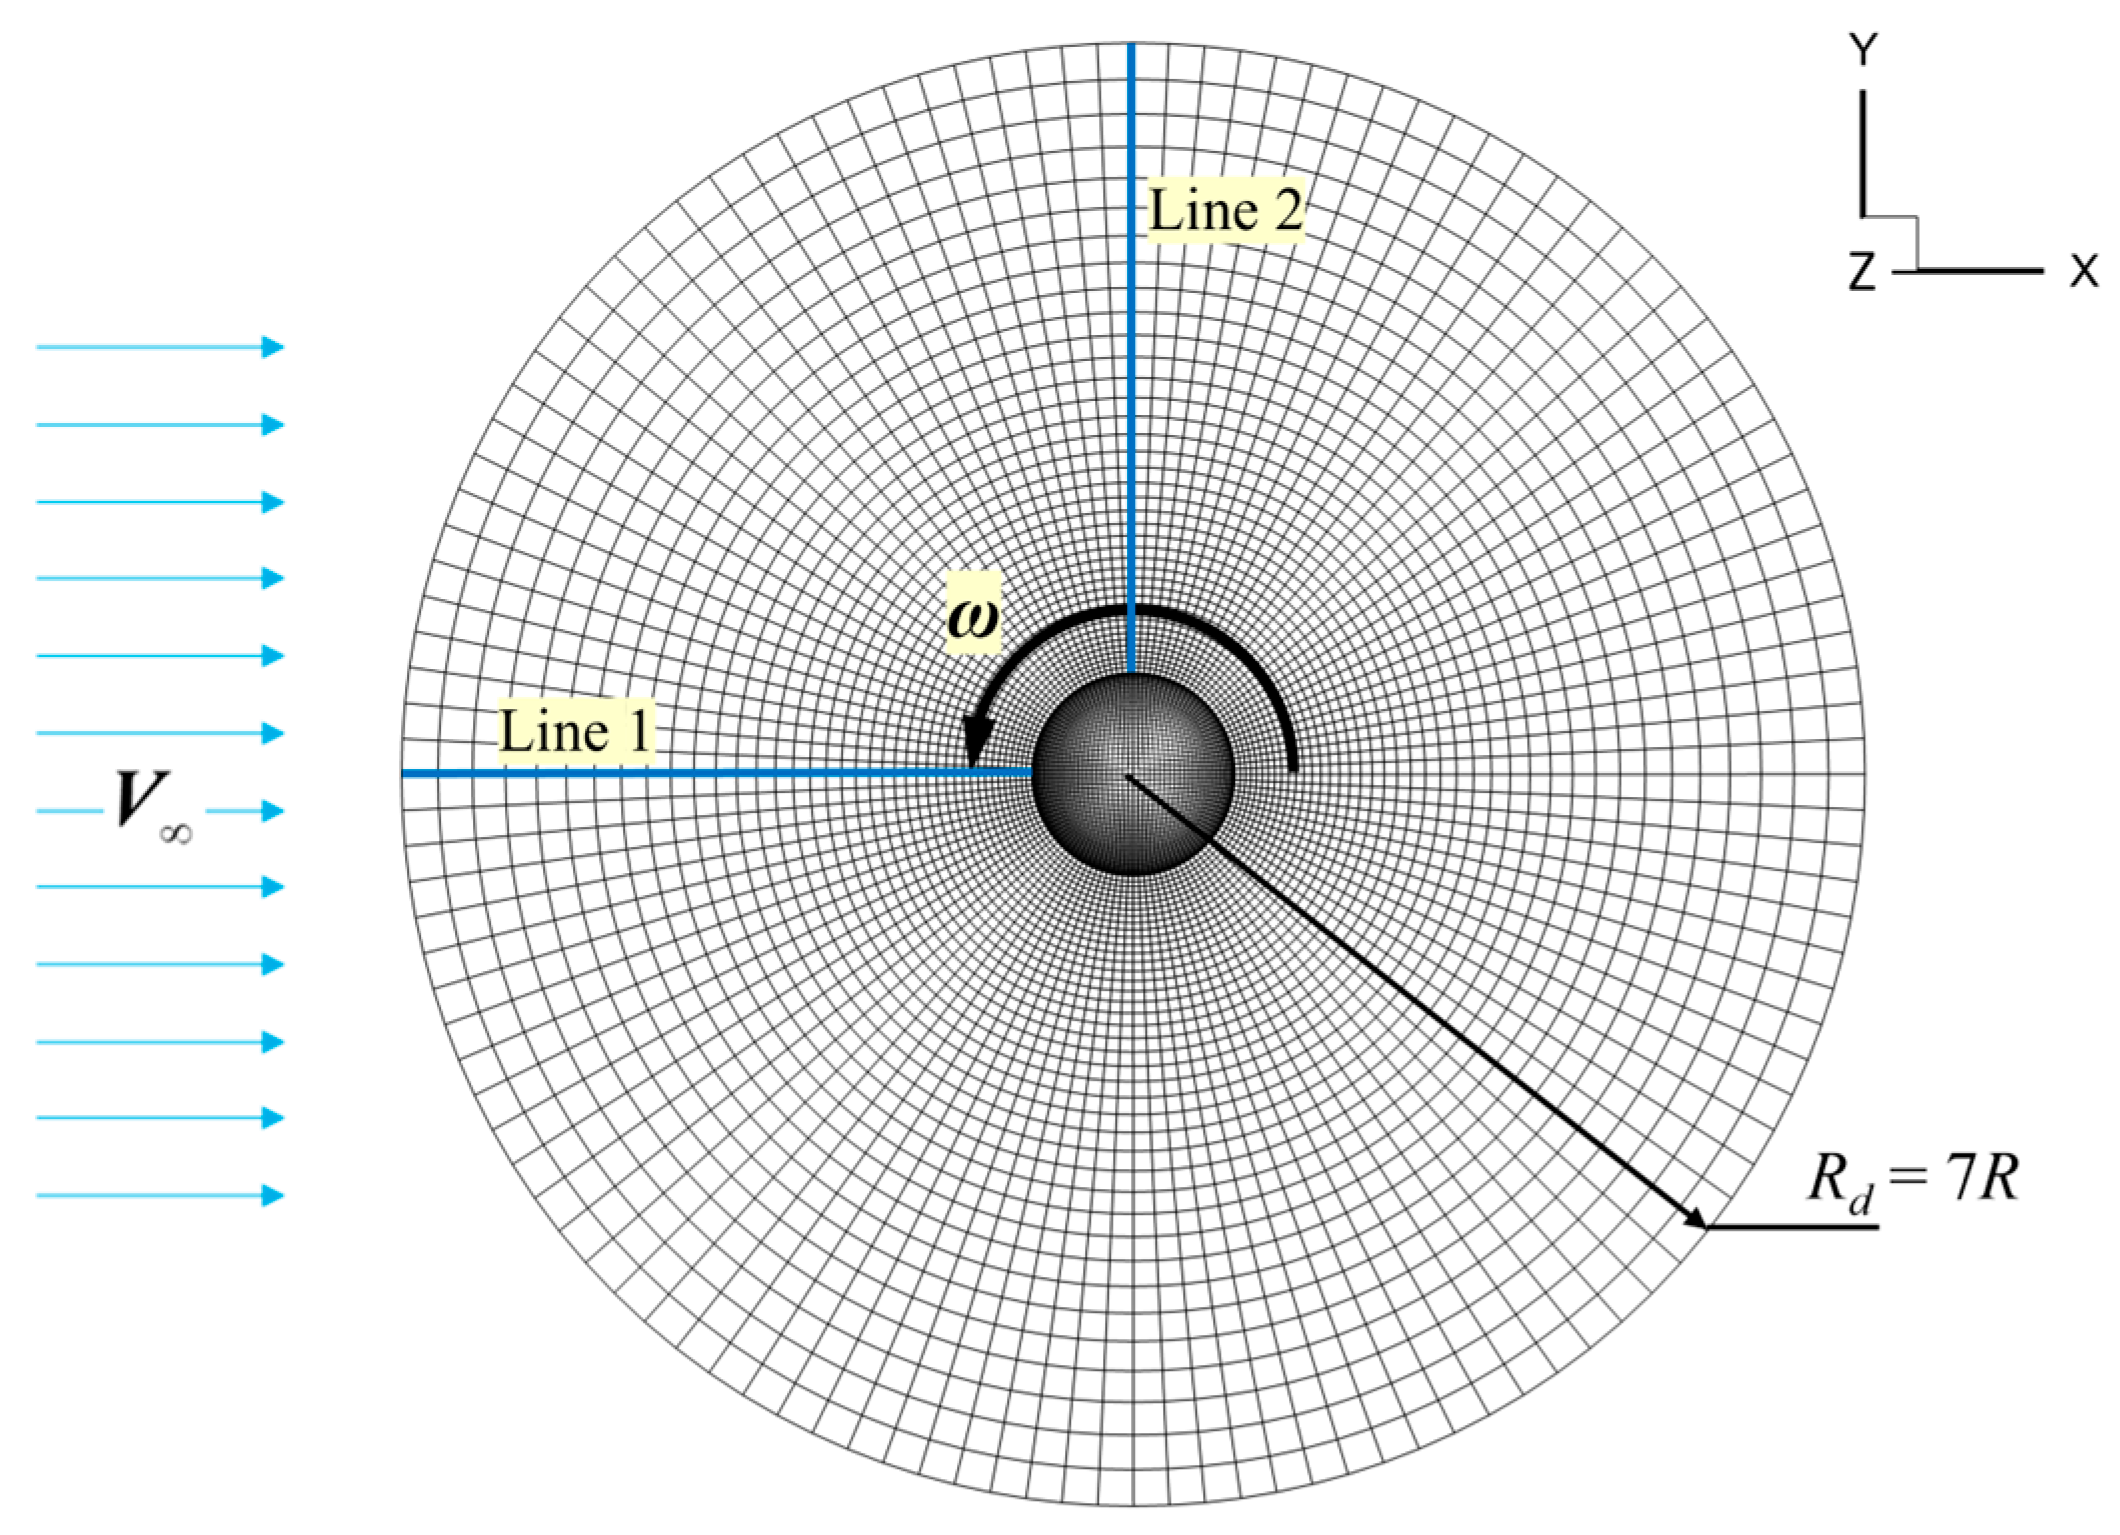
3. Problem Description
3.1. Flow Conditions
3.2. Computational Settings and Parameters
4. Results and Discussion
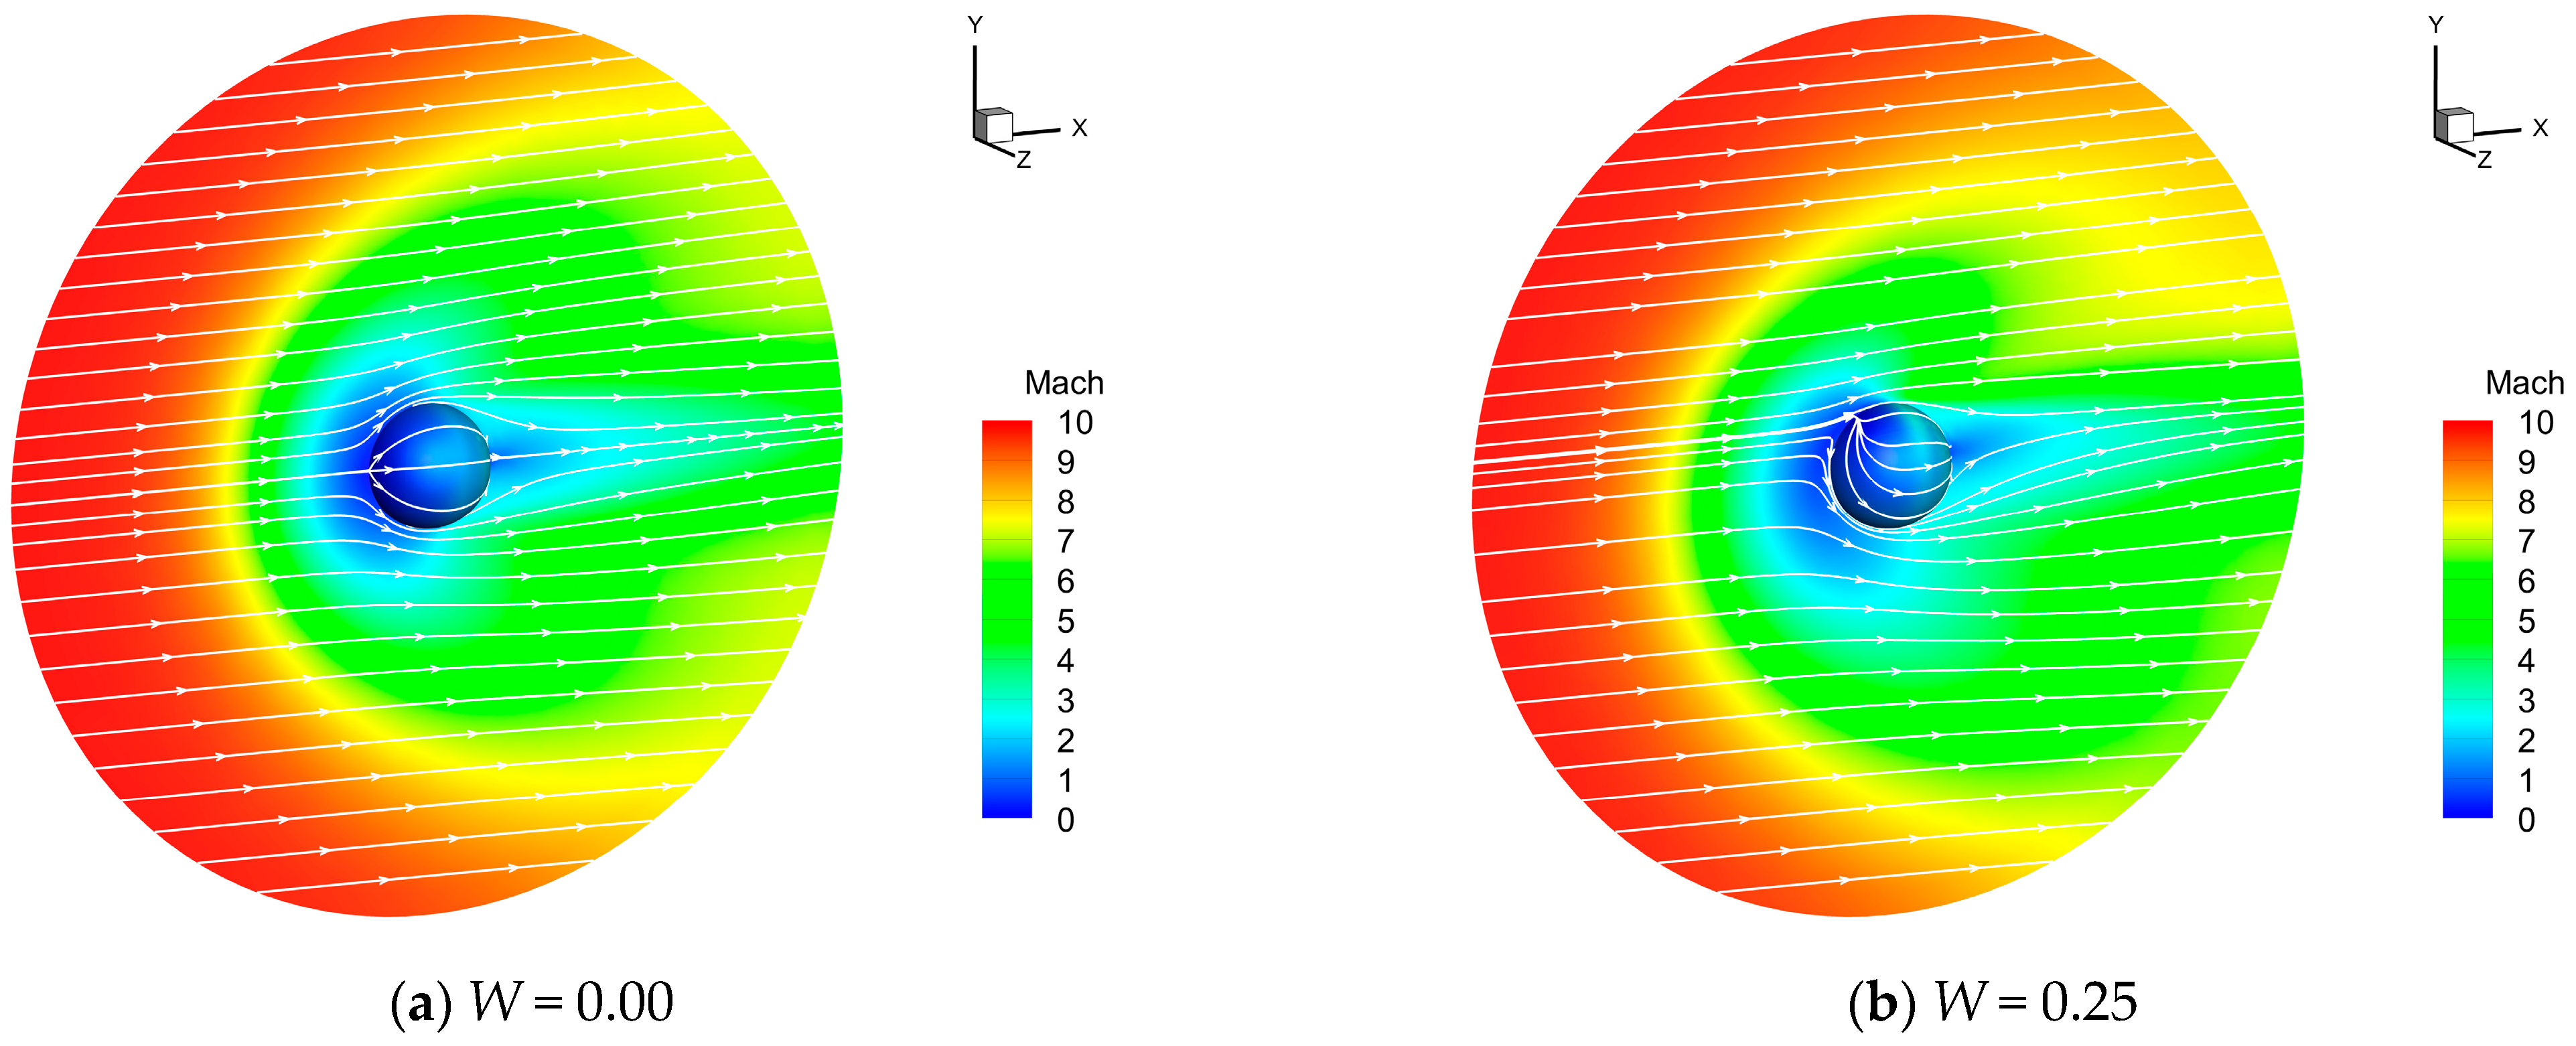
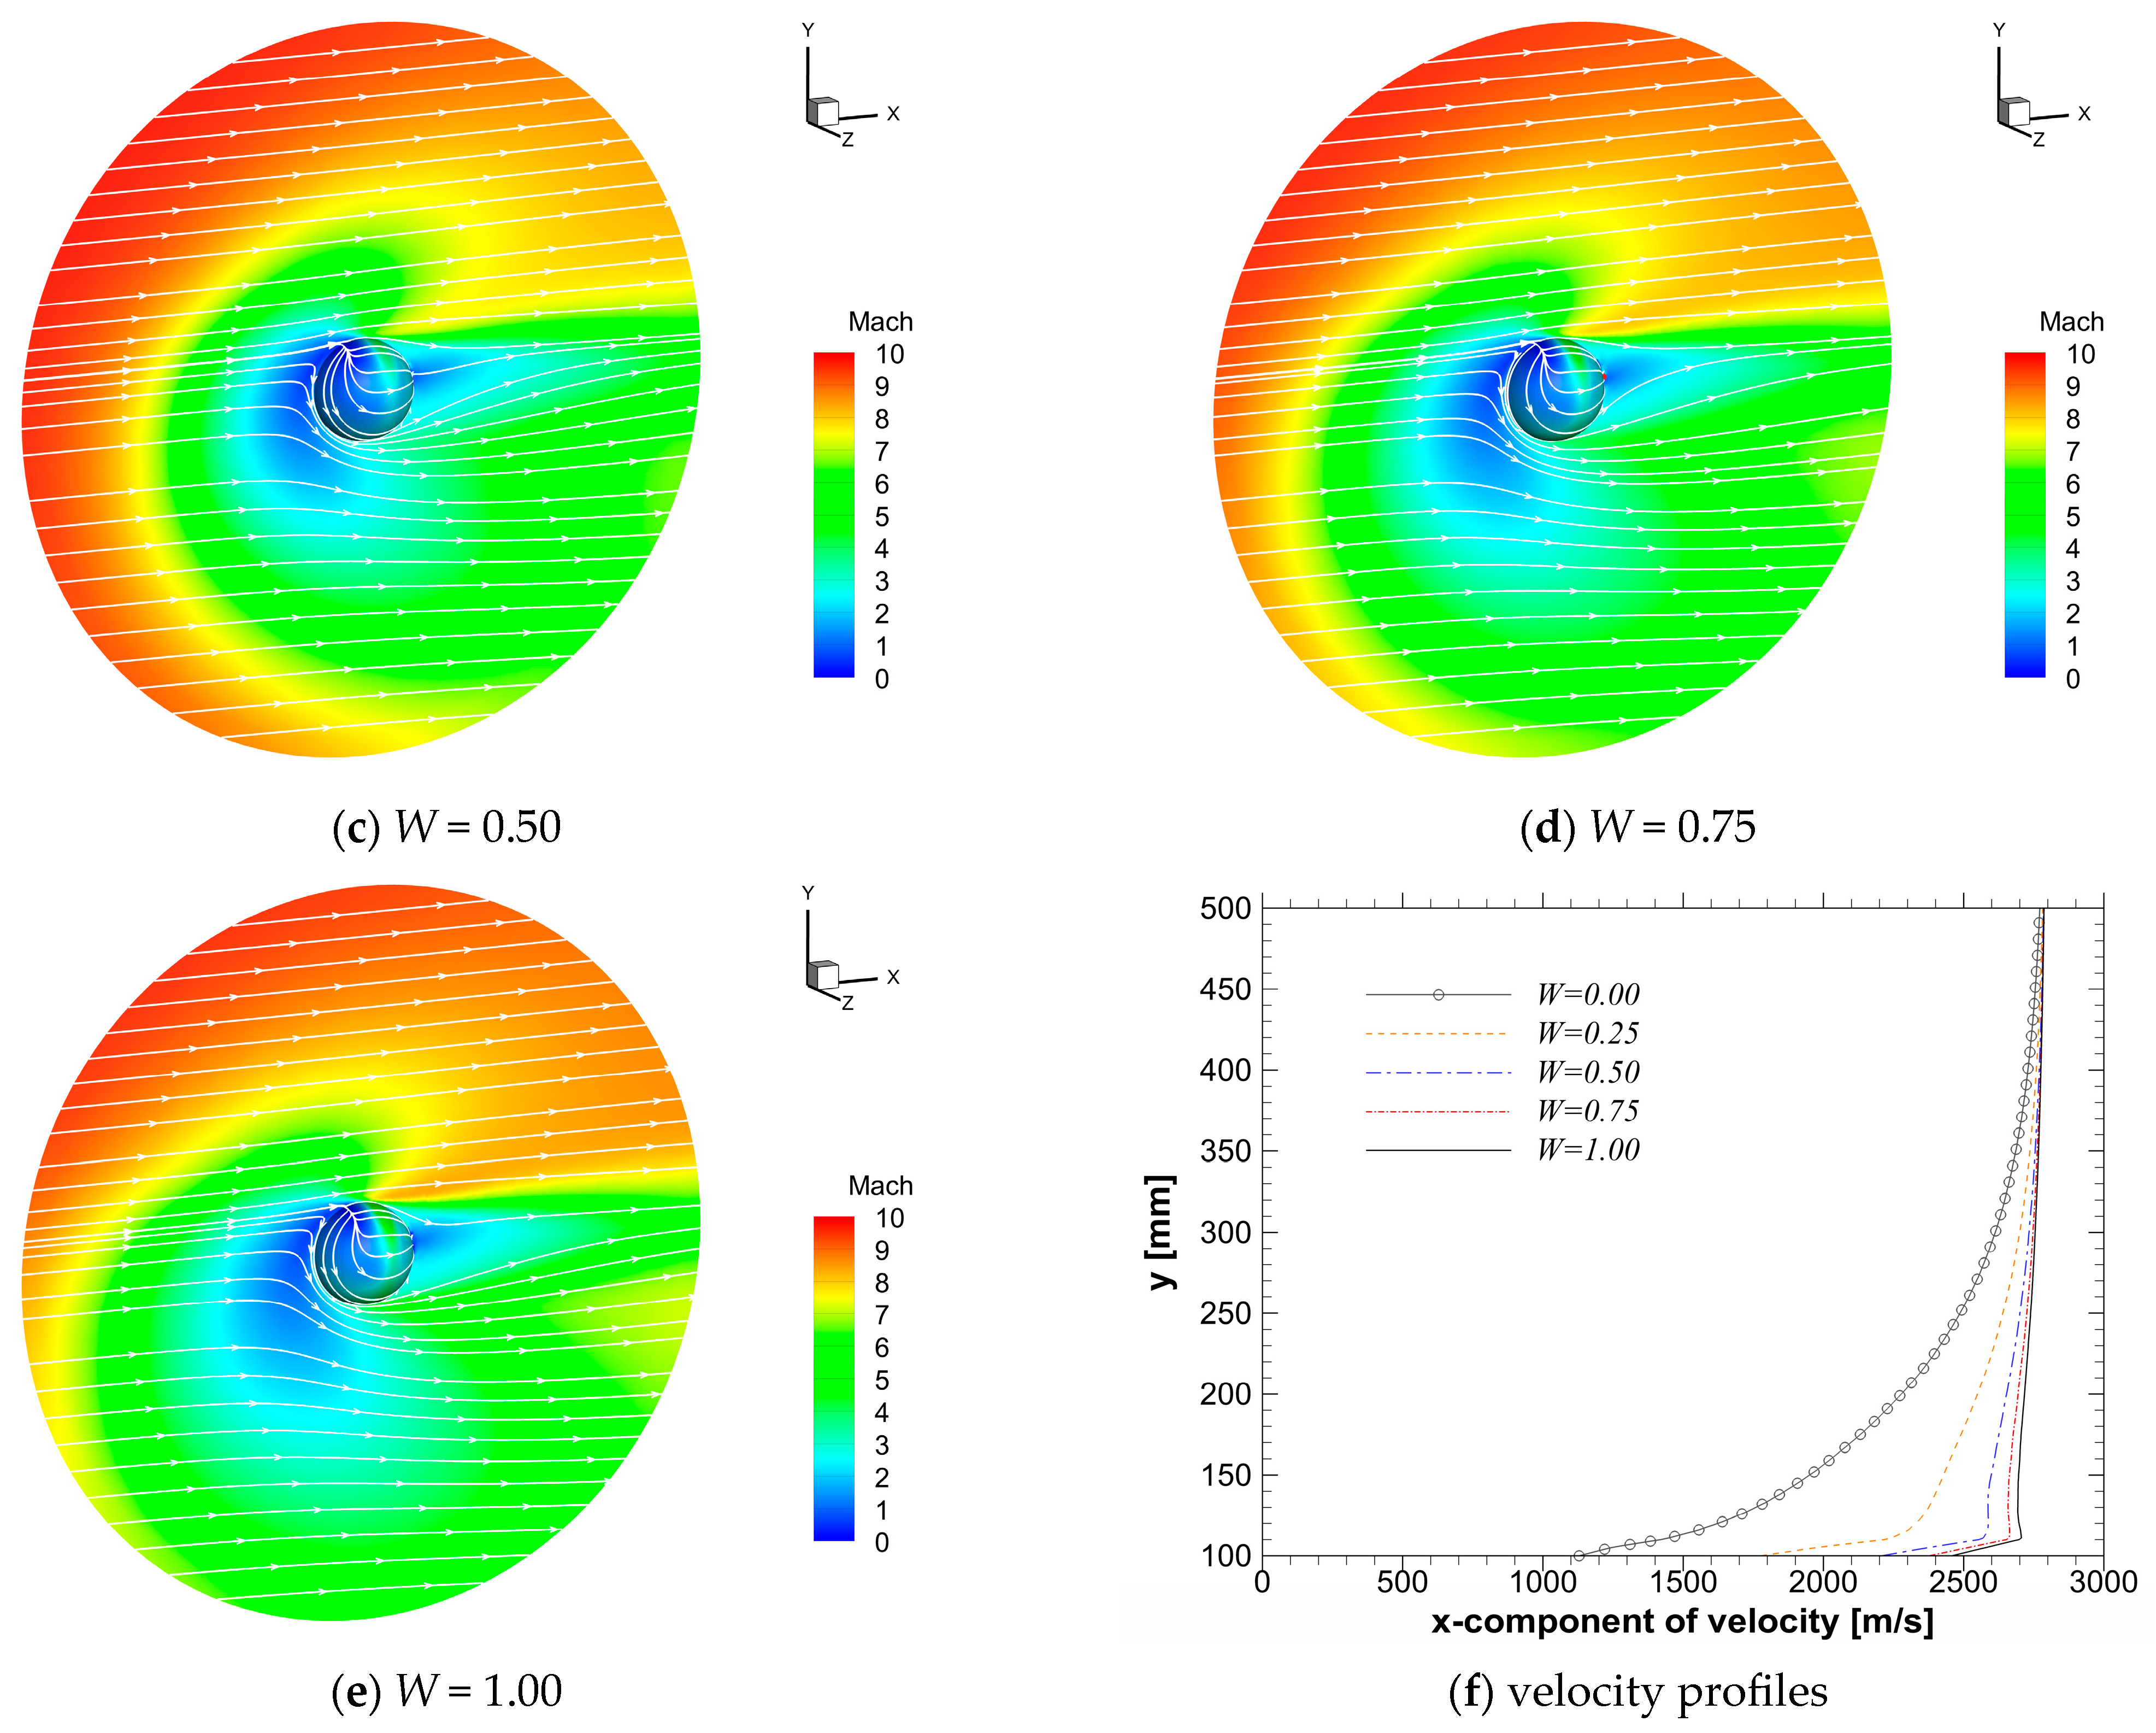
4.1. Flow Fields
4.2. Surface Quantities
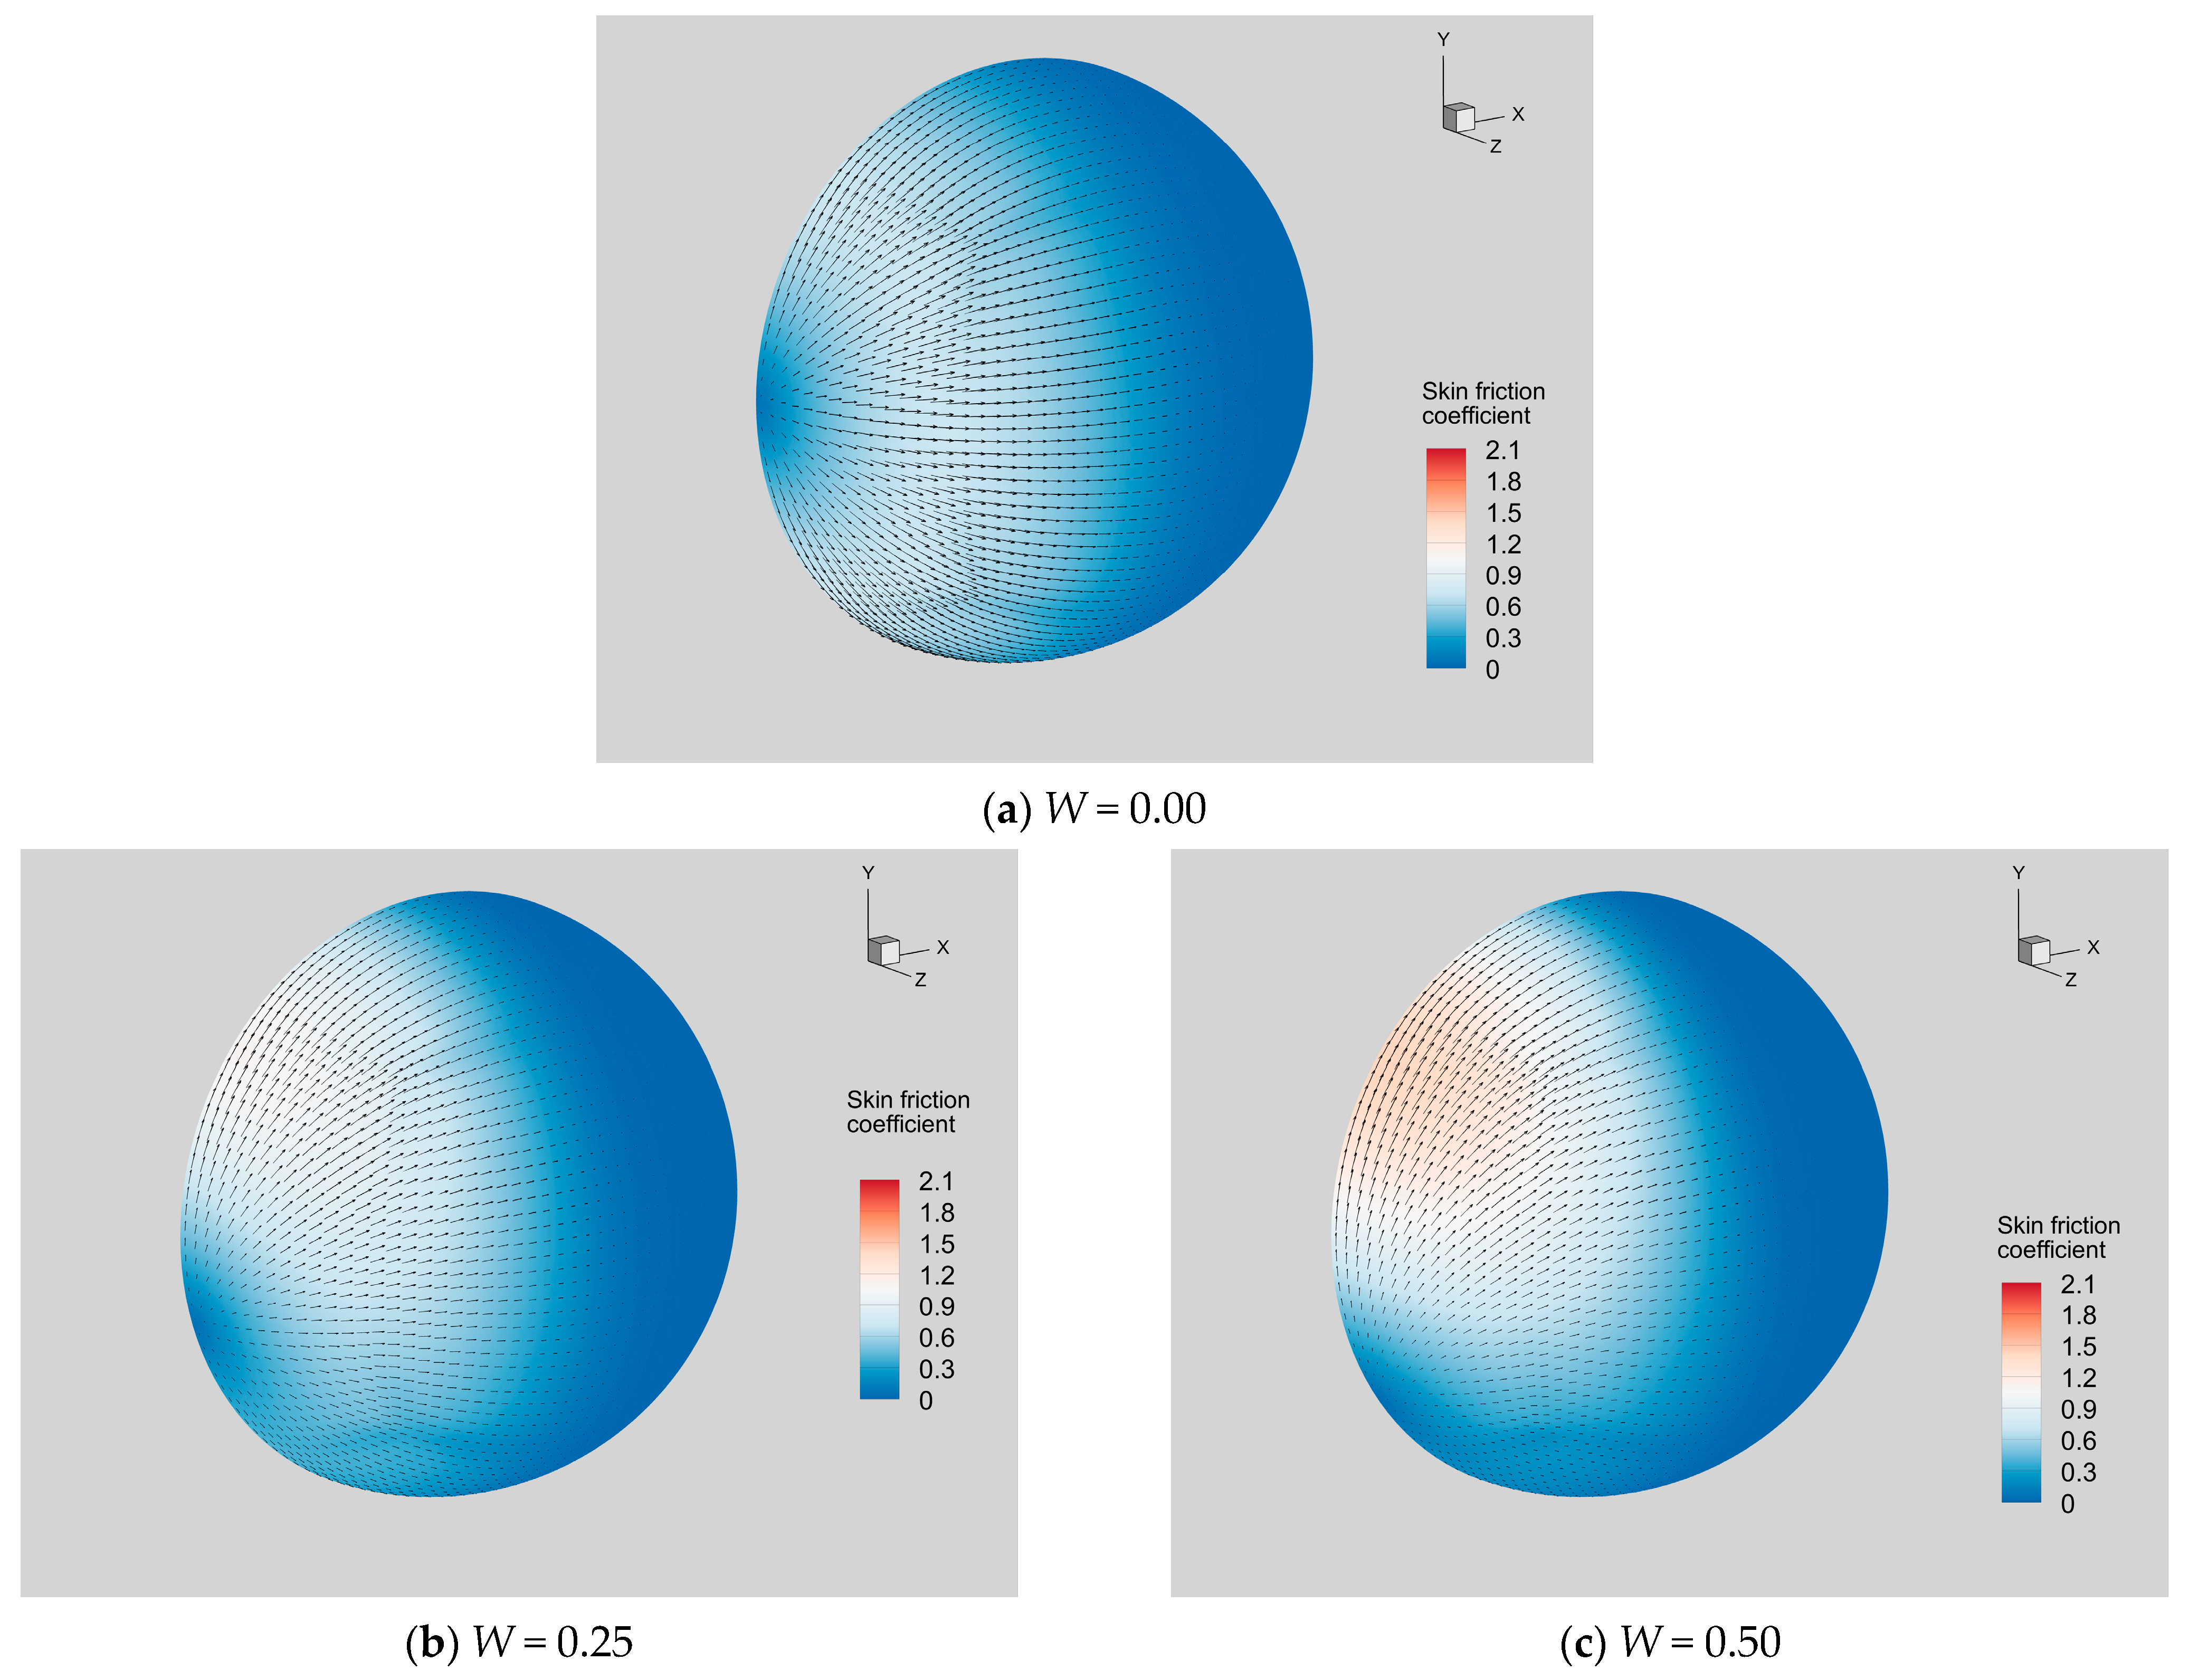
4.2.1. Distribution of Wall Friction
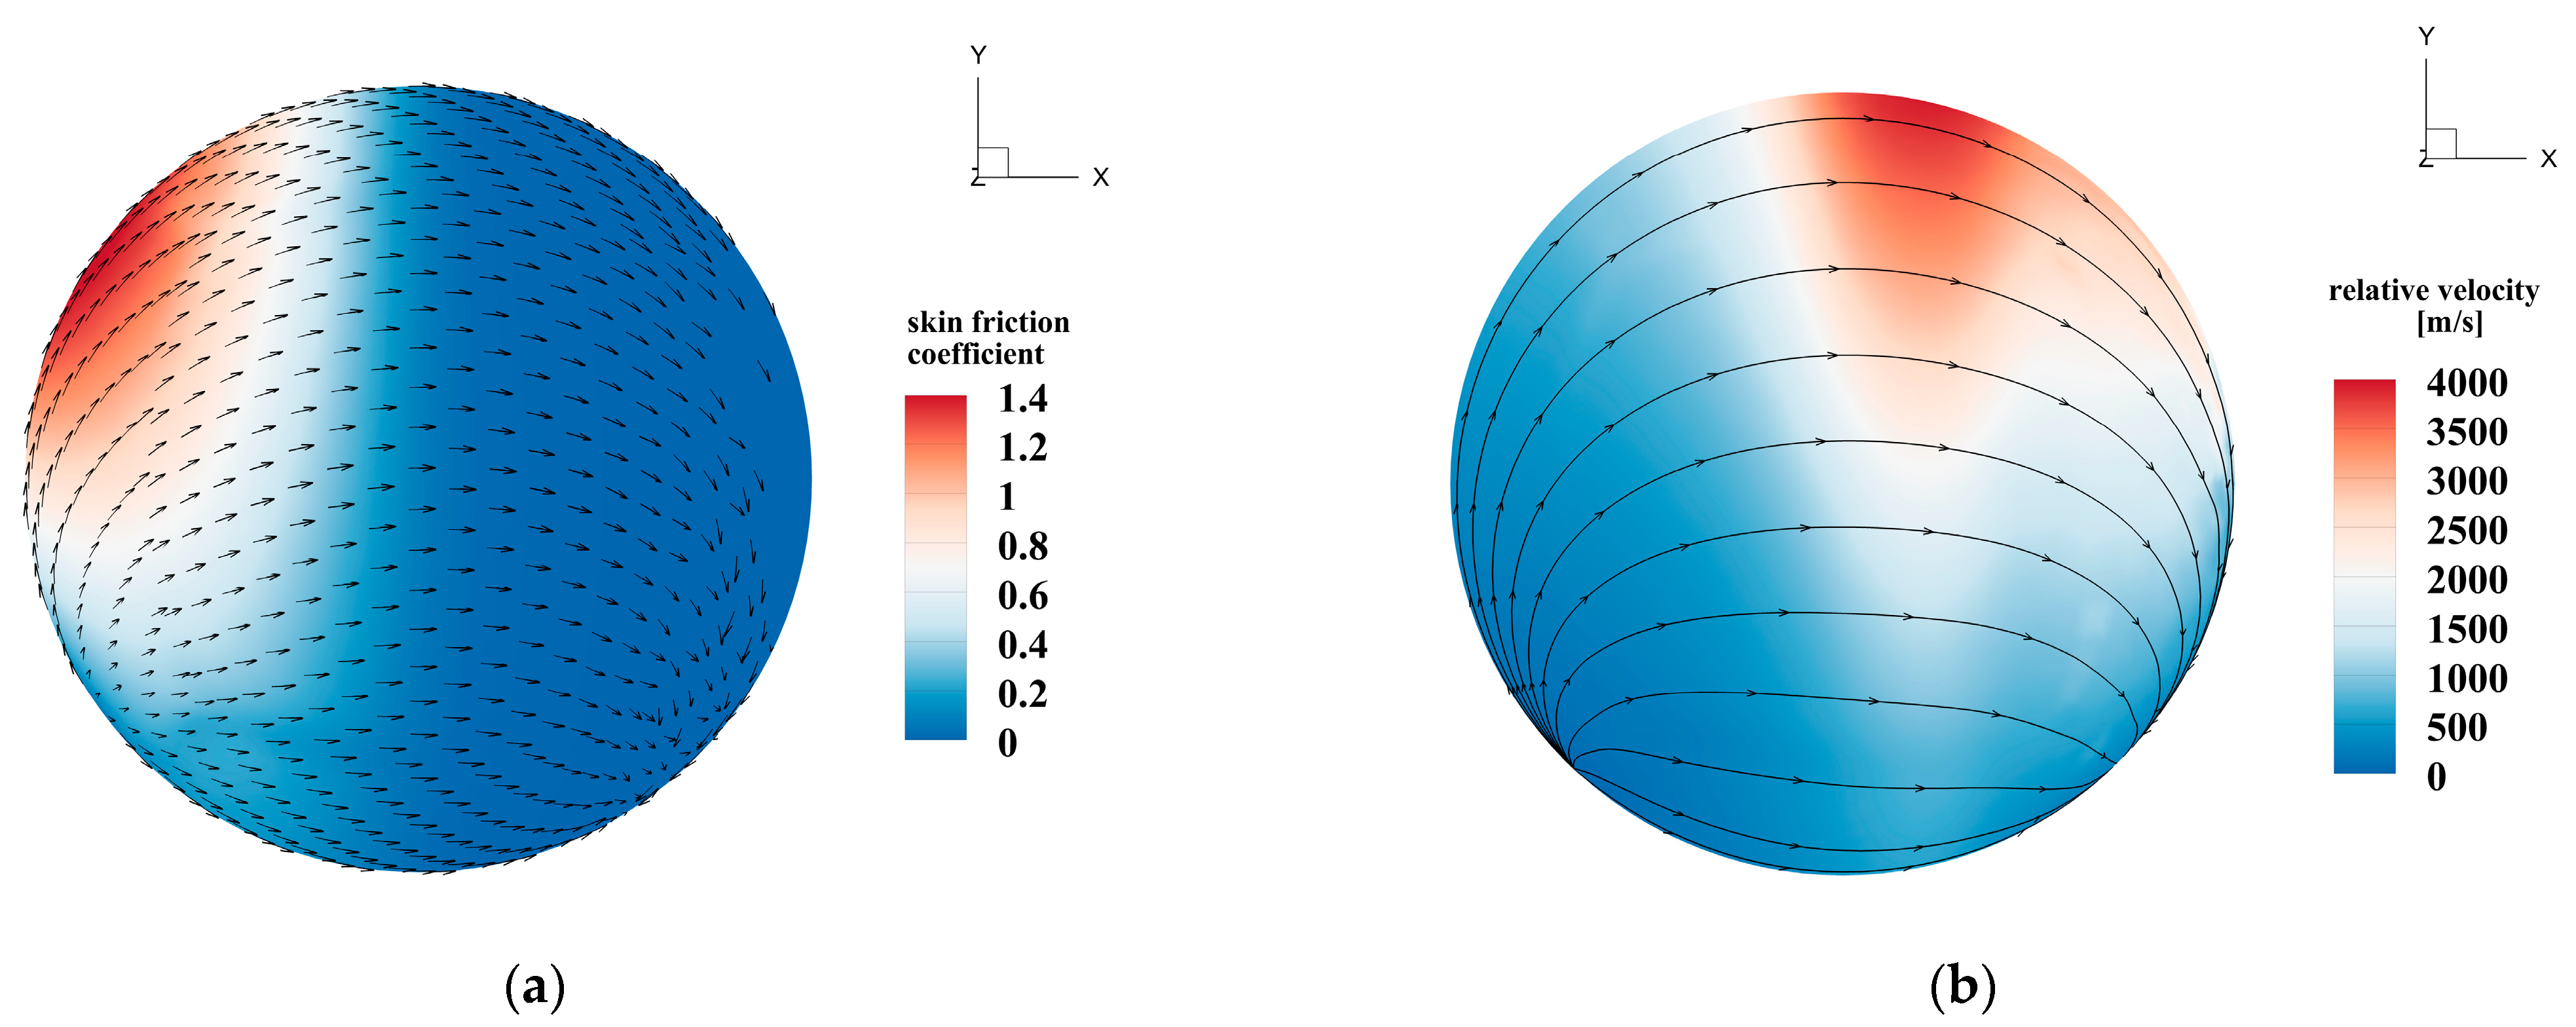
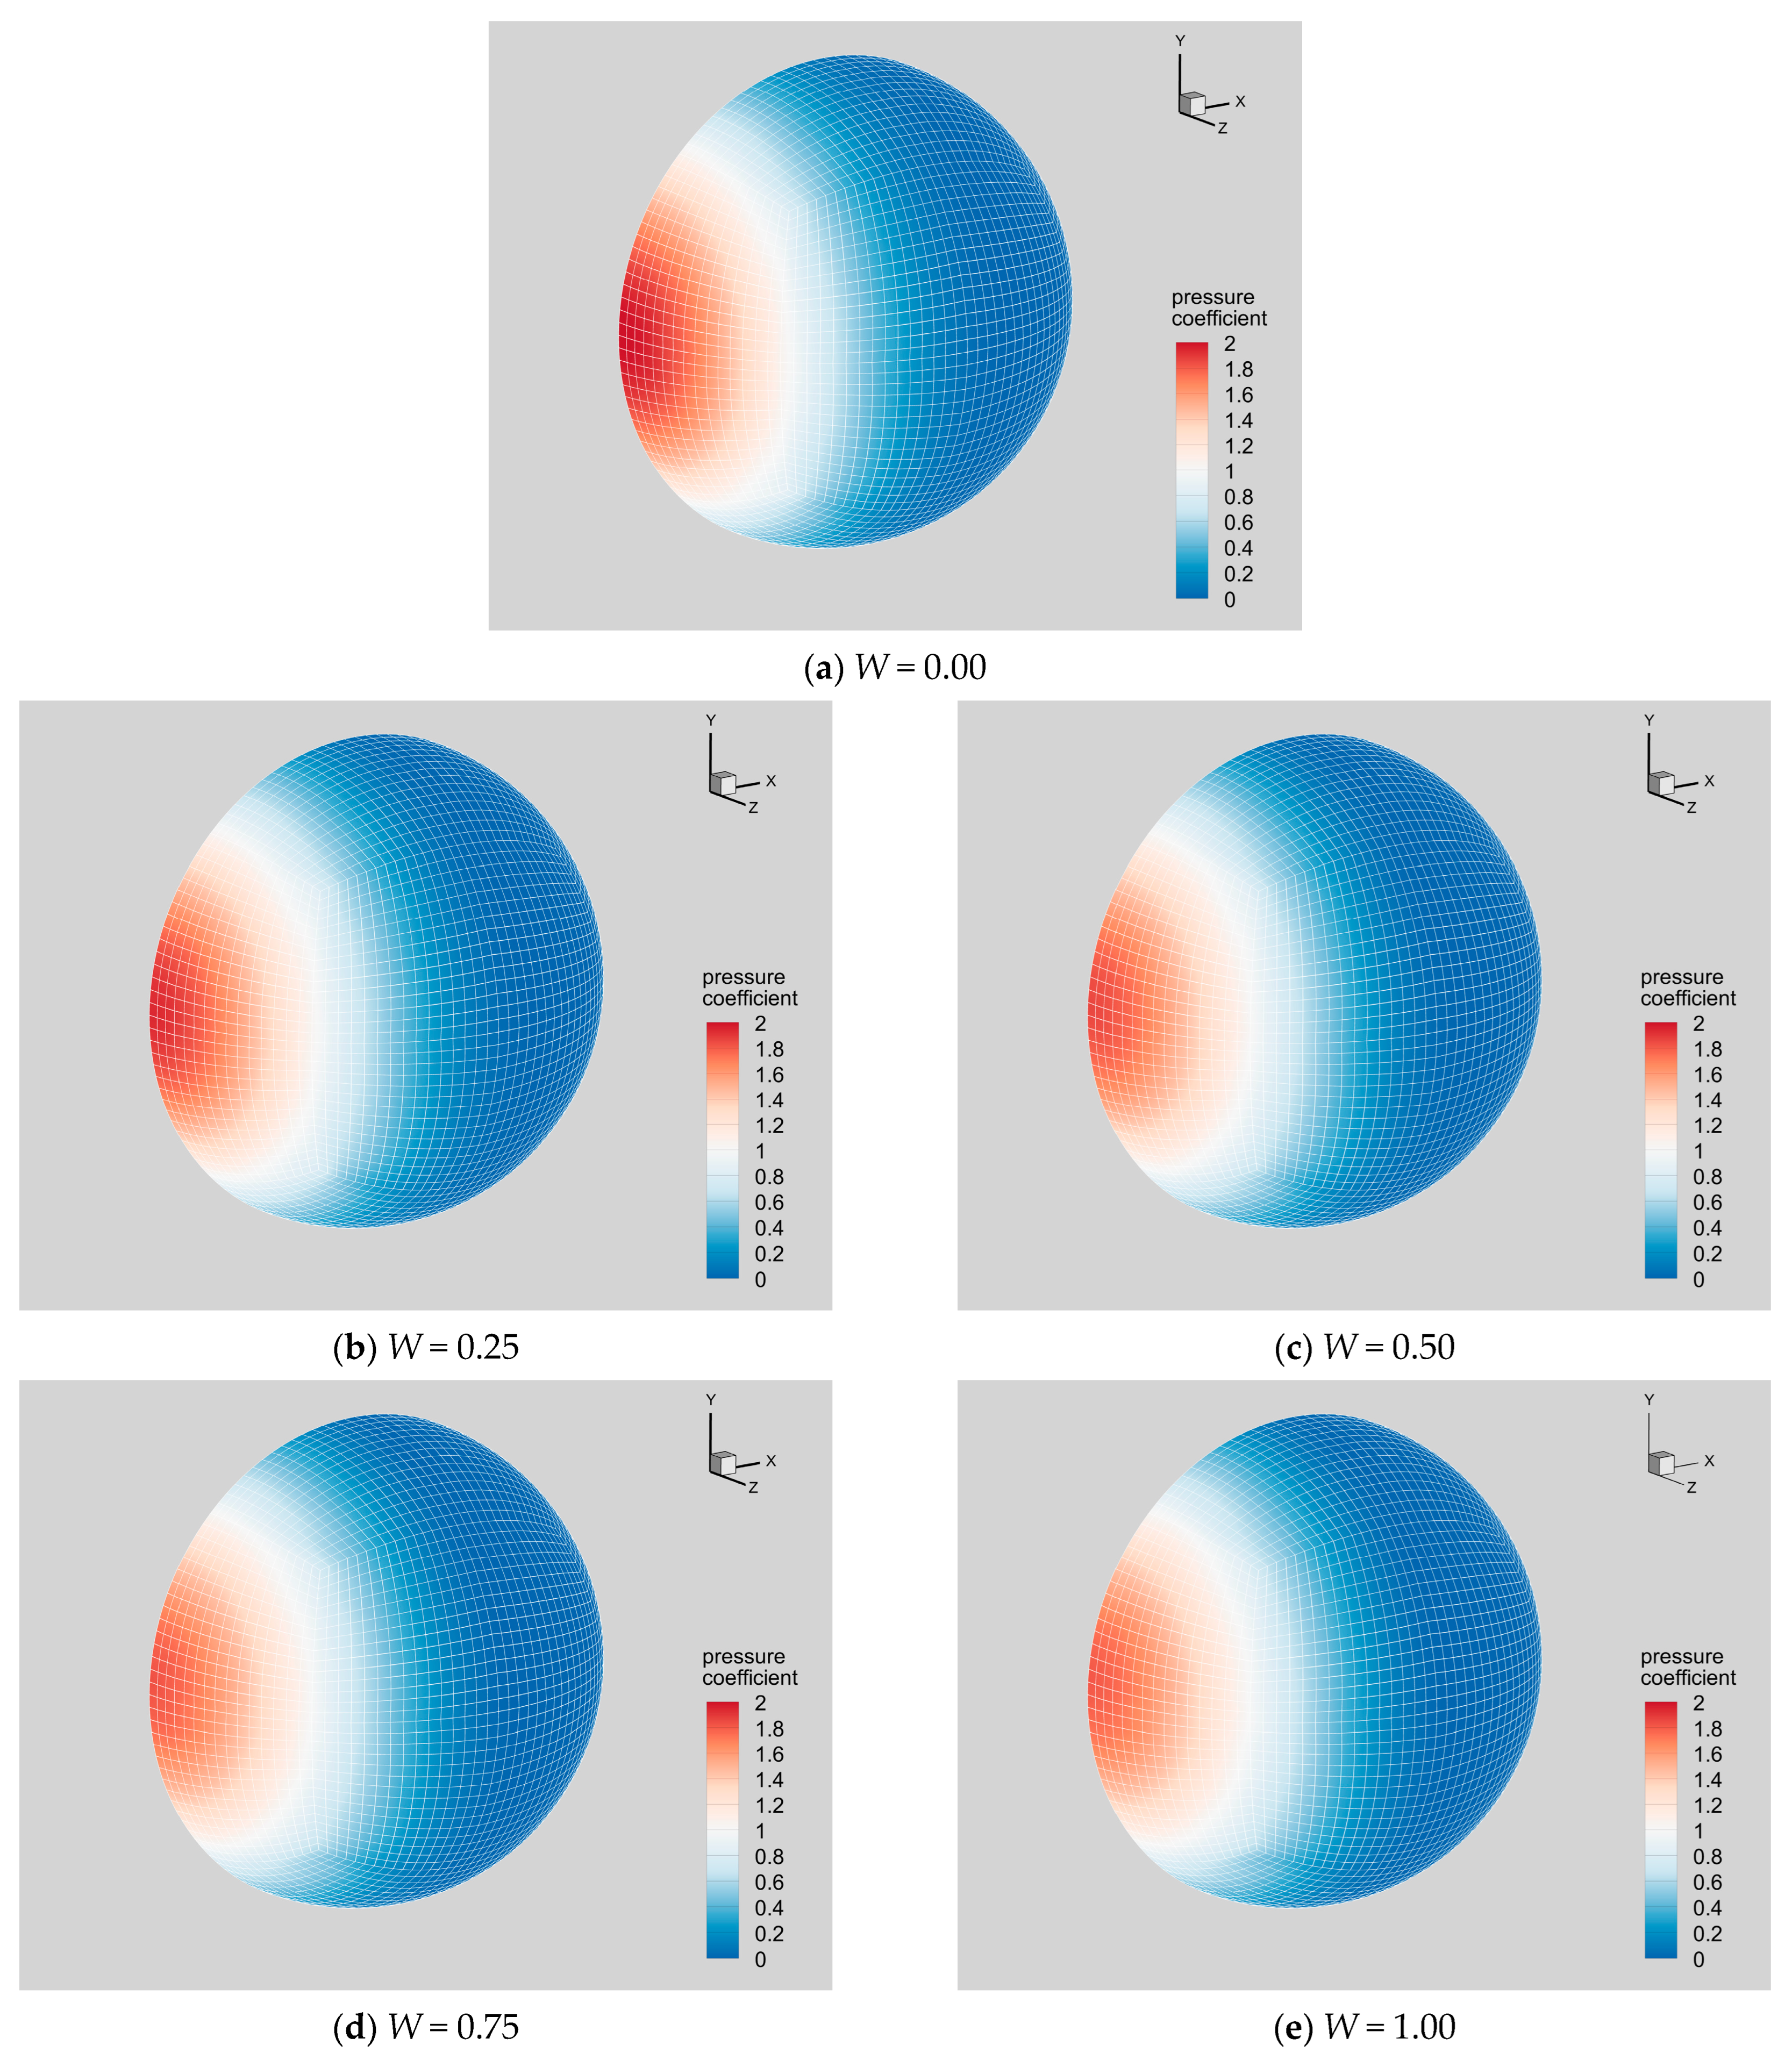
4.2.2. Distribution of Wall Pressure
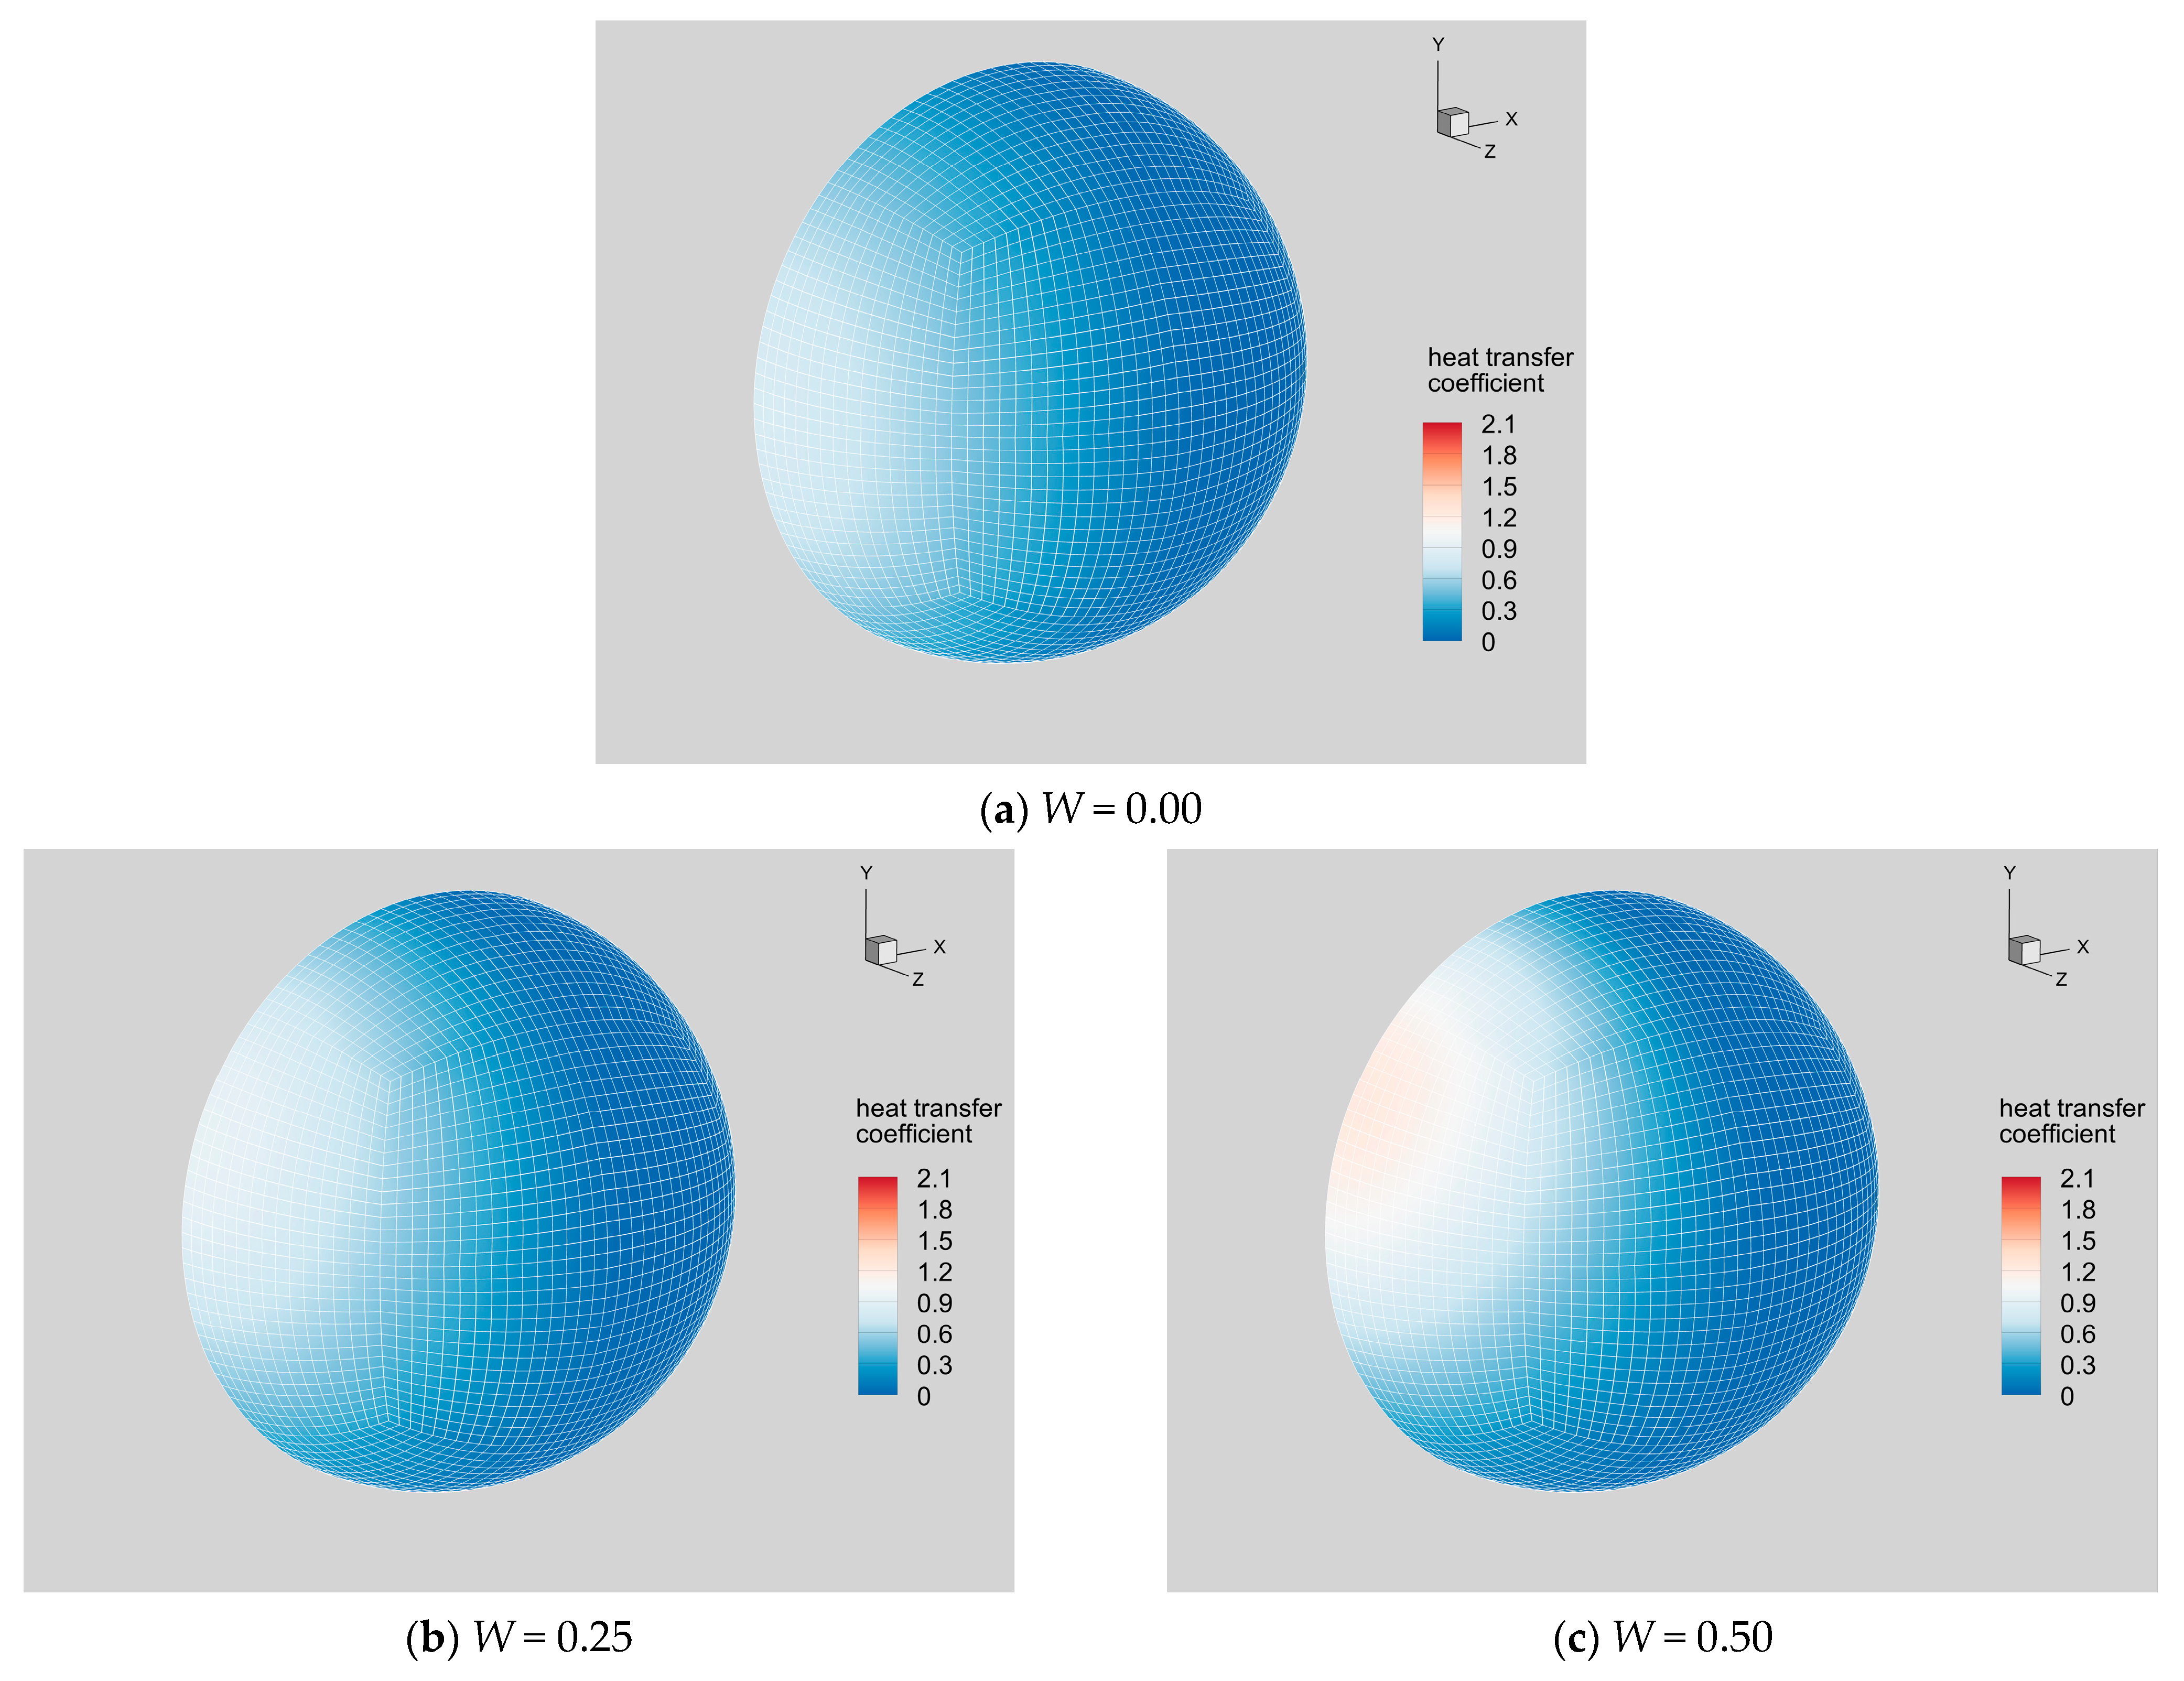
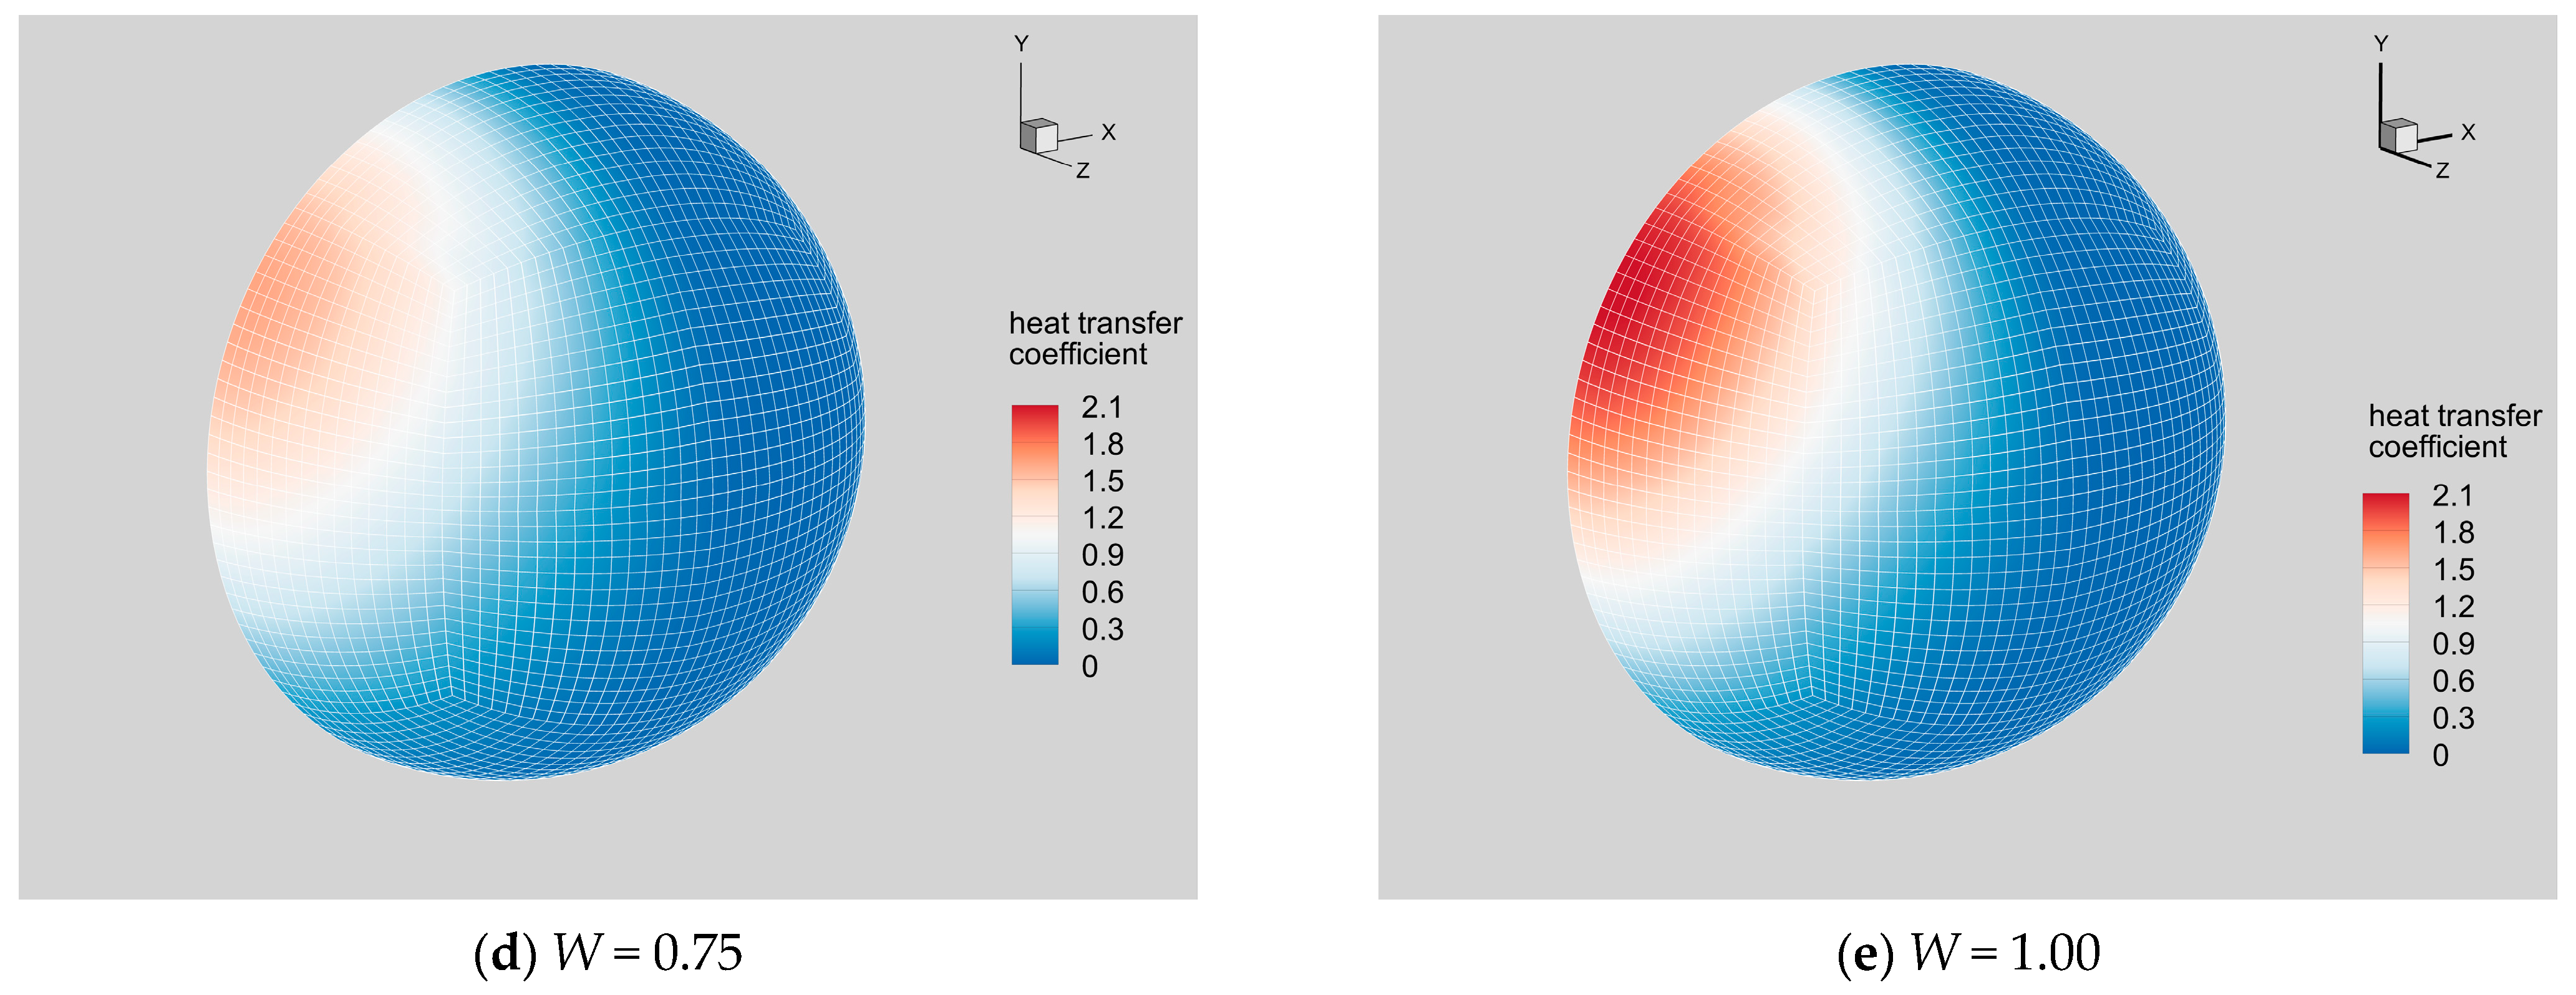
4.2.3. Distribution of Wall Heat Flux
4.3. Overall Aerodynamic Characteristics
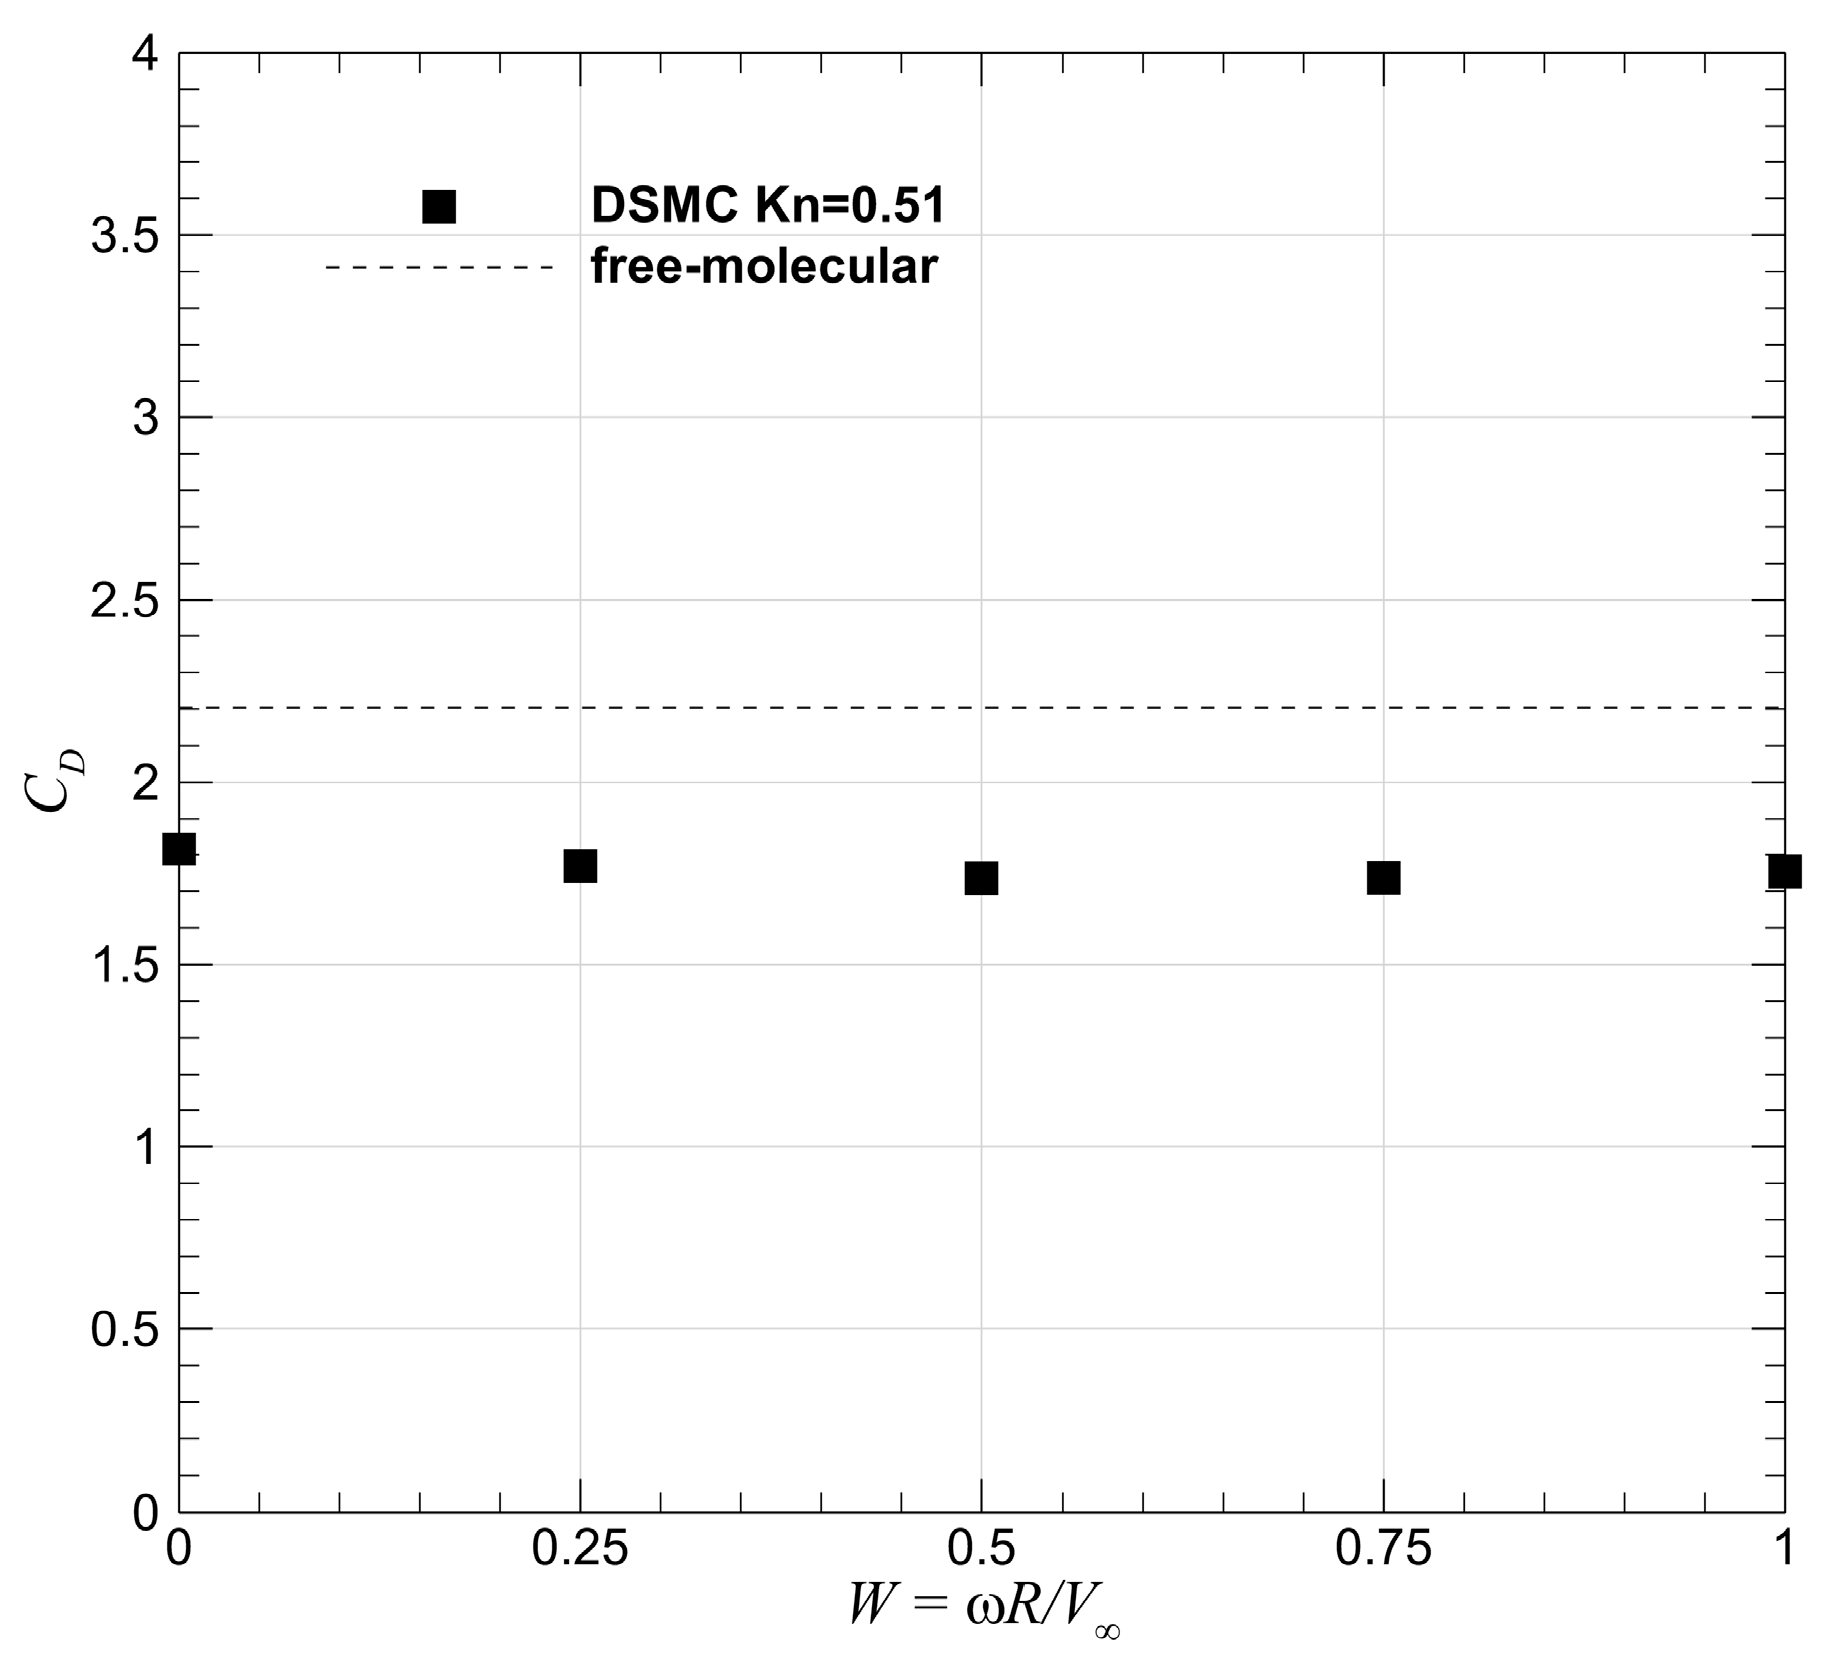
4.3.1. Drag
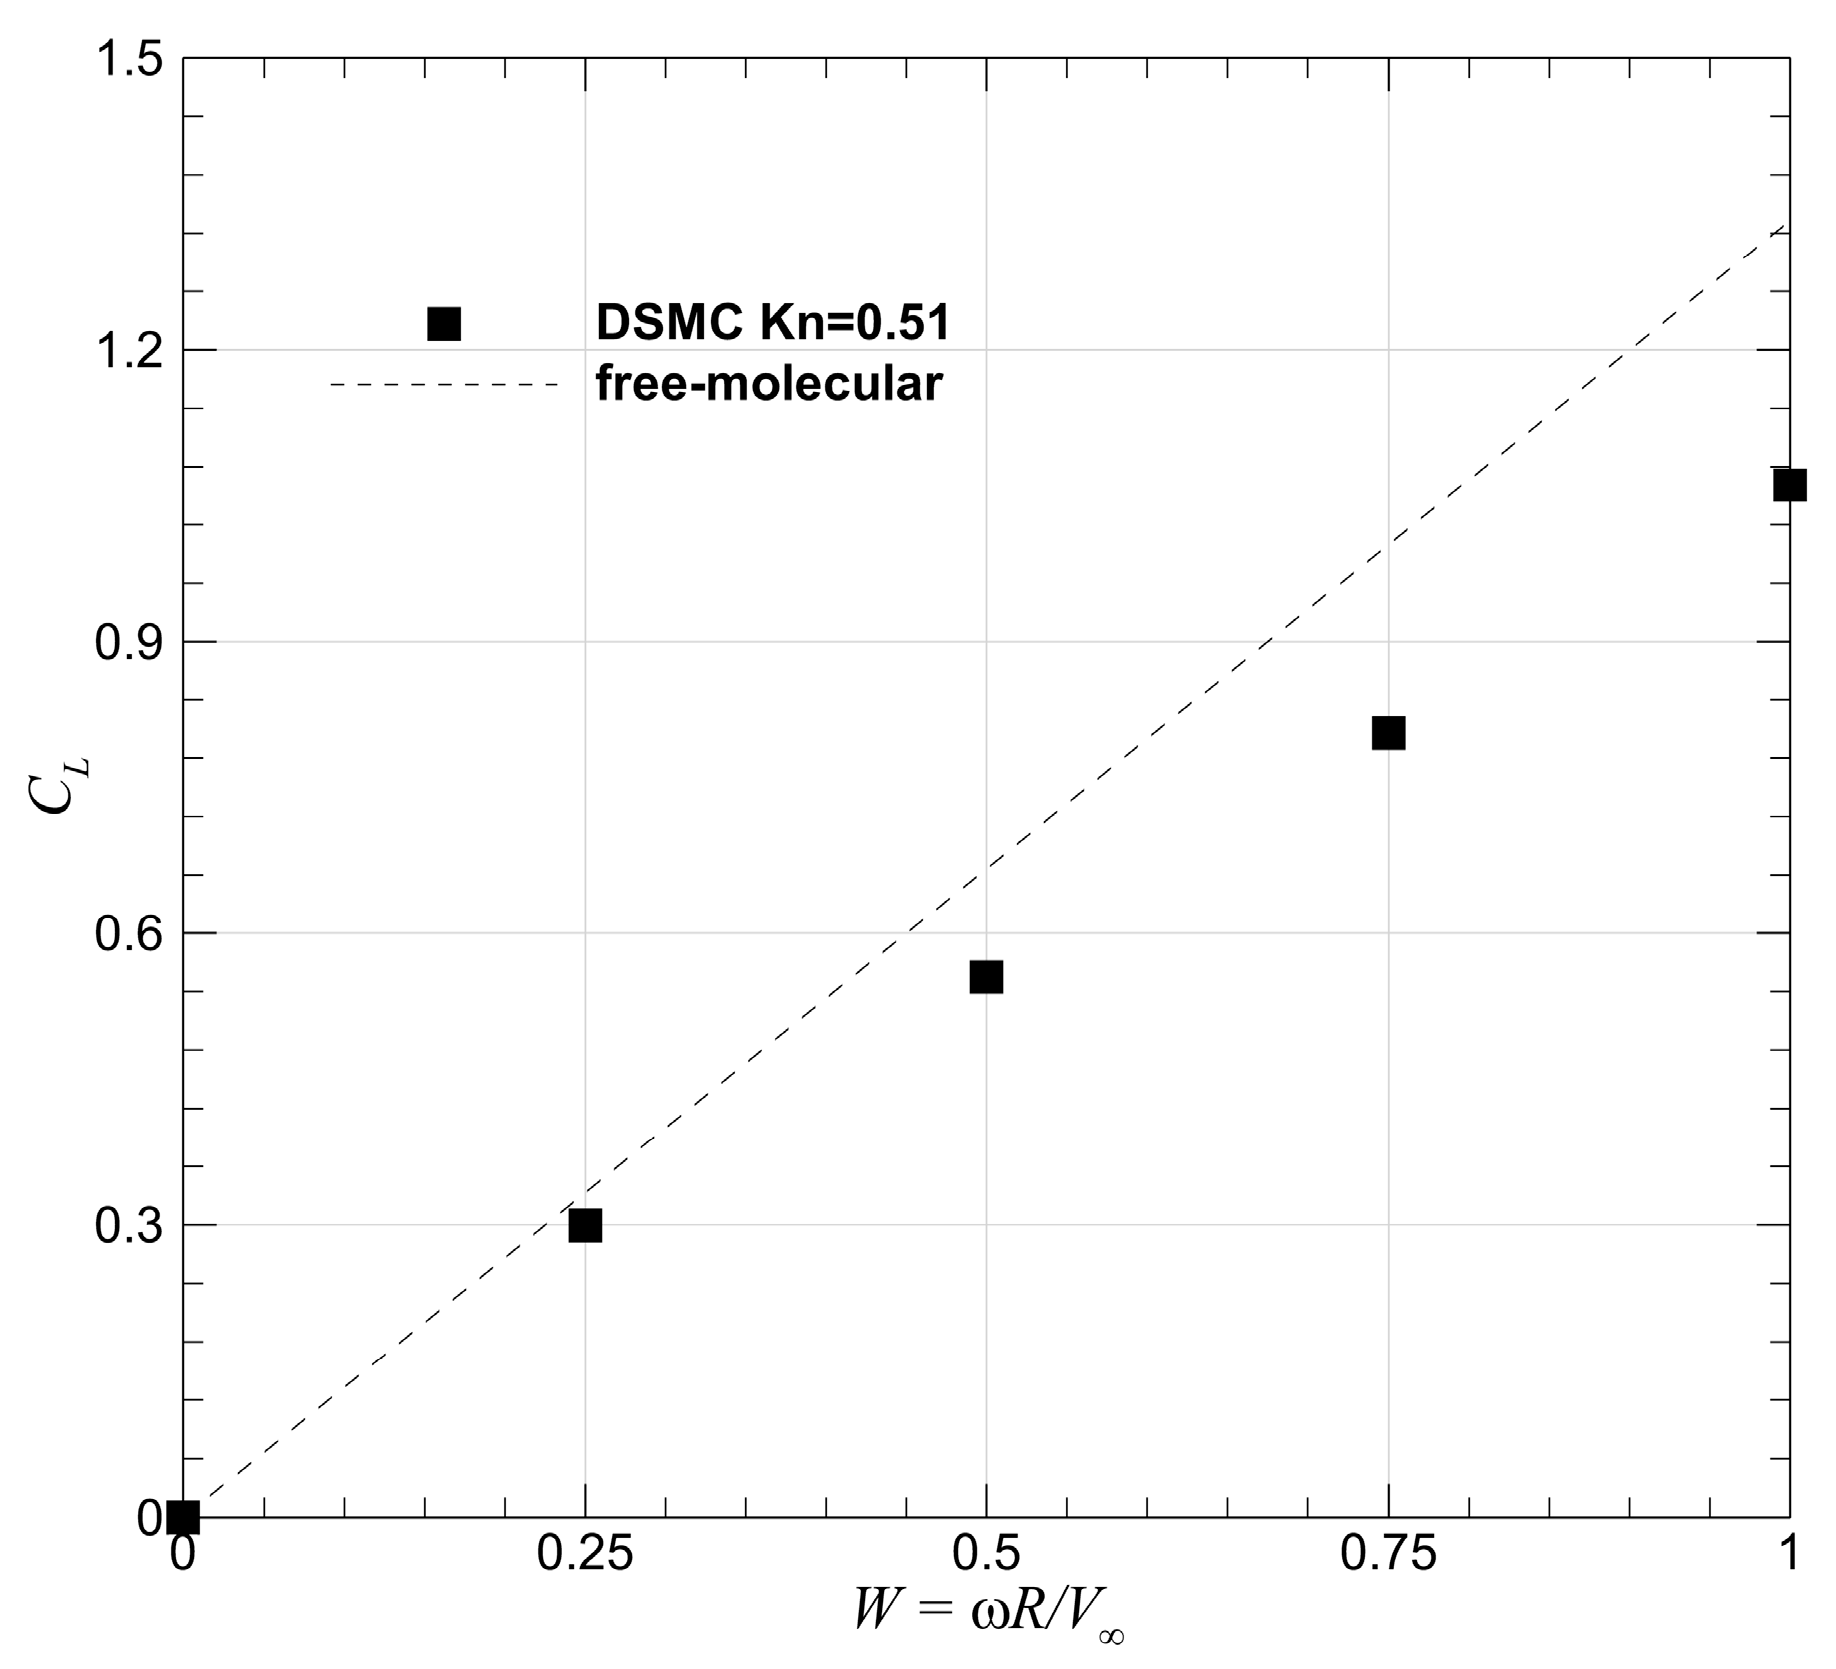
4.3.2. Lift
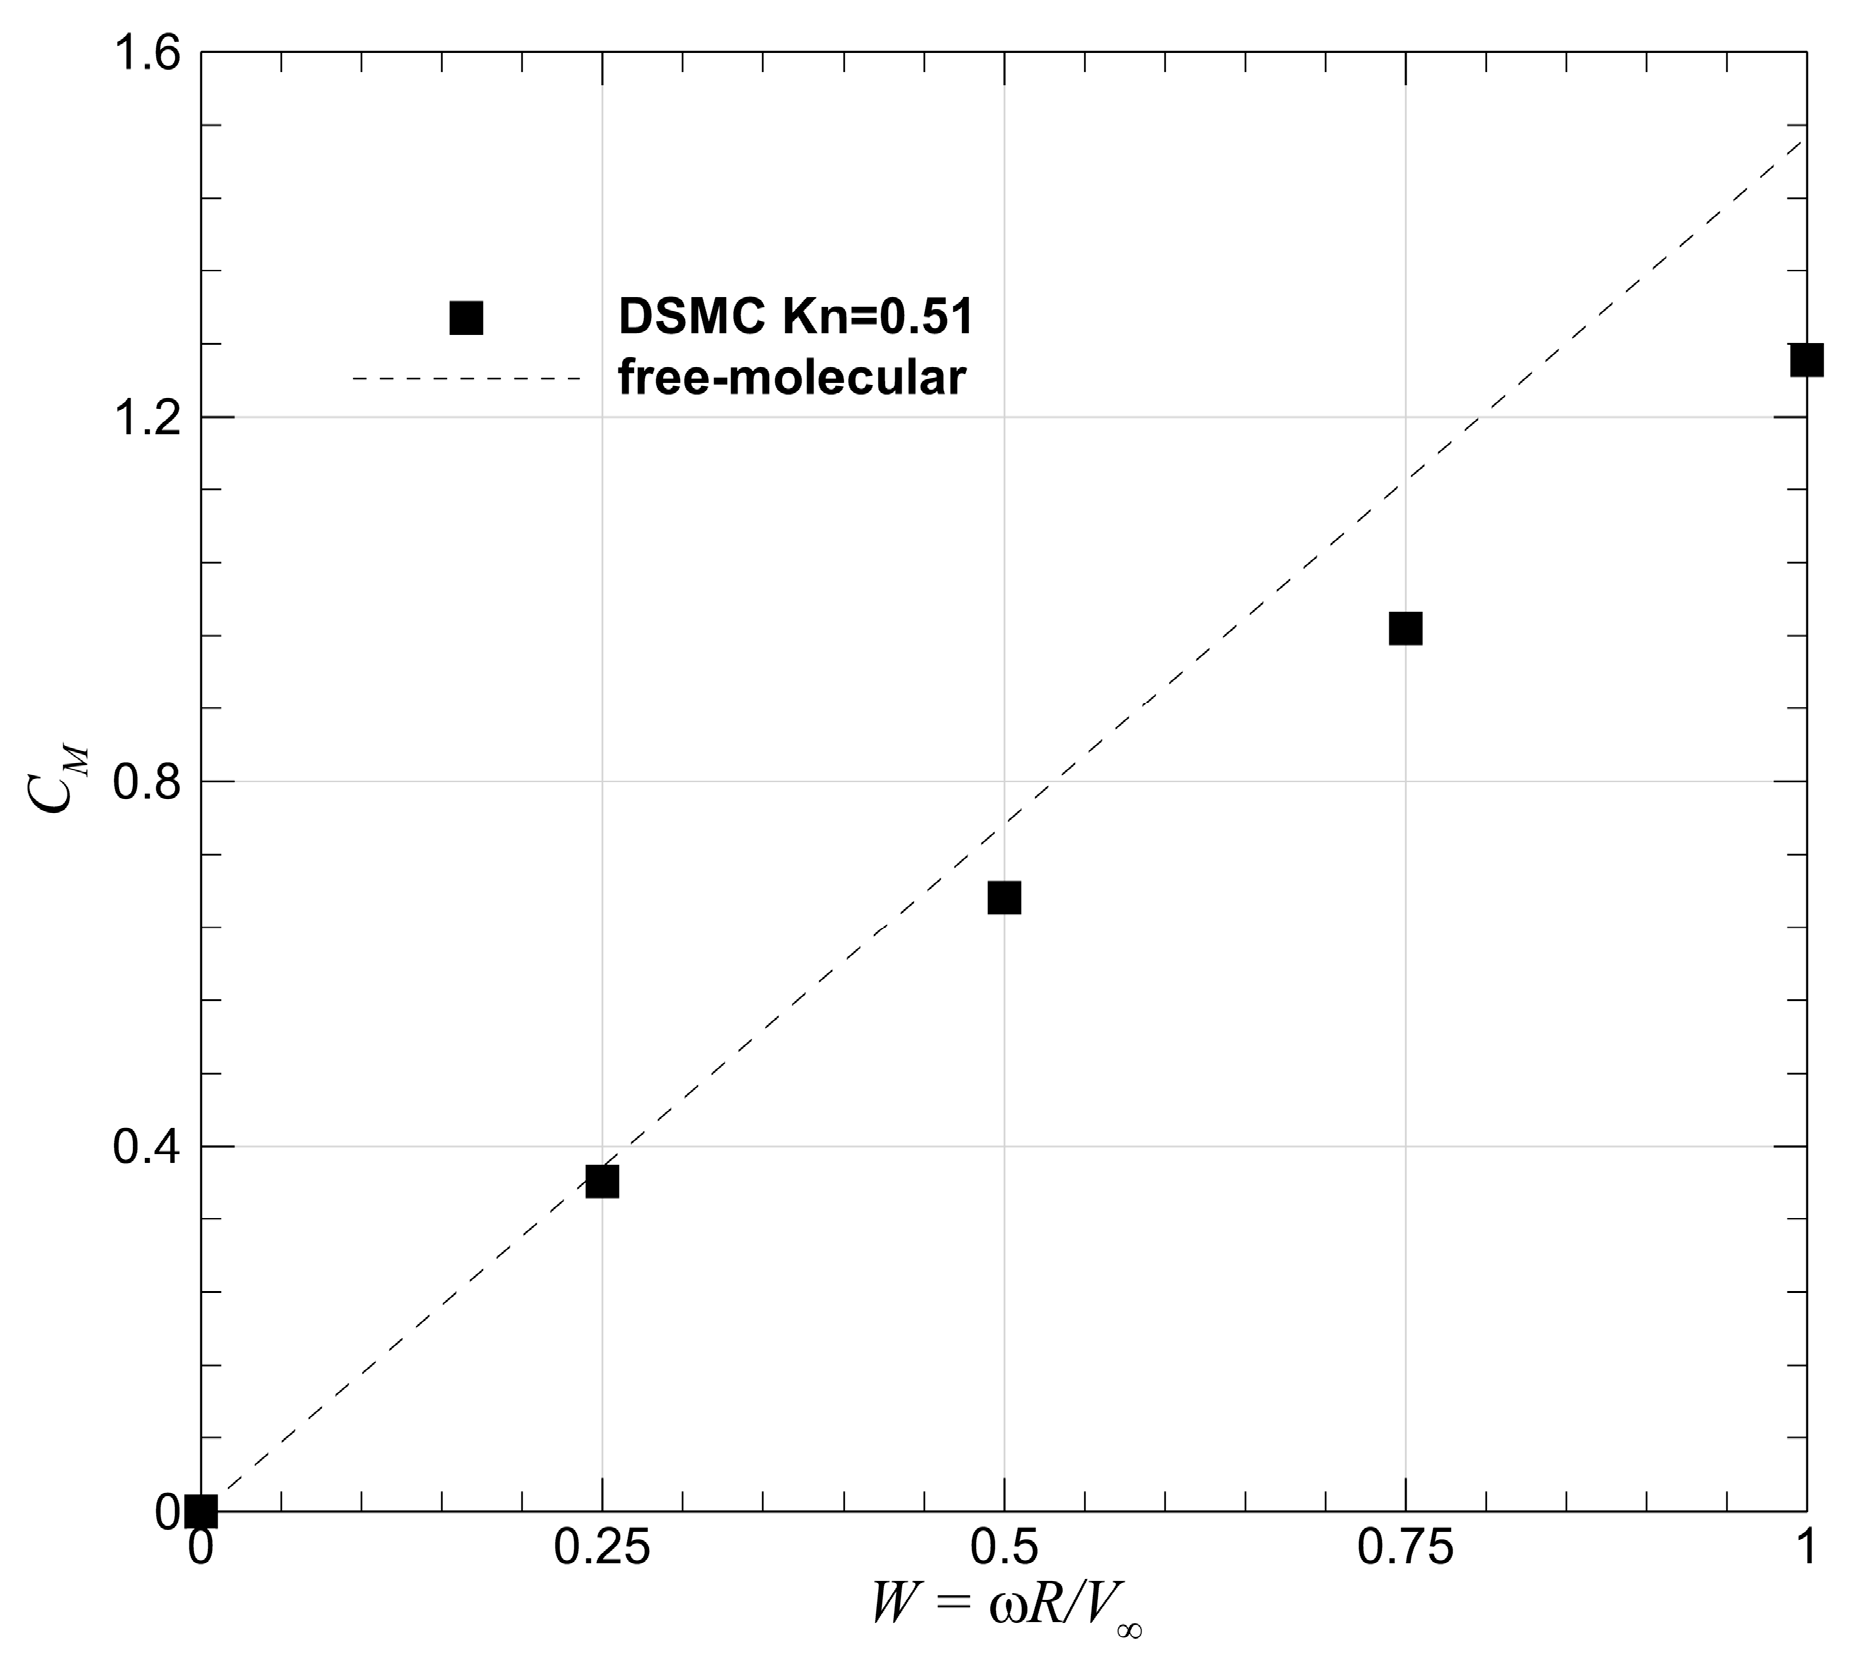
4.3.3. Moment
5. Conclusions
- (1)
- A lift, called the inverse Magnus force, is exerted on the rotating sphere. Its direction is opposite to that observed in the Magnus effect for continuum flows.
- (2)
- The rotation of the sphere leads to a distortion of the shock wave, an increase in the shock stand-off distance, and changes to other flow features, e.g., the position of the front stagnation point.
- (3)
- Velocity slip is very significant on the wall surface, and fascinating flow patterns can be formed on the sphere under different rotation rates.
- (4)
- The symmetry of the wall pressure distribution is not affected by the rotation of the sphere, and thus the pressure distribution makes no contribution to the formation of the inverse Magnus force.
- (5)
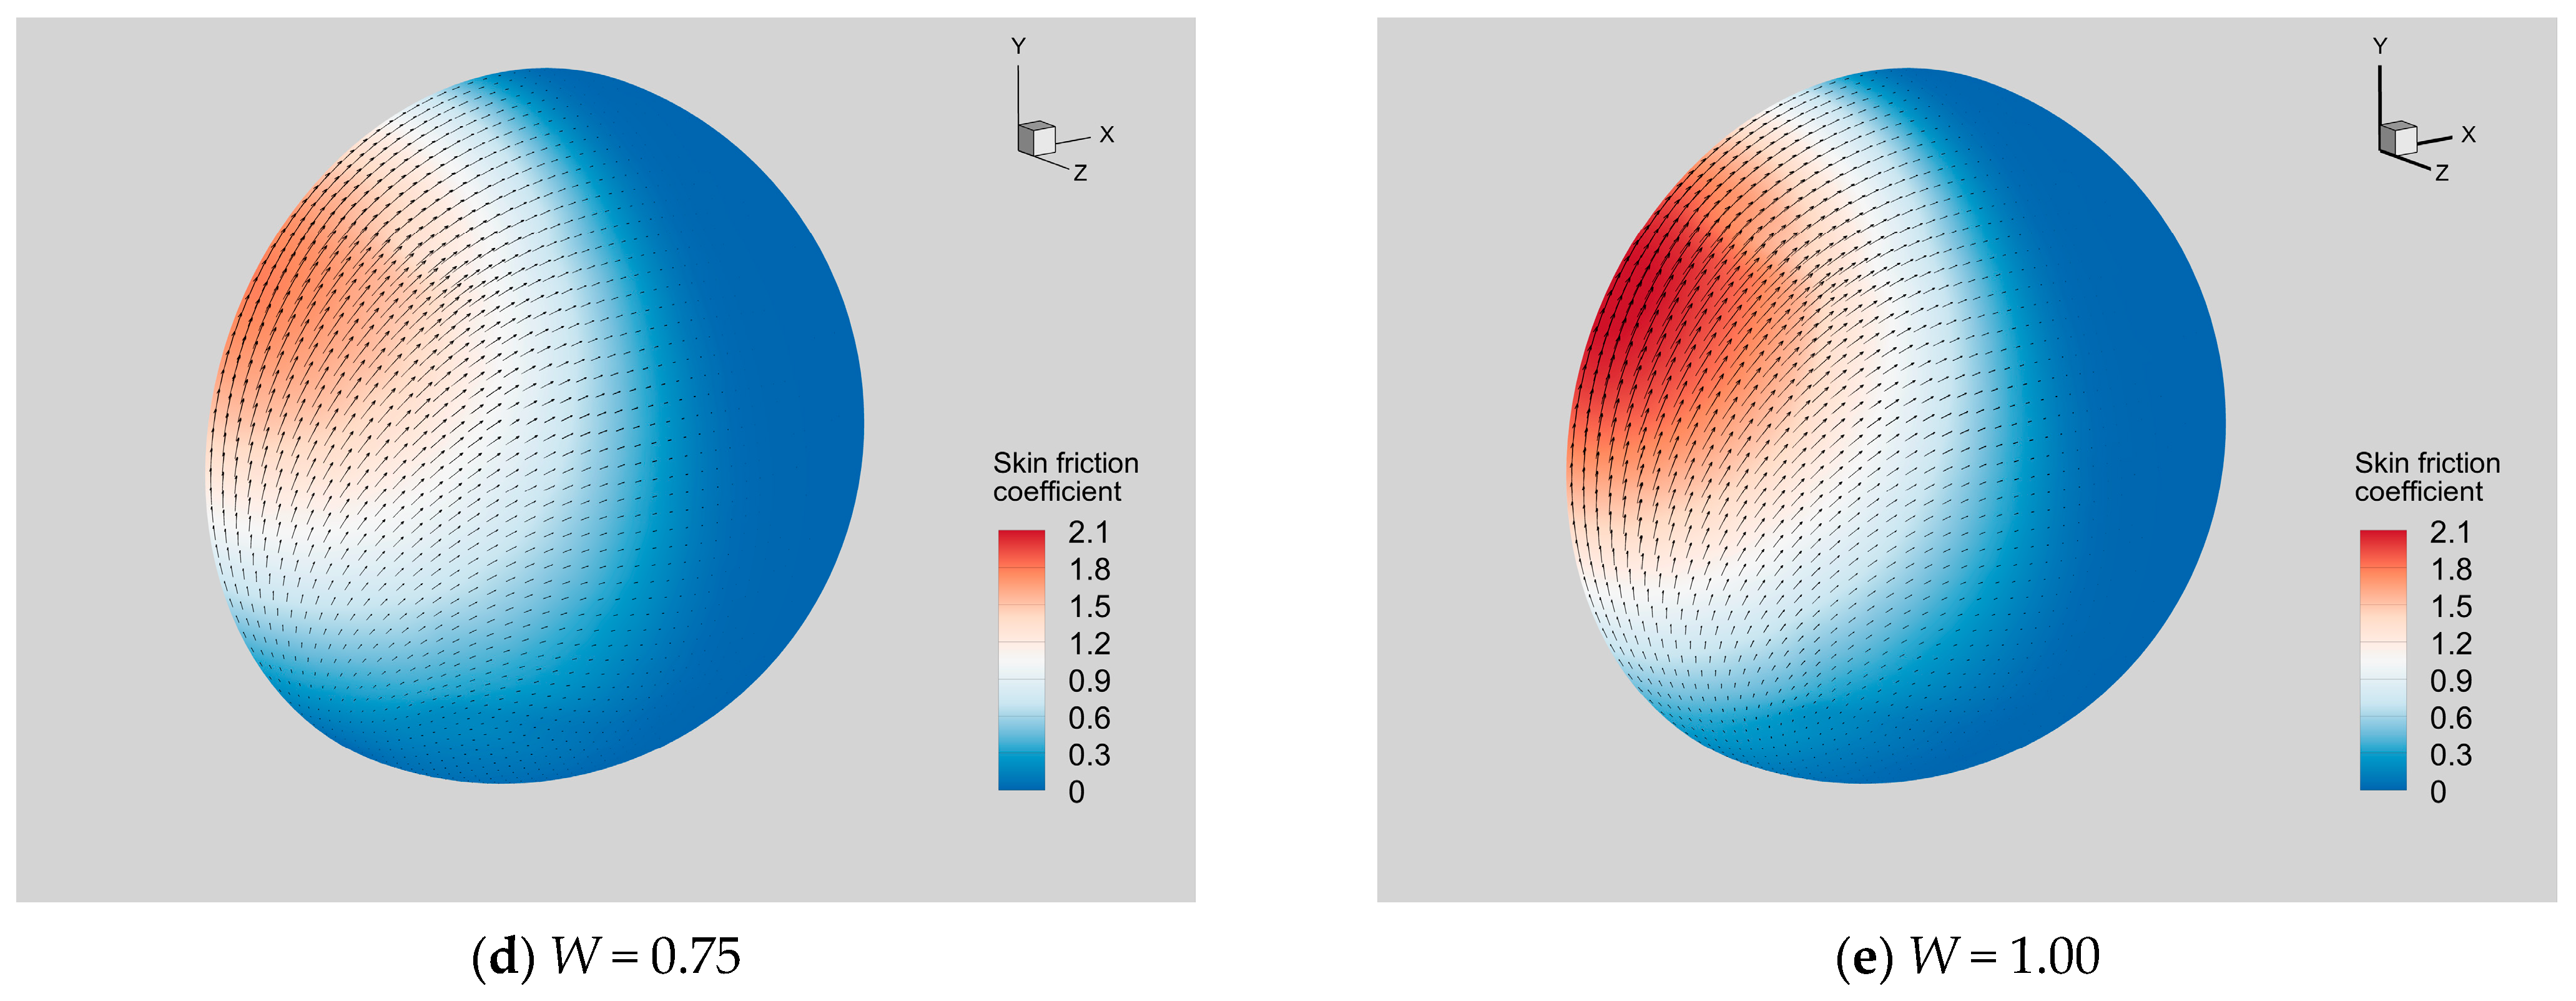
- The formation of the inverse Magnus force is attributed to skin friction, which is caused by the relative motion between the gas and the wall surface. The strong-friction region is on the upper half of the sphere’s windward side.
- (6)
- The microscopic mechanism of the inverse Magnus effect is the transfer of tangential momentum from the incident gas molecules to the windward surface of the rotating sphere.
- (7)
- As the rotation rate increases, the lift and the moment on the sphere increase in proportion to the rotation rate, while the drag remains almost unchanged. In addition, the aerodynamic heating on the sphere is greatly enhanced with the increase in rotation rate.
Author Contributions
Funding
Institutional Review Board Statement
Informed Consent Statement
Data Availability Statement
Acknowledgments
Conflicts of Interest
References
- Candler, G.V. Rate effects in hypersonic flows. Annu. Rev. Fluid. Mech. 2019, 51, 379–402. [Google Scholar] [CrossRef]
- Cao, S.; Hao, J.; Klioutchnikov, I.; Wen, C.-Y.; Olivier, H.; Heufer, K.A. Transition to turbulence in hypersonic flow over a compression ramp due to intrinsic instability. J. Fluid. Mech. 2022, 941, A8. [Google Scholar] [CrossRef]
- Guo, P.; Hao, J.; Wen, C.-Y. Interaction and breakdown induced by multiple optimal disturbances in hypersonic boundary layer. J. Fluid. Mech. 2023, 974, A50. [Google Scholar] [CrossRef]
- Hao, J. On the low-frequency unsteadiness in shock wave–turbulent boundary layer interactions. J. Fluid. Mech. 2023, 971, A28. [Google Scholar] [CrossRef]
- Liu, Q.; Baccarella, D.; Lee, T. Review of combustion stabilization for hypersonic airbreathing propulsion. Prog. Aerosp. Sci. 2020, 119, 100636. [Google Scholar] [CrossRef]
- Ivanov, M.S.; Gimelshein, S.F. Computational hypersonic rarefied flows. Annu. Rev. Fluid. Mech. 1998, 30, 469–505. [Google Scholar] [CrossRef]
- Schouler, M.; Prevereaud, Y.; Mieussens, L. Survey of flight and numerical data of hypersonic rarefied flows encountered in earth orbit and atmospheric reentry. Prog. Aerosp. Sci. 2020, 118, 100638. [Google Scholar] [CrossRef]
- Keerthi, A.; Geim, A.K.; Janardanan, A.; Rooney, A.P.; Esfandiar, A.; Hu, S.; Dar, S.A.; Grigorieva, I.V.; Haigh, S.J.; Wang, F.C.; et al. Ballistic molecular transport through two-dimensional channels. Nature 2018, 558, 420–424. [Google Scholar] [CrossRef]
- Pfeiffer, M.; Beyer, J.; Vaubaillon, J.; Matlovič, P.; Tóth, J.; Fasoulas, S.; Löhle, S. Numerical simulation of an iron meteoroid entering into Earth’s atmosphere using DSMC and a radiation solver with comparison to ground testing data. Icarus 2024, 407, 115768. [Google Scholar] [CrossRef]
- Cardona, V.; Joussot, R.; Lago, V. Shock/shock interferences in a supersonic rarefied flow: Experimental investigation. Exp. Fluids 2021, 62, 135. [Google Scholar] [CrossRef]
- Schwartzentruber, T.E.; Boyd, I.D. Progress and future prospects for particle-based simulation of hypersonic flow. Prog. Aerosp. Sci. 2015, 72, 66–79. [Google Scholar] [CrossRef]
- Swanson, W.M. The Magnus effect: A summary of investigations to date. J. Basic. Eng. 1961, 83, 461–470. [Google Scholar] [CrossRef]
- Seifert, J. A review of the Magnus effect in aeronautics. Prog. Aerosp. Sci. 2012, 55, 17–45. [Google Scholar] [CrossRef]
- Weidman, P.D.; Herczynski, A. On the inverse Magnus effect in free molecular flow. Phys. Fluids 2004, 16, 9–12. [Google Scholar] [CrossRef]
- John, B.; Gu, X.-J.; Barber, R.W.; Emerson, D.R. High-speed rarefied flow past a rotating cylinder: The inverse Magnus effect. AIAA J. 2016, 54, 1670–1681. [Google Scholar] [CrossRef]
- Shen, Q.; Huang, F.; Cheng, X.-L.; Jin, X.-H. On characteristics of upper atmosphere aerodynamics of flying vehicles. Phys. Gases 2021, 6, 1–9. [Google Scholar]
- Anderson, J.D. Fundamentals of Aerodynamics, 5th ed.; McGraw-Hill: New York, NY, USA, 2011; pp. 274–280. [Google Scholar]
- Wang, C.-T. Free molecular flow over a rotating sphere. AIAA J. 1972, 10, 713–714. [Google Scholar] [CrossRef]
- Borg, K.I.; Soderholm, L.H.; Essen, H. Force on a spinning sphere moving in a rarefied gas. Phys. Fluids 2003, 15, 736–741. [Google Scholar] [CrossRef]
- Bird, G.A. Molecular Gas Dynamics and the Direct Simulation of Gas Flows, 2nd ed.; Clarendon Press: Oxford, UK, 1994. [Google Scholar]
- Boyd, I.D. Computation of hypersonic flows using the direct simulation Monte Carlo method. J. Spacecr. Rocket. 2015, 52, 38–53. [Google Scholar] [CrossRef]
- John, B.; Gu, X.-J.; Emerson, D.R. Computation of aerodynamic forces under nonequilibrium conditions: Flow past a spinning cylinder. AIAA J. 2018, 56, 4219–4224. [Google Scholar] [CrossRef]
- Jiang, Y.; Gao, Z.; Jiang, C.; Lee, C.-H. Hypersonic aeroheating characteristics of leading edges with different nose radii. J. Thermophys. Heat. Transf. 2017, 31, 538–548. [Google Scholar] [CrossRef]
- Wang, J.; Chen, L.; Jiang, Y.; Lee, C.-H. Particle simulation of an anode-layer Hall thruster plume using an anisotropic scattering model. Acta Astronaut. 2020, 175, 19–31. [Google Scholar] [CrossRef]
- Liu, W.; Zhang, J.; Jiang, Y.; Chen, L.; Lee, C.-H. DSMC study of hypersonic rarefied flow using the Cercignani–Lampis–Lord model and a molecular-dynamics-based scattering database. Phys. Fluids 2021, 33, 072003. [Google Scholar] [CrossRef]
- Kremer, G.M. An Introduction to the Boltzmann Equation and Transport Processes in Gases, 1st ed.; Springer: Berlin, Germany, 2010. [Google Scholar]
- Borgnakke, C.; Larsen, P.S. Statistical collision model for Monte Carlo simulation of polyatomic gas mixture. J. Comput. Phys. 1975, 18, 405–420. [Google Scholar] [CrossRef]
- Millikan, R.C.; White, D.R. Systematics of vibrational relaxation. J. Chem. Phys. 1963, 39, 3209–3213. [Google Scholar] [CrossRef]
- Holden, M.S.; Wadhams, T.P. A database of aerothermal measurements in hypersonic flow in “building block” experiments for CFD validation. In Proceedings of the 41st AIAA Aerospace Sciences Meeting and Exhibit, Reno, NV, USA, 6–9 January 2003. [Google Scholar]
- Moss, J.N.; Bird, G.A. Direct simulation Monte Carlo simulations of hypersonic flows with shock interactions. AIAA J. 2005, 43, 2565–2573. [Google Scholar] [CrossRef]
- Bird, G.A. The DSMC Method, 1st ed.; CreateSpace Independent Publishing Platform: San Bernardino, CA, USA, 2013. [Google Scholar]
- Allègre, J.; Bisch, D.; Lengrand, J.C. Experimental rarefied density flowfield at hypersonic conditions over 70-degree blunted cone. J. Spacecr. Rocket. 1997, 34, 714–718. [Google Scholar] [CrossRef]
- Allègre, J.; Bisch, D.; Lengrand, J.C. Experimental rarefied heat transfer at hypersonic conditions over 70-degree blunted cone. J. Spacecr. Rocket. 1997, 34, 724–728. [Google Scholar] [CrossRef]


| Flow Conditions | Values |
|---|---|
| number density n∞ | 1.189 × 10¹⁹ m−3 |
| freestream velocity V∞ | 2800 m/s |
| freestream temperature T∞ | 195 K |
| wall temperature Tw | 300 K |
| diameter of sphere D | 0.2 m |
| accommodation coefficient α | 1 |
| freestream Mach number M∞ | 10 |
| Knudsen number Kn∞ | 0.51 |
| rotation parameter W | 0.00, 0.25, 0.50, 0.75, 1.00 |
| Computational Parameters | Standard | Refined |
|---|---|---|
| number of cells | 108,000 | 240,000 |
| number of particles per cell | 100 | 100 |
| the minimum cell size | 4 mm | 2 mm |
| time step size | 4 × 10⁻⁶ s | 2 × 10⁻⁶ s |
Disclaimer/Publisher’s Note: The statements, opinions and data contained in all publications are solely those of the individual author(s) and contributor(s) and not of MDPI and/or the editor(s). MDPI and/or the editor(s) disclaim responsibility for any injury to people or property resulting from any ideas, methods, instructions or products referred to in the content. |
© 2024 by the authors. Licensee MDPI, Basel, Switzerland. This article is an open access article distributed under the terms and conditions of the Creative Commons Attribution (CC BY) license (https://creativecommons.org/licenses/by/4.0/).
Share and Cite
Jiang, Y.; Ling, Y.; Zhang, S. Investigation of the Inverse Magnus Effect on a Rotating Sphere in Hypersonic Rarefied Flow. Appl. Sci. 2024, 14, 1042. https://doi.org/10.3390/app14031042
Jiang Y, Ling Y, Zhang S. Investigation of the Inverse Magnus Effect on a Rotating Sphere in Hypersonic Rarefied Flow. Applied Sciences. 2024; 14(3):1042. https://doi.org/10.3390/app14031042
Chicago/Turabian StyleJiang, Yazhong, Yuxing Ling, and Shikang Zhang. 2024. "Investigation of the Inverse Magnus Effect on a Rotating Sphere in Hypersonic Rarefied Flow" Applied Sciences 14, no. 3: 1042. https://doi.org/10.3390/app14031042