Article

An Experimental Investigation of Various Control Systems for an Archimedes Screw Turbine in a Micro-Hydropower Plant

by
Francisco González-González
1,
Arsenio Barbón
1,
Luis Bayón
2,* and
Ramy Georgious
1
1
Department of Electrical Engineering, University of Oviedo, 33003 Oviedo, Spain
2
Department of Mathematics, University of Oviedo, 33003 Oviedo, Spain
*
Author to whom correspondence should be addressed.
Appl. Sci. 2024, 14(2), 512; https://doi.org/10.3390/app14020512
Submission received: 30 November 2023 / Revised: 26 December 2023 / Accepted: 3 January 2024 / Published: 6 January 2024
(This article belongs to the Special Issue Innovative Power Electronic Technologies)

Abstract

:
The control system for a micro-hydropower plant using an Archimedes screw turbine is the focus of this work. Three control systems were implemented based on a Barreda micro-hydropower plant (Spain) currently in operation: an optimal water level control ( O W L C ) system, a maximum power point monitoring ( M P P T ) system, and a water level control ( W L C ) system. The comparison was made using several assessment indicators: electricity production, micro-hydropower plant efficiency, and gearbox fatigue. The electricity production is similar in the O W L C and M P P T systems (energy gain + 0.5 % ) and significantly lower in the W L C system (energy gain 12 % ). The efficiency of the micro-hydro plant is similar in the O W L C and M P P T systems (average efficiency gain + 0.9 % ) and significantly lower in the W L C system (average efficiency gain 15 % ). The mechanical stress on the gearbox is similar in the O W L C and W L C systems and significantly higher in the M P P T system. It can be concluded that the O W L C system performs better as concerns the three assessment indicators used, followed by the M P P T system. The W L C system is not recommended for use, due to its low electricity production and low efficiency of the micro-hydropower plant.

1. Introduction

The greatest primary energy production in the European Union ( E U ) in 2022 will come from fossil fuels, at around 69.65 % , followed by renewable energy production, which also includes hydroelectric power plants, at around 21.34 % [1]. These statistics on primary energy use run counter to the decarbonisation strategies put in place by the E U for 2030, which can be summarised by the targets set out in the Winter Package [2]: (i) a reduction in greenhouse gas emissions ( 40 % ), (ii) increasing the share of renewable energy in the final energy mix ( 32 % ), and (iii) increasing energy efficiency ( 32.5 % ). Existing renewable energy generation technologies must be improved [3] and new renewable energy technologies must be developed in order to achieve these goals.
Hydropower has become a vitally important element in the transformation of the global energy system [4]. In 2021, the World Bank [5] identified hydropower as a key source of fossil fuel substitution. In accordance with their installed capacity, hydropower plants can be classified as large-scale, medium-scale, and small installed capacity hydropower projects [6,7]. Small hydropower can be used in conditions where large-scale and medium-scale hydropower cannot be deployed, enabling the use of sustainable resources that would otherwise be unusable. Small installed capacity hydropower projects are classified into small, mini, micro, and pico hydropower plants [6,7]. This classification depends on the country [8]. A hydropower plant with an installed capacity of up to 10 (MW) is considered as small; up to 2 (MW), mini; up to 100 (kW), micro; and from a few hundred watts up to 5 (kW), pico [6,9]. According to [8], the global installed capacity of small hydropower plants of less than 10 (MW) was estimated in 2022 at approximately 79.0 (GW), with an estimated potential of 221.7 (GW). Statistics show that there are more than 20,000 small hydropower turbines installed in Europe, in addition to ongoing projects [8]. A small hydropower plant is a renewable energy source which a beneficial impact on electricity grids, as it can provide continuous production for a predictable period of time. In the E U , small hydropower ( S H P ) plants have the potential to contribute to decarbonisation strategies [10], but the development of efficient and adoptable hydropower technologies needs to be improved.
Small hydropower plants can be categorised into different types based on the water head. These include low-head ( L H ) hydropower, which refers to heads below 5 (m); very-low-head ( V L H ) turbines, with heads below 2.5 (m); and ultra-low-head ( U L H ) turbines, with heads below 1.5 (m) [11,12]. A considerable number of potential hydropower locations where traditional turbines are not cost effective or environmentally viable reflect very-low-head or ultra-low head conditions. A project co-funded by the European Union, called the RESTOR Hydro project [13], estimated that more than 350,000 micro-mini hydro sites may have existed in Europe at one time or another. One of the main outputs of this project was a map showing 65,000 data points or potential micro-mini hydropower plants [13].
The Archimedes screw can certainly be considered one of the most successful innovations in the field of small hydropower plants introduced in the last two decades, as it offers significant advantages over classical axial turbines [14]. These advantages are both technical and environmental. From a technical point of view, head, flow rate, and efficiency are parameters that can be used to compare the Archimedes screw with other hydraulic turbines. Table 1 shows the operating range of hydro turbines, from the point of view of the flow rate and head [15].
According to Table 1, for low-head and very-low-head, besides the Archimedes screw, only the Kaplan turbine [16] can operate in these types of installations. In ultra-low-head installations, the Archimedes screw is the only hydro turbine that can operate under these conditions. For small water flow rates (see Table 1), the Archimedes screw can operate at high efficiency.
In very-low-head or ultra-low head conditions, the Archimedes screw turbine ( A S T ) has proven to be a suitable solution for this particular scenario, demonstrating satisfactory performance [17]. Williamson et al. [17] presented a study comparing several micro hydropower turbines installed at sites characterised by low head and low flow. The results showed that A S T s remain very efficient at sites with a head of less than 5 (m), even as the available head approaches zero [17]. Another study also showed that A S T s work best at sites with less than 10 (m) head and 10 (m 3 /s) of the water flow rate [18]. Therefore, its high efficiency (80–90%) is the main advantage [19].
Environmental authorities have acknowledged that this technology is fish-friendly, meaning it is environmentally much better than other turbines [20]. However, there are also disadvantages, such as its rather limited regulation capabilities and the high gear ratio. The introduction of frequency converters in this technology allows for rotation speed control, which prevents these disadvantages.
An Archimedes screw is inserted around a cylinder of a certain diameter, which works like an axis. The helical planes (blades) are placed in this cylinder to form the screw. The cylinder is extended by a shaft of a smaller diameter to support it on bearings. The gearbox and the electric generator are placed on the upper end of the shaft. Direct coupling to an electric generator is not possible due to the low speed of an Archimedean screw. Therefore, a speed increaser must be used to connect an Archimedes screw to an electric generator. A gearbox is normally used for this purpose. Figure 1 shows a diagram of a typical Archimedean screw turbine system.
The parameters of an Archimedean screw can be divided into external and internal [21]. The external parameters are [21] the radius of the screw’s outer cylinder ( R o ), the total length of the screw (L), and the angle of the screw turbine ( θ ). The internal parameters are [21] the radius of the screw’s inner cylinder ( R i ), the pitch (or period) of one blade (p), and the number of blades (N). These parameters are related to each other and are heavily dependent on the available installation conditions for the Archimedean screw, such as the length, inclination, and riverwater flow.
The Archimedean screw has been the subject of numerous studies. Most researchers focus on analysing the influence of its parameters on the power and performance of an Archimedes screw turbine. Some of these are presented below:
(i)
Studies related to the parameters affecting the performance of an A S T . Dellinger et al. [22] studied the influence of the tilt angle and the number of blades of an Archimedes screw turbine on the power output and performance using computational fluid dynamics simulation and laboratory tests. The results showed good agreement between the model and experiment, with relative errors in hydraulic efficiency of less than 2 % in optimal cases. Shahverdi et al. [23] evaluated the performance of A S T s at different rotational speeds, flow rates, and tilt angles using computational fluid dynamics. Dedic et al. [24] experimentally analysed the influence of variations in tilt angle, water flow, and rotational speed on the performance of an A S T . Ref. [23] investigated the effect of several parameters (the number of blades, the tilt angle, the pitch angle, the screw’s outer diameter, the rotation speed, the head, and the flow rate) on the efficiency of A S T s , using computational fluid dynamics.
(ii)
Studies related to the A S T control system. There are few studies that analyse the control of Archimedes screws. Lavrič et al. [25] developed several simulation models for small hydropower plant system using constant speed and variable speed generator operation modes, as well as a combination of equipment models based on manufacturer data, in situ measurements, and published data. The control system used is not mentioned in this work. Notwithstanding, there are no studies dedicated to the analysis of control systems in actual operating scenarios. To the best of the authors’ knowledge, no research has been performed concerning the energy analysis of A S T s operating under different control modes.
The aim of the work presented in this paper is the experimental study of three control systems for an Archimedes screw turbine: (i) a water level control ( W L C ) system, (ii) the maximum power point tracking ( M P P T ) method, and (iii) an optimal water level control ( O W L C ) system. With a W L C system, a classic P I D controller is used to set the height of the water level chosen at random. The maximum power point search method is used with an M P P T system, and the O W L C system is based on the successive application of the two previous systems. The three control systems have been evaluated at the same micro-hydropower plant. The main contributions of this work are as follows:
(i)
An analysis to determine the control system that maximises electricity production;
(ii)
An analysis to determine the control system that maximises the efficiency of the micro-hydropower plant;
(iii)
An analysis to determine the control system that reduces mechanical stress on the gearbox;
(iv)
The actual micro-hydropower plant measurements. The measurements collected in this study are derived from a micro-hydropower plant. Unlike previous studies that primarily focused on examining test models, this research investigates actual operational scenarios. While studying test models offers valuable insights into system performance, certain phenomena specific to real-world cases may not be captured through such research.
This paper is structured as follows: Section 2 provides the overall structure of the control systems. Section 3 defines the specifications for the case study. The data acquisition system, the measurement devices and the accuracy of measurements are provided in Section 4. The assessment parameters are presented in Section 5. The results are presented in Section 6. Finally, Section 7 summarises the main contributions and conclusions of the paper.

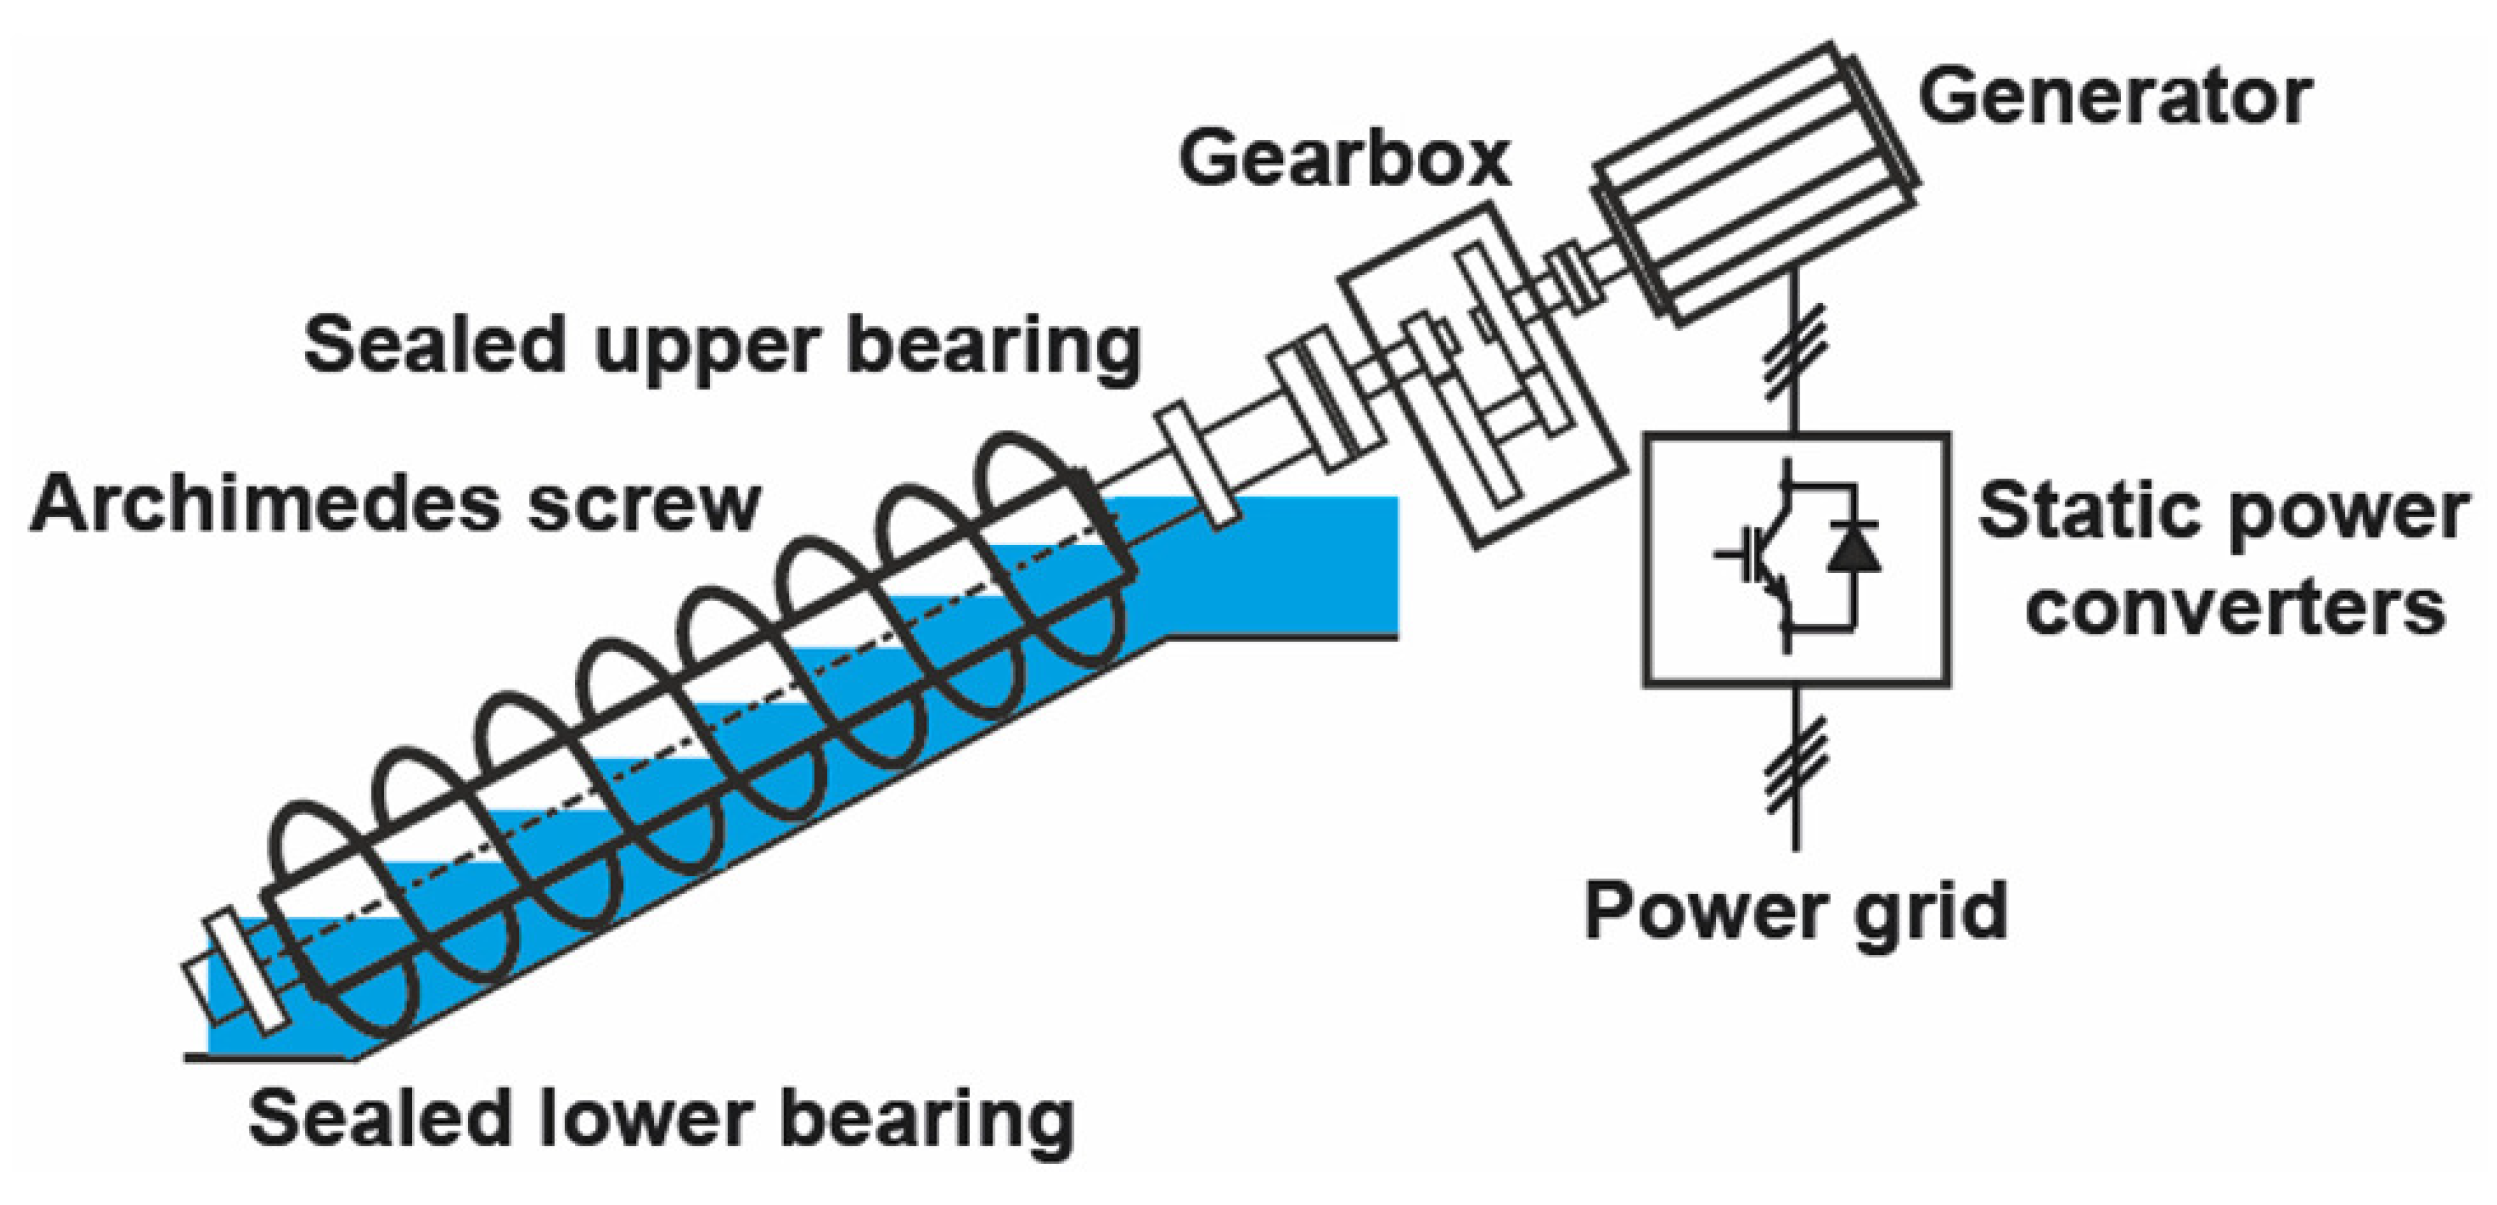
2. The Overall Structure of the Control System

Operating at constant speed, this type of system requires a minimum water flow rate as low as 30 % of the nominal flow rate [26], which means such a system cannot be operated during a rainy season. This disadvantage is solved via operation in a variable speed mode.
The best mode of operation for A S T s is variable speed [27]. The control system works on the rotational speed of the A S T , increasing or decreasing its speed depending on the available flow rate. The other option is for the turbine to operate at a fixed speed and to vary the flow rate through an automated airlock.
Variable speed operation of an A S T offers several benefits [27]: (i) it is quieter; (ii) it is “backlash free”; (iii) it reduces mechanical stress and therefore extends the lifetime of the gearbox; (iv) it reduces energy consumption with dry weather flows when the A S T must continue operating; and (v) it reduces load losses and therefore improves the overall efficiency of the system.
A micro-hydropower plant mainly includes an Archimedes screw turbine ( A S T ), a gearbox, a squirrel-cage asynchronous generator ( S C A G ), and a back-to-back dual P W M converter. Figure 2 shows the control structure of the system. This structure includes two parts: the generator-side control and the grid-side control system.
The mission of the gearbox in this system is to convert the slow, high-torque rotation of the A S T into a much faster rotation of the S C A G . The gearbox has been identified as a sensitive part of the system, as it gives rise to a multitude of failures [28].
A C electrical generators can be classified into synchronous and asynchronous generators. In turn, asynchronous electrical generators can be classified into squirrel-cage machines and wound rotor machines. Asynchronous wound rotor generators are used with wind power plants. On the other hand, squirrel-cage asynchronous generators are used with micro-hydropower plants. Squirrel-cage asynchronous generators are often used with micro-hydropower plants given their low cost, low maintenance, high operational reliability, and high resistance to external environmental factors.
A back-to-back dual P W M converter is comprised of a rectifier, an inverter, and a capacitor between both (see Figure 2). The rectifier and the inverter are made up of I G B T and these are controlled via space vector pulse width modulation ( S V P W M ). Back-to-back dual P W M converters separate the generator power transmission process (generator-side control system) and the grid connection process (grid-side control system). The two are connected via a high voltage D C bus to ensure a constant frequency in the grid connection process while the generator operation mode is variable speed. These two control systems operate independently, but are closely linked.
A generator-side control system is comprised of an A S T , a gearbox, a squirrel-cage asynchronous generator, an A C / D C converter, a P L C , and a speed sensor. With a generator-side control system, the A S T is coaxially connected to the gearbox input to provide torque, whereas the gearbox output is coaxially connected to the S C A G to provide torque. The S C A G produces three-phase A C power. This three-phase A C power is converted to D C power via the S V P W M converter. Control in a generator-side control system comes from the speed of the A S T . This control system adjusts the S C A G speed in real time to track the maximum power output point of the A S T and transfers the generated power to the D C bus with maximum efficiency.
A grid-side control system is comprised of a D C -link bus, a D C / A C converter, an L C L filter, and the power grid. With a grid-side control system, the D C bus voltage is stabilised, and the D C power is converted into three-phase A C power and then integrated into the grid. Control in a grid-side control system is exercised by the D C bus voltage. This control system is responsible for (i) controlling the D C bus voltage, (ii) detecting the power grid phase, and (iii) adopting the S V P W M algorithm to perform grid-connected power generation functions.
A programmable logic controller ( P L C ) is an industrial computer used to implement the control system.

2.1. Control Methods

The principle of operation of this turbine is to convert the gravitational energy of the water passing through the Archimedes screw into mechanical energy. This extractable mechanical power can be determined by the equation [29]:
P m = η t · P h = η t · ρ · g · h · q
where P m is the mechanical power (W), η t is the A S T efficiency (%), P h is the available hydraulic power (W), ρ is the density of water (kg/m 3 ), g is the acceleration due to gravity (m/s 2 ), h a is the available head (m), and q is the flow rate (m 3 /s). Equation (1) can be expressed as
P m = k · h · q
Therefore, the objective of the control system is to maximise the product h · q . For this purpose, the speed of the electric generator will be controlled, by increasing or decreasing this speed so that the product h · q is maximum.
Three control systems will be analysed in this paper to determine the energy produced and the operational safety: water level control, maximum power point tracking method, and optimal water level control. All three control systems are designed with the objective of obtaining the maximum instantaneous power output from the flow rate available at the given time.

2.1.1. Water Level Control (WLC)

This control system is based on the proportional-integral-derivative ( P I D ) control of the water level. As indicated by its name, a P I D algorithm consists of three basic control modes: proportional, integral, and derivative. A diagram of a water level control system is shown in Figure 3. The P I D controller has been implemented in a P L C , with the output of the controller being the reference speed for the power converter driving the generator.
This control system acts on only one parameter of Equation (2), the head (h). Therefore, this control system does not ensure that the mechanical power of Equation (2) is maximised. The control system will regulate the speed of the electric generator so that the preset head will remain constant. Therefore, once the water level is set, the control system maintains it faithfully. Unfortunately, the choice of this water level does not coincide with the optimum water level. Therefore, the power output is not the maximum.
This control system receives the set point water level from two ultrasonic devices that measure the water levels upstream and downstream of the A S T . Therefore, the correct installation of these devices is also a factor to be taken into account.

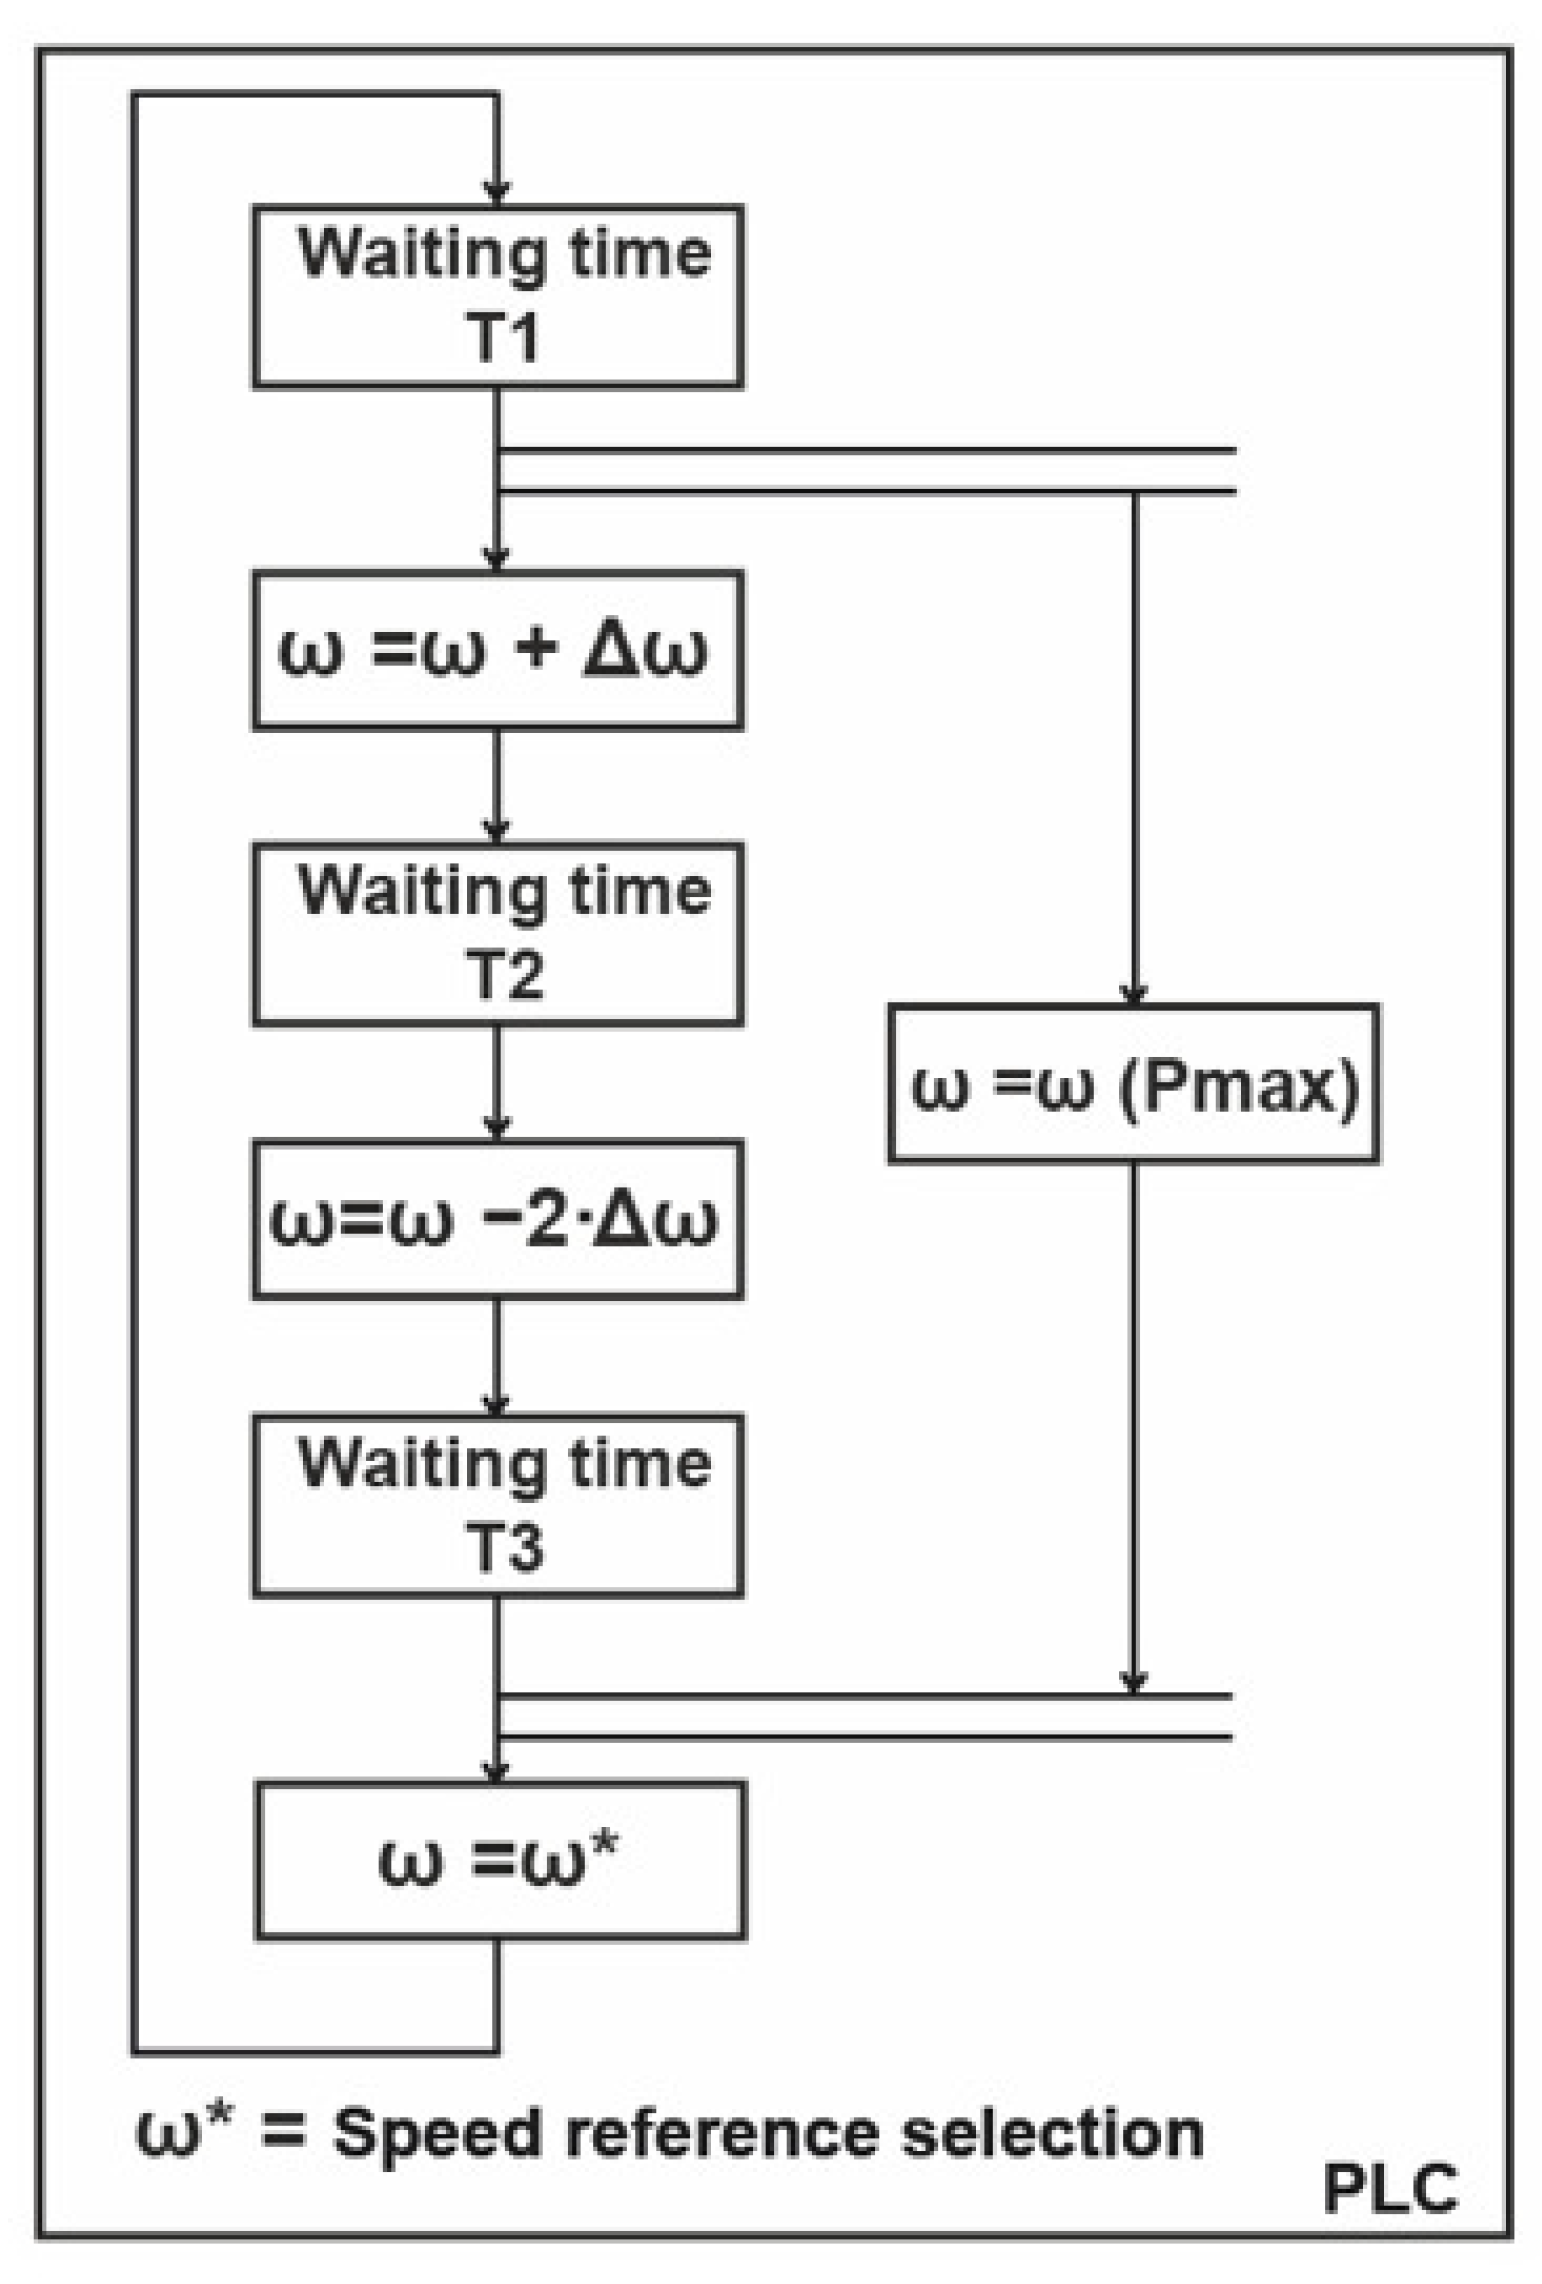
2.1.2. A Maximum Power Point Tracking (MPPT) Method

Maximum power point tracking ( M P P T ) methods are widely used by renewable technologies to improve their energy efficiency. Examples include photovoltaic systems [30], thermoelectric generators [31], and wind turbines [32]. The most commonly used M P P T method is the Perturb & Observe ( P & O ) method [33]. The principle of operation is based on disturbing, accelerating, or decelerating the rotational speed of an A S T and analysing the change in power output, measured at the converter. If the power increases, the perturbation is maintained and the procedure continues. Otherwise, the disturbance is reversed [34]. There are always variations in the M P P with this process. There are two main advantages to this method: simplicity and ease of application. Due to the principle of operation, the disadvantages are the production of steady-state oscillation and slow dynamic performance during maximum power point tracking.
The M P P T method acts on the product of the two parameters of Equation (2): the head (h) and the flow rate (q). Therefore, this control system ensures that the mechanical power of Equation (2) is maximised. For this purpose, the speed of the electrical generator shall be increased or decreased.
An algorithm is used to find the drive speed that leads to maximum power generation. This algorithm is implemented by Codesys V3.5 software in the actual power converter driving the generator. Figure 4 shows how an M P T T algorithm can be implemented.

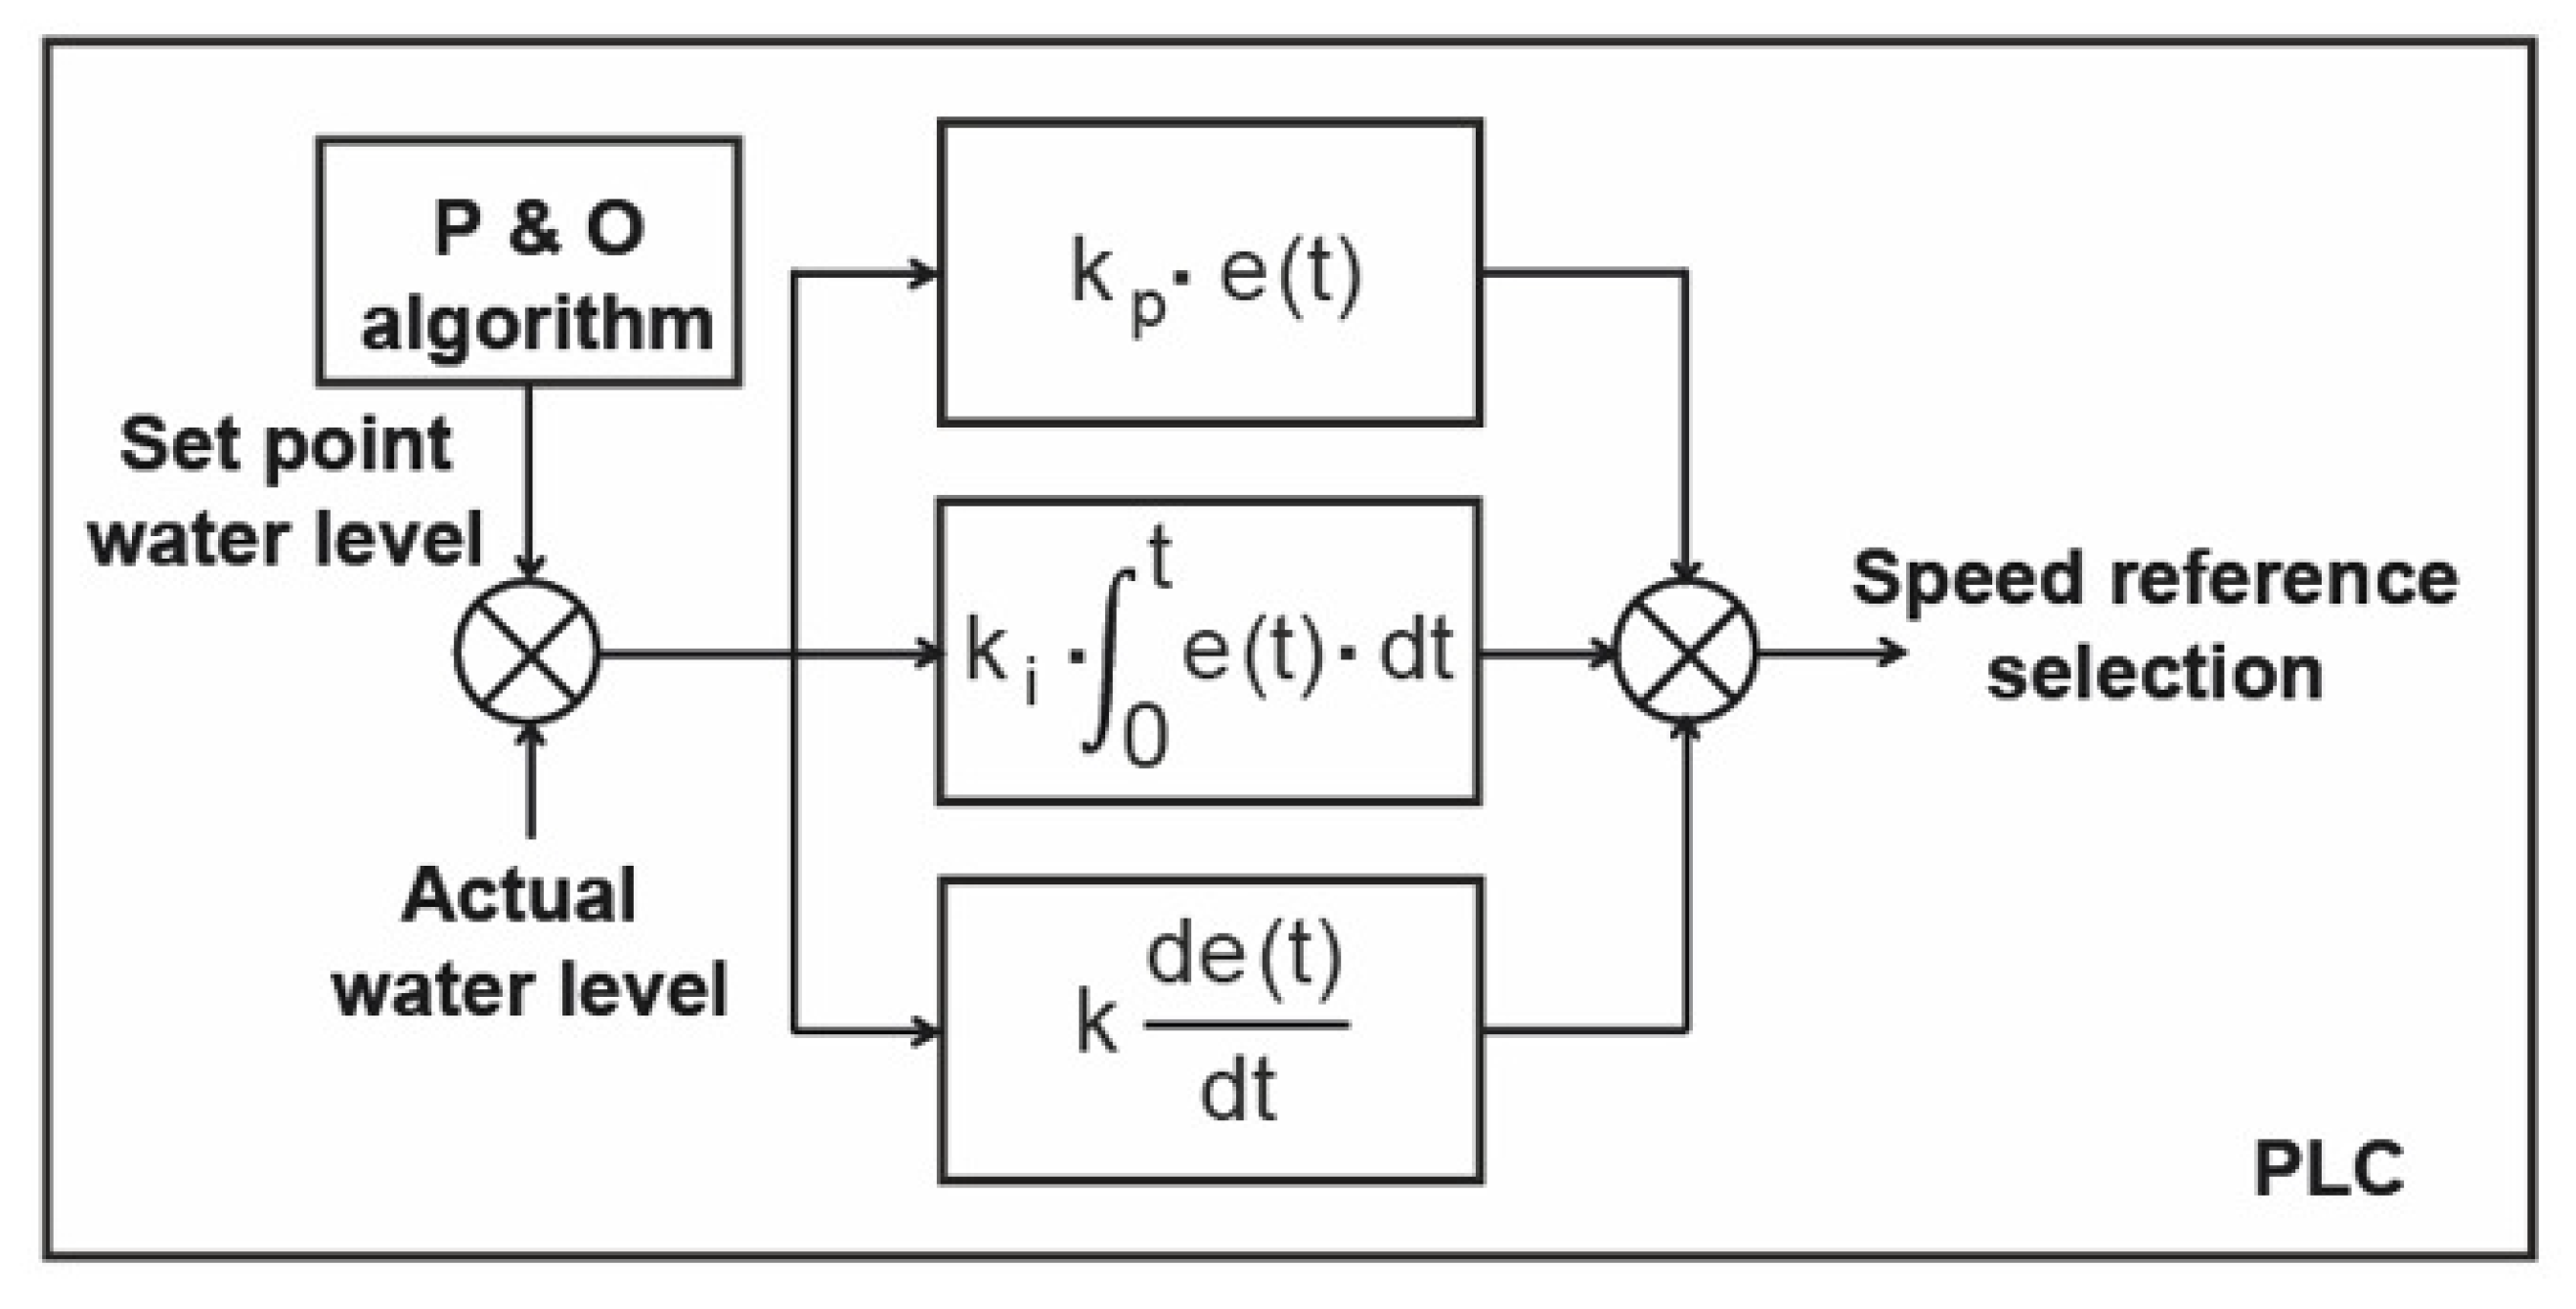
2.1.3. Optimal Water Level Control (OWLC)
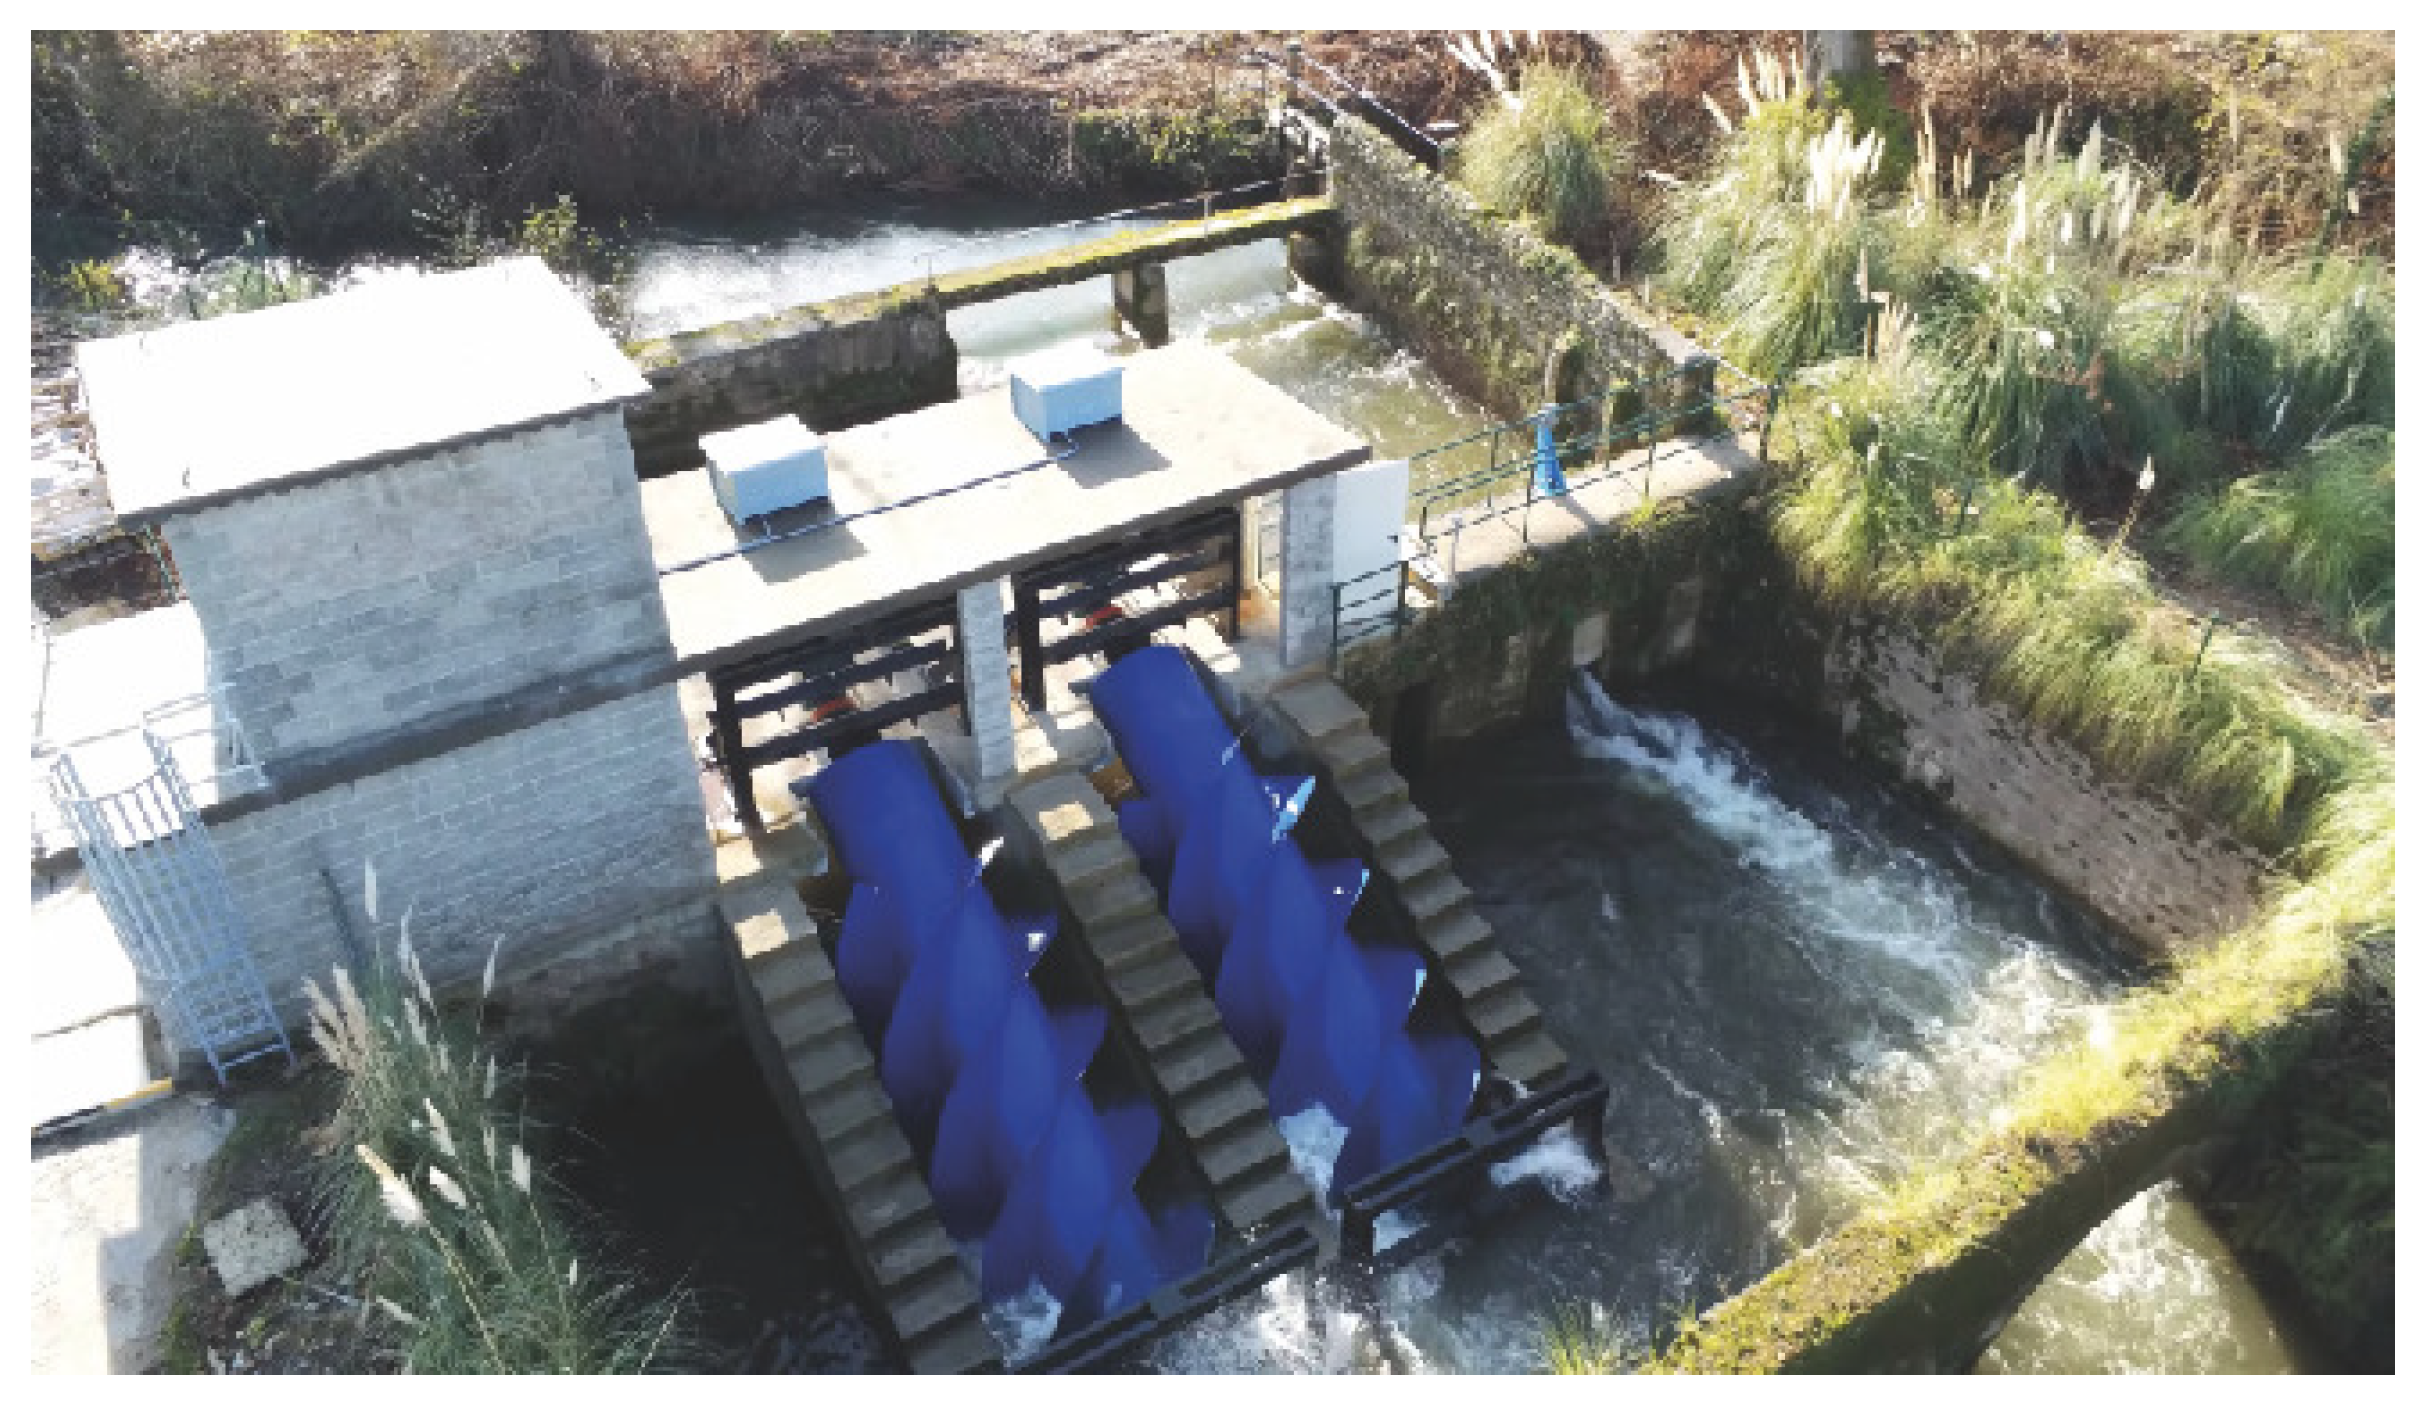
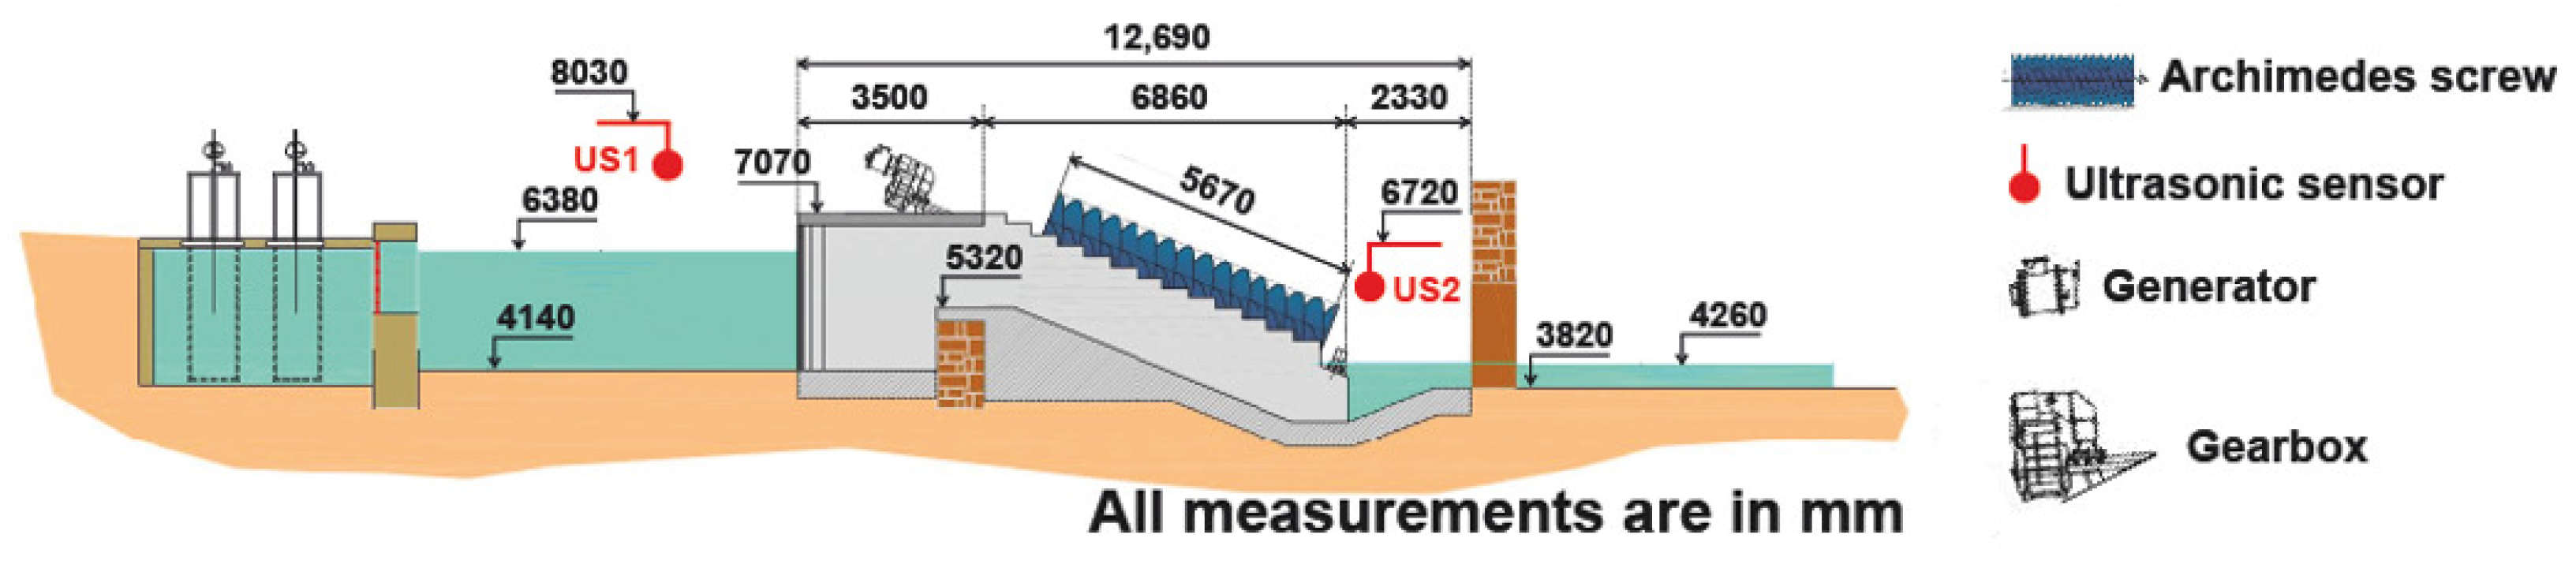
This control system is based on the use of both M P P T control and water level control ( W L C ) systems. Firstly, the M P P T control system estimates the optimal water level that makes the A S T operate the maximum power point. Then W L C is used to maintain the water level at the level previously estimated.
The O W L C acts on only one parameter of Equation (2), the head (h). But, as this h ensures that the mechanical power in Equation (2) is at maximum, similar results to the M P P T control are obtained. The control system will regulate the speed of the electric generator so that the preset head will remain constant. Moreover, the repetitive search for the M P P T control method is avoided. If there are no significant changes in the flow rate, this method obtains the best results, but it is very sensitive to changes in the flow rate.
This control system is very sensitive to the set point water level measurement. To obtain this value, two ultrasonic devices are used to measure the water levels upstream and downstream of the A S T . Therefore, the accuracy of this control system depends on the correct installation of these devices.
A diagram of an optimal water level control system is shown in Figure 5.
The fact that an increase in water flow causes a noticeable change in the water levels at an ultra-low head must be taken into account with this type of control system [26]. As the control system maintains the water level at the preset level, the optimum operating level will have to be re-determined.

3. Case Study

The Barreda micro-hydropower plant is located in the town of Torrelavega in northern Spain (latitude 43 ° 21 11 N, longitude 4 ° 2 45 W, and altitude of 35 (m)). The project is led by the Spanish company SinFin Energy [28]. The River Saja feeds this micro hydropower plant. Only a part of the river flow can be used for the Barreda micro-hydropower plant, and this changes with the season and the river flow itself. The nominal flow of the plant is defined in the water permit as 5 (m 3 /s). However, this is only the case in the winter months. The flow is lower throughout the rest of the year. The nominal Barreda micro-hydropower plant flow of 5 (m 3 /s), in combination with a nominal head of 1960 (mm), requires the use of two A S T s . Thus, the Barreda micro-hydropower plant has two identical units, each incorporating an A S T , a speed multiplier (gearbox), an induction generator, and a back-to-back dual P W M converter. The history of the actual hydrological conditions indicates that power higher than the rated power of the A S T is almost never obtained as the actual flow rate almost never exceeds the rated value of 5 (m 3 /s). Although the Barreda micro-hydropower plant features two identical units, there may be a scenario where both units do not operate simultaneously. In other words, only one unit or both units in parallel may be operated depending on the available flow. Figure 6 shows an aerial photograph of the plant. The most important data on the individual units, as extracted from the manufacturer’s specifications, are shown below.
It is a 70 (kW) grid-connected run-of-river-type micro-hydropower plant with no dam or water storage. This plant uses two groups (Archimedean screw turbines) [28]. The micro-hydropower plant uses two 35 (kW) Archimedes screw turbines, specifically designed for the project, with the following characteristics: a radius (diameter) of the screw’s outer cylinder of 1232.03 (mm), a radius (diameter) of the screw’s inner cylinder of 660 (mm), a total length of 5338.93 (mm), a screw turbine angle of 22 ( ° ), and three blades with a pitch of 4247.74 (mm) each. The design flow is 5 (m 3 /s). The rated speed of the A S T is 27.46 (rpm), and therefore, a gearbox (see Figure 7a) (Nidec, model Geared Motors 3000 Range [35]) with a ratio of 1:50.5 is needed to adjust the speed of the A S T to the speed of the electric generator. There are two 45 (kW) electric generators (see Figure 7a) (Nidec, model 4PLSES225MR [36]), one of which was specifically designed for the turbine. The output voltage of this electric generator is 400 (V). There are two generator-side converters (see Figure 7b) (Nidec Unidrive M701, model M701-074-00770 [36]) and one grid-side converter (see Figure 7b) (Nidec, model M700-094-02000 [36]). The P L C used is from the manufacturer Eaton and the model is PLC Eaton XV-300 HMI-PLC [37]. Figure 7 shows the different elements of the Barreda micro-hydropower plant.

4. Experimental Setup

The experimental setup used is shown in this section.
Barreda micro-hydropower plant was used to experimentally investigate the performance of a micro-hydropower plant operating with the three control systems. A schematic drawing of the whole system is shown in Figure 8. This means of installation allows the efficiency of the micro-hydropower plant to be investigated under real flow conditions by setting the geometrical parameters of the A S T and the three control systems. This system allows for the operation of the three control systems, keeping the flow rate constant for each of them.
In order to analyse the three control systems, the values of several parameters are needed, such as (i) the A S T speed, (ii) the power output, (iii) the water head, and (iv) the flow rate.

4.1. A s t Speed

The A S T speed is measured with an incremental encoder located on the generator shaft with 1024 pulses per revolution [38]. The encoder is connected directly to the generator converter. To obtain the A S T speed, the resulting figure is divided by the gearbox ratio. The data is communicated from the converter to the P L C via the Modbus protocol. Table 1 shows their characteristics. Thirty instantaneous values of A S T speed were taken in 60 (s) for each measurement, corresponding to a particular flow condition.

4.2. Power Output

The KPQA-01 [39] power quality analyser was used to measure the power output, but this device can also determine a large number of electrical parameters and process data quickly. Table 1 shows their characteristics. Thirty instantaneous values of the power output were taken in 60 (s) for each measurement, corresponding to a particular flow condition.

4.3. Water Head

Water level control and optimal water level control are based on acting on a single parameter of Equation (2) used to optimise the mechanical power of the A S T , the head (h). Therefore, the effectiveness of these two control systems is based on the measurement precision of the head.
The available head height was obtained via on-site measurements. The water levels upstream and downstream of the A S T were measured using ultrasonic devices. The water head was measured with a SITRANS LU150 measuring instrument [40]. SITRANS LU150 is a short-range integrated ultrasonic level transmitter. Table 1 shows their characteristics. Thirty instantaneous values of the water head were taken in 60 (s) for each measurement, corresponding to a particular flow condition.

4.4. Flow Rate

Measuring the flow rate at the inlet of the Archimedes screws is complicated by the shape of the water channel. Therefore, the flow rate was measured downstream from the Archimedes screws. The instantaneous stream flow data was measured elsewhere; therefore, the dynamics of the measurement thereof have been taken into account in addition to the stream flow value. Thus, the flow readings with the three control systems studied were always taken at the same flow rate.
The total flow out of the Archimedean screws is channelled through three pipes, each equipped with a flow meter. The total flow rate is determined by adding the measurement of each flow meter. The flow rate was measured with three KROHNE Optiflux 2100 measuring instruments [41]. Table 1 shows their characteristics. The flow was recorded every 300 (s).
Table 2 shows the characteristics of the measuring instruments used in the tests.

4.5. Uncertainty Analysis

It is crucial when conducting experiments and analysing the data obtained to consider the potential sources of error. By doing so, the overall uncertainty linked to the measurements can be assessed in order to draw accurate conclusions and inferences from the experimental outcomes. Uncertainty analysis was conducted to identify and assess errors. The uncertainties associated with the experimental parameters can be influenced by several sources of error [42], including random fluctuations in the instruments used, the calibration of the test bed, the accuracy of observations, and the experimental methodology. If a parameter is measured directly, the measurement uncertainties are defined by the accuracies of the experimental instruments [43]. Conversely, for parameters measured by several devices, the measurement uncertainties are determined based on the principle of the mean square method [44] and the accuracies of the devices used:
e R = f x 1 e 1 2 + f x 2 e 2 2 + + f x n e n 2 1 2
where e R is the measurement uncertainty of the parameter, f is the given function of the parameter, and e 1 , e 2 , …, e n are the measurement uncertainties of the related measured parameters. All measuring instruments used in the experiment were periodically calibrated to ensure traceability of measurements. The results of the uncertainty analysis of the parameters measured and calculated in the experiment are shown in Table 3.
Several criteria can be used to estimate the quality of the measurements. For example, the measurements can be considered as highly precise when the uncertainty of each parameter is less than 3 % [43]. Other researchers use more restrictive criteria. Measurements are considered to be of high precision when the uncertainty of each parameter is less than 2 % [45]. According to Table 2, the measurements herein can be considered as highly precise.

5. Assessment Indicators

This section discusses the assessment indicators used to compare the three control systems analysed. These assessment indicators are the energy gain, the efficiency of the micro-hydropower plant, and the mechanical fatigue.

5.1. Energy Gain

The term energy gain is widely used in the evaluation of different configurations of renewable energy systems [46]. The energy gain ( E G ) can be calculated as the difference between the electrical energy generated using the water level control and the M P P T method, in % energy:
E G = E * E M P P T E M P P T × 100
where the subindex * stands, as above, for the corresponding water level control ( W L C and O W L C ).

5.2. Micro-Hydropower Plant Efficiency

The available hydraulic power of the water can be calculated using the equation [29]:
P h = ρ · g · h · q
where P h is the available hydraulic power (W), ρ is the density of water (kg/m 3 ), g is the acceleration due to gravity (m/s 2 ), h a is the available head (m), and q is the flow rate (m 3 /s).
The hydrostatic pressure exerted on the A S T produces a torque (T) at a given speed. Therefore, the mechanical power ( P m ) is equal to this torque multiplied by the rotational speed, according to the equation [29]:
P m = ω · T
where P m is the mechanical power (W), ω is the rotational speed (rad/s), and T is the torque (Nm).
The power output of the electrical generator can be calculated with the following equation [29]:
P e = P m · η g · η e
where P e is the power output of the electric generator (W), η e is the electric generator efficiency (%), and η g is the gearbox efficiency (%).
The efficiency of the micro-hydropower plant is the ratio of the electrical power to the hydraulic power defined as
η = P e P h
where η is the efficiency of the micro-hydropower plant, P h is the available hydraulic power (W), and P e is the electrical power (W).
The average efficiency values for the mini-hydropower plant during each power generation period in the test (about 4 h) were calculated in order to compare the efficiency with the three control systems. The average efficiency gain can also be used for the evaluation of different renewable energy system configurations. Equation (9) makes it possible to determine the average efficiency gain ( A E G ) as the difference between the average efficiency of the micro-hydropower plant using water level control and the M P P T method:
A E G = A E * A E M P P T A E M P P T × 100
where the subindex * stands, as above, for the corresponding water level control ( W L C and O W L C ).

5.3. Gearbox Fatigue

The gearbox enables the transmission of power between the Archimedes screw shaft and the electric generator shaft. Its principle of operation is based on tooth-to-tooth contact and involves several failure modes and fatigue damage [47]. Fatigue is a process of degeneration of a material subjected to cyclic loading of values below those that would be capable of causing it to break by tensile stress [48]. During the fatigue process, cracks can occur which can lead to gear failure if the number of operating cycles reaches a certain value. This number of cycles will depend on several factors such as the applied load, the magnitude of the applied stress, etc. Therefore, fatigue damage will depend on both the number of load cycles and the applied stress. For the same number of load cycles, the applied stress defines the occurrence of fatigue damage [48].
ISO 6336 [49] can be used for gearbox calculations. The equations used to calculate the tooth bending and surface contact stress values are [48] (i) the Lewis equation for calculating the tooth flank fracture, and (ii) the Hertzian contact equation for the bending and contact stresses.
A gearbox suffers from two main types of stress [48]: (i) bending stress at the root of the teeth due to the transmitted load, and (ii) contact stress at the tooth flank due to the repeated impact of one tooth surface against another. The Lewis formula can be used to calculate of the bending stress in gear teeth [48]:
σ = F t b · m · Y
where σ is the stress (kg/m 2 ), F t is the transmitted load (N), b is the face width (m), m is the module (m), and Y is the Lewis form factor. Since the objective is to compare the effects of the control systems on the same gearbox, the following equation is used (10):
σ = k 1 · F t
On the other hand, the transmitted load can be calculated with
F t = T d 2
where T is the torque (Nm), and d is the pitch diameter (m). Thus, the following can be deduced:
σ * σ M P P T = T * T M P P T
where the subindex * stands, as above, for the corresponding water level control ( W L C and O W L C ). The greater the oscillation of the torque developed by the Archimedean screw, the greater the fatigue on the gears.

6. Results and Discussion

In this section, the three control systems—the water level control system, the maximum power point tracking method, and the optimal water level control system—implemented at the same micro hydropower plant will be analysed to show how they affect various evaluation indicators. These assessment indicators are the electricity production, the micro-hydropower plant efficiency, and the gearbox fatigue. This section presents an experimental test campaign at the Barreda micro-hydropower plant. The conditions of the study are
(i)
The tests were carried out under real hydrological conditions at the Barreda micro-hydropower plant;
(ii)
The test duration for each control system was 4 h;
(iii)
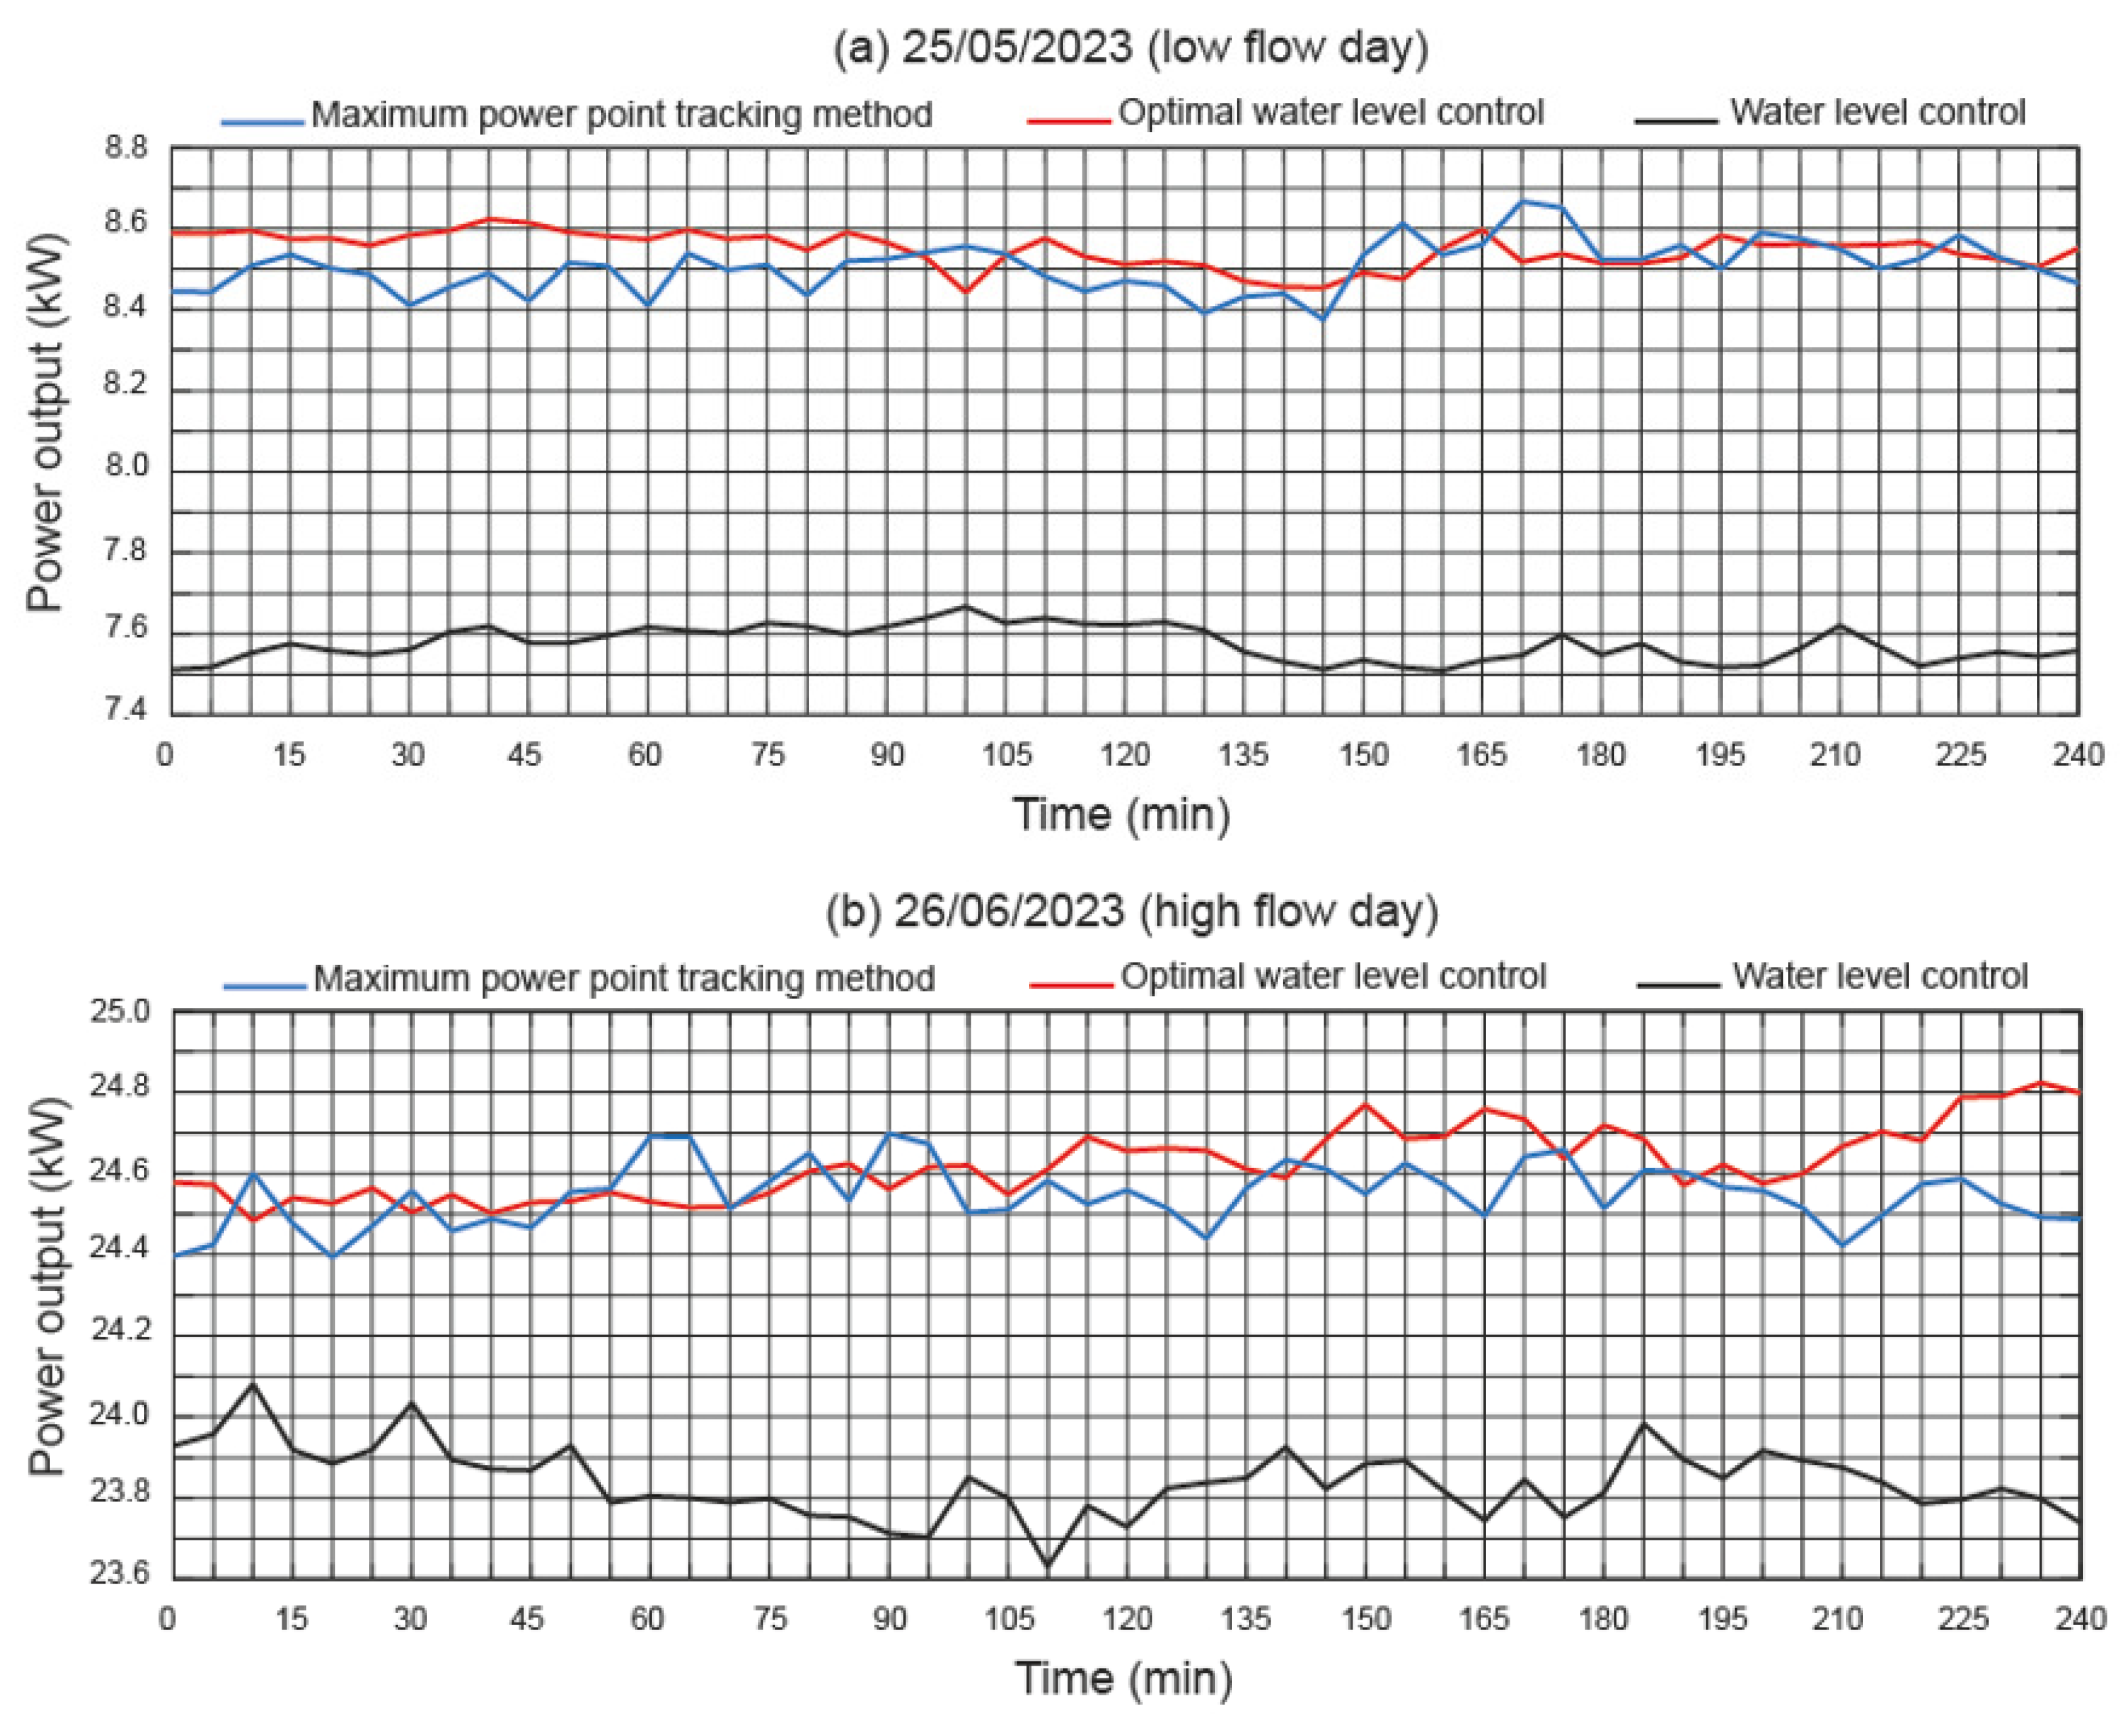
The tests were carried out over several days of operation of the micro hydroelectric power plant. As the flow rate varies throughout the day, two days have been chosen in which the flow rate remained almost constant, and days from the test campaign, where the flow rate had larger variations, have been discarded. A low flow day (25 May 2023) and a high flow day (26 June 2023) were chosen.
Figure 9 shows the flow rate at the Barreda micro-hydropower plant for the days under study. As can be seen in Figure 9, the average flow rates of the three control systems are very similar.

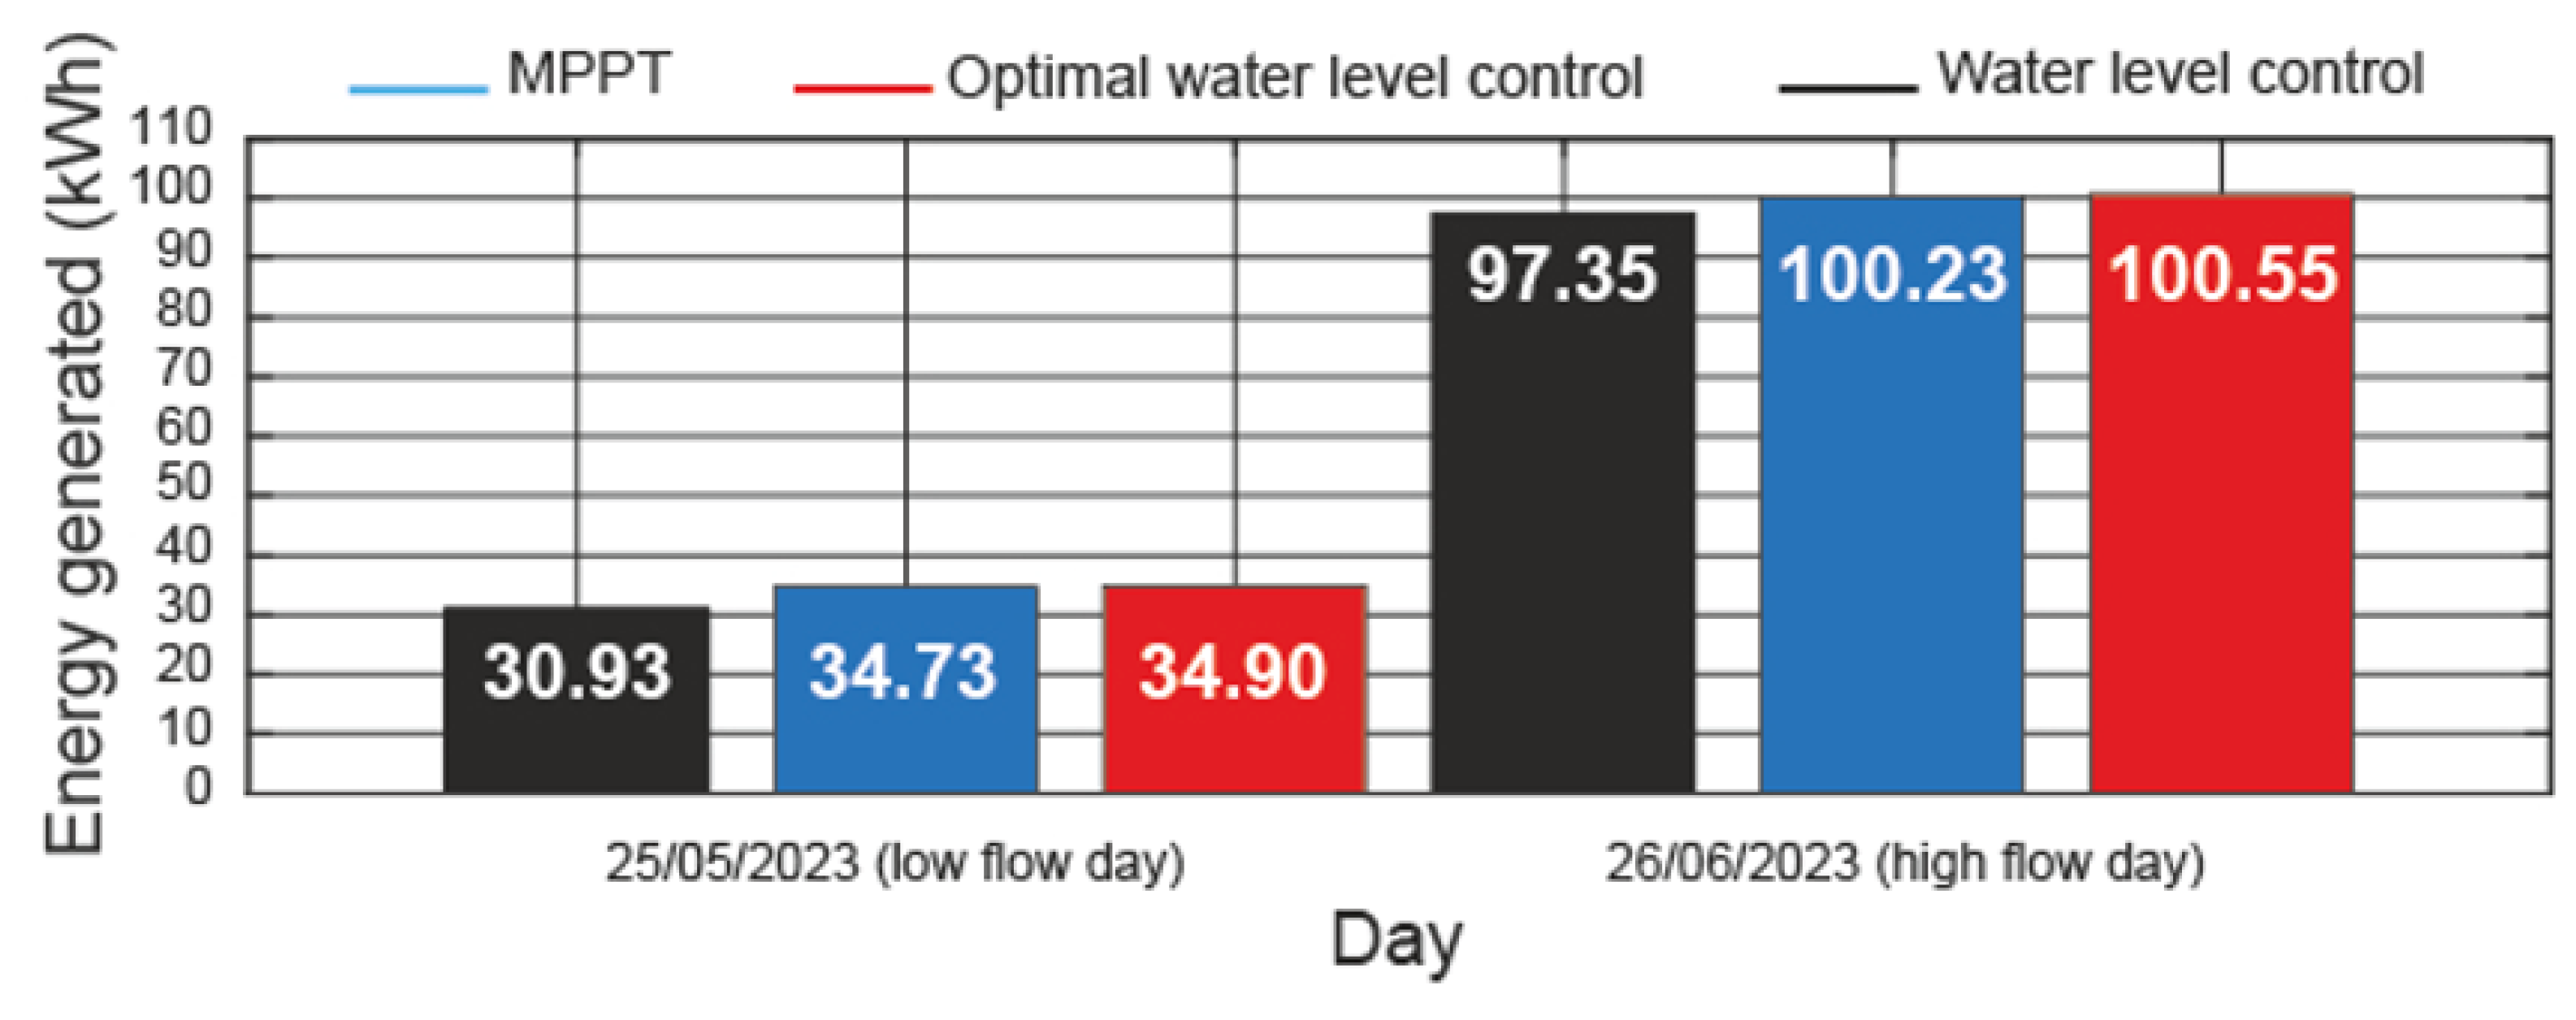
6.1. Electricity Production

Figure 10 shows the power output by the Barreda micro-hydropower plant using the three control systems. At the two flows studied, the maximum power point tracking and optimal water level control systems obtain similar power output values. In contrast, the water level control system obtained worse results.
Figure 11 shows the energy generated by the Barreda micro-hydropower plant using the three control systems. At the two flows studied, the optimal water level control system reflected slightly better results; however, the maximum power point tracking and optimal water level control systems led to equal values of energy generated. In contrast, the energy generated was lower when using the water level control system. These results can be seen in the determination of the energy gain.
Table 4 shows the energy gain. Maximum power point tracking and optimal water level control systems achieve similar energy gains. In contrast, the water level control system performs worse, especially at low flow rates.

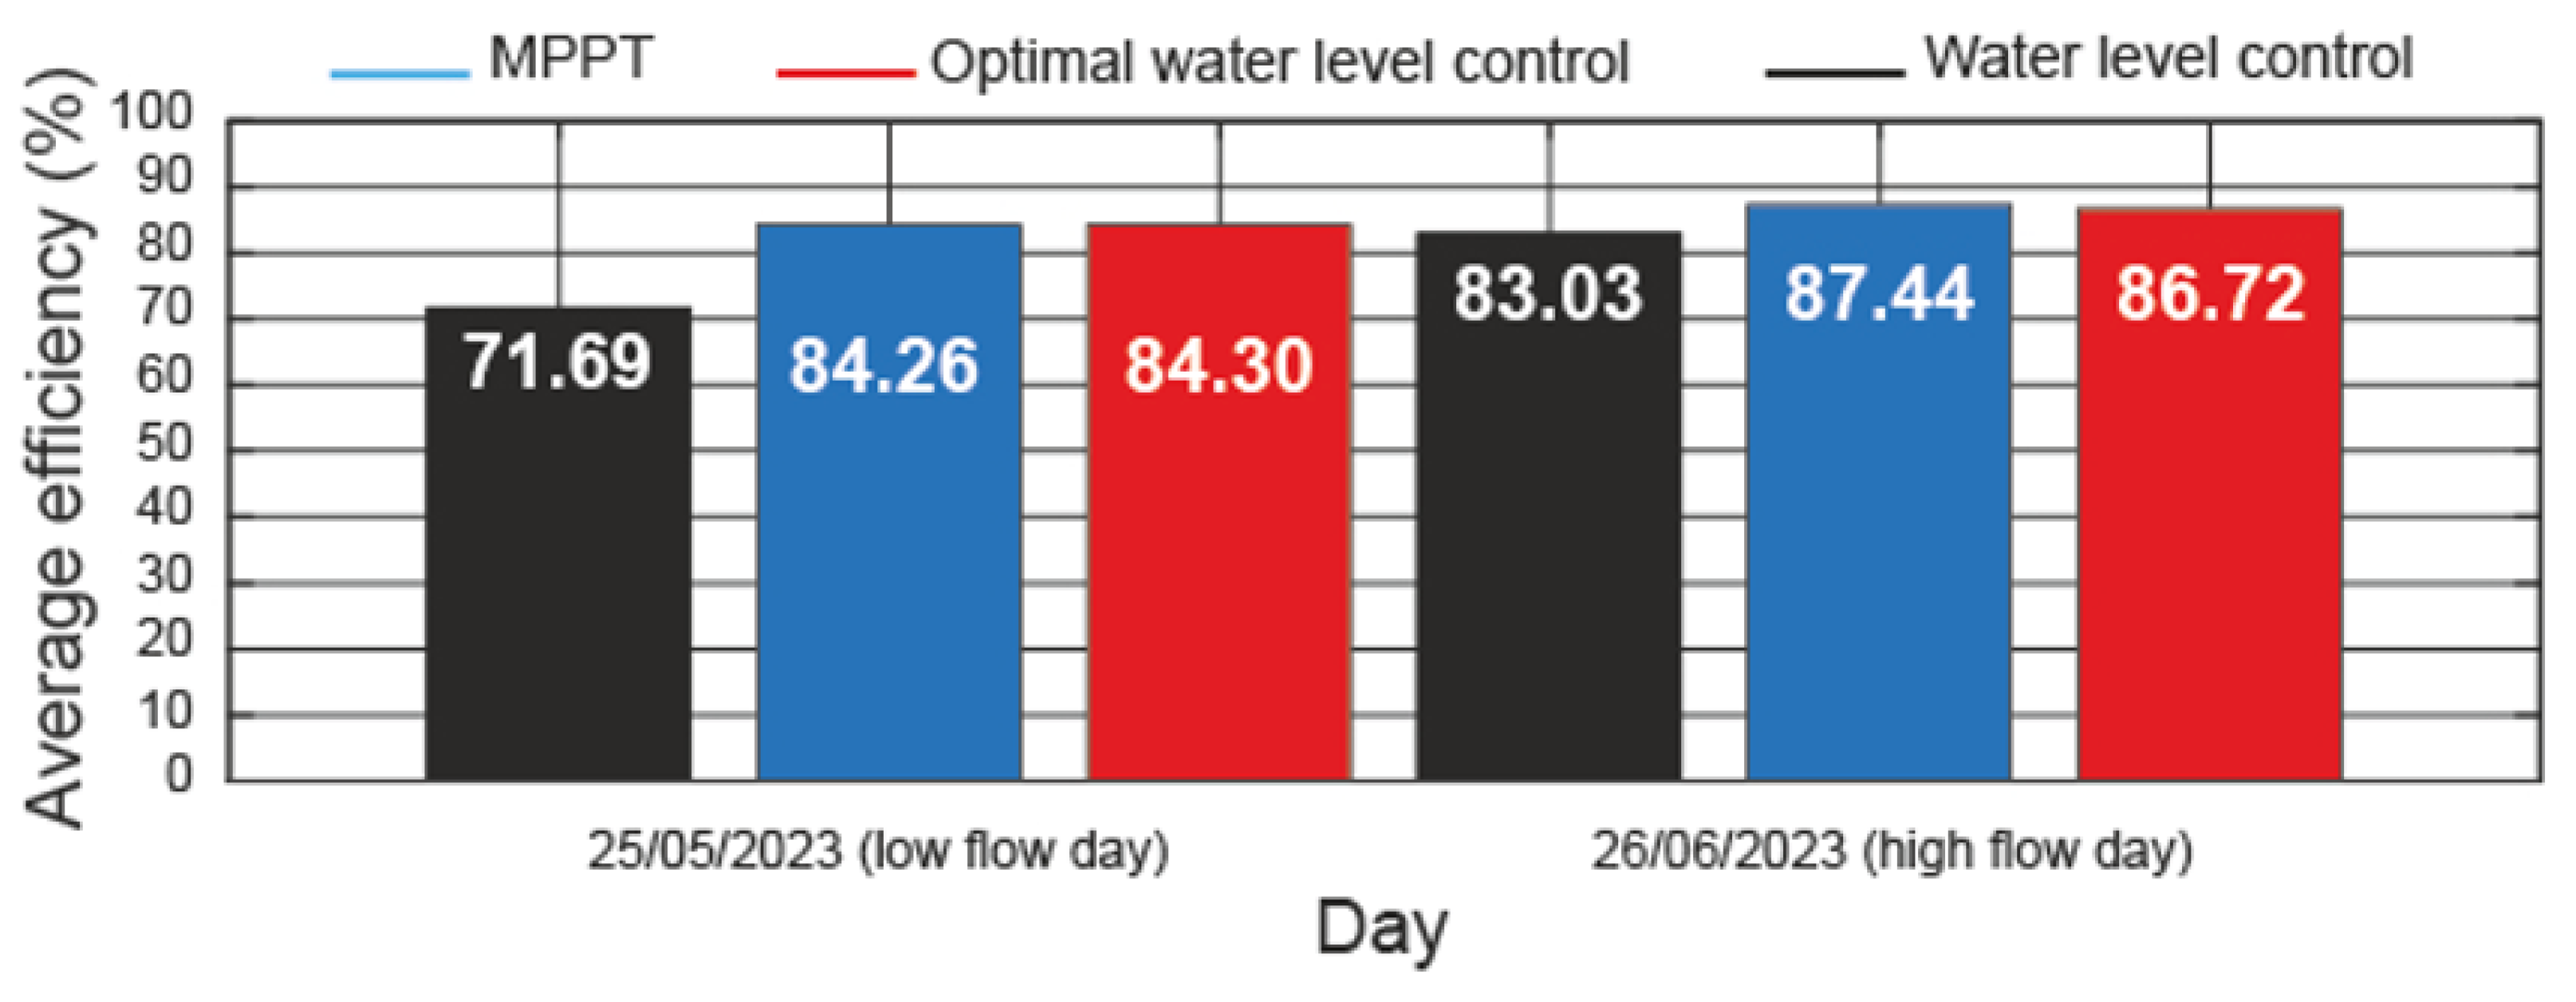
6.2. Micro-Hydropower Plant Efficiency

Figure 12 shows the efficiency of the Barreda micro-hydropower plant using the three control systems. According to Figure 12a, the efficiency of the micro hydroelectric power plant decreases with the decreasing available flow. The maximum power point tracking and optimal water level control systems obtain similar results at low flow rates, while the decrease in efficiency is remarkable with the water level control system. Figure 12b also shows how the efficiency of the micro-hydropower plant increases using the three control systems when there is an increase in the available flow. Better efficiencies are obtained with the maximum power point tracking and optimal water level control systems, although the difference with the water level control system is much smaller.
Figure 13 shows the average efficiency of the Barreda micro-hydropower plant using the three control systems. The maximum power point tracking system and the optimal water level control system obtain similar average efficiency results for both high and low flow rates. In contrast, the water level control system obtains worse results for the flow rates studied. This is particularly evident in the low flow study. These results can be seen in the determination of the average efficiency gain.
Table 5 shows the average efficiency gain. Maximum power point tracking and optimal water level control systems achieve similar average efficiency gains. In contrast, the water level control system performs worse, especially at low flow rates.

6.3. Gearbox Fatigue

Figure 14 shows the torque developed by the Archimedes screw. The range of torque variation when using the maximum power point tracking system was observed as much higher than when the other control systems were used. This fact is more noticeable at low flow rates. The range of torque variation for the maximum power point tracking system at low flow rates is 2.5 (kNm), and for high flow days, it is 1.25 (kNm). In the case of the optimal water level control system, the torque variation is approximately 0.35 (kNm) for low and high flows. As for the water level control system, the torque variation is approximately 0.25 (kNm) for low and high flows. Therefore, the maximum power point tracking system shows the worst behaviour as concerns fatigue. Therefore, the mechanical stress on the gearbox produced by the maximum power point tracking system is 7.14 times higher than by the optimal water level control system for low flow rates, and 3.57 times higher for high flow days. If the comparison is made with the water level control system, it is 10 times higher and 5 times higher for low flow rates and for high flow days, respectively.
The main difference between the optimal water level control system and the maximum power point tracking system is that the former reduces the mechanical stress on the gearbox.

7. Conclusions

This paper describes an experimental study of the implementation of three control systems for an Archimedes screw turbine. Several evaluation indicators (electricity production, micro-hydropower plant efficiency, and gearbox fatigue) were analysed for each control system implemented in an asynchronous electrical generator (a maximum power point tracking system, an optimal water level control system, and a water level control system) at the same micro hydropower plant. The Barreda micro-hydropower plant (Spain) was used for the study. This micro-hydropower plant uses an Archimedes screw turbine coupled to an asynchronous electric generator via a gearbox. The results show the advantages of using the optimal water level control and maximum power point tracking systems. In summary, the following conclusions can be drawn:
(i)
The optimal water level control system and the maximum power point tracking system achieve similar levels of electrical production. The energy gain obtained is less than 0.5 % . In contrast, the water level control system obtains the worst results; in fact, the energy gain is around 12 % for low flow rates and 3 % for high flow rates.
(ii)
The efficiency of the micro-hydropower plant is similar with the implementation of the optimal water level control system and the maximum power point tracking system, regardless of the available flow. The average efficiency gain is less than 0.9 % . On the contrary, the water level control system obtains the worst results; specifically, the average efficiency gain is around 15 % for low flows and 5 % for high flows.
(iii)
The optimal water level control system reduces mechanical stress on the gearbox and therefore allows for a significant reduction in fatigue load rates compared to the maximum power point tracking system. The maximum power point tracking system produces 7.14 times more mechanical stress on the gearbox than the optimal water level control system for low flow rates, and 3.57 times more for high flow rates. When compared to the water level control system, these amounts are 10 times higher and 5 times higher for low flow rates and high flow rates, respectively.
It can be concluded that the optimal water level control system performs better as concerns the three assessment indicators used. The maximum power point tracking system shows similar behaviour to the optimal water level control system with respect to energy generation, but shows worse behaviour with respect to mechanical stress. Finally, the water level control system shows the worst performance of the three control systems analysed in relation to the energy produced.

Author Contributions

Conceptualization, A.B., F.G.-G. and L.B.; Methodology, A.B. and L.B.; Software, R.G.; Validation, A.B., F.G.-G. and L.B.; Investigation, F.G.-G. and R.G.; Data curation, F.G.-G.; Writing—original draft, R.G.; Writing—review and editing, R.G. All authors have read and agreed to the published version of the manuscript.

Funding

This research received no external funding.

Institutional Review Board Statement

Not applicable.

Informed Consent Statement

Not applicable.

Data Availability Statement

The data presented in this study are available on request from the corresponding author. The data are not publicly available due to the data protection policy of the company SinFin Energy.

Acknowledgments

We wish to thank SinFin Energy [28] for its contributions to this paper.

Conflicts of Interest

The authors declare no conflicts of interest.

Nomenclature

A E Average efficiency (dimensionless)
A E G Average efficiency gain (dimensionless)
bFace width (m)
dPitch diameter (m)
EElectrical energy (kWh)
E G Energy gain (dimensionless)
F t Transmitted load (N)
gAcceleration of gravity (m/s 2 )
h a Available head (m)
LTotal length of screw (m)
mModule (m)
NNumber of blades (dimensionless)
P e Power output of the electric generator (W)
P g Power output of the electric generator (W)
P h Hydraulic power (W)
P m Mechanical power (W)
pPitch of one blade (m)
R i Radius of screw’s inner cylinder (m)
R o Radius of screw’s outer cylinder (m)
qFlow rate (m 3 /s)
TTorque (Nm)
YLewis form factor (dimensionless)
θ Angle of the screw turbine ( ° )
η Micro-hydropower plant efficiency (%)
η e Electric generator efficiency (%)
η g Gearbox efficiency (%)
η t A S T efficiency (%)
ρ Water density (kg/m 3 )
ω Rotational speed (rad/s)
σ Stress (kg/m 2 )
σ c Critical cavitation factor (dimensionless)

References

  1. BP Statistical Review of World Energy, 72nd ed.; BP: London, UK, 2023; Available online: https://www.energyinst.org/statistical-review (accessed on 22 October 2023).
  2. BPIE. 9 Ways to Make the Energy Performance of Buildings Directive More Effective. 2016. Available online: http://bpie.eu/wp-content/uploads/2016/08/EPBD-paper_Eng.pdf (accessed on 20 October 2023).
  3. Barbón, A.; Aparicio-Bermejo, J.; Bayón, L.; Georgious, R. Floating photovoltaic systems coupled with pumped hydroplants under day-Ahead electricity market conditions: Parametric analysis. Electronics 2023, 12, 2250. [Google Scholar] [CrossRef]
  4. IRENA. Global Energy Transformation: A Roadmap to 2050. Available online: https://www.irena.org/publications/2019/Apr/Global-energy-transformation-A-roadmap-to-2050-2019Edition (accessed on 20 October 2023).
  5. World Bank. Climate Change Action Plan 2021–2025: Supporting Green, Resilient and Inclusive Development; World Bank: Washington, DC, USA, 2021; p. 21. [Google Scholar]
  6. Reddy, V.R.; Uitto, J.I.; Frans, D.R.; Matin, N. Achieving global environmental benefits through local development of clean energy? The case of small hilly hydel in India. Energy Policy 2006, 34, 4069–4080. [Google Scholar] [CrossRef]
  7. Xu, J.; Ni, T.; Zheng, B. Hydropower development trends from a technological paradigm perspective. Energy Convers. Manag. 2015, 90, 195–206. [Google Scholar] [CrossRef]
  8. UNIDO; ICSHP. World Small Hydropower Development Report 2022; United Nations Industrial Development Organization: Vienna, Austria; International Center on Small Hydro Power: Hangzhou, China, 2022; Available online: https://www.unido.org/sites/default/files/files/2023-05/ENGLISH%20SUMMARY-2022.pdf (accessed on 20 October 2023).
  9. Sachdev, H.S.; Akella, A.K.; Kumar, N. Analysis and evaluation of small hydropower plants: A bibliographical survey. Renew. Sustain. Energy Rev. 2015, 51, 1013–1022. [Google Scholar] [CrossRef]
  10. Punys, P.; Kvaraciejus, A.; Dumbrauskas, A.; Šilinis, L.; Popa, B. An assessment of micro-hydropower potential at historic watermill, weir, and non-powered dam sites in selected EU countries. Renew. Energy 2019, 133, 1108–1123. [Google Scholar] [CrossRef]
  11. Quaranta, E.; Bahreini, A.; Riasi, A.; Revelli, R. The very low head turbine for hydropower generation in existing hydraulic infrastructures: State of the art and future challenges. Sustain. Energy Technol. Assess. 2022, 51, 101924. [Google Scholar] [CrossRef]
  12. Zhou, D.; Deng, Z.D. Ultra-low-head hydroelectric technology: A review. Renew. Sustain. Energy Rev. 2017, 78, 23–30. [Google Scholar] [CrossRef]
  13. RESTOR Hydro Project. 2012. Available online: http://www.restor-hydro.eu/en/ (accessed on 20 October 2023).
  14. Ball, I.; Berg, L.; Buiting, M.J.; Courret, D.; David, L.; Denis, V.; Dewitte, M.; Henke, A.; Janicki, W.; Siegfried Jawaid, T.; et al. Small Hydropower Technologies—European State-of-the-Art Innovations, HYPOSO 2020. Available online: https://www.hyposo.eu/HYPOSO_Publications/HYPOSO_handbook_final.pdf (accessed on 20 October 2023).
  15. Doost, A.; Lubitz, W. Archimedes Screw Turbines: A Sustainable Development Solution for Green and Renewable Energy Generation—A Review of Potential and Design Procedures. Sustainability 2020, 12, 7352. [Google Scholar]
  16. Barbón, A.; González-González, F.; Bayón, L.; Georgious, R. Variable-Speed Operation of Micro-Hydropower Plants in Irrigation Infrastructure: An Energy and Cost Analysis. Appl. Sci. 2023, 13, 13096. [Google Scholar] [CrossRef]
  17. Williamson, S.; Stark, B.; Booker, J. Low head pico hydro turbine selection using a multi-criteria analysis. Renew. Energy 2014, 61, 43–50. [Google Scholar] [CrossRef]
  18. Dellinger, G.; Terfous, A.; Garambois, P.A.; Ghenaim, A. Experimental investigation and performance analysis of Archimedes screw generator. J. Hydraul. Res. 2016, 54, 197–209. [Google Scholar] [CrossRef]
  19. Lubitz, W.; Lyons, M.; Simmons, S. Performance model of Archimedes screw hydro turbines with variable fill level. J. Hydraul. Eng. 2014, 140, 1–11. [Google Scholar] [CrossRef]
  20. Pipera, A.T.; Rosewarnec, P.J.; Wrightd, R.M.; Kempa, P.S. The impact of an Archimedes screw hydropower turbine on fish migration in a lowland river. Ecol. Eng. 2018, 118, 31–42. [Google Scholar] [CrossRef]
  21. Rorres, C. The turn of the screw: Optimal desing of an Archimedes crew. J. Hydraul. Eng. 2000, 126, 72–80. [Google Scholar] [CrossRef]
  22. Dellinger, G.; Simmons, S.; Lubitz, W.D.; Garambois, P.-A.; Dellinger, N. Effect of slope and number of blades on Archimedes screw generator power output. Renew. Energy 2019, 136, 896–908. [Google Scholar] [CrossRef]
  23. Shahverdi, K.; Loni, R.; Maestre, J.M.; Najafi, G. CFD numerical simulation of Archimedes screw turbine with power output analysis. Ocean Eng. 2021, 231, 108718. [Google Scholar] [CrossRef]
  24. Dedic-Jandrek, H.; Nizetic, S. Small scale archimedes hydro power plant test station: Design and experimental investigation. J. Clean. Prod. 2019, 231, 756–771. [Google Scholar] [CrossRef]
  25. Lavrič, H.; Rihar, A.; Fišer, R. Simulation of electrical energy production in Archimedes screw-based ultra-low head small hydropower plant considering environment protection conditions and technical limitations. Energy 2018, 164, 87–98. [Google Scholar] [CrossRef]
  26. Lavrič, H.; Rihar, A.; Fišer, R. Influence of equipment size and installation height on electricity production in an Archimedes screw-based ultra-low head small hydropower plant and its economic feasibility. Renew. Energy 2019, 142, 468–477. [Google Scholar] [CrossRef]
  27. Charisiadis, C. An Introductory Presentation to the “Archimedean Screw” as a Low Head Hydropower Generator; Leibniz Univerity Hannover: Hannover, Germany, 2015. [Google Scholar]
  28. SinFin Energy. Available online: https://www.sinfinenergy.com/en/c-h-rebolluelo/ (accessed on 22 October 2023).
  29. Bhattacharjee, S.; Nayak, P.K. PV-pumped energy storage option for convalescing performance of hydroelectric station under declining precipitation trend. Renew. Energy 2019, 135, 288–302. [Google Scholar] [CrossRef]
  30. Zheng, S.; Shahzad, M.; Muhammad Asif, H.; Gao, J.; Abdul Muqeet, H. Advanced optimizer for maximum power point tracking of photovoltaic systems in smart grid: A roadmap towards clean energy technologies. Renew. Energy 2023, 206, 1326–1335. [Google Scholar] [CrossRef]
  31. Compadre Torrecilla, M.; Montecucco, A.; Siviter, J.; Strain, A.; Knox, A.R. Transient response of a thermoelectric generator to load steps under constant heat flux. Appl. Energy 2018, 212, 293–303. [Google Scholar] [CrossRef]
  32. Zholtayev, D.; Rubagotti, M.; Duc Do, T. Adaptive super-twisting sliding mode control for maximum power point tracking of PMSG-based wind energy conversion systems. Renew. Energy 2022, 183, 877–889. [Google Scholar] [CrossRef]
  33. Hoffstaedt, J.P.; Truijen, D.P.K.; Fahlbeck, J.; Gans, L.H.A.; Qudaih, M.; Laguna, A.J.; De Kooning, J.D.M.; Stockman, K.; Nilsson, H.; Storli, P.-T.; et al. Low-head pumped hydro storage: A review of applicable technologies for design, grid integration, control and modelling. Renew. Sustain. Energy Rev. 2022, 158, 112119. [Google Scholar] [CrossRef]
  34. Belhadji, L.; Bacha, S.; Munteanu, I.; Rumeau, A.; Roye, D. Adaptive MPPT applied to variable-speed microhydropower Plant. IEEE Trans. Energy Convers. 2013, 28, 34–43. [Google Scholar] [CrossRef]
  35. Leroy-Somer. Available online: https://www.leroy-somer.com/documentation_pdf/3969_en.pdf (accessed on 22 October 2023).
  36. Nidec. Available online: https://acim.nidec.com (accessed on 22 October 2023).
  37. Eaton. Available online: https://www.eaton.com (accessed on 22 October 2023).
  38. Dynapar. Available online: https://www.dynapar.com/technology/encoder_basics/incremental_encoder/ (accessed on 22 October 2023).
  39. Temper. Available online: https://www.grupotemper.com/producto/kpqa-01 (accessed on 22 October 2023).
  40. Siemens. Available online: https://mall.industry.siemens.com/mall/es/es/Catalog/Products/10268964 (accessed on 22 October 2023).
  41. Krohne. Available online: https://krohne.com/en/products/flow-measurement/flowmeters/electromagnetic-flowmeters (accessed on 22 October 2023).
  42. Yang, M.-H.; Gu, Z.-T.; Yeh, R.-H. Numerical and experimental analyses of the performance of a vertical axis turbine with controllable-blades for ocean current energy. Energy Convers. Manag. 2023, 285, 117009. [Google Scholar] [CrossRef]
  43. Li, M.; Zhang, Q.; Li, G.; Shao, S. Experimental investigation on performance and heat release analysis of a pilot ignited direct injection natural gas engine. Energy 2015, 90, 1251–1260. [Google Scholar] [CrossRef]
  44. Rahman, M.M.; Hamada, K.I.; Aziz, A.R.A. Characterization of the timeaveraged overall heat transfer in a direct-injection hydrogen-fueled engine. Int. J. Hydrogen Energy 2013, 38, 4816–4830. [Google Scholar] [CrossRef]
  45. Al-Waeli, A.H.A.; Chaichan, M.T.; Sopian, K.; Kazem, H.A.; Mahood, H.B.; Khadom, A.A. Modeling and experimental validation of a PVT system using nanofluid coolant and nano-PCM. Sol. Energy 2019, 177, 178–191. [Google Scholar] [CrossRef]
  46. Barbón, A.; Bayón-Cueli, C.; Bayón, L.; Carreira-Fontao, V. A methodology for an optimal design of ground-mounted photovoltaic power plants. Appl. Energy 2022, 314, 118881. [Google Scholar] [CrossRef]
  47. Bonaiti, L.; Geitner, M.; Tobie, T.; Gorla, C.; Stahl, K. A comparison between two statistical methods for gear tooth root bending strength estimation starting from pulsator data. Appl. Sci. 2023, 13, 1546. [Google Scholar] [CrossRef]
  48. Childs, P.R.N. Mechanical Design Engineering Handbook; Butterworth-Heinemann Ltd.: Oxford, UK, 2014. [Google Scholar]
  49. ISO 6336-1:2019; Calculation of Load Capacity of Spur and Helical Gears. Part 1: Basic Principles, Introduction and General Influence Factors. ISO: Geneva, Switzerland, 2019. Available online: https://www.une.org/ (accessed on 22 October 2023).
Figure 1. Diagram of a typical Archimedes screw turbine system.
Applsci 14 00512 g001
Figure 2. A micro-hydropower grid-connected control system.
Applsci 14 00512 g002
Figure 3. A diagram of a water level control system.
Applsci 14 00512 g003
Figure 4. An MPTT algorithm implemented.
Applsci 14 00512 g004
Figure 5. Diagram of an optimal water level control system.
Applsci 14 00512 g005
Figure 6. Aerial photograph of the micro-hydropower plant.
Applsci 14 00512 g006
Figure 7. The different elements of the Barreda micro-hydropower plant.
Applsci 14 00512 g007
Figure 8. Schematic drawing of the arrangement of the measuring devices.
Applsci 14 00512 g008
Figure 9. Flow rates at the Barreda micro-hydropower plant for the days under study.
Applsci 14 00512 g009
Figure 10. Power output by the Barreda micro-hydropower plant using the three control systems.
Applsci 14 00512 g010
Figure 11. Energy generated by the Barreda micro-hydropower plant using the three control systems.
Applsci 14 00512 g011
Figure 12. Efficiency of the Barreda micro-hydropower plant using the three control systems.
Applsci 14 00512 g012
Figure 13. Average efficiency by the Barreda micro-hydropower plant using the three control systems.
Applsci 14 00512 g013
Figure 14. Time variation in the torque.
Applsci 14 00512 g014
Table 1. Operating range of hydro turbines.
Hydraulic TurbineHead (m)Flow Rate (m 3 /s)
Pelton60–20000.02–50
Francis8–8000.2–1000
Cross-flow3–2000.04–12
Kaplan2–700.5–1000
Archimedes screw1–90.25–10
Table 2. Characteristics of the measuring instruments used in the tests.
ParameterApparatusSpecifications
A S T speedDynaparMeasurement range: 0/3000 (r.p.m.)
Precision/resolution: 0.5 (pulses per revolution)
Power outputKPQA-01Measurement range: 0/1 (MW)
Precision/resolution: 0.5 (%)
Water headSITRANS LU150Measurement range: 0.25/5 (m)
Precision/resolution: 0.25 (%)
Flow rateKROHNE Optiflux 2100Measurement range: 0/400 (m 3 /s)
Precision/resolution: 0.3 (m 3 /s)
Table 3. Uncertainty analyses of the measured and calculated parameters.
ParameterParameters Uncertainty (%)
A S T speed0.5
Power output0.5
Water head0.25
Flow rate0.3
Table 4. Energy gain.
DayFlow ConditionsWater Level Control SystemOptimal Water Level Control System
25 May 2023Low flow day−10.94%0.5%
26 June 2023High flow day−2.88%0.31%
Table 5. Average efficiency gain.
DayFlow ConditionsWater Level Control SystemOptimal Water Level Control System
25 May 2023Low flow rates−14.91%0.06%
26 June 2023High flow rates−5.04%−0.82%
Disclaimer/Publisher’s Note: The statements, opinions and data contained in all publications are solely those of the individual author(s) and contributor(s) and not of MDPI and/or the editor(s). MDPI and/or the editor(s) disclaim responsibility for any injury to people or property resulting from any ideas, methods, instructions or products referred to in the content.

