1. Introduction
Within the realm of complementary metal oxide semiconductor microelectromechanical systems (CMOS-MEMS) fabrication, following the construction of CMOS circuitry upon the silicon substrate, MEMS structures (e.g., sensors, actuators) are subsequently established atop this circuitry. However, this integration process frequently necessitates modifications to the underlying layers [
1], or the formation of intricate features that are potentially unattainable through conventional lithography or etching alone. In such scenarios, laser ablation emerges as a valuable tool. The advantageous nature of laser ablation in post-CMOS-MEMS processing stems from its inherent precision, minimal collateral damage to surrounding regions, and its versatility in addressing a diverse range of materials commonly employed in MEMS fabrication. Nevertheless, meticulous control over laser parameters such as power, wavelength, and pulse duration is paramount to mitigate the potential for undesirable effects, including thermal damage and unintentional material alterations.
The emergence of laser ablation in the 1960s, coinciding with the development of lasers, initially served as a cornerstone for fundamental research in physics, particularly in understanding laser-material interactions. Early applications focused on ablating or removing material from surfaces using high-powered lasers. Subsequent advancements in laser technology propelled the development of diverse laser types, each with unique characteristics and applications. Excimer lasers, for instance, with their short wavelengths and high energies, excel at precise material removal [
2]. This technological evolution broadened the reach of laser ablation into various fields, including microelectronics, semiconductor fabrication, medical device manufacturing [
3], and cultural heritage preservation. Within the realm of material processing, laser ablation has become a pivotal technique for micromachining, surface structuring, thin film deposition, and even micro/nano-scale feature creation with intricate patterns. Ongoing research and development in laser technology continue to refine laser ablation methods. The introduction of new laser sources, such as femtosecond lasers, enables even finer control and minimal thermal damage, unlocking the potential for novel applications and deeper integration across various industries.
Our investigation leverages the TSMC/TSRI D35 common use process, which employs distinct materials for each layer (poly, oxide, via, metal, and silicon nitride (passivation)) to accommodate diverse design configurations. We meticulously fine-tuned a comprehensive array of laser parameters encompassing wavelengths, energy levels, interval time, pulse shots, and pad position, with the explicit objective of precisely removing silicon nitride [
4]. The unique properties of Si
3N
4, including its high mechanical strength, thermal stability, chemical inertness, and superior electrical insulating capabilities, have propelled its widespread adoption across various industries. In microelectronics, Si
3N
4 serves as a crucial passivation layer, insulator, or mask material due to its exceptional electrical insulation properties, safeguarding underlying semiconductor devices from external influences. Furthermore, its compatibility with CMOS technology makes Si
3N
4 an extensively utilized structural material in MEMS fabrication, offering both mechanical stability and resilience, while seamlessly integrating with the underlying CMOS circuitry.
Prior to the widespread adoption of laser ablation for Si3N4 removal in post-processing of CMOS-MEMS devices, several alternative methods were employed. Chemical etching, utilizing solutions such as hydrofluoric acid (HF), offered selective removal of silicon nitride while minimizing effects on other materials. Dry etching techniques, including reactive ion etching (RIE) and plasma-enhanced chemical vapor deposition (PECVD), were also implemented. These methods relied on plasma reactions for targeted removal of Si3N4. Mechanical approaches, such as polishing and grinding, were occasionally employed, albeit with limitations in their precision. Although chemical and dry etching techniques demonstrated effectiveness, they often struggled to achieve the precise and selective Si3N4 removal observed with laser ablation in CMOS-MEMS processing, particularly with regard to minimizing impacts on adjacent materials.
The coalescence of advanced artificial intelligence (AI) with domain-specific engineering expertise is significantly redefining the trajectory of contemporary engineering practice. Recent advancements in temperature monitoring [
5], indoor air quality monitoring [
6], thermal noise decoupling [
7,
8], and combustion monitoring [
9] exemplify the transformative impact of AI across diverse engineering applications. The strategic integration of field-specific data and features within intelligent models unlocks unprecedented levels of automation and predictability. This synergistic dynamic empowers engineers to optimize resource allocation, enhance design and operational efficiency, automate routine tasks, and unveil novel insights through data-driven discovery.
This study uses the XGBoost algorithm [
10] compared with famous classifiers, which are Logistic Regression [
11] and Random Forest [
12] in supervised machine learning (ML) to categorize the quality of laser ablation on Si
3N
4 film. The study imports the dataset into the unsupervised ML k-means algorithm to label the data by a k value. This intrinsic property of the k value is elaborated by the data science analysis.
XGBoost, Logistic Regression, and Random Forest stand out as widely recognized and highly effective techniques in predictive modeling tasks. Developed by Chen and Guestrin (2016) [
10], XGBoost is a gradient boosting algorithm known for its exceptional performance in a range of applications, including regression, classification, and ranking.
XGBoost excels in its capacity to tackle diverse and high-dimensional datasets while mitigating overfitting, a ubiquitous challenge in machine learning. Leveraging an ensemble of decision trees, XGBoost iteratively optimizes a loss function, enabling it to capture complex relationships and achieve state-of-the-art performance. While other algorithms possess distinct strengths, XGBoost offers a compelling combination of versatility and accuracy. Logistic Regression, for instance, presents a clear and interpretable model for binary classification tasks. Its simplicity facilitates understanding the underlying relationships within the data. Random Forest, conversely, capitalizes on an ensemble of decision trees to bolster predictive power and manage overfitting, offering an alternative approach to complex problems.
Due to its applicability in contemporary booming industries such as system on chip (SoC), chip on wafer on substrate (CoWoS) packaging, and CMOS-MEMS chip fabrication, laser micromachining has garnered significant global attention and resources in semiconductor post-processing. The research led by J.A. Grant-Jacob [
13,
14] at the Optoelectronics Research Centre, University of Southampton, UK, and Yohei Kobayashi [
15,
16] at the University of Tokyo, Japan, stand at the forefront. Both teams employ deep learning to simulate images of laser ablation, significantly advancing the fundamental models of laser ablation technology. However, the major limitation of deep learning lies in the discernibility of features. Neither of the two teams has been able to propose distinctly identifiable features linking the practical operational parameters of laser ablation to the final ablation quality. In contrast, when using operational parameters as features for machine learning, the quality of laser ablation, whether good or bad, can be confirmed by more precise machine learning algorithms. This approach identifies the crucial parameters in the practical engineering of laser ablation, leading to immediate effects on the advancement of laser ablation practice.
3. Results and Discussion
3.1. Examples
Table 1 lists six samples from three Si
3N
4 pads in this study. Energy, interval time, pulse shots, and pad position were the four parameters adopted, with microscopy photos and laser ablation quality
reb attached. With operating energy of 0.378 mJ and pulse shot of 1 time, regardless of interval time, the ablation results show large portions of silvery areas. This is in contrast with our study conducted in 2022, where Tsai and Chan explored the impact of 532 nm laser energy ranging from 0.138 to 0.318 mJ and pulse shots set at 5, revealing significant areas characterized by a distinct dark coloration [
19]. The cause of such disparity is owing to the pulse shot count. Across each pad in
Table 1, the discrepancy of
reb is not substantial at all, both from visual inspection and from
reb calculation. This suggests a saturation in
reb.
3.2. Correlation Analysis
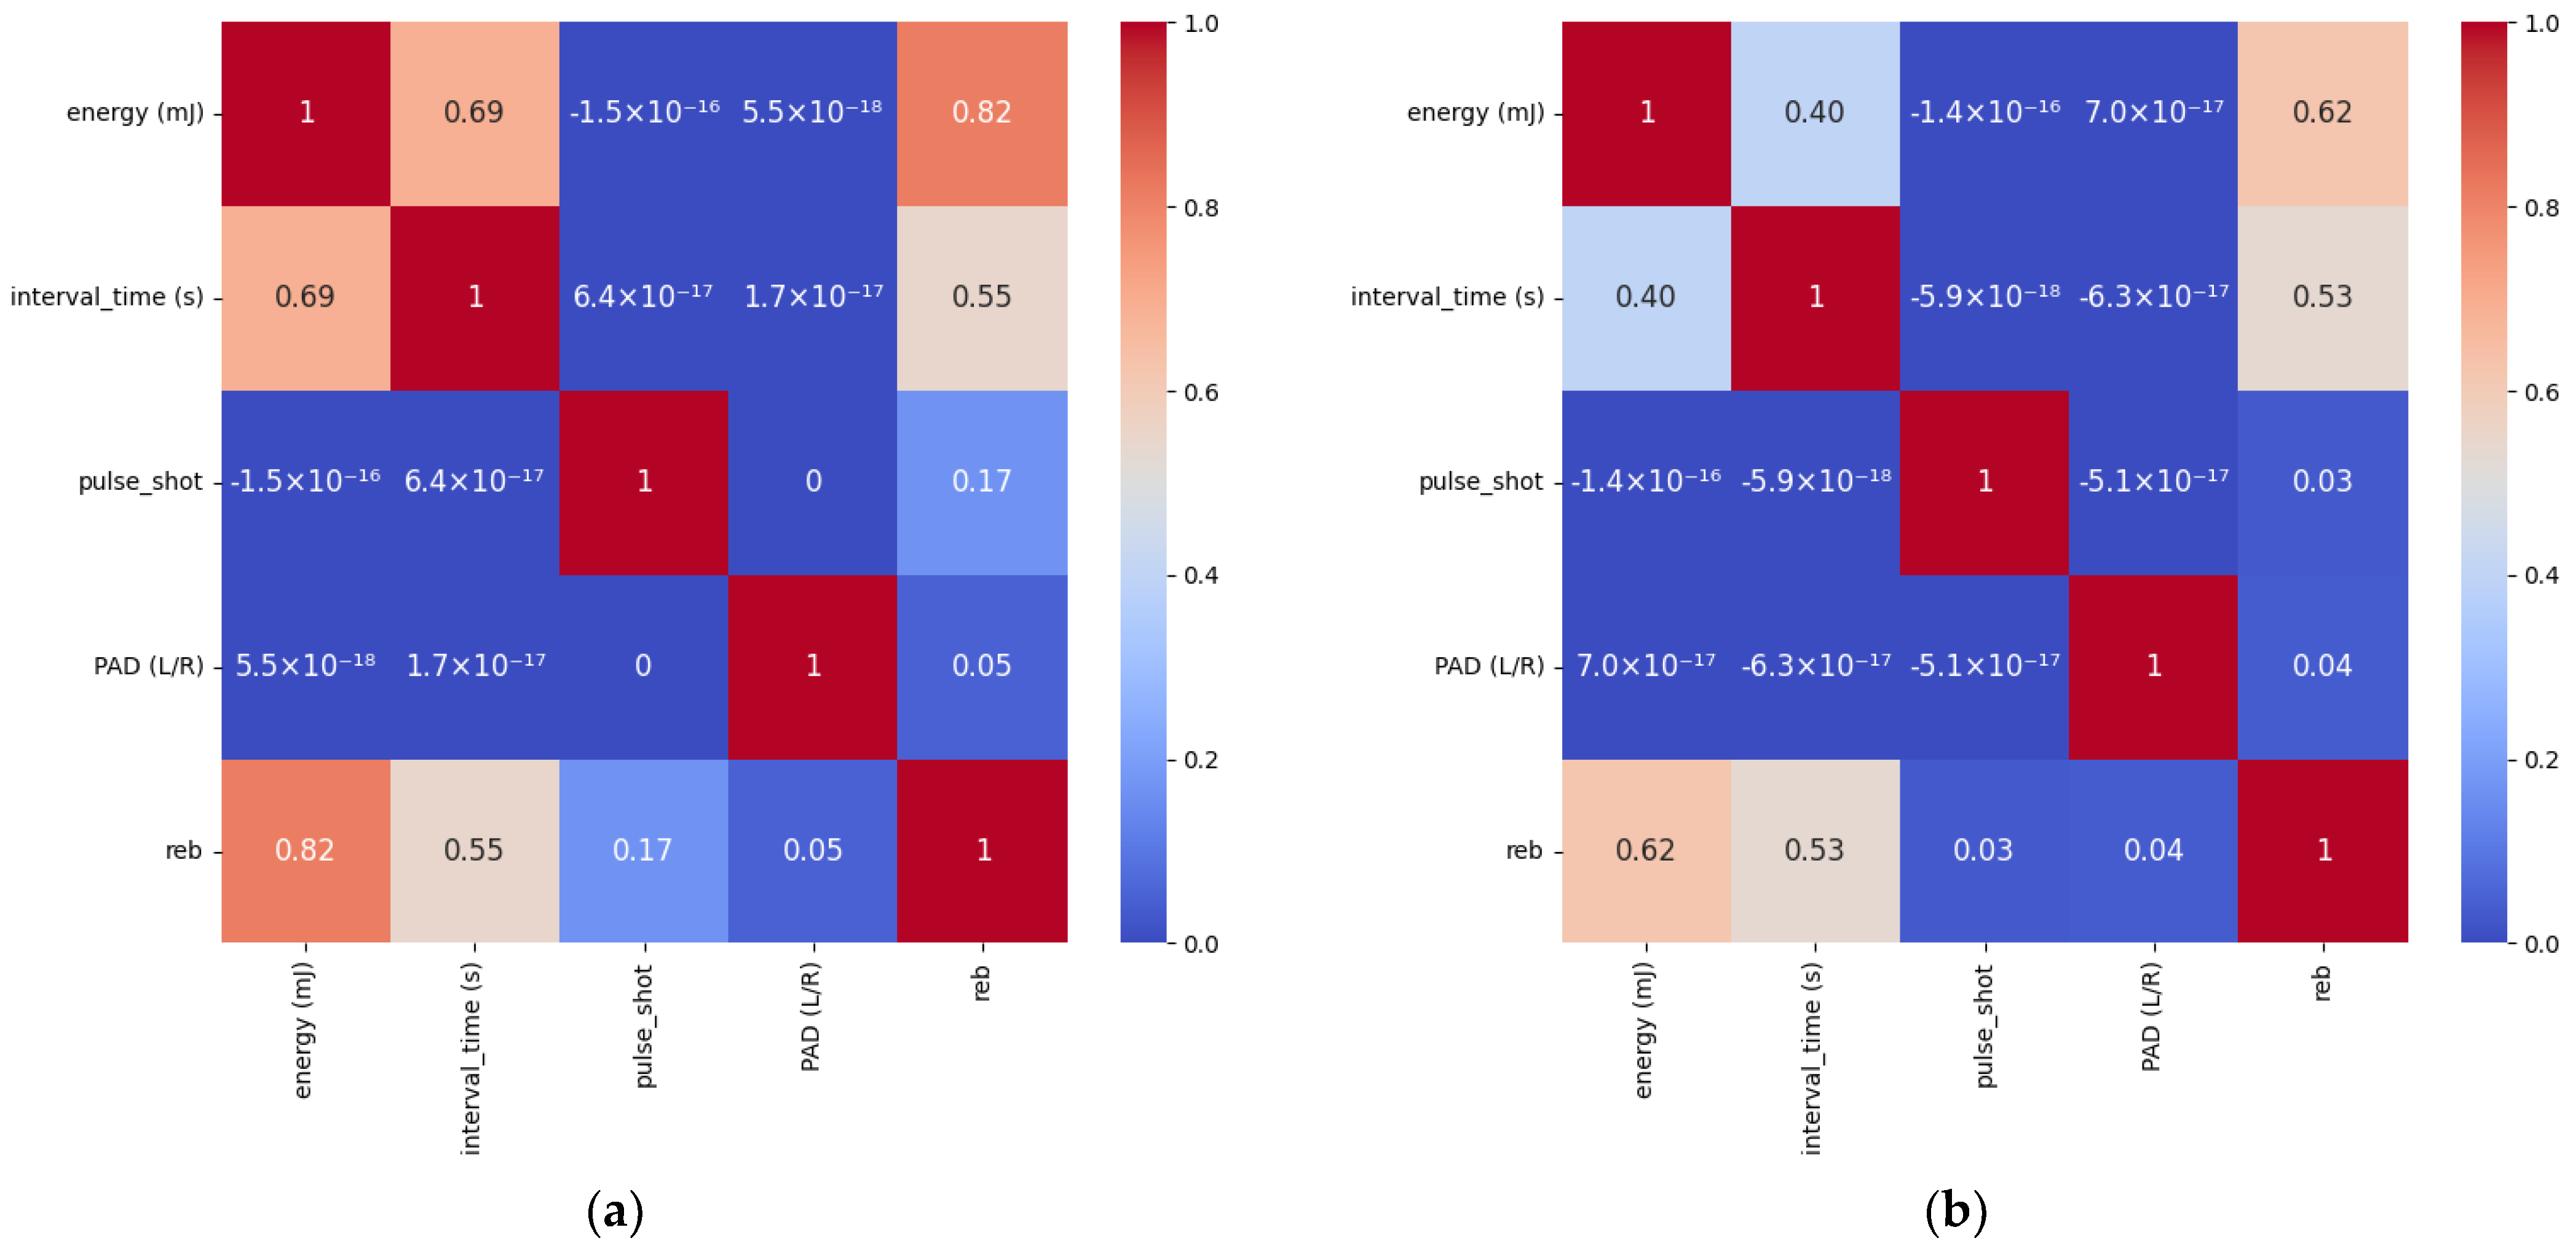
The heatmap in
Figure 4a, derived from the 90-sample dataset, reveals the relationships among the features: energy, interval time, pulse shot, pad position, and laser ablation quality
reb. Pearson correlation coefficients were employed to quantify the associations between these pairs of variables [
22].
A strong positive association was observed between energy and interval time with respect to reb, as evidenced by their respective correlation coefficients of 0.82 and 0.55. This suggests that higher energy levels and longer interval times are significantly linked to increased reb. Pulse shot and pad position, however, exhibited relatively modest correlations with reb, at 0.17 and 0.05, respectively. Furthermore, pulse shot and pad position displayed minimal linear relationships with other features, as indicated by their near-zero correlations.
The heatmap of the 48-sample dataset,
Figure 4b, provides a nuanced perspective on the interplay between the features and the laser ablation quality
reb. Pearson correlation coefficients revealed moderate positive associations, with energy and interval time exhibiting correlations of 0.62 and 0.53, respectively, with laser ablation quality
reb.
Comparing the heatmap of
Figure 4b to
Figure 4a reveals a substantial decrease in the correlation between energy and
reb, dropping from 0.82 to 0.62. Additionally, the association between interval time and
reb exhibited a significant reduction, from 0.55 to 0.53. Furthermore,
reb displays a correlation of 0.032 with pulse shot and 0.036 with pad position, both of which are relatively weak associations. The correlation of
reb with pulse shot experienced a noticeable difference, from 0.17 to 0.032. The correlation of interval time with energy also experienced a noticeable difference, from 0.69 to 0.4. It is worth noting that pulse shot and pad position continue to display correlations close to zero with other features, indicating little to no linear relationship with them.
The 90-sample dataset encompasses five distinct energy levels, whereas the 48-sample dataset only contains two. Regarding interval times, the 48-sample dataset exhibits four unique values, while the 90-sample dataset has three. The enhanced range of energy levels in the 90-sample dataset contributes to a more accurate correlation coefficient of 0.82 between energy and reb. Likewise, the broader range of interval times in the 48-sample data set fosters a more informative correlation coefficient of 0.53 between interval time and reb.
3.3. Critical Point of Interval Time
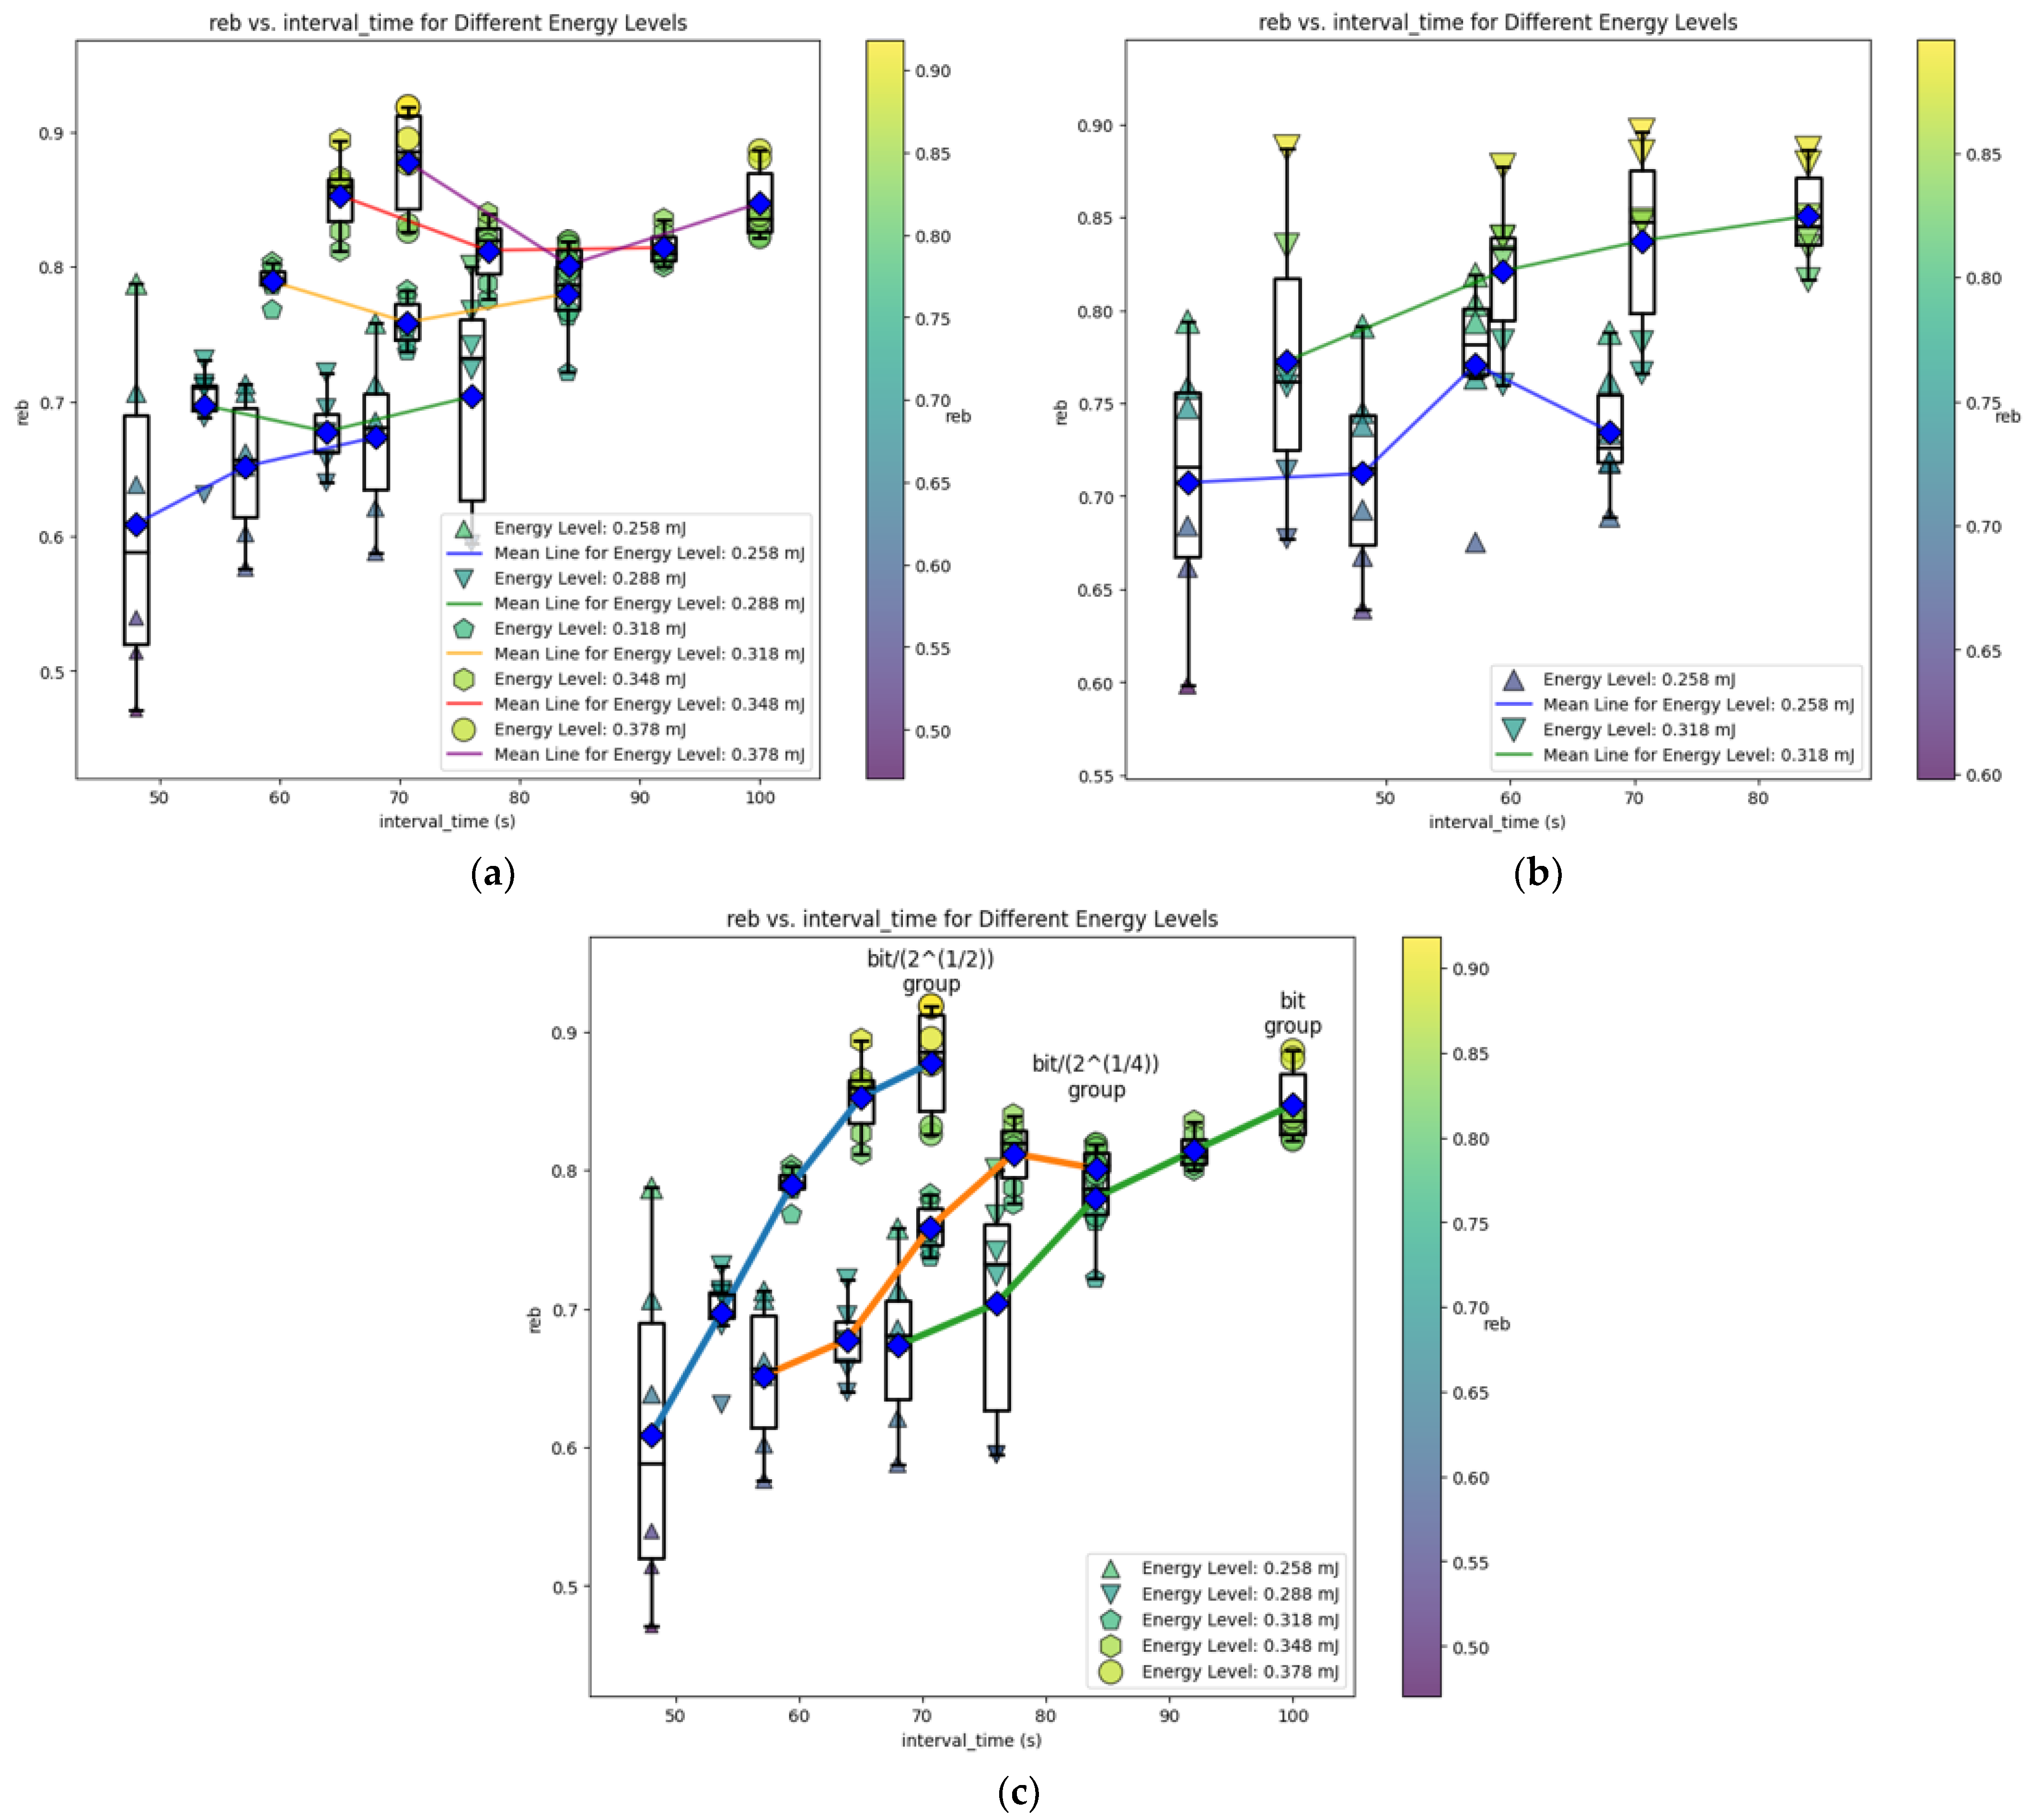
Figure 5a,b depicts the relationship between
reb (on the y-axis) and varying levels of interval time and energy.
Figure 5a is derived from a dataset of 90 samples, displaying data for three distinct interval times and five energy levels, resulting in a total of 15 boxes. Within each box, the mean is denoted by a blue diamond. Notably, blue diamonds with the same energy level are connected, forming five distinct lines. Each line connects three means corresponding to the same energy level.
In contrast,
Figure 5b is acquired from a dataset of 48 samples and presents data for two energy levels and four unique interval times, yielding a total of eight boxes. Similarly, the blue diamond represents the mean within each box. In this figure, two lines connect the means of the same energy level.
In both figures, there is a clear upward trend, indicating that as both interval time and energy level increase, reb tends to also increase.
To visualize the bit, bit/∜2, and bit/√2 group in
Figure 5c, the bit represents a line connecting the rightmost blue diamonds for each of the five energy levels. Similarly, the bit/∜2 forms another line connecting the five middle blue diamonds for each energy level. Likewise, the bit/√2 is a line connecting the five leftmost blue diamonds of the five energy levels.
Upon observing
Figure 5a, the mean line for the 0.258 mJ energy level shows an increasing trend with interval time. Specifically,
reb initially rises with interval time, indicating a positive response. However, this effect diminishes as interval time increases, resulting in a decreasing rate of increase in
reb. In contrast, the other energy levels in
Figure 5a demonstrate a V-shaped curve. This suggests the presence of an energy threshold
Eth for laser ablation, likely situated between 0.258 mJ and 0.288 mJ. Beyond this threshold, prolonging the interval time may not significantly contribute to the recovery of pulse laser energy, thereby limiting
reb enhancement. For various laser energies, when the energy exceeds 0.258 mJ, there exists a critical value of interval time (ti)c, at which the
reb value is relatively low. As shown in
Table 2, (ti)c is 63.9 s for 0.288 mJ, 70.6 s for 0.318 mJ, 77.4 s for 0.348 mJ, and 84.1 s for 0.378 mJ. The (ti)c were observed in the bit/∜2 group.
In
Figure 5b, the mean line for the 0.318 mJ energy level exhibits a pattern similar to that of the 0.258 mJ energy level in
Figure 5a. Initially, it rises, but the increase gradually approaches saturation. This is in contrast to the mean line for the 0.318 mJ energy level in
Figure 5a, where the line follows a V-shaped curve. In
Figure 5b, the mean line for the 0.258 mJ energy level stands out with a sudden spike at an interval time of 57.2 s, creating a distinctive curve not replicated in the other lines of both
Figure 5a,b. There is no (ti)c observed from the 48-sample dataset.
Figure 5b reveals a clear similarity between the behavior of the mean line for the 0.318 mJ energy level and that of the 0.258 mJ energy level in
Figure 5a. Both exhibit an initial rise, followed by a gradual saturation effect. This contrasts with the V-shaped trajectory observed for the 0.318 mJ energy level in
Figure 5a. A defining characteristic of
Figure 5b is the prominent spike exhibited by the mean line for the 0.258 mJ energy level at an interval time of 57.2 s. This distinct behavior is not replicated in any other lines across both figures. Notably, the box plot of the 48-sample dataset yielded no (ti)c observations.
3.4. Delta reb
For each of the 15 combinations of energy levels and interval times (15 boxes) in the dataset of 90 samples, a corresponding range of
reb values (Δ
reb) was calculated and is depicted in
Figure 6a. The outlier at the leftmost point (an upright triangle) for the energy level 0.258 mJ was excluded in the regression line calculation. Notably, we observe a change in slope (dΔ
reb/dt) from positive to negative in the regression lines.
Between laser energies of 0.32 mJ and 0.36 mJ there is an invariant point of energy, characterized by a constant Δreb across all pulse intervals, forming a horizontal line. Under such energy operation, the variation (Δreb) of reb is independent of the interval time. Higher energy levels with longer pulse intervals lead to higher reb values and reduced variability, thereby maintaining high-quality laser ablation.
Conversely, the findings depicted in
Figure 6b, which are based on the 48-sample dataset, diverge from those in
Figure 6a. Notably, the regression lines for both energy levels, 0.258 mJ and 0.318 mJ, exhibit an identical downward trend in Δ
reb as the pulse interval increases.
Considering the variation in Δ
reb, to maintain Δ
reb below 0.15, green laser ablation of Si
3N
4 at operating energies of 0.258–0.378 mJ can adopt a baseline interval time of the initial baseline multiplied by 1/∜2, as shown in
Figure 6c. Additionally, for the operating energies of 0.288–0.378 mJ during Si
3N
4 laser ablation, Δ
reb can be kept below 0.1.
The slope values of the regression lines from
Figure 6a,b are plotted with energy to generate
Figure 7a,b. In
Figure 7a, the plot of dΔ
reb/dt versus energy intersects the x-axis at (0.350 mJ, 0), indicating an energy level at which
reb is independent of interval time.
In
Figure 7b, however, when plotting the two negative slope values and extending the regression line to intersect the x-axis, it yields a negative energy level of −0.197 mJ. This value is inapplicable within the scope of this study.
3.5. Supervised Learning: Classification
At a test size of 0.20, with k-means method k = 5, then f = 4, the accuracies of Logistic Regression and Random Forest are 0.61 and 0.67, respectively. However, using XGBoost increased the accuracy to 0.78. Therefore, this study adopts XGBoost as the algorithm to analyze the experimental data obtained.
Figure 8a presents the comparative performance of three classification algorithms—Logistic Regression, Random Forest, and XGBoost—in response to diverse test sizes. The algorithms were configured as follows: Logistic Regression was allotted a maximum of 1000 iterations for convergence, Random Forest employed an ensemble of 100 decision trees (n_estimators = 100), and XGBoost utilized the default value of 100 estimators. The x-axis unveils the spectrum of test sizes, spanning from 0.20 to 0.40, while the y-axis illustrates the corresponding accuracy scores. Notably, Logistic Regression consistently exhibits the lowest accuracy among the three models. At a test size of 0.30, a notable crossover occurred where Random Forest surpassed XGBoost, becoming the model with the highest accuracy. The highest accuracy among the three models occurs for the XGBoost algorithm, with an accuracy of 0.74 at a test size of 0.25. For Random Forest, the accuracy varies between 0.56 and 0.67, indicating a consistent performance across different test sizes. XGBoost consistently demonstrates competitive performance, with accuracies ranging from 0.53 to 0.74, showcasing its effectiveness under different test size conditions. XGBoost displays a general decreasing trend in accuracy as the test size increases, suggesting a potential sensitivity to data size. On the other hand, Random Forest maintains a relatively stable trend, indicating robustness to variations in test size.
Figure 8b illustrates the performance of three classification algorithms using the percentile method. Similar to
Figure 8a, Logistic Regression consistently exhibits the lowest accuracy among the three models. This indicates its limited effectiveness in accurately categorizing samples based on the provided features. Notably, at a test size of 0.20, XGBoost demonstrates the highest accuracy with an impressive 0.78. As the test size increases, Logistic Regression shows a gradual decline in accuracy, suggesting potential sensitivity to data size. Random Forest maintains a relatively stable trend in accuracy across the entire range of test sizes, performing between 0.56 and 0.67. This indicates its robustness to variations in test size. Meanwhile, XGBoost starts strong, with a high accuracy of 0.78 at a test size of 0.20. However, it experiences a slight decrease as the test size increases, hinting at a potential sensitivity to data size. Nevertheless, even at the largest test size of 0.40, XGBoost maintains a competitive accuracy of 0.67. XGBoost consistently outperforms Random Forest.
Figure 8c presents the performance of three classification algorithms utilizing a forced partition into five clusters. Consistent with previous observations in
Figure 8b, XGBoost consistently outperforms Random Forest across the entire range of test sizes. It is noteworthy that the accuracies obtained in
Figure 8c are notably lower compared to those in
Figure 8a,b. Despite these lower accuracies, the relative performance of the models remains consistent, underscoring the effectiveness of XGBoost in this dataset. Logistic Regression consistently yields lower accuracy compared to the other models. At a test size of 0.20, XGBoost exhibits the highest accuracy, reaching 0.61. As the test size increases, Logistic Regression shows a gradual decline in accuracy, indicating a potential sensitivity to data size. Both Random Forest and XGBoost maintain relatively stable trends in accuracy across the range of test sizes. Random Forest performs between 0.41 and 0.52, while XGBoost achieves accuracies ranging from 0.44 to 0.61.


