1. Introduction
With the discovery of high-temperature (high-
Tc) superconductivity [
1], it became possible, in principle, to fabricate Josephson junctions (JJs) [
2] with higher Josephson frequencies
fj than those of low-
Tc superconductor junctions. Due to small coherence lengths, even grain boundaries in high-
Tc materials have the properties of weak links and JJs [
3]. The most common high-
Tc junctions are artificial bicrystal JJs formed by the coalescence of two misoriented high-
Tc films [
3]. The bicrystal junction consists of a structurally distorted interface in the middle and two adjacent layers of undistorted material with a reduced oxygen content and, accordingly, a depleted charge region [
3]. Such a boundary is a potential barrier for the tunneling Cooper pairs and quasiparticles.
Conventional bicrystal JJs are fabricated from two
c-axes high-
Tc films. They have characteristic voltages
IcRn up to 3 mV, which is significantly lower than the gap voltages 2Δ/e for high-
Tc materials. In these junctions, the dependence of the supercurrent
Is on the phase difference φ of the order parameters turned out to be close to sinusoidal, as in classical tunnel JJs. Moreover, the dynamics of such JJs is close to a simple resistively shunted junction (RSJ) model, where, along with the supercurrent
Is =
IcSinφ, the quasiparticle current enters into the total current in the form of Ohm’s law:
Iq =
V/
Rn = (ħ/2e
Rn)(dφ/d
t) [
4]. These circumstances played an important role when using JJs as frequency-selective detectors and served as a stimulus for intensive studies of spectroscopic applications of high-
Tc JJs in a broad spectral range (see, for example, [
5]).
The further development of these works has already made possible several spectroscopic applications of high-
Tc JJs. Among them are the following: the identification of liquids by their sub-THz reflection [
6], the detection of broadband radiation from quasiparticle-injected nonequilibrium superconductors [
7] and photoconductive antennas excited by femtosecond optical pulses [
8], and the detection of 500 GHz radiation from a Bi
2Sr
2CaCu
2O
8 intrinsic Josephson junction [
9]. In high-energy physics, it was possible to substantiate and partially implement high-
Tc JJs for spectral analysis of transition radiation from relativistic electron bunches in linear accelerators [
10] and cyclotron electron emission from high-temperature plasma in tokamaks [
11]. Previous studies of output sub-THz and THz radiation from commercial sources [
12,
13,
14,
15,
16] with high-
Tc JJs have paved the way for the spectral characterization of new THz sources based on quantum cascade lasers (QCLs) [
17,
18]. Recently, using high-
Tc JJs, subterahertz spectral lines have been found in the emission of free-running THz quantum cascade lasers (QCLs) due to difference-frequency generation (DFG) in the QCL active region [
19].
Application of high-
Tc JJs for the characterization of QCLs radiation looks very promising and competitive because these spectral measurements are in the frequency domain [
18] and possess the potential to operate both in the sub-THz and THz ranges [
17,
18,
19]. The latter circumstance is for verification in various configurations of high-
Tc JJs with proper tuning of relevant parameters of the junctions. Previously, Josephson bicrystal junctions, consisting of two c-oriented YBa
2Cu
3O
7−x thin-film electrodes, were mainly used for spectroscopic purposes [
5,
6,
7,
8,
9,
10,
11,
12,
13,
14,
15,
16,
17,
18,
19]. The simple bicrystal junction, where the
c-axis epitaxial films grow on each part of the bicrystal substrate, forms an artificial bicrystal boundary by the coalescence of two misoriented
c-axis thin-film parts. This boundary in YBa
2Cu
3O
7−x thin-film acts as a potential barrier for tunneling Cooper pairs and quasiparticles. However, due to the island growth of the
c-axis YBa
2Cu
3O
7−x films, such a bicrystal boundary has a variety of facets with various local misorientations that give rise to an inhomogeneous current distribution [
3,
20].
It is advantageous to use the bicrystal junctions formed by two YBa
2Cu
3O
7−x thin-film electrodes with mutually tilted
c-axes, which leads to more homogeneous current distributions, lower specific resistances
RnA and higher characteristic voltages
IcRn of 7 ÷ 8 mV [
21,
22]. This combination of the electrical parameters of the JJs can result in lower Josephson linewidths δ
f ~
Rn, higher amplitudes of Josephson oscillations
V1 ~
IcRn, and characteristic Josephson frequencies
fc = 2e
IcRn/h. However, it should be taken into account that these Josephson frequencies, although far from the gap frequencies, are close to the frequencies
fk of optical phonons in high-
Tc thin-film electrodes. The amplitudes of Josephson oscillations at the frequencies
fj ≈
fk can weaken due to strong absorption by optical phonons. A negative consequence of this interaction is that a spectrum analyzer using Josephson junctions with high-
IcRn products will be blind near the phonon frequencies
fk. Thus, to find the spectral range of continuous operation of the Josephson spectrum analyzer, one should study the absorption spectra in JJs in situ. In this paper, we use the approach that interaction between Josephson oscillations and optical phonons is accompanied by a localized modification of the dc
I–V curves of JJs around the voltages
Vk = h
fk/2e and the absorption spectra in JJs can be recovered from their dc
I–V curves.
Additional arguments stimulating our study of the interaction of Josephson oscillations with the high-
Tc electrodes come from the current state of far-infrared reflection spectroscopy of collective modes in high-
Tc materials [
23,
24,
25,
26,
27,
28,
29,
30]. Some difficulties in measuring low-frequency dynamic conductivities due to the high reflectivity of the samples when the electric field
E is parallel to the ab-planes and due to diffraction effects at frequencies below 150 cm
−1 (4.5 THz) have been reported [
25,
29]. Josephson spectroscopy applied in situ to high-
Tc materials can be free from these limitations and give additional information on low-frequency collective modes in the electrode materials.
In this paper, the results of the study of YBa2Cu3O7−x bicrystal junctions with mutually tilted c-axes concerning their possible applications in terahertz Josephson spectroscopies are presented.
3. Results
The
I–V curves of fabricated bicrystal YBa
2Cu
3O
7−x junctions were measured in the current-bias mode using a four-probe technique. The differential resistances d
V/d
I have been measured by a current modulation technique with a lock-in amplifier, and differential conductances d
I/d
V= (d
V/d
I)
−1 have been calculated from the measured d
V/d
I. With current modulation not exceeding the thermal currents
Ith = 0.4 µA at
T = 5 K, it was possible to reach the accuracy δ(d
I/d
V)/d
I/d
V not worse than 1% at the amplifier bandwidth of 1 Hz. The voltage (and frequency) accuracy is finite due to voltage fluctuations, and the spectral resolution is due to the broadening of the Josephson linewidth by voltage fluctuations, correspondingly. The frequency accuracy of 1 GHz and spectral resolution of around 10 GHz are the typical values for JJ with
Rn around 1 Ω [
17].
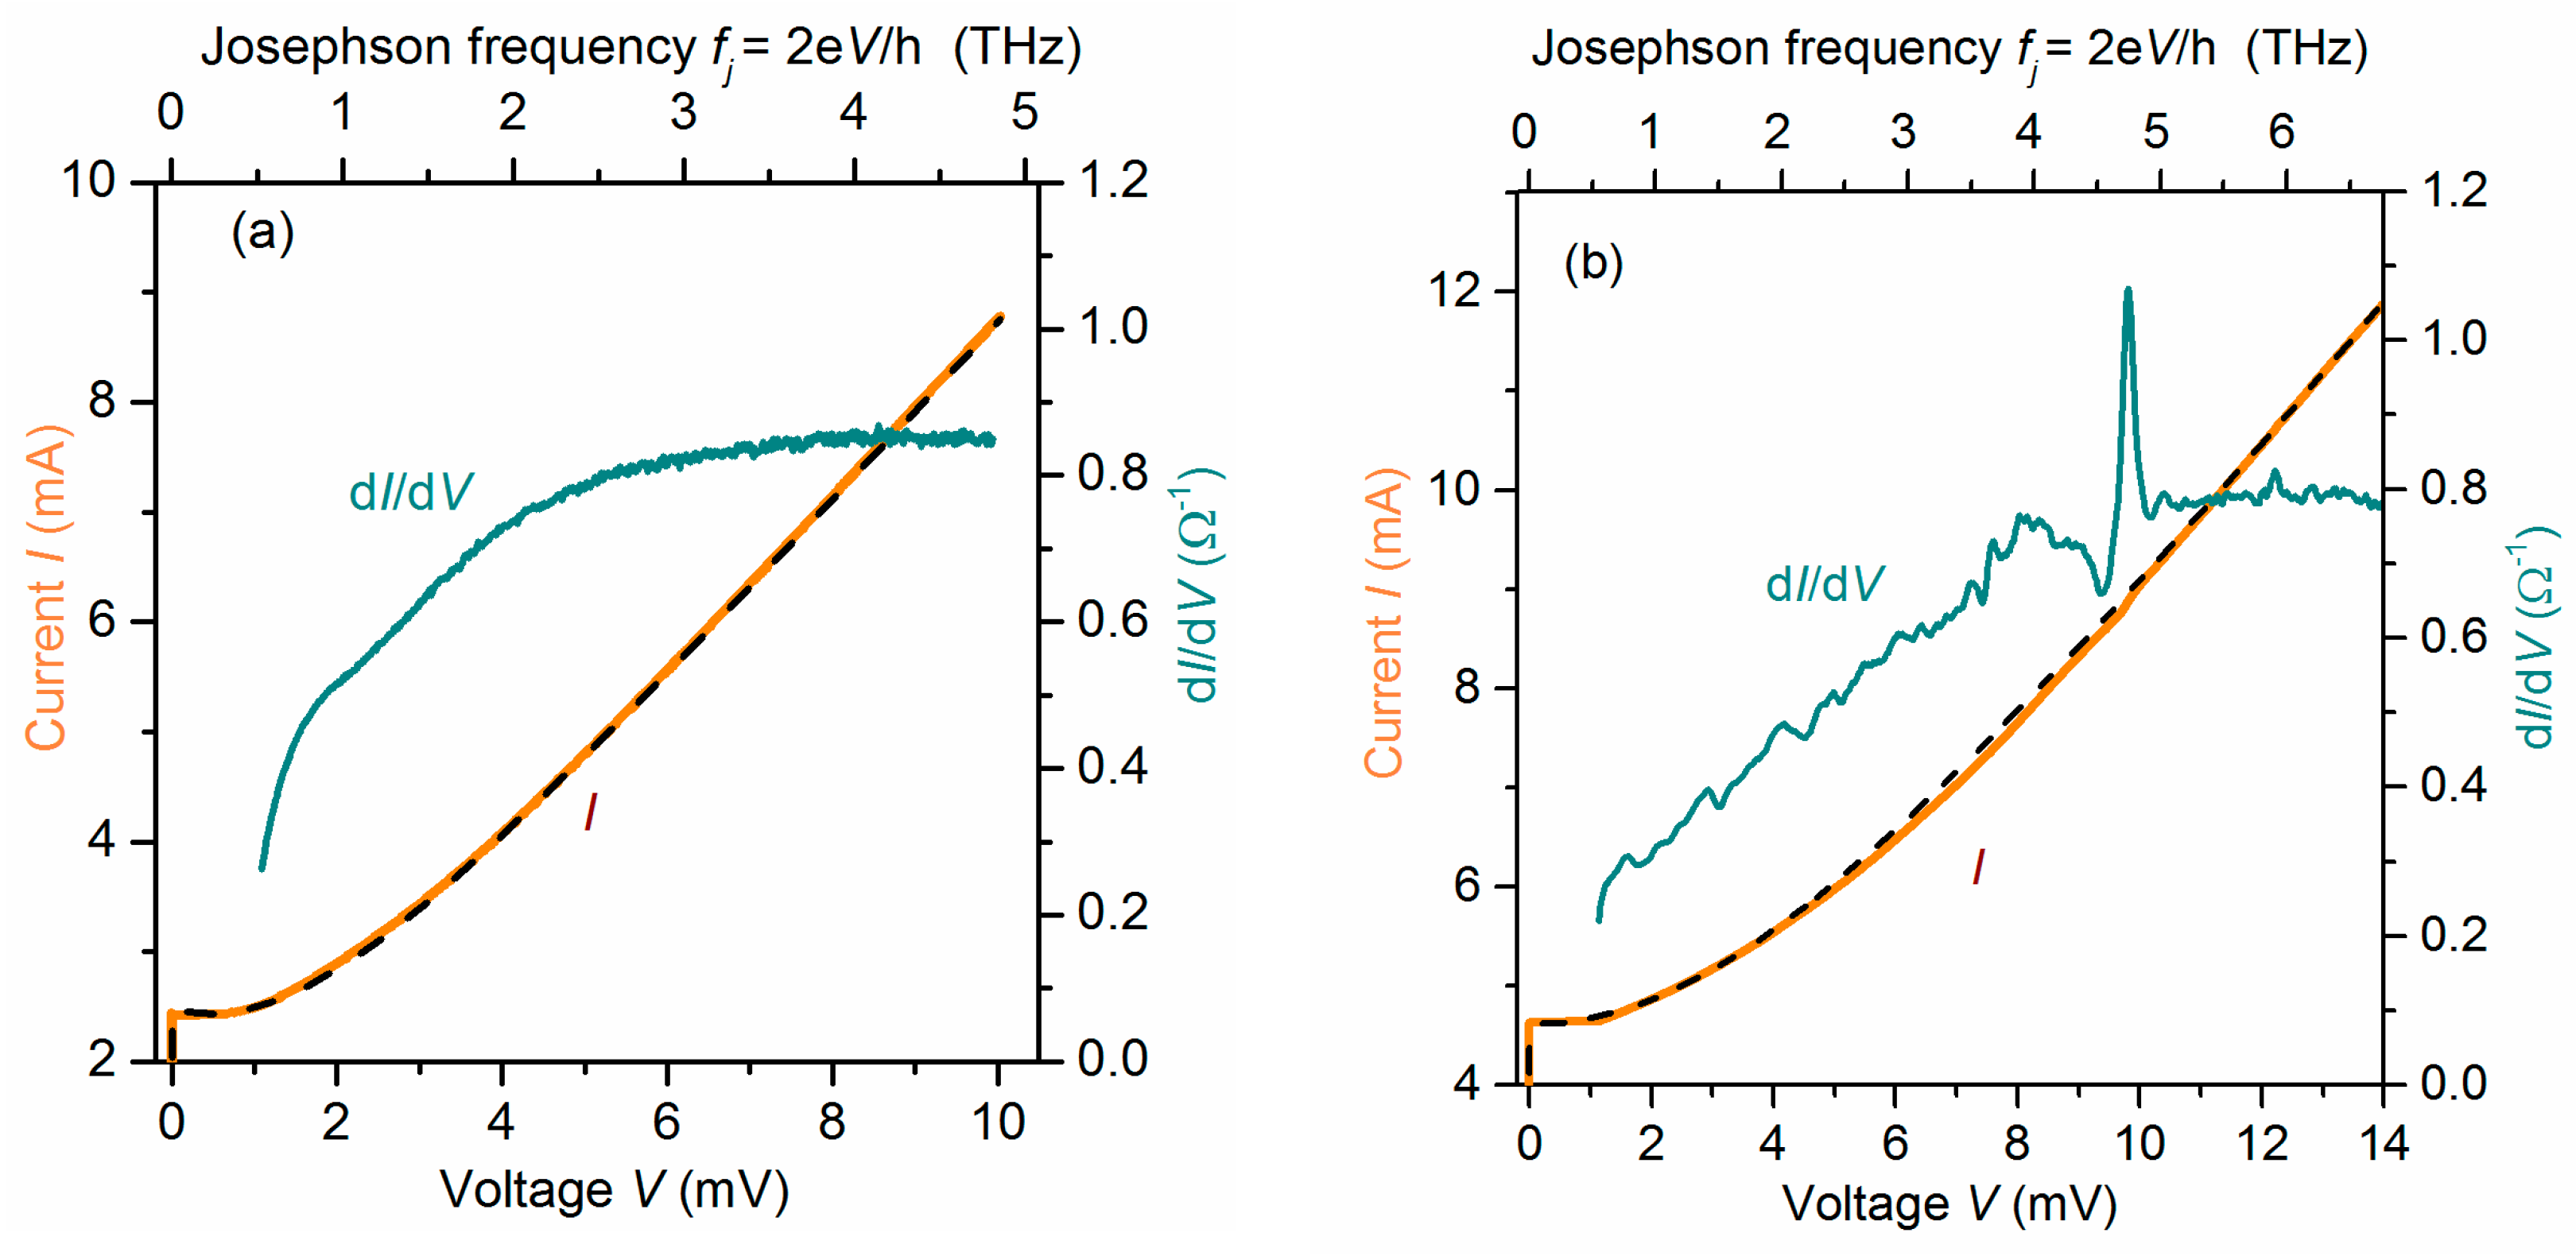
Figure 3 shows the
I–V curve and the dependence of the differential conductance d
I/d
V on the voltage
V for typical bicrystal YBa
2Cu
3O
7−x junctions fabricated from two
c-axis thin films (a) and two films with mutually tilted
c-axes (b). The data in
Figure 3a belong to the JJ yd007201 on a 2 × 14° bicrystal NdGaO
3 substrate at
T = 5 K. The data in
Figure 3b correspond to the JJ yd502021 on a 2 × 12° bicrystal SrTiO
3 substrate at
T = 10 K.
The
I–V curve in
Figure 3a is close to that in the RSJ model, with the resistance
Rn = 1.2 Ω and the characteristic voltage
IcRn = 3 mV (see the dashed line). The dependence of d
I/dV vs. the voltage
V for this sample shows no localized features and no noticeable deviations from the RSJ model. However, the
I–V curve and the dependence of d
I/d
V vs. the voltage
V for the JJ with mutually tilted
c-axes (
Figure 3b) demonstrate that there are noticeable deviations from the RSJ model, localized at voltages around 9.4 mV, as well as weaker deviations at voltages around 11.8 mV and 7.4 mV. There are also less intensive features at lower voltages. The noted features on the first derivatives of the
I–V curves have an odd-symmetric form, which indicates the localized dips in the
I–V curve. Indeed, on the
I–V curve in
Figure 3, one can distinguish a dip at voltages of about 9.4 mV. The
I–V curve in
Figure 3b has been fitted to the RSJ model with the resistance
Rn = 1.3 Ω and the characteristic voltage
IcRn = 6 mV (see the dashed line).
The features on the
I–V curves of YBa
2Cu
3O
7−x bicrystal JJs with mutually tilted
c-axes are reproducible in their positions on the voltage axis when fabricating JJs of various widths on various substrates (SrTiO
3 or NdGaO
3), and also at different temperatures.
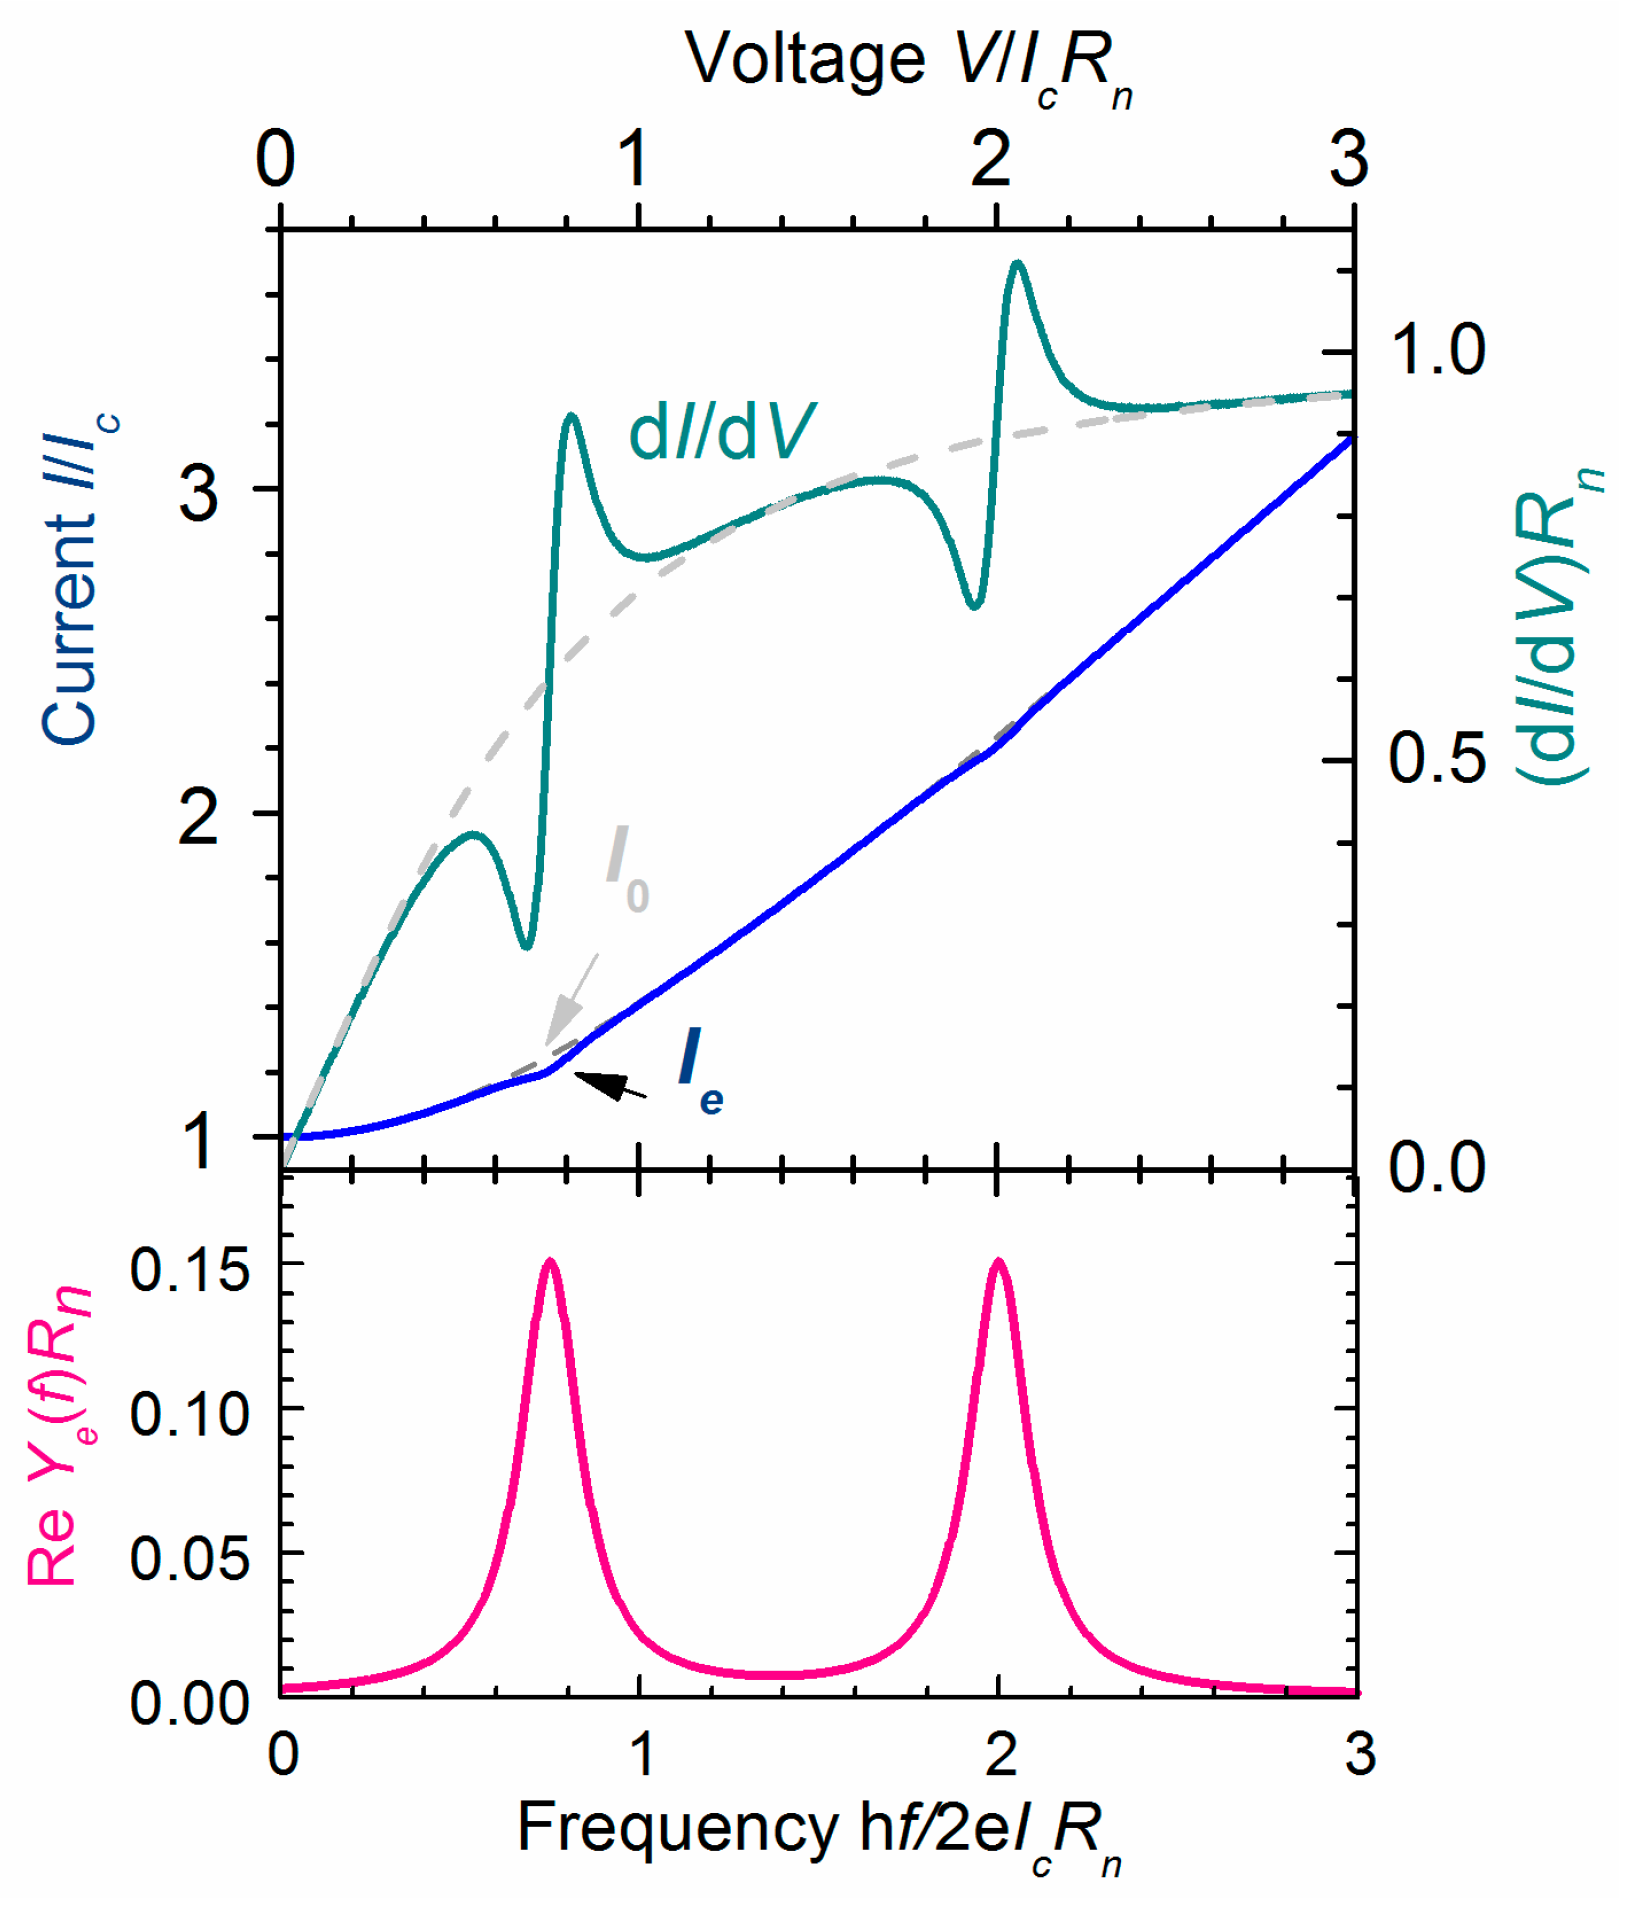
Figure 4 shows the dependences of the differential conductances for two JJs with different widths (a) and for one JJ at two temperatures (b). From Equation (2), it follows that the increase in losses Re
Ye(
f) at some frequencies results in a local decrease of the current Δ
I(
V) through the JJ. If the loss function Re
Ye(
f) has a Gaussian or Lorentzian form, then its mapping on the dependence of d
I/d
V on the voltage
V should have an odd-symmetric form (see a green curve on the top panel of
Figure 2). At low voltages, it deviates towards a smaller d
I/d
V, referring to the dependence d
I0/d
V vs.
V (a dashed grey curve on the top panel in
Figure 2), and then, with increasing voltage—towards higher d
I/d
V. In this work, localized resonant features in
dI/d
V vs.
V of odd symmetry, high reproducibility, and various intensities are of interest due to collective modes in high-
Tc material of JJ. The extended features of low reproducibility and low intensity can be considered later.
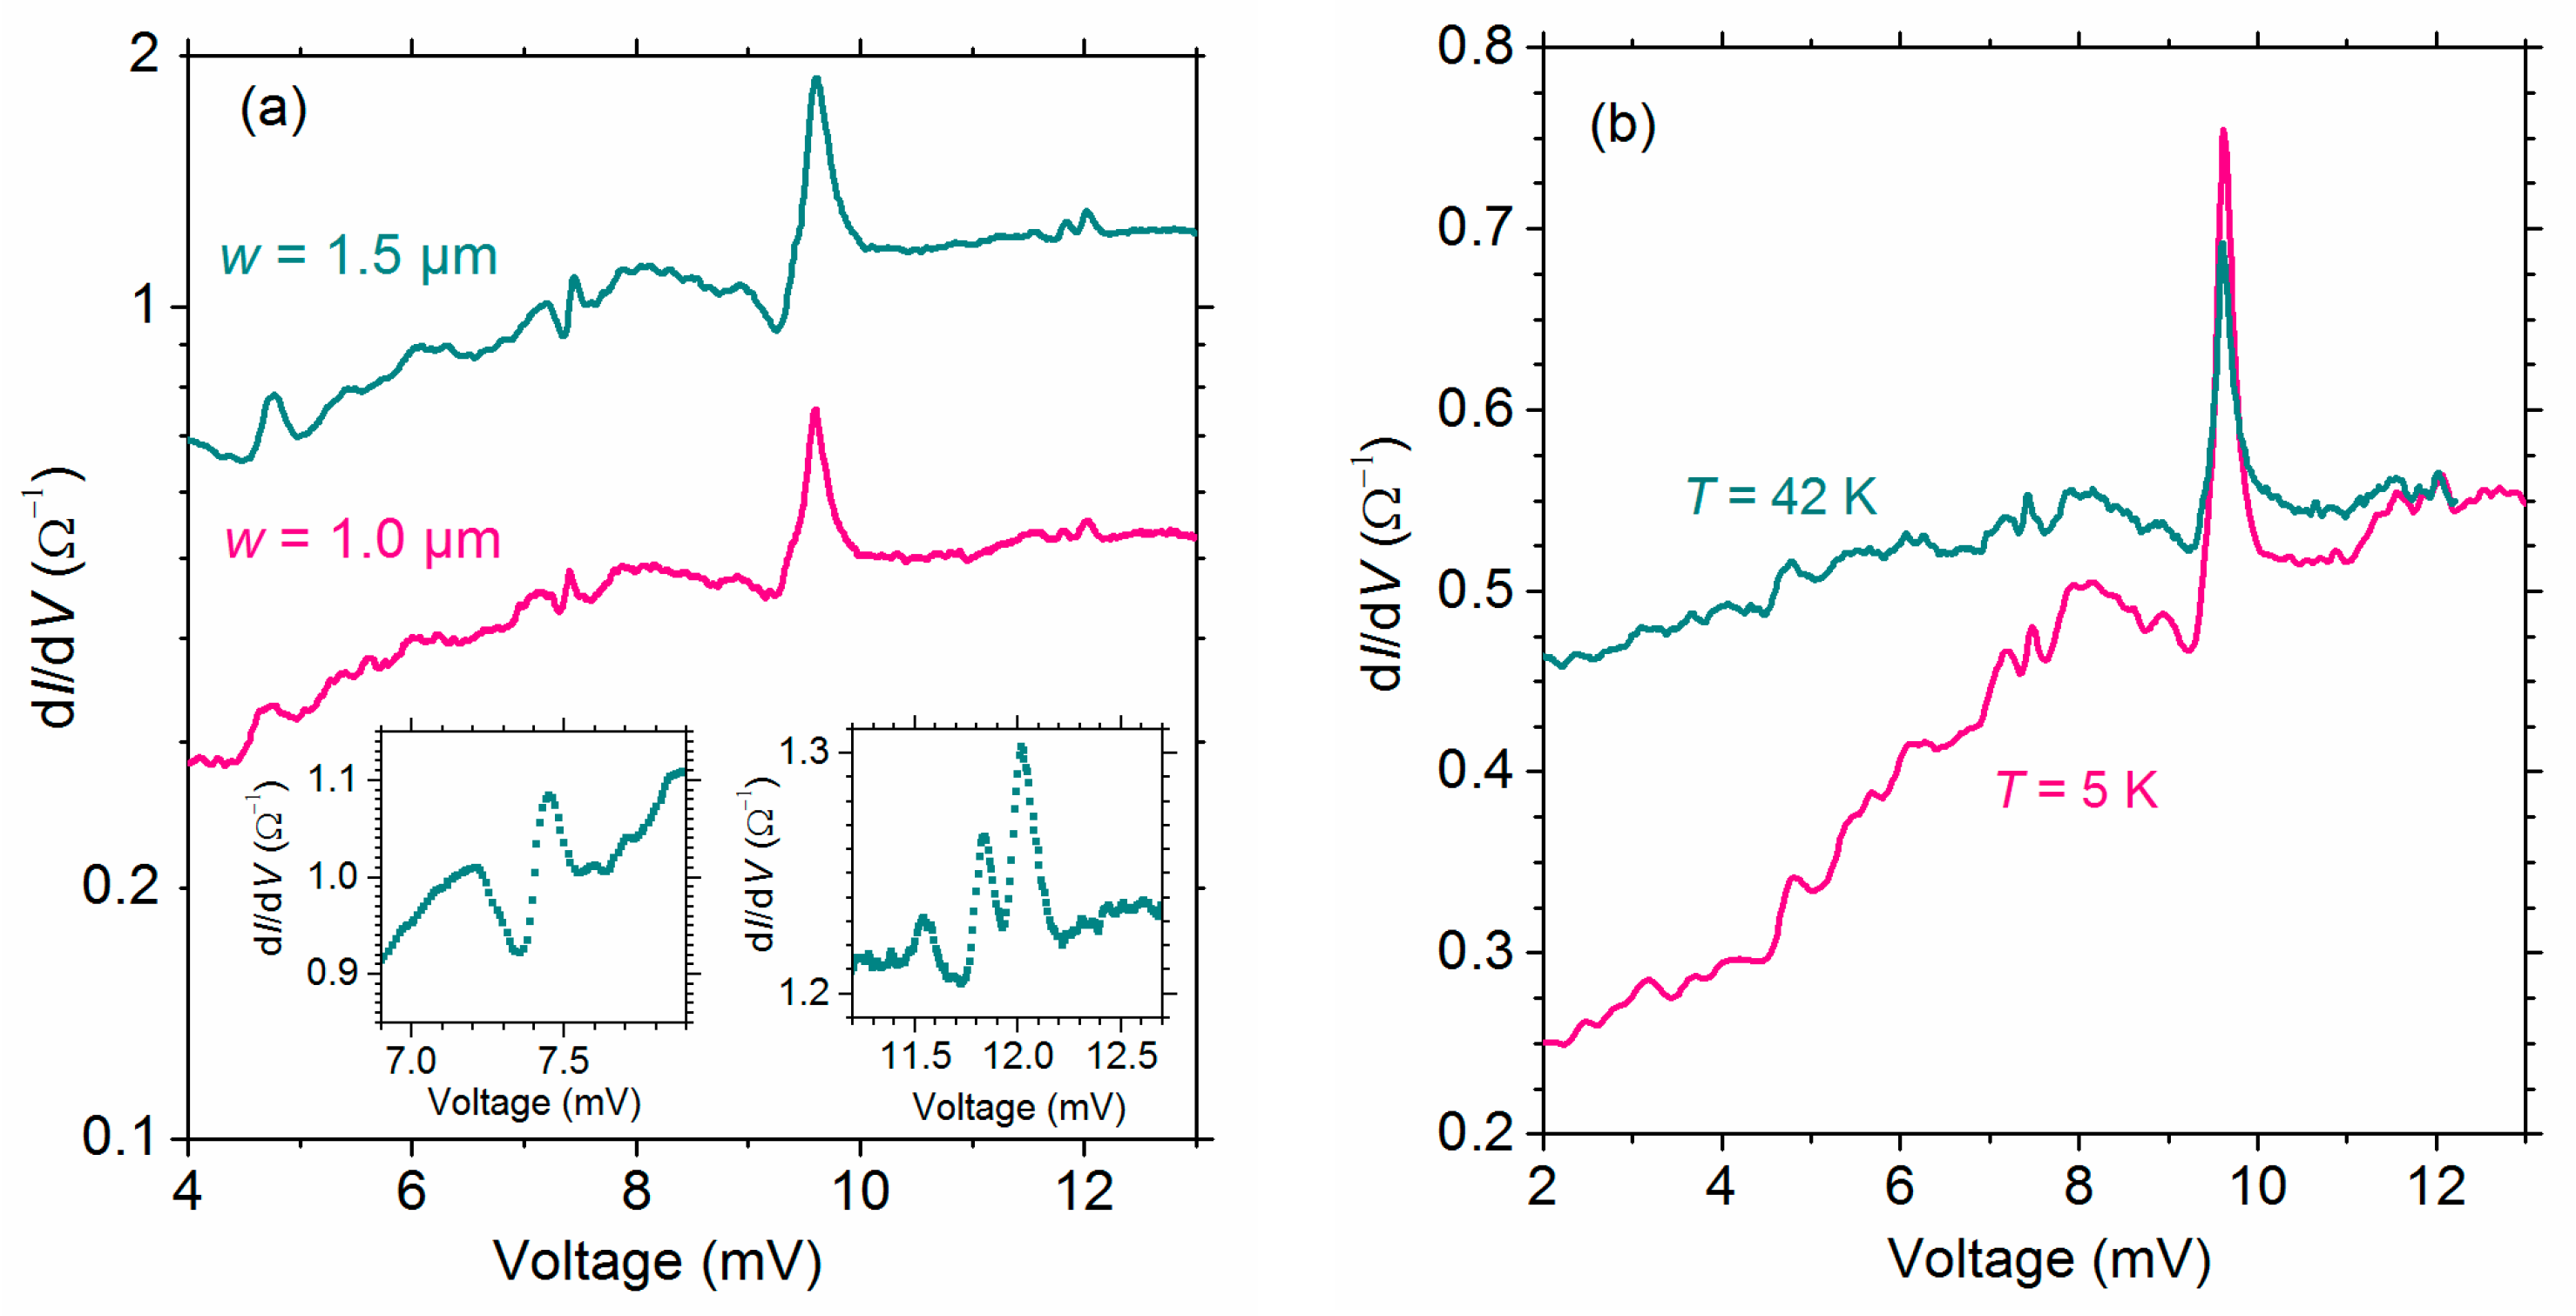
Indeed, the upper curve in
Figure 4a for the JJ with
Rn = 0.8 Ω at voltages of about 9.4 mV has a well-defined feature that deviates at V < 9.4 mV towards lower conductances and at V > 9.4 mV—towards higher ones. In addition, the upper curve in
Figure 4a has similar, but of low intensity, odd-symmetric features with centers at voltages V = 4.66 mV, 7.403 mV, 11.79 mV, and 11.98 mV (see also the enlarged features on the insets). The same features manifest in other JJs.
Figure 4a also shows the dependence of d
I/d
V on voltage
V for the JJ with
Rn = 1.9 Ω (lower curve). The centers of the features on the upper curve in
Figure 4a fit the centers of similar features on the lower curve. Moreover, the position of the singularities also remains unchanged with an increase in the JJ temperature.
Figure 4b shows two dependences of d
I/d
V on voltage
V for a JJ with
Rn = 1.8 Ω at two temperatures of 5 K (lower curve) and 42 K (upper curve). It can be seen that all the main features retain their positions as the temperature rises by almost an order of magnitude.
The features found on the I–V curves of YBa2Cu3O7−x bicrystal junctions with mutually tilted c-axes can be associated with both inelastic quasiparticle tunneling and Josephson tunneling. In the first case, the transformation of the voltages Vk of the features on the I–V curves of JJs into the position of the features on the frequency axis should occur according to the relation Vk = hfk/e, while in the second case, Vk = hfk/2e. To remove this uncertainty, we measured the I–V curves of JJs under irradiation with a frequency of 94 GHz and showed how the main feature on the I–V curves changed with the increasing power of this radiation.
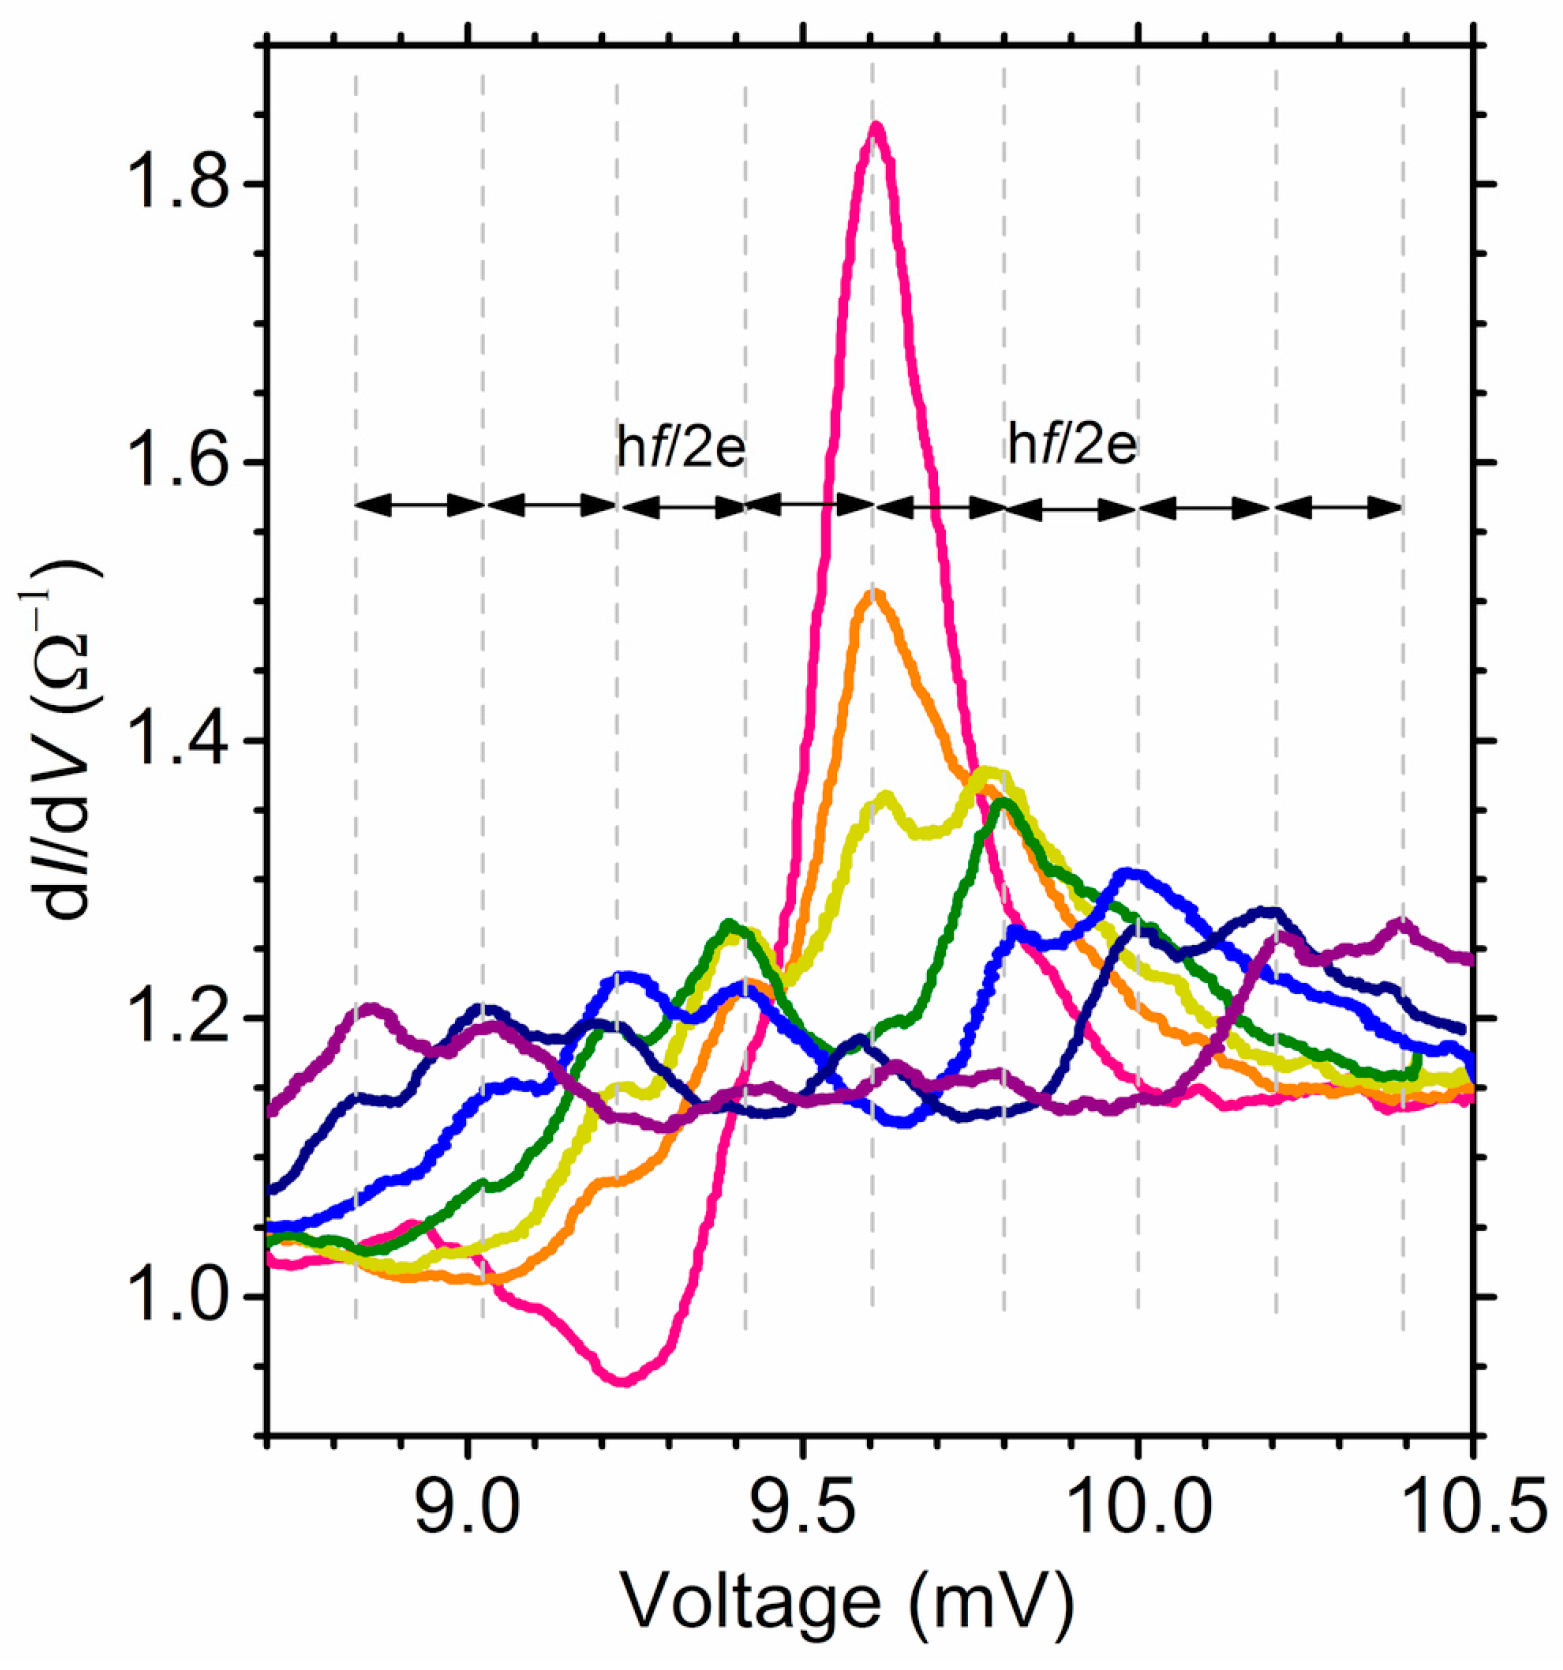
The results are presented in
Figure 5 for the dependence of the differential conductance d
I/d
V on the voltage
V for one of the JJs. The unperturbed differential conductance d
I/d
V vs.
V (red curve) has a peak at
V = 9.6 mV. With a monotonous increase in radiation power, which corresponds to a decreasing the attenuation of a precision rotary-wave W10 attenuator from 60 dB to 4 dB, the dependence of d
I/d
V on the voltage
V changes (see a corresponding set of curves with colors from red to purple). The main peak at 9.6 mV gradually fades to zero (blue curve) and reappears (navy and purple curve). In this case, additional local maxima show up, which are symmetrically situated from the main peak at
V= 9.6 mV by ±194 μV (yellow curve). Then, the satellite peaks also appear at ± n × 194 µV with n = 2, 3, 4 (light blue, navy, and purple curves). The separation of these satellite peaks from each other and the main one is a multiple of 194 μV. This value is equal to the value h
f/2e at a frequency
f = 94 GHz, and not h
f/e, as it could be if the cause of the formation of a feature in the
I–V curve is the inelastic tunneling of quasiparticles [
35].
Thus, we can conclude that the features in the dc
I–V curves of JJs are associated with the interaction of Josephson oscillations with frequency-localized modes in these JJs themselves and the nearest environment. The relative modulation of the differential conductance
RnΔd
I/d
V near the detected feature at voltages of about 9.4 mV reaches 80%, which means a significant mode intensity. The vibrational modes of separate organic molecules in tunneling barriers are usually weaker, with a relative conductance modulation of about 1% [
28].
In connection with this circumstance, one should consider the frequencies of optical phonons or, more generally, collective modes in the JJ material itself, YBa
2Cu
3O
7−x. In this case, one should foresee that the oxygen concentration in the electrodes adjacent to the structural barrier of the JJ could decrease during the preparation of the JJ. This circumstance, in turn, can affect the position and shape of the features on the
I–V curve of the JJ. To elucidate the effect of oxygen on the voltage position of features on the
I–V curve, we measured several JJs as fabricated and after additional low-temperature annealing in atomic oxygen.
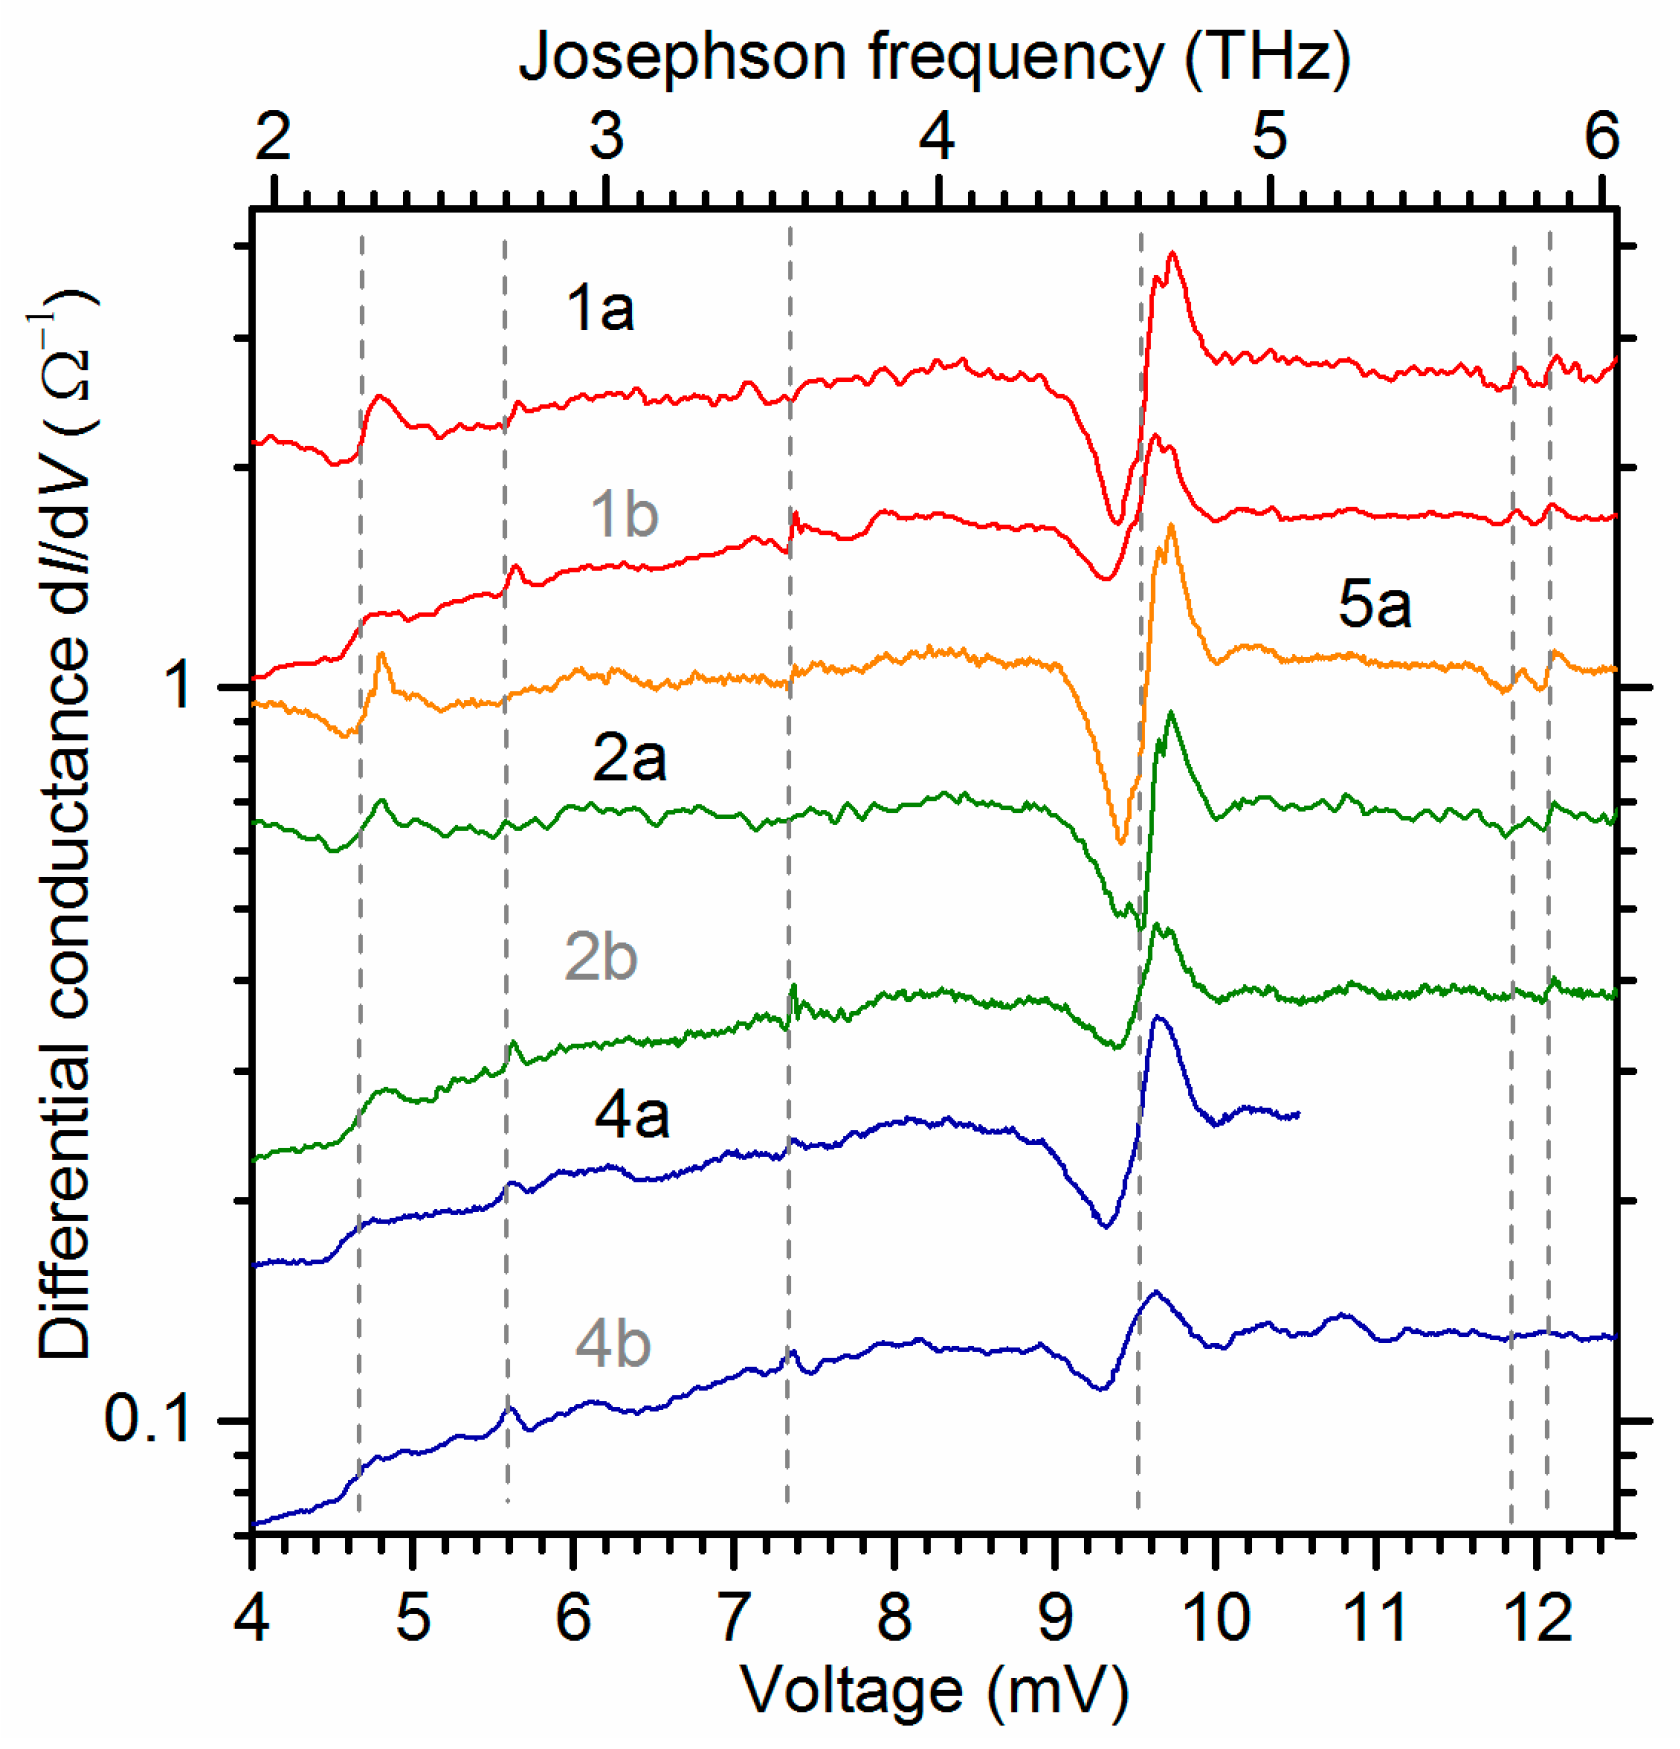
Figure 6 presents the results, where the numbers on the curves correspond to the JJ numbers on the same substrate, and the letters “b” or “a” correspond to the junction state: b—before low-temperature annealing (before), a—after this annealing (after). As follows from
Figure 6, annealing in atomic oxygen leads to a close to a twofold increase in the conductance 1/
Rn of the JJs, an enhancement of the features around 9.4 mV and 4.7 mV, and a weakening of those at around 7.4 mV and 5.6 mV.
The features at voltages 11.8 and 12 mV are weaker and increase slightly after annealing. The most intensive peculiarity at voltages near 9.4 mV has an internal structure that is noticeable even in unannealed samples (curves 1b, 2b). Two peaks are visible, the first at 9.55 mV and the second at 9.65 mV. Adding the oxygen content to the JJ increases the peak at 9.65 mV absolutely and relative to the peak at 9.55 mV (curves 1a, 2a).
4. Data Analysis and Discussion
Considering the intensity and reproducibility of the features on the I–V curves of YBa2Cu3O7−x JJs, one can suggest the involvement of the collective modes in YBa2Cu3O7−x in their formation. It makes sense to compare the features on the I–V curves of YBa2Cu3O7−x JJs with the results of far-infrared reflection experiments on bulk YBa2Cu3O7−x crystals. The intensity and position of some features in I–V curves changed after annealing; therefore, one should find the reference spectra for bulk samples YBa2Cu3O7−x with different oxygen contents x.
Table 1 summarizes the averaged values of the central frequencies
fk of the observed features on the
I–V curves of bicrystal YBa
2Cu
3O
7−x JJs (the first column) and compares these frequencies with the peak positions in the optical conductivity σ(
f) of bulk crystals YBa
2Cu
3O
7−x with different oxygen content, from O
6.0 (the second column) to O
6.95 (the sixth column). Data on optical conductivities σ(
f) are from far-infrared reflection experiments [
26,
27,
28,
29,
30] for two polarizations of the electric field
E of incoming radiation: along the
c-axis (
E ||
c) and along the
a-axis (
E ||
a) of the YBa
2Cu
3O
7−x crystals. If the
fk-values changed after annealing in atomic oxygen, two values
fk(b) and
fk(a) connected with the horizontal arrow. The vertical arrows ↑↓ indicate the increase (↑) or decrease (↓) of the intensities of the features after annealing.
Table 1.
Central frequencies
fk = 2e
Vk/h of the features on the
I-V curves of bicrystal YBa
2Cu
3O
7−x JJs and the frequencies of the peaks in the optical conductivity of bulk crystals YBa
2Cu
3O
7−x from far-infrared experiments [
26,
27,
28,
29,
30]. The values
fk(b) are the average values for JJ before annealing in oxygen, while the values
fk(a) are the average values after annealing. All frequency values are in THz. The frequency values in bold correspond to the most intensive lines.
Our Data
YBa2Cu3O7−x JJ
fk(b) → fk(a); ↓ ↑ | [27,29]
YBa2Cu3O6.0
E || c E || a | [26,30]
YBa2Cu3O6.5
E || c E || a | [26]
YBa2Cu3O6.7
E || c | [26]
YBa2Cu3O6.85
E || c | [26,29]
YBa2Cu3O6.95
E || c E || a |
| 2.24 → 2.27; ↑ | | | | | |
| 2.69; ↓ | | 2.79 | | | |
| 3.54; ↓ | 3.48 | 3.39 | | | |
| | | 3.75 | | | |
| | 4.38 | 4.35 | 4.08 | | |
| | | | 4.41 | 4.41 | |
| | | | 4.59 | 4.59 | |
| 4.59 → 4.62; ↑ | | | | | 4.65 |
| | | 4.83 | | | |
| 5.71; ↑ | 5.64 | 5.70 | | | 5.69 |
| 5.81; ↑ | | | 5.67 | 5.76 | 5.82 |
The most intensive feature on the
I–V curves of JJs is observed at
fk(b) = 4.59 THz. It shifts to a higher frequency of
fk(a) = 4.62 THz after annealing in oxygen with the intensity increase (↑). These frequency values are close to the corresponding values for the intensive collective modes observed in the reflection spectra of YBa
2Cu
3O
6.85 and YBa
2Cu
3O
6.95 [
26] when the electric field
E of radiation is parallel to the
c-axis of the crystals. The highly doped YBa
2Cu
3O
6.95 material contains an intensive optical phonon mode at 4.65 THz (the sixth column), which splits into two modes at 4.59 THz and 4.41 THz in YBa
2Cu
3O
6.85 with reduced oxygen content (the fifth column). The 4.59 THz mode is more intensive than the mode at 4.41 THz in YBa
2Cu
3O
6.85, but with further oxygen reduction, the 4.41 THz mode dominates in YBa
2Cu
3O
6.7 (the fourth column), and additional splitting appears at 4.08 THz. Thus, the observed frequency shift (4.59 THz to 4.62 THz) in the feature on the
I–V curve after annealing can be ascribed to the transformation of some parts of the YBa
2Cu
3O
7−x material near the bicrystal boundary from YBa
2Cu
3O
6.85 to near YBa
2Cu
3O
6.95.
The less intensive 5.81 THz feature on the
I–V curves corresponds to the optical phonon mode at 5.82 THz in reflection measurements with
E ||
c for YBa
2Cu
3O
6.95. However, it does not depend on oxygen deficiency, as follows from reflection measurements. The 5.71 THz feature on the
I–V curves seems to belong to the 5.69 THz mode in reflection measurements with
E ||
a for YBa
2Cu
3O
6.95, which does not change when going from YBa
2Cu
3O
6.95 to YBa
2Cu
3O
6.5. The intensities of the features at 2.69 and 3.54 THz on the
I–V curves of JJs decrease with annealing in oxygen. Therefore, the collective modes in the bulk YBa
2Cu
3O
7−x with low oxygen content can be responsible for these features. Indeed, there are the modes at 2.79 THz in YBa
2Cu
3O
6.5 at
E ||
c and at 3.48 THz in YBa
2Cu
3O
6.0 at
E ||
a (the third and second columns in
Table 1). Moreover, there are no modes with close frequencies in YBa
2Cu
3O
7−x with higher oxygen content.
The second-strongest feature on the
I–V curves, with frequency transformation from 2.24 to 2.27 THz after annealing, has no candidate among the collective modes in YBa
2Cu
3O
7−x crystals. It looks like a replica of the 4.6 THz feature but at approximately twice as low frequencies. In weak perturbation of RSJ-like dynamics by external admittances of low values |
Ye(
fc)| <<
Rn−1 (see Equation (2)), a contribution to the
I–V curve comes only from the first Josephson harmonic at the frequency
f = 2e
V/h. However, the current-phase relation in the real JJ can contain the sin2φ-term,
Is = Ic1Sinφ +
Ic2Sin2φ, and the
I–V curve can demonstrate an additional feature at voltages
V around (1/2)h
fk/2e. In this case, the
I-V curve of JJ should demonstrate a subharmonic resonance at
V = (1/2)h
f/2e on the
I–V curves under weak THz irradiation. However, the experiments with similar bicrystal JJs and frequencies
f of several THz did not reveal these subharmonic features [
36]. In addition, from a theoretical point of view, bicrystal YBa
2Cu
3O
7−x JJs with the mutually tilted
c-axes are similar to so-called d0-d0 junctions and should have a pure sinφ-dependence of the current
Is vs. the phase difference φ [
37]. Due to these experimental and theoretical grounds, we cannot consider this explanation of the subharmonic feature on the
I–V curves by the sin2φ-term as a dominant one.
Staying inside the RSJ model, one more explanation can be related to more intensive external shunting by |Ye(fc)| comparable with Rn−1. In this case, the interaction of the second Josephson harmonic at the frequency f = 2 × 2eV/h with the collective modes at frequencies fk around 4.6 THz can give the feature at V around (1/2)hfk/2e. To quantify this effect, one can either analytically consider the perturbation of RSJ dynamics by shunting in the second-order approximation, ~(|Ye(fc)| Rn)2, or make numerical simulations for various values of |Ye(fc)| Rn.
One can suggest that bicrystal junctions formed from two mutually tilted
c-axis films can have inhomogeneous currents along the boundary with several dominating channels and behave as a superconducting interferometer with dynamics different from those of a single RSJ-like JJ [
38]. Even for two JJs in the interferometer, the appearance of the subharmonic Shapiro steps is predicted [
39]. An additional subharmonic feature at
V = (1/2)h
f/2e was on the 1 THz detector response of the
c-axis bicrystal junction JJ of 8 µm width but absent in a similar junction of 2.5 µm width [
20]. However, the appearance of the subharmonic features in the JJ with mutually tilted
c-axes does not depend on the width of the JJ, as one can see from Fig. 6, where subharmonic features are the same for 6 µm(N1) and 1 µm(N4) junctions. Therefore, we can conclude that interferometric effects on Josephson dynamics of the JJs cannot be the only reason for the features at
V around (1/2)h
fk/2e.
Nonlinear effects in YBa
2Cu
3O
7−x material itself under an intensive THz electric field from Josephson oscillations can be an alternative option to clarify the nature of the subharmonic feature at
V around (1/2)h
fk/2e on the
I–V curves of YBa
2Cu
3O
7−x bicrystal JJs. THz emission due to a nonlinear optical rectification (OR) in YBa
2Cu
3O
7−x has already been observed [
40]. One can expect that a second harmonic generation (SHG) in this material because the OR and SHG processes result from the same nonlinearity in optical materials [
41]. There are no data on the effective nonlinear susceptibilities for OR and SHG in YBa
2Cu
3O
7−x; however, the electric THz fields from Josephson oscillations are rather intensive. Estimates give the field values around 5 × 10
4 V/cm for the voltages near the subharmonic feature on the
I–V curves. A detailed consideration of these effects deserves a separate publication.
The differences between the frequencies of collective modes detected by Josephson spectroscopy in YBa2Cu3O7−x thin-film JJs and by reflection measurements of bulk YBa2Cu3O7−x crystals can exist, because the YBa2Cu3O7−x thin films are under considerable strain due to the differences in lattice constants and thermal expansion coefficients with the substrates. However, data comparison from Josephson and reflection spectroscopies shows that differences in the recovered frequency values are low. This circumstance stimulates further development of Josephson spectroscopy for studying collective modes in JJs and their environment.
As a first step in this direction, the admittances Re
Y(
f) near the intensive mode at around 4.6 THz were recovered from the experimental curves d
I/d
V vs.
V according to the procedure described in
Section 2.2.
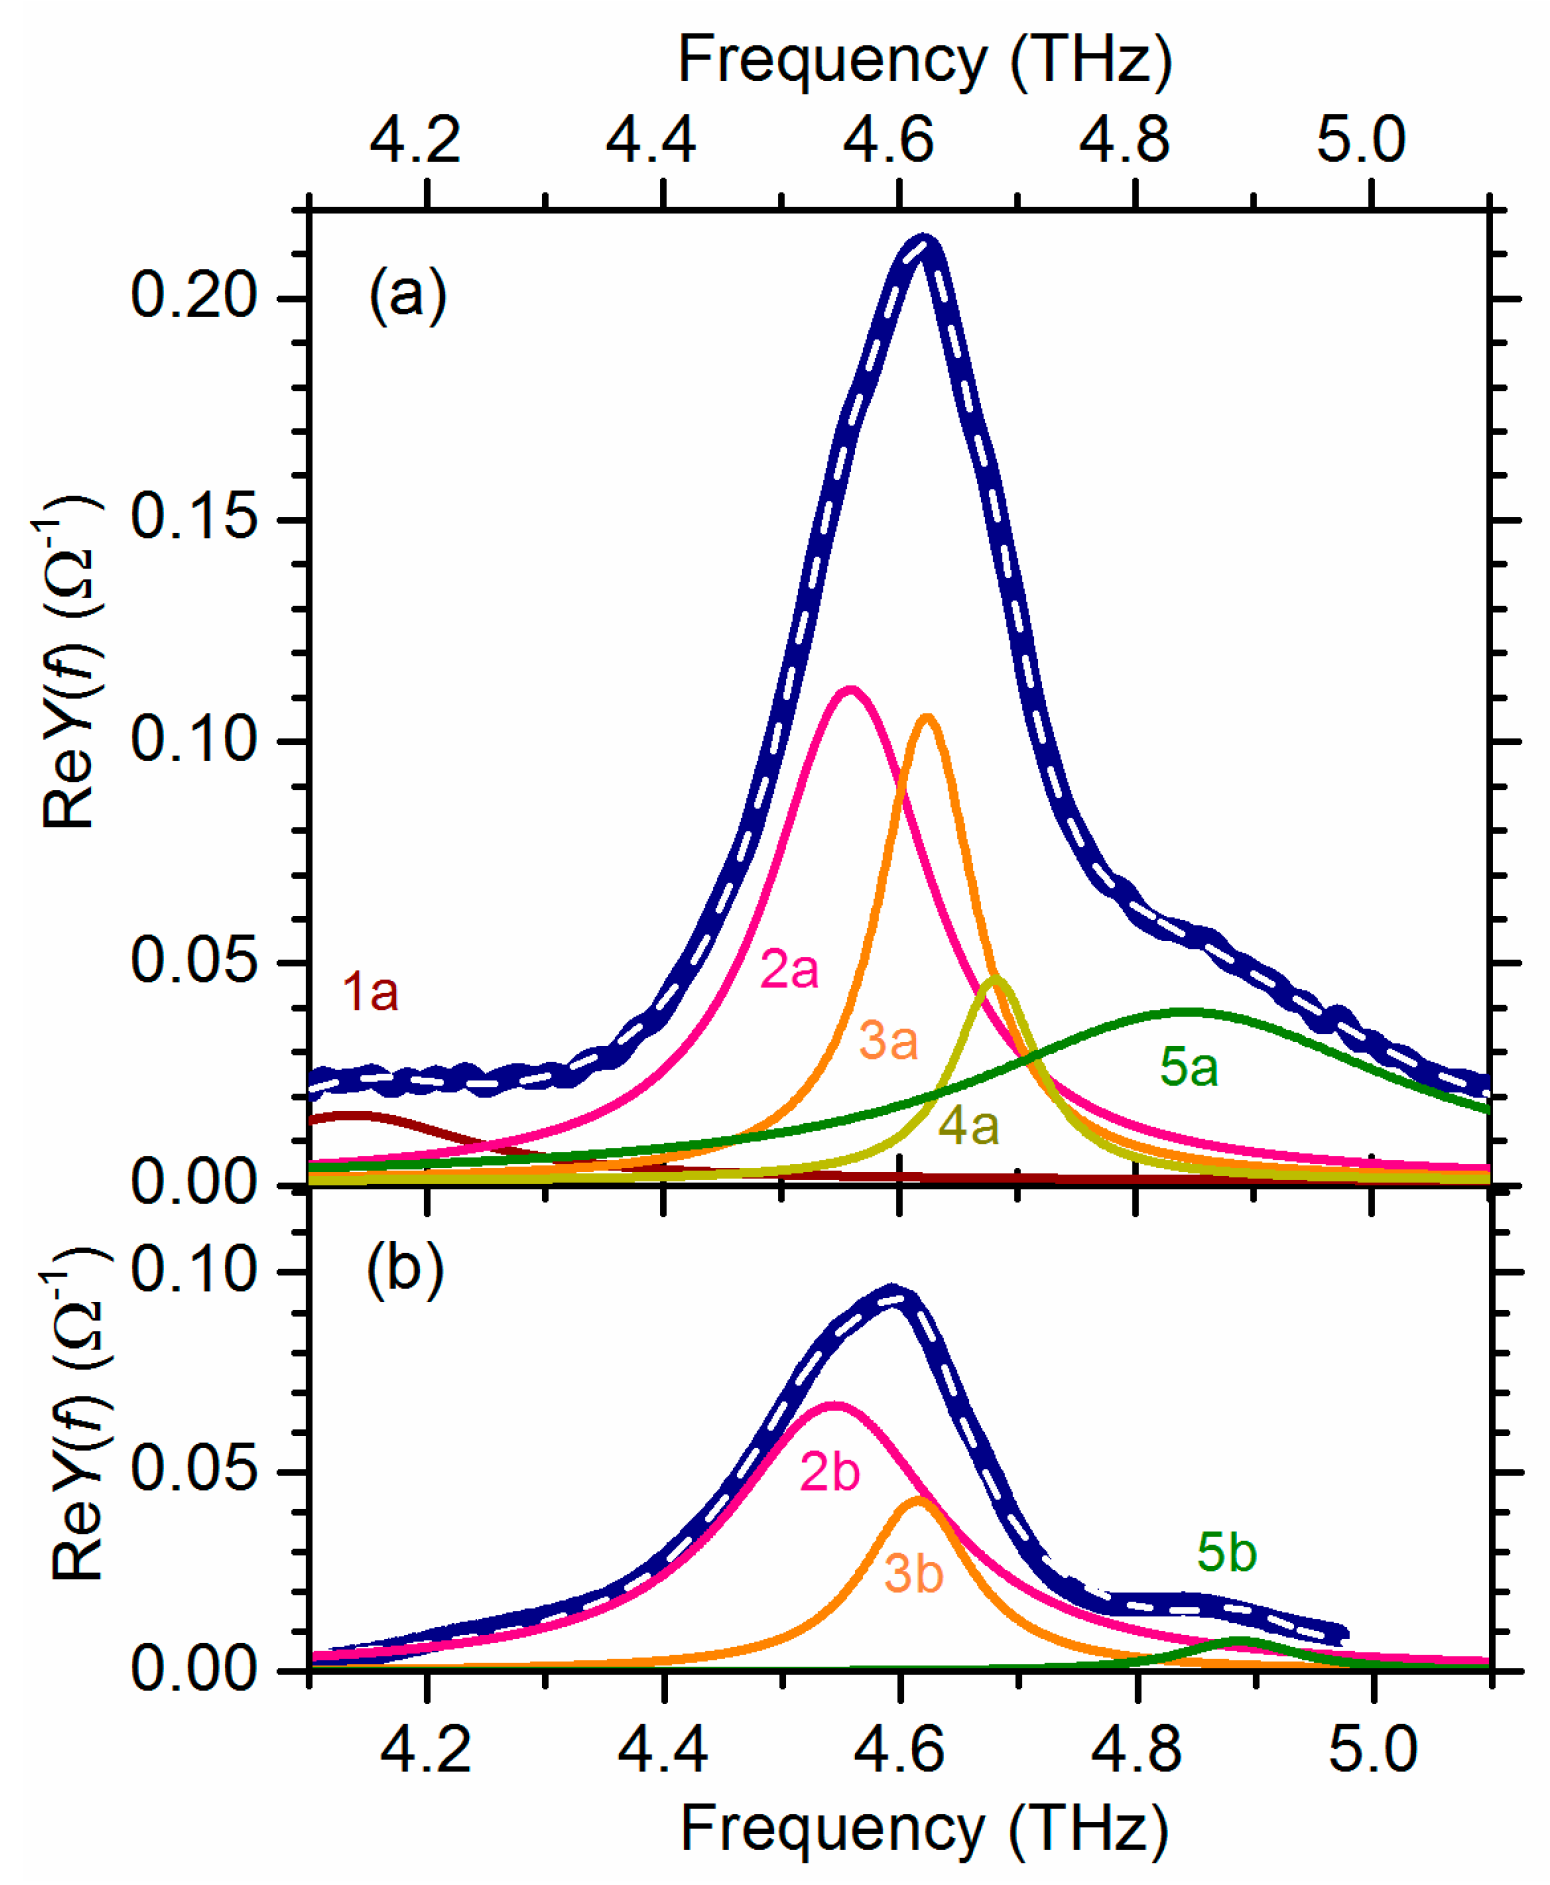
Figure 7a shows the recovered Re
Y(
f) of the JJ (1a in
Figure 6) after low-temperature annealing in atomic oxygen, while
Figure 7b shows that before annealing (1b in
Figure 6). The maximal value of the admittance Re
Y(
f) after annealing is twice as high as the same value before annealing. The forms of these absorption lines are asymmetric and different.
The optical phonon lines in bulk crystals YBa
2Cu
3O
7−x determined by Fourier spectroscopy are usually close to Lorentz curves. However, each of the recovered Re
Y(
f) curves in
Figure 7 is more complicated than a single Lorentzian. The form of the spectrum Re
Y(
f) (a thick line after annealing (
Figure 7a)) fits well with five Lorentz curves with the following central frequencies
fka and the linewidths δ
fka, in THz:
f1a = 4.14, δ
f1a = 0.245;
f2a = 4.56, δ
f2a =0.171;
f3a = 4.62, δ
f3a= 0.102;
f4a = 4.68, δ
f4a = 0.087;
f5a = 4.84, δ
f5a = 0.43. A sum of three Lorentz curves is sufficient to fit the spectrum Re
Y(
f) (thick navy curve in
Figure 7b) for the same JJ before annealing in oxygen. The fit parameters, in THz, are the following:
f2b = 4.54, δ
f2b =0.219;
f3b = 4.61; δ
f3b = 0.113;
f5b = 4.89, δ
f5b = 0.12. Comparison of the results of nonlinear fits for the same JJ before and after annealing shows that three spectral components at
f2 = (4.55 ± 0.01) THz;
f3 = (4.61 ± 0.01) THz and
f5 =(4.86 ± 0.03) THz practically did not change the positions of their maxima, but increased their peak values by about two, three and four times, correspondingly.
In addition, two extra Lorentz curves appeared at
f1 = 4.14 THz and
f4 = 4.68 THz after annealing, while the curve at 4.68 THz has a narrow linewidth of around 0.09 THz. This low linewidth is a hint that the mode at
f4 = 4.68 THz belongs to highly oxygenated YBa
2Cu
3O
7−x [
26]. The general trend in the constituent Lorentzians in the spectra in
Figure 7a,b is the intensification of the lines at
f2,
f3, and
f5 and the appearance of new lines at
f1 and
f4 in the spectral range from 4.1 THz to 5.1 THz. This trend is in qualitative agreement with the tendency deduced from the data in
Table 1 (see also [
26]), where initial deoxygenation results in the splitting of the 4.65 THz line, followed by an increase in the number of splitted lines and frequency differences in splitting with further deoxygenation.
It is worthwhile to compare quantitatively the absorption lines obtained by Josephson admittance spectroscopy lines in the YBa
2Cu
3O
7−x bicrystal thin-film JJ and those in the reflection spectra of YBa
2Cu
3O
7−x single crystals [
26]. The narrowest line at
f4 = 4.68 THz in the YBa
2Cu
3O
7−x JJ can be from the optical phonon mode with
E ||
c, observed in YBa
2Cu
3O
6.95 single crystals at 4.65 THz. The lines at
f3 = 4.62 THz,
f2 = 4.56 THz, and
f1 = 4.14 THz can be from the splitted collective modes at 4.59 THz, 4.41 THz, and 4.08 THz in YBa
2Cu
3O
6.7. The line at
f5 = 4.84 THz in the YBa
2Cu
3O
7−x JJ can be due to the splitted collective mode at 4.83 THz in YBa
2Cu
3O
6.5. This comparison makes it possible to estimate the oxygen distribution in YBa
2Cu
3O
7−x near the bicrystal boundary of JJs made from YBa
2Cu
3O
7−x thin films with mutually tilted
c-axes.
After this comparison, one can suggest some mixed composition, from YBa2Cu3O6 (with no oxygen in the chains) to YBa2Cu3O6.85 (the chains partly filled with oxygen), in the YBa2Cu3O7−x electrodes of the bicrystal JJ as fabricated. After annealing in atomic oxygen, this composition changes to the mixture of YBa2Cu3O6.5 (Ortho II phase, with a double unit cell normal to the chain direction) and YBa2Cu3O6.95 (close to YBa2Cu3O7, fully oxygenated Ortho I phase). So, YBa2Cu3O7−x electrodes near the bicrystal boundary in the JJs under study have parts with slightly different and relatively low oxygen content, and annealing increases the average oxygen content but does not reach the maximum oxygenation. Presumably, more intensive and longer treatment of JJs in atomic oxygen should be developed.


