Article

Traditional Cultivars Influence on Physical and Engineering Properties of Rice from the Cauvery Deltaic Region of Tamil Nadu

by
Subramanian Venkatesan
1,
Dhandayuthapani Udhaya Nandhini
2,*,
Kandasamy Senthilraja
3,*,
Balasubramaniam Prabha
4,
Sivaprakasam Jidhu Vaishnavi
5,
Tamilmani Eevera
6,
Eagan Somasundaram
7,
Natarajan Balakrishnan
1,
Muthurajan Raveendran
1,
Vellingiri Geethalakshmi
8 and
Servakaranpalayam Subramaniam Sivakumar
9,*
1
Directorate of Research, Tamil Nadu Agricultural University, Coimbatore 641003, Tamil Nadu, India
2
Centre of Excellence in Sustaining Soil Health, Anbil Dharmalingam Agricultural College & Research Institute, Trichy 620027, Tamil Nadu, India
3
Directorate of Crop Management, Tamil Nadu Agricultural University, Coimbatore 641003, Tamil Nadu, India
4
Department of Renewable Energy Engineering, Tamil Nadu Agricultural University, Coimbatore 641003, Tamil Nadu, India
5
Amrita School of Agricultural Sciences, Coimbatore 642109, Tamil Nadu, India
6
Department of Seed Science and Technology, Tamil Nadu Agricultural University, Coimbatore 641003, Tamil Nadu, India
7
Directorate of Agribusiness Development, Tamil Nadu Agricultural University, Coimbatore 641003, Tamil Nadu, India
8
Agro-Climatic Research Centre, Tamil Nadu Agricultural University, Coimbatore 641003, Tamil Nadu, India
9
Office of the Registrar, Tamil Nadu Agricultural University, Coimbatore 641003, Tamil Nadu, India
*
Authors to whom correspondence should be addressed.
Appl. Sci. 2023, 13(9), 5705; https://doi.org/10.3390/app13095705
Submission received: 14 March 2023 / Revised: 25 April 2023 / Accepted: 28 April 2023 / Published: 5 May 2023
(This article belongs to the Special Issue Chemical and Physical Properties in Food Processing)

Abstract

:
Standard unit operations/equipment have not evolved for the traditional rice varieties of the Cauvery Deltaic region of Tamil Nadu. The fame of traditional rice is increasing nowadays owing to its health benefits. Non-standard unit operations may cause rice grains to crack during milling, accumulating more broken rice and yields in products of inferior quality. As a result, research into the physical properties of rice is crucial for the development of rice processing equipment that minimizes post-harvest losses during milling. Hence, an assessment was made to evaluate 30 traditional rice cultivars on their Physical (grain length, width, thickness, shape, and size), gravimetric (bulk, true, tapped density, porosity, Carr’s index, and Hausner ratio), and engineering characteristics (equivalent, arithmetic, square mean, and geometric mean diameter) using standard protocols, with the goal of reviving and preserving older varieties. The results from the analysis showed significant variations (p < 0.05) between all properties that were evaluated. According to length, a substantial amount of traditional rice varieties were long grain (76.7%), whereas (16.7%) belonged to the medium type and (3.3%) were short-grain types, respectively. There were variations among the three different categories of local rice grains when it comes to size, ranging from 3.26 to 4.69 mm for arithmetic mean diameter, 2.84 to 4.00 mm for geometric mean diameter, and 3.02 to 4.28 mm for square mean diameter, respectively. Sphericity, aspect ratio, and surface area measurements of the samples varied from 37.7% to 81.2%, 0.26 to 1.00, and 25.4 to 50.1 mm2, respectively. Of the 30 varieties, 28 were under the high amylose category, and 2 belonged to the intermediate type. The Pearson correlation was established to study the interrelationships between the dimensions and engineering properties. Principal component analysis (PCA) reduced the dimensionality of 540 data into five principal components (PC), which explained 95.7% of the total variance. These findings suggest that it is possible to revive old landraces through careful selection and analysis of these properties. The superior characteristics of these traditional varieties can be further evaluated for breeding programs in order to improve the cultivation of these cherished rice landraces to enhance nutritional security.

1. Introduction

Rice is the second-most important staple food, behind wheat, and is widely consumed around the world [1]. India has witnessed a drastic boost in its rice production, which accounts for 1/4th of the global total. Rice is the second most cultivated crop in India, after sugarcane, and has significantly influenced the nation’s agricultural output [2]. Rice is grown in the Cauvery Deltaic parts of Tamil Nadu, where it is the region’s major food crop; this region is a homeland for more than 400 traditional rice varieties. Major areas of the Cauvery Deltaic region have been farming traditional rice types and eating them since time immemorial, and some of the landraces show promise in terms of output. The green revolution has brought about a surge in the production of high-yielding varieties, resulting in traditional cultivars being pushed to the background.
Several old rice varieties have resurfaced in recent years as part of the process of rediscovering traditional agricultural knowledge. After COVID, the eating habits of people have changed, and they are showing interest in traditional cultivars, which are rich in biochemical compounds that enhance immunity. Rice varieties with whitish kernels are the most prevalent form of rice in Tamil Nadu. However, the Cauvery Deltaic region of Tamil Nadu is also reported to have pigmented varieties that possess high medicinal values through the presence of higher total phenol, flavonoids, and anthocyanin content.
Rice grain characteristics distinguish its market worth and influence milling and cooking quality, which has a direct impact on consumer acceptability [3,4]. Quality assessment of food products involves several factors, such as physical looks, sensory properties, texture, and nutrition. All of these characteristics are crucial in determining the overall quality. Investigation of the physical properties of rice is fundamental for designing rice processing equipment and setting up standard unit procedures that would be useful in wiping out losses that happen during the milling process. Additionally, information on density parameters could, besides influencing heat and mass exchange of moisture during air circulation and drying processes, help in choosing appropriate sizes for storage bins [5]. Bulk density, tapped density, real density, Hausner ratio, and Carr’s index are important gravimetric qualities that must be taken into consideration in designing processing machines for the drying, transportation, and storage of grains. They play a major role in ensuring the successful operation of these machines [6] and improving their efficiency [7]. Grain breakage and cracking can be avoided with well-designed equipment.
Rice’s physical qualities are considered a very crucial factor in harvesting and post-harvest processing as they directly influence the milling and cooking efficiency. Comprehensive knowledge of the physical and engineering properties, such as length, diameter, surface area, and more, is vital for producing products of good quality. This knowledge helps both consumers and sellers to manage their production and processing more efficiently. The physical features of these traditional rice cultivars differ, and the impact of those traits on processing technology is still a milestone to achieve. This will make value addition, quality enhancement, and post-harvest processing easier. Hence, this research was conducted to study the physical, gravimetric, and engineering properties of various traditional rice types commonly grown in Cauvery Deltaic, Tamil Nadu, India.

2. Materials and Methods

The thirty traditional varieties (Figure 1) used in this research and a legal permission letter for the collection of plant material by adhering to institutional, national, and international guidelines and legislation were obtained from the Director of Research of the Tamil Nadu Agricultural University, Coimbatore, Tamil Nadu. Of the 30 varieties, 14 were white in color, 15 were red, and 1 black variety was found. Seeds were obtained from the local farmers of the Cauvery Delta Region of Tamil Nadu, India, from July to December 2020 and were harvested manually and stored at 12% moisture. Every single grain was carefully cleaned by hand, with any unnecessary materials such as stones, hay, and dirt being removed. Experiments for this study were conducted at the Laboratory of Centre of Excellence in Soil Health, Anbil Dharmalingam Agricultural College and Research Institute Campus, Trichy, in January 2021.

2.1. Dimensional Properties of Traditional Rice

The length (mm) and breadth (mm) of thirty rice varieties were measured using a digital Vernier caliper (Mitutoyo, Japan) with the least count of 0.01 mm. The International Rice Research Institute classified rice cultivars into four categories based on their length: extra-long (more than 7.5 mm), long (6.61–7.5 mm), medium (5.51–6.60 mm), and short (5.5 mm) [8].

2.2. Grain Shape

This grain shape is determined by the length–width ratio.
G r a i n   s h a p e L W   r a t i o = L m m W m m
Grains were classified according to the length–width ratio given by IRRI, comprising slender (>3.0), medium (2.1–3.0), bold (1.1–2.0), and round (<1.1) grain types [8].

2.3. Thousand Grain Weight

A sample of 1000 grains of each cultivar was randomly selected and weighed on Digital weighing balance with an accuracy of 0.001 g. We repeated the procedure five times and averaged the results [4].

2.4. Bulk and Tapped Densities

Paddy was assessed for bulk density with the approach formulated by [9]. For this, a 10 mL graduated cylinder was taken, filled with grains up to the 10 mL mark, and the weight of the cylinder was measured after a few taps to determine bulk density (g/mL). The tapped density was worked out from the tapped volume after 100 taps.

2.5. True Density

The method adopted by [10] was used to determine true density. A sample of 1 g was taken in a 10 mL measuring cylinder and stoppered with a glass stopper. Following this, 5 mL of petroleum ether was added to the sample, and the mixture was vigorously shaken in order to suspend all grain particles. Subsequently, an additional 1 mL of petroleum ether was added, and the final volume of the contents was noted. True density was then determined using the following equation:
T r u e   d e n s i t = T h e   w e i g h t   o f   t h e   g r a i n   g m L T h e   t o t a l   v o l u m e   o f   p e t r o l e u m   e t h e r   a n d   s u s p e n d e d   p a r t i c l e s   m L 6

2.6. Porosity

Porosity is a desired physical property that can be calculated from the true density and tapped density values using the equation outlined by [10].
P o r o s i t y   % = T r u e   d e n s i t y T a p p e d   d e n s i t y T r u e   d e n s i t y × 100

2.7. Compressibility Index

Carr’s Index was applied to calculate the compressibility of paddy after their bulk and tapped densities had been established [10].
C a r r s   i n d e x = T a p p e d   d e n s i t y B u l k   d e n s i t y T a p p e d   d e n s i t y × 100

2.8. Hausner Ratio

The Hausner ratio is an indicator of the cohesive nature of grains and was calculated after determining the bulk and tapped densities [10].
H a u s n e r   r a t i o = T a p p e d   d e n s i t y B u l k   d e n s i t y

2.9. Determination of ED, AMD, GMD, and SMD

The equivalent diameter was assessed according to [11]. The following method was adopted to determine Arithmetic Mean Diameter (Da), Geometric Mean Diameter (Dg), and Square Mean Diameters (Ds) [12].
D e = L W + T 4 1 3
D a = L + W + T 3
D g = L W T 1 3
D s = L W + W T + T L 3 ˙ 1 2

2.10. Volume (V) and Surface Area (S)

The grain volume (V) and surface area (S) of rice varieties were determined by using the formula provided by [13].
V = 1 4 × π 6 × L × W × T 2
S = π B L 2 L B

2.11. Sphericity and Aspect Ratio

The sphericity φ [11] and aspect ratio Ra [4] of rice varieties was calculated by the following formula:
φ = L × W × T 1 3 L
R a = W L

2.12. Amylose Content

Amylose content was estimated using the method given by American Association of Cereal Chemists (AACC) [14]. In this method, 100 mg of rice was taken in a test tube containing 1 mL of 95% ethanol and 9 mL of 1 N NaOH. Ten minutes were allowed for this dispersion to settle down. To gelatinize the starch, this was heated for ten minutes in boiling water before being cooled to room temperature. After letting this amylose solution stand for two hours, the volume was increased to 100 milliliters using distilled water and vigorous shaking, which gave the starch solution. Five ml of this starch solution was taken out into a 100 mL volumetric flask, then 1 mL of 1N acetic acid was added, followed by 2 mL of iodine solution. The volume was filled up to 100 mL using distilled water. Color absorbance was measured at 620 nm by UV-VIS spectrophotometer (LAMBDA 365, Perkin Elmer). A standard curve was plotted between pure amylose of various concentrations and its absorbance, and the rice AC was calculated by referring to the standard curve.

2.13. Statistical Analysis

To obtain accurate results, the experiment was conducted in a laboratory setting with 3 replicates. The gathered data were analyzed through the use of IBM SPSS Statistics 25 software, and important figures were calculated as mean values along with standard errors (SE) of three replicated analyses. The variations between means were determined using Fisher’s least significant differences (LSD) at a p-value of 0.05, denoting an acceptable level of significance. Subsequently, relationships between all the properties were evaluated using Pearson’s correlation tests. Principle component analysis for the 540 data sets (30 varieties and 18 characteristics) was established. In a PCA model, the objects (rice varieties) were represented by their scores, and the variables (characteristics) were illustrated by their loadings. Varimax rotation was employed during PCA. Dendrograms were also constructed.

3. Results

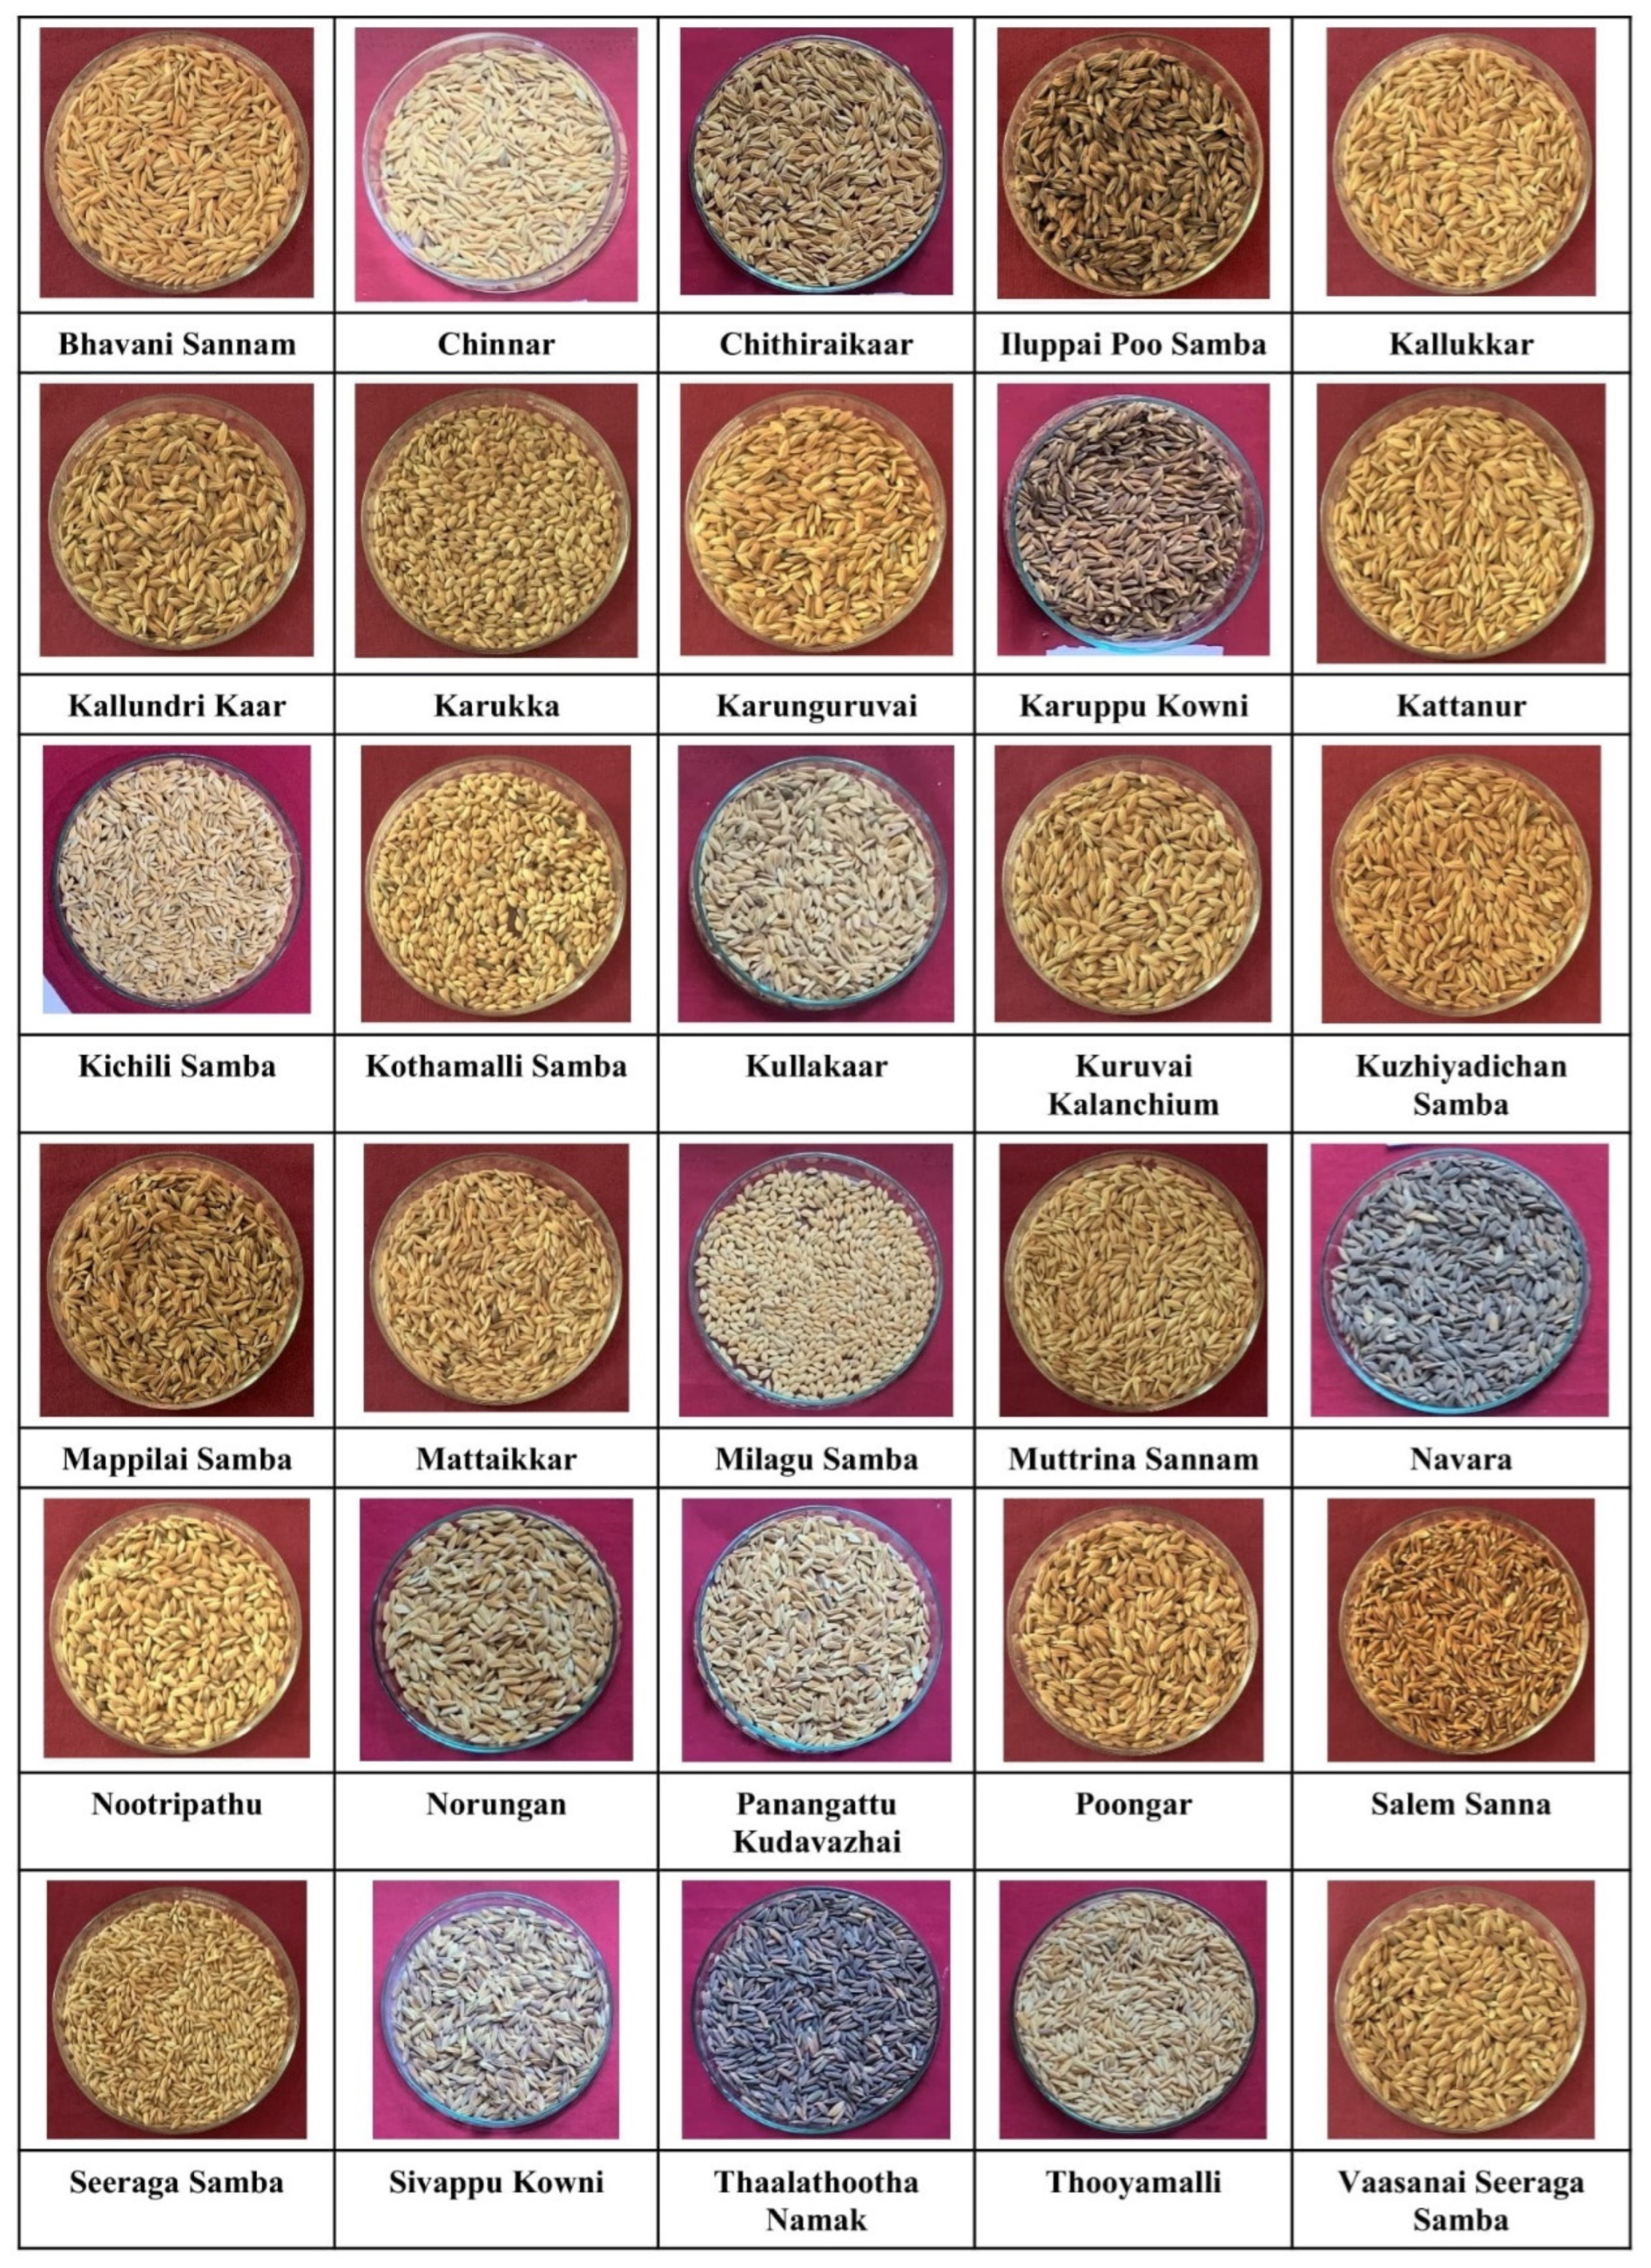
3.1. Grain Classification

In the present investigation, as depicted in Table 1, the study results revealed that there is a significant disparity among the rice varieties for grain length and breadth (p < 0.01). More than 77% of the varieties had a length of more than 7.50 mm, and 17% of varieties had lengths between 5.5 and 6.60 mm. The breadth of the rice varied from 2.30 to 3.91 mm. In general, the grain length ranged from 3.91 to 9.40 mm, with a mean of 7.72 mm. In extra-long type grains, the maximum length was seen in Chinnar (9.40 ± 0.56 mm), and the minimum length in Thooyamalli (7.57 ± 0.47 mm); in medium-type grains, the length ranged from Kothamalli Samba (6.54 ± 0.52 mm) to Mattaikar (5.64 ± 0.35 mm); and in short-type grains, Kallundri Kar registered 3.91 ± 0.40 mm length. Almost all (74%) of the extra-long rice varieties had a longer length of more than 8.0 mm.

3.2. Grain Shape

The length and breadth ratio of the rice grain was used to identify the shape, and a considerable variation was seen among the different varieties (Table 2). A higher value for length–breadth ratio was seen in Chinnar (3.80 ± 0.23), and the lowest one was seen in Mattaikar (1.00 ± 0.06). According to the IRRI classification on grain shape, this study revealed that 2 paddy varieties were round, 1 was of bold type, 18 were of medium type, and 9 had slender grain types.

3.3. Grain Size

Local varieties of Cauvery Delta showed a significant difference in grain size, and 70% was occupied by large grains; medium grains shared 20%, followed by small with 10% (Table 2). Kuzhiyadichan Samba is the largest rice grain variety that had the highest seed size (63.8 mm), statistically comparable with Poongar (63.3 mm).

3.4. Gravimetric Properties of Paddy

3.4.1. Bulk and Tapped Density

Data analysis of bulk density showed no significant difference among the different varieties (Table 3); however, minimal variation was observed. The bulk density of paddy grains varied from 0.86 in Kuruvai Kalanchium to 1.11 g/mL in Karunguruvai.
A significant difference was found for tapped density among the varieties (Table 3). Navara (1.19 ± 0.07 mm) was found to be with the highest tapping density, and Kuruvai Kalanchium (0.95 ± 0.10 mm) had minimum tapping density.

3.4.2. True Density and Porosity

The true density and porosity of the different varieties of paddy varied significantly. The values ranged from 1.00 ± 0.01 g/mL in Salem Sannato to 2.50 ± 0.10 g/mL in Iluppai Poo Samba, Karunguruvai, Kothamalli Samba, and Muttrina Sannam. Karuppu Kowni had the lowest porosity level of 22.2%, while Muttrina Sannam had the highest at 59.5%.

3.4.3. Compressibility Index and Hausner Ratio

The results of two flow characteristics of different rice varieties, the Hausner ratio and compressibility index, are shown in Table 3. Characterizing the behavior of grains in different hoppers, feeders, and other handling equipment is known as flow properties. This provides an insight into how they will interact during flow. Among the 30 varieties, 22 varieties have good flowability with Carr’s index of 15, and for the Hausner ratio, 23 varieties showed excellent to good flowability, whereas 8 varieties indicated poor flowability with HR and CI of >1.18 and >16, respectively. The Carr’s index and Hausner ratio of the traditional paddy cultivars showed considerable variation. Chithiraikaar had the lowest value for Carr’s index (3.78 ± 0.41) and Hausner ratio (1.04), whereas Panangattu Kudavazhai had the highest values for both, with a Carr’s index of 17.27 ± 0.88 and a Hausner ratio of 1.21 (Table 4).

3.5. Engineering Properties

3.5.1. The ED, AMD, GMD, and SMD

Table 5 shows the ED, AMD, GMD, and SMD of local rice varieties. Equivalent diameter is an instrumental factor in determining the diameter of pores on the sieve [15]. Traditional rice varieties exhibited distinct values for equivalent diameters, which ranged from 2.87 ± 0.31 mm in the case of Seeraga Sambato to 4.26 ± 0.27 mm in Mattaikkar, as demonstrated by several authors [16,17]. The grain size range of the local rice types measured by the AMD test was between 3.26 mm and 4.69 mm, with each grain having its own unique value. These types of results were reported by [4,7,18]. The grain sizes of the local rice varieties ranged from 8.02 mm to 10.36 mm in terms of the GMD, while the SMD varied from 3.02 ± 0.33 mm (Seeraga Samba) to 4.28 ± 0.17 mm (Kuzhiyadichan Samba).

3.5.2. Sphericity

Traditional paddy varieties showed notable variations in sphericity ranging from 37.7 in Chinnar to 81.2% in Kallundri Kar and were independent of grain size (Table 5).

3.5.3. Grain Volume and Surface Area

The volume of the grain and surface area were significantly influenced by the paddy varieties (Table 5). The results indicated that the value of volume for paddy ranged from 12.4 ± 1.35 mm3 (Seeraga Samba) to 40.4 ± 2.53 mm3 in Mattaikkar. The maximum surface area was obtained in Kuzhiyadichan Samba (50.1 ± 1.95 mm2), whereas the minimum was obtained in Seeraga Samba (25.4 ± 2.76 mm2).

3.5.4. Aspect Ratio

Among the rice varieties, Kallundri Kaar showed the highest value for an aspect ratio of 1.00, which was statistically comparable with Mattaikkar, associated with a round shape. Chinnar (0.26 ± 0.02) and Bhavani Sannam (0.28 ± 0.02) showed the lowest value for aspect ratio.

3.6. Thousand-Grain Weight

Paddy varieties showed noticeable variations among the varieties for a thousand kernel weights ranging from 17 in Kichili Samba to 39 g in Navara.

3.7. Amylose

Rice eating quality and texture are frequently predicted using the amylose level of the rice. The amylose content of rice cultivars differed significantly (Figure 2), and it ranged between 22.9 and 37.1%. The red-colored variety known as Navara was reported with the highest amylose content.

3.8. Correlation

Pearson’s correlation analysis showed a strong connection between the physical and engineering properties of traditional rice varieties (Table 6). Dimensional properties in all the studied varieties showed significant correlations (p < 0.05 and p < 0.01). For instance, the length had a strong positive correlation with width (r = 0.541 **), thickness (r = 0.789 **), seed size (r = 0.791 **), length/width ratio (r = 0.886 **), equivalent diameter (r = 0.850 **), sphericity (r = 0.419 *), volume (r = 0.722 **), bulk density (r = 0.745 **), tapped density (r = 0.738 **), Hausner ratio (r = 0.781 **), surface area (r = 0.853 **), geometric mean diameter (r = 0.868 **), arithmetic mean diameter (r = 0.936 **), and square mean diameter (r = 0.892 **).
Aspect ratio (r = 0.148), carr’s index (r = 0.174), true density (r = 0.062), and porosity (r = 0.108) were moderately influenced by the length. Carr’s index had a negative correlation with volume. A similar relationship was reported by [19]. This study clearly demonstrated the variations in the properties and the influence of varieties. This is mainly due to the genetic makeup of the individual rice landrace.

3.9. PCA and Heat Map

All the data were run through PCA analysis and reduced into five key principle components using the normalized data that indicate major differences between the physical and engineering properties (Table 7). In this study, only the PCs with eigenvalues higher than 1 were kept. The score plot for the thirty rice varieties is displayed in Figure 3A. The physical and engineering characteristics of the 30 rice varieties varied statistically and considerably from one another, as shown by the PCA score graph. The extracted five PCs explained 95.7% of the total variance, as depicted in the scree plot (Figure 3B).
The pattern of the physical and engineering properties distribution among the 30 varieties is visualized as a heat map (Figure 4). The color scale from yellow to red shows properties in order of decreasing trend.

4. Discussion

For people working in various facets of the rice industry, the physical features such as grain weight, color, and size are of utmost importance, and these are key factors in assessing rice grain quality. The pericarp color of the traditional varieties is presented in Table 1. Rice varieties are preferred based on the pericarp color. Of the 30 varieties, 14 were white in color, 15 were red, and 1 black variety was found. The primary pigments that give the rice its distinctive pericarp color are anthocyanin and proanthocyanidin. Anthocyanin, which is found in the pericarp, gives a red color, whereas proanthocyanidins are responsible for a white color [20].
Of the 30 varieties, 50% have red pigment in their pericarps which are highly preferred by the consumers of metropolitan and cosmopolitan cities. Traditional rice varieties are not polished in order to preserve the color of the grain. Grain length assumes a significant position in the worldwide market with regard to industrial as well as consumer-oriented perspectives [21]. Long-grain rice is profoundly pursued in global markets. A recent survey revealed that traditional varieties of rice grown in the Cauvery Delta region of Tamil Nadu have higher market value abroad. The maximum grain length found in the study was 9.40 mm, as demonstrated by [22]. Grain breadth was also significant in Mattaikar (5.64 ± 0.35 mm), and their values ranged from Kichili Samba (2.30 ± 0.12 mm) to Kallundri Kar (3.91 ± 0.40 mm). This indicates that the differences might be due to the genetic nature of the varieties. Muttrina Sannam had the thinnest paddy dimension of 1.59 mm, whereas Poongar had the thickest (2.26 mm). Grain dimensions play an important role in designing the grading equipment.
Slender types of rice are highly preferred for export quality. The dimensions of the paddy have an enormous effect on the size and accuracy of sieves and graders, which makes them essential in the effective design of equipment [23]. In addition, this axial dimension is also used to derive various engineering properties which are applied in the design of equipment for various post-harvest processes [9]. In this study, we obtained three dominant classes, namely extra-long, long, and medium. Consumers have a high preference for slender grains over those in medium and bold shapes [24]. The local varieties of large grains may fetch a higher price when it is sold by weight. Metro and cosmopolitan cities of India are now favoring larger grains for their higher quality. These traditional varieties can obtain a high market value when they are processed and conserved in a scientific manner, which may benefit farmers in terms of revenue.
Grain slenderness and bulk density have a direct correlation—the slenderer the grain, the lower its bulk density. In particular, round grains are found to have higher bulk densities, and this agrees with Reference [8]. Similar results were obtained in this experiment, leading us to draw the conclusion that grain breadth and bulk density are positively related to each other.
Accurately measuring the bulk density of grains is essential when developing silos and hoppers for seed storage. Having higher bulk density values allows rice to occupy less space during packing [4,25]. Rice with higher bulk resulted in longer cooking times. Rice varieties with low bulk density indicated the need for large storage spaces [26].
Tapped density measures the density of an object after being subjected to vibration or tapping. This vibration leads to a loss in structure and density of bulk solids, resulting in the filling up of gaps between grains by smaller particles. Tapped density is used to evaluate the level of compactness that a grain can attain without experiencing any pressure. It provides a good measure of the limitation that exists when it comes to compressibility.
True density is essential during aeration to eliminate the impurities, as impurities and grain have different densities. This helps in the efficient removal of all the unwanted particles from the grain [27]. The variations in the porosity of paddy indicate distinct differences between varieties. Multiple authors reported a similar range of porosity values [4,7]. The relationship between grain porosity and drying behavior [28]. Grains with more porosity dry out more quickly than grains with less porosity, as porosity creates space for water aeration and diffusion.
The variability in true bulk density and porosity observed between different varieties of a crop may be due to their intrinsic characteristics. The samples which had a low percentage of porosity could cause difficulties in the active drying process of rice [4]. In the event of convective drying with forced draft, the low porosity implies that the obstruction toward air combustion is low, resulting in slower drying than rice with high porosity. On the other hand, high-porosity rice can dry quickly due to its greater air permeability.
AMD, GMD, and SMD are significant for figuring out the pore size of sieves utilized for sorting and grading operations. This information plays a key role in organizing storage structures and transporting rice grains for optimal distribution with minimal loss and efficient post-harvest handling processes.
The present study demonstrated that local varieties of the Cauvery Deltaic region exhibited greater variation in sphericity, agreeing with several previous works [7,17]. Sphericity can be helpful in understanding the shape of a sieve opening, the orientation and how rice grains will behave when left in their original form, and even the size of components and modeling such systems. In general, a paddy with a less curved shape is usually more difficult to roll than its spheroid-shaped counterpart. However, they can still move around by sliding on their flat sides. With knowledge of the curvature of each grain variety, it is possible to design hoppers efficiently for the milling process [1].
The drying behavior of grain is greatly influenced by grain volume and surface area [29]. The information about the volume to the surface area of rice is significant in the planning of grain cleaners, suction tools, pneumatic separators, and dryers, since it decides the extended region of the grains suspended in a tempestuous air stream [30]. Drying of grains requires both energy and time, which can be accurately measured from the surface area to volume ratio. This is because heat and mass transfer rates are directly proportional to it [31]. In addition to this, several researchers [32,33] highlighted the importance of the surface area in the cooking process, as it is important for the diffusion of water and thereby decides the optimum cooking time.
Grain volume estimations find significance for the development of appropriate drying, warming, and cooling devices that are used during rice processing [18]. Grains that have higher volumes will consume extra space during transportation. In the global market, when rice is exported in volume, grains with the highest volume will be helpful to the vendor since they will consume more space. However, cost-wise, grains with less volume will have lower transportation costs since they will consume less space in the transporting hub than those of high volume [34].
Aspect ratio is considered to be a major factor in rice quality for post-harvest machine designing. It also can have a considerable impact on the market price [4]. In addition, the aspect ratio determines the rolling or sliding behavior of grain in a hopper for developing storage and sorting equipment. The current study agrees with the literature that the majority of the rice varieties have a lower aspect ratio (0.26–1.00), which aids in rolling on the surface of the hopper rather than sliding [17,35].
Thousand-grain weight is a significant parameter for assessing grain yield. From the study, it was found that the pigmented rice had the highest 1000-grain weight among the 30 rice varieties, which will have more yield [30]. Hence, the cultivation of such pigmented rice is urged to increase productivity and profitability.
The primary determinant of the cooking, pasting, nutritional, and eating properties of rice is its amylose content [36]. One of the best single predictors of the texture, in particular the hardness, of samples of rice is thought to be the amylose content [37]. In this study, we found that twenty-eight varieties (nearly 94%) have high amylose content, whereas two belong to the intermediate range, with a content in the range of 22.9–37.1%. The Glycemic Index (GI) value of the rice is influenced by the amylose content of the grain; amylose-rich rice often has a lower GI value. This might be one of the factors contributing to the relative popularity of some traditional rice among local consumers, who are willing to pay a higher price for it. Rice with a high AC is often preferred by Indian and Bangladeshi consumers [38]. Rice with greater amylose content expands more when it is cooked because it tends to absorb more water. After cooking, the texture becomes dry and fluffy, and the grains are simple to separate [39].

Principle Component Analysis and Heatmap

The chosen PCs between the score plots indicated that the property loadings of Chitiraikar, Iluppai Poo Samba, Karukka, Karunguruvai, Kuruvaikalanchium, Kuzhiyadichan Samba, Mappilai Samba, Milagu Samba, Mattaikkar, Nootripathu, Norungan, Panangattu Kudavazhai, and Poongar were on the positive side, and the others remain on the negative side.
The extracted five PCs explained 95.7% of the total variance, as depicted in the scree plot. PC1 accounted for 36% variance and was primarily attributed to factors such as thickness, seed size, equivalent diameter, volume, surface area, geometric mean diameter, arithmetic mean diameter, and square mean diameter. Similarly, the PC2 (25.6% variance) was mainly associated with length, l/w ratio, sphericity, and aspect ratio. Likewise, 12.1% of the variance contributing to PC3 was the tapped density, Carr’s index, and Hausner ratio. The PC4 with 9.9% variance was attributed to true density and porosity, and PC5 (6.8%) was majorly highlighted by bulk density and Tapped density. The PC analysis showed that the rice varieties differed significantly in terms of both individuals and combinations.
An agglomerative hierarchical clustering analysis model was built based on the paddy characteristics to assess the similarities in the detection of inter-group variance in physical and engineering features of the grain samples. The differential characteristics were grouped using a complete-linkage method and shown as thermo grams after the Euclidean distance matrix was calculated for the quantitative values of each group of comparisons. A dendrogram was used to display the cluster memberships of the traditional rice samples along with heatmap visualization. Two major clusters were found in the dendrogram. Clusters 1 and 2 are further branched into sub-clusters of two each.

5. Conclusions

The results of this investigation proved the influence of traditional paddy varieties on dimensional and physical characteristics. Post-harvest losses can be minimized by using the right processing and handling technology, as these characteristics can be beneficial in the development of processing equipment. This research could go a long way in rice breeding programs and the molecular study of traditional rice varieties, ultimately helping to develop balanced cereals with higher nutritional content. Characteristic associations developed by correlation analysis could be effective for creating correlated responses from the selection of more heritable characteristics in order to improve features with low heritability. These studied characteristics of different rice varieties are important in order to minimize post-harvest losses, and promote value addition, quality enhancement, and equipment design for post-harvest processing, resulting in high head rice yield that is desirable and of premium prices in international trade.

Author Contributions

Conceptualization, S.V., D.U.N. and T.E.; methodology, S.V., D.U.N. and T.E.; software, S.V. and D.U.N.; validation, K.S., B.P., S.J.V., T.E., E.S. and S.S.S.; formal analysis, S.V. and D.U.N.; investigation, S.V., D.U.N., K.S., B.P., S.J.V., T.E., E.S., S.S.S., N.B., M.R. and V.G.; resources, S.V., D.U.N., K.S., B.P., S.J.V., T.E., E.S., S.S.S., N.B., M.R. and V.G.; data curation, S.V., D.U.N. and K.S.; writing—original draft preparation, S.V., D.U.N. and K.S.; review and editing, S.V., D.U.N., K.S., B.P., S.J.V., T.E., E.S., S.S.S., N.B., M.R. and V.G.; visualization, B.P., S.J.V., T.E., E.S., S.S.S., N.B., M.R. and V.G.; supervision, T.E., E.S., S.S.S., N.B., M.R. and V.G. All authors have read and agreed to the published version of the manuscript.

Funding

This research received no external funding.

Institutional Review Board Statement

Not applicable.

Informed Consent Statement

Informed consent was obtained from all subjects involved in the study.

Data Availability Statement

The corresponding author can provide the data used in this work upon request.

Acknowledgments

Authors are indebted to the Centre of Excellence in sustaining Soil Health, Anbil Dharmalingam Agricultural College & Research Institute, Trichy, Tamil Nadu Agricultural University, for providing the necessary laboratory and instrumentation facilities to support the study.

Conflicts of Interest

The authors declare no conflict of interest.

References

  1. Ghadge, P.N.; Prasad, K. Some physical properties of rice kernels: Variety PR 106. J. Food Process Technol. 2012, 3, 175. [Google Scholar] [CrossRef]
  2. FAOSTAT. Database for Food and Agriculture, Food and Agricultural Organization of the United Nations. 2015. Available online: http://faostat.fao.org/site/291/default.aspx (accessed on 25 April 2023).
  3. Correa, P.C.; Da Silva, F.S.; Jaren, C.; Junior, P.A.; Arana, I. Physical and mechanical properties in rice processing. J. Food Eng. 2007, 79, 137–142. [Google Scholar] [CrossRef]
  4. Varnamkhasti, M.G.; Mobli, H.; Jafari, A.; Keyhani, A.; Soltanabadi, M.H.; Rafiee, S.; Kheiralipour, K. Some physical properties of rough rice (Oryza sativa L.) grain. J. Cereal Sci. 2008, 47, 496–501. [Google Scholar] [CrossRef]
  5. Malik, M.A.; Saini, C.S. Engineering properties of sunflower seed: Effect of dehulling and moisture content. Cogent Food Agric. 2016, 2, 1145783. [Google Scholar] [CrossRef]
  6. Ghasemlou, M.; Khodaiyan, F.; Gharibzahedi, S.M.T.; Moayedi, A.; Keshavarz, B. Study on postharvest physico-mechanical and aerodynamic properties of mungbean [Vigna radiata (L.) Wilczek] seeds. Int. J. Food Eng. 2010, 6, 1–22. [Google Scholar] [CrossRef]
  7. Mir, S.; Bosco, S.; Sunooj, K. Evaluation of physical properties of rice cultivars grown in the temperate region of India. Int. Food Res. J. 2013, 20, 1521–1527. [Google Scholar]
  8. Bhattacharya, K.R. Rice Quality: A Guide to Rice Properties and Analysis; Woodhead Publishing Limited: Cambridge, UK, 2011. [Google Scholar]
  9. Wani, I.A.; Sogi, D.S.; Wani, A.A.; Gill, B.S. Physico-chemical and functional properties of flours from Indian kidney bean (Phaseolus vulgaris L.) cultivars. LWT-Food Sci. Technol. 2013, 53, 278–284. [Google Scholar] [CrossRef]
  10. Bashir, M.; Haripriya, S. Assessment of physical and structural characteristics of almond gum. Int. J. Biol. Macromol. 2016, 93, 476–482. [Google Scholar] [CrossRef] [PubMed]
  11. Mohsenin, N.N. Physical Properties of Plant and Animal Materials, 2nd ed.; Gordon and Breach Publishers: New York, NY, USA, 1986; ISBN 677023006. [Google Scholar]
  12. Asoegwu, S.N.; Ohanyere, S.O.; Kanu, O.P.; Iwueke, C.N. Physical Properties of African Oil Bean Seed (Pentaclethra macrophylla); International Commission of Agricultural Engineering: Gainesville, FL, USA, 2006; Volume 5, pp. 1–16. [Google Scholar]
  13. Jain, R.; Bal, S. Properties of pearl millet. J. Agric. Eng. Res. 1997, 66, 85–91. [Google Scholar] [CrossRef]
  14. American Association of Cereal Chemists (AACC). Approved Methods of the AACC, 10th ed.; Methods 2000, 61–03; The Association: St. Paul, MN, USA, 2000. [Google Scholar]
  15. Simonyan, K.J.; El-Okene, A.M.; Yiljep, Y.D. Some Physical Properties of Samaru Sorghum, Agricultural Engineering International: The CIGR Ejournal Manuscript FP 07 008; International Commission of Agricultural and Biosystems Engineering: Gainesville, FL, USA, 2007; Volume IX. [Google Scholar]
  16. Bhat, F.M.; Riar, C.S. Physicochemical, cooking, and textural characteristics of grains of different rice (Oryza sativa L.) cultivars of temperate region of India and their interrelationships. J. Texture Study 2017, 48, 160–170. [Google Scholar] [CrossRef]
  17. Meera, M.; Smita, M.; Haripriya, S. Varietal distinctness in physical and engineering properties of paddy and brown rice from southern India. J. Food Sci. Technol. 2019, 56, 1473–1483. [Google Scholar] [CrossRef] [PubMed]
  18. Nadvornıkova, M.; Banout, J.; Herak, D.; Verner, V. Evaluation of physical properties of rice used in traditional Kyrgyz Cuisine. Food Sci. Nutr. 2018, 6, 1778–1787. [Google Scholar] [CrossRef] [PubMed]
  19. Bhat, F.M.; Riar, C.S. Cultivars effect on the physical characteristics of rice (rough and milled) (Oryza Sativa L.) of temperate region of Kashmir (India). J. Food Sci. Technol. 2016, 53, 4258–4269. [Google Scholar] [CrossRef]
  20. Somaratne, G.M.; Prasantha, B.D.R.; Dunuwila, G.R.; Chandrasekara, A.; Wijesinghe, D.G.N.G.; Gunasekara, D.C.S. Effect of polishing on glycemic index and antioxidant properties of red and white basmati rice. Food Chem. 2017, 237, 716–723. [Google Scholar] [CrossRef]
  21. Codex Alimentarius Commission. Proposed Draft Standard for Rice; FAO Food Standards Program CX/CPL/90/5; FAO: Rome, Italy, 1990. [Google Scholar]
  22. Zhong, H.; Liu, S.; Sun, T.; Kong, W.; Deng, X.; Peng, Z.; Li, Y. Multi-locus genome-wide association studies for five yield-related traits in rice. BMC Plant Biol. 2021, 21, 364. [Google Scholar] [CrossRef] [PubMed]
  23. Webb, D.B.; Stermer, R.A. Criteria of rice quality. In Rice Chemistry and Technology American Association of Cereal Chemists; Houston, D.F., Ed.; Incorporated: St. Paul, MN, USA, 1972; pp. 102–139. [Google Scholar]
  24. Custodio, M.C.; Demont, M.; Laborte, A.; Ynion, J. Improving food security in Asia through consumer-focused rice breeding. Glob. Food Secur. 2016, 9, 19–28. [Google Scholar] [CrossRef]
  25. Nalladurai, K.; Alagusundaram, K.; Gayathri, P. PH-postharvest technology: Airflow resistance of paddy and its byproducts. Biosyst. Eng. 2002, 83, 67–75. [Google Scholar] [CrossRef]
  26. Singh, N.; Kaur, L.; Sodhi, N.S.; Sekhon, K.S. Physicochemical, cooking and textural properties of milled rice from different Indian rice cultivars. Food Chem. 2005, 89, 253–259. [Google Scholar] [CrossRef]
  27. Araghi, H.A.; Sadeghi, M.; Hemmat, A. Physical properties of two rough rice varieties affected by moisture content. Int. Agrophys. 2010, 24, 205–207. [Google Scholar]
  28. Adebowale, A.R.A.; Sanni, L.O.; Owo, H.O.; Karim, O.R. Effect of variety and moisture content on some engineering properties of paddy rice. J. Food Sci. Technol. 2011, 48, 551–559. [Google Scholar] [CrossRef]
  29. Storshine, R.; Hamann, D. Physical Properties of Agricultural Materials and Food Products: Course Manual; Purdue University Press: West Lafayette, IN, USA, 1994. [Google Scholar]
  30. Qadir, N.; Wani, I.A. Physical properties of four rice cultivars grown in Indian temperate region. Appl. Food Res. 2023, 3, 100280. [Google Scholar] [CrossRef]
  31. Zareiforoush, H.; Hosseinzadeh, B.; Adabi, M.E.; Motavali, A. Moisture dependent physical characteristics of paddy grains. J. Am. Sci. 2011, 7, 175–182. [Google Scholar]
  32. Mohapatra, D.; Bal, S. Cooking quality and instrumental textural attributes of cooked rice for different milling fractions. J. Food Eng. 2006, 73, 253–259. [Google Scholar] [CrossRef]
  33. Juliano, B.O. Rice in Human Nutrition (No. 26); International Rice Research Institute: Los Baños, Philippines, 1993. [Google Scholar]
  34. Azuka, C.E.; Nkama, I.; Asoiro, F.U. Physical properties of parboiled milled local rice varieties marketed in South-East Nigeria. J. Food Sci. Technol. 2021, 58, 1788–1796. [Google Scholar] [CrossRef]
  35. Al-Mahasneh, M.A.; Rababah, T.M. Effect of moisture content on some physical properties of green wheat. J. Food Eng. 2007, 79, 1467–1473. [Google Scholar] [CrossRef]
  36. Prasantha, B.D.R. Glycemic index of four traditional red pigmented rice. Integr. Food Nutri. Metabol. 2018, 5, 1–3. [Google Scholar] [CrossRef]
  37. Morrison, W.R.; Azudin, M.N. Variation in the amylose and lipid contents and some physical properties of rice starches. J. Cereal Sci. 1987, 5, 35–44. [Google Scholar] [CrossRef]
  38. Choudhury, N.H. Parboiling and Consumer Demand for Parboiled Rice in South Asia; FAO: Rome, Italy, 1991; pp. 47–54. ISBN 971-22-0012-4. [Google Scholar]
  39. Cheng, A.; Ismail, I.; Osman, M.; Hashim, H. Simple and rapid molecular techniques for identification of amylose levels in rice varieties. Int. J. Mol. Sci. 2012, 13, 6156–6166. [Google Scholar] [CrossRef]
Figure 1. Thirty selected traditional rice varieties.
Applsci 13 05705 g001
Figure 2. Amylose content of traditional rice varieties. The error bars represent the standard error of the mean of measurements in three replications.
Applsci 13 05705 g002
Figure 3. (A) PCA of thirty traditional rice varieties—Score plot of PCA. (B) Scree plot of PCA.
Applsci 13 05705 g003
Figure 4. Heat map and cluster analysis representing the changes in physical and engineering properties of thirty traditional rice varieties. Each rice sample is shown as a single column in the heatmap, and each property is shown as a single row. Different shades represent property value, whereas red color represents the trend of decrease and yellow represents a rising trend (color key scale on the right of heatmap).
Applsci 13 05705 g004
Table 1. Dimensions of traditional rice varieties of the Cauvery Deltaic Region.
Varieties Pericarp Colour 1000-Grain Weight (g)Length (mm)Breadth (mm)Thickness (mm)L/W RatioVolume (mm3)
Bhavani SannamWhite238.46 ± 0.67 ab2.33 ± 0.19 ij1.77 ± 0.14 ns3.63 ± 0.29 ab18.7 ± 1.48 jkl
ChinnarWhite249.40 ± 0.56 a2.47 ± 0.15 f–j1.92 ± 0.11 ns3.80 ± 0.23 a23.7 ± 1.41 e–j
ChithiraikaarRed368.60 ± 0.94 ab3.32 ± 0.36 b–e2.13 ± 0.23 ns2.59 ± 0.28 g–l33.4 ± 3.63 bc
Iluppai Poo SambaWhite198.65 ± 0.60 ab3.07 ± 0.21 c–g1.96 ± 0.14 ns2.82 ± 0.19 c–j28.7 ± 1.98 cde
KallukkarWhite268.60 ± 0.54 ab2.74 ± 0.17 d–j1.79 ± 0.11 ns3.14 ± 0.20 b–g23.1 ± 1.44 f–j
KallundriKaarRed343.91 ± 0.40 g3.91 ± 0.40 b2.10 ± 0.21 ns1.00 ± 0.10 m18.4 ± 1.89 jkl
KarukkaRed366.23 ± 0.65 def2.97 ± 0.31 c–i1.99 ± 0.21 ns2.10 ± 0.22 kl20.0 ± 2.09 i–l
KarunguruvaiRed258.19 ± 0.51 ab3.37 ± 0.21 bcd1.91 ± 0.12 ns2.43 ± 0.15 jkl29.9 ± 1.85 bcd
Karuppu KowniBlack348.04 ± 0.60 abc2.70 ± 0.20 e–j1.93 ± 0.14 ns2.97 ± 0.22 c–j22.6 ± 1.69 h–k
KattanurWhite288.48 ± 0.40 ab2.77 ± 0.13 d–j1.78 ± 0.08 ns3.06 ± 0.14 b–i23.0 ± 1.08 g–j
Kichili SambaWhite177.38 ± 0.38 b–e2.30 ± 0.12 j1.72 ± 0.09 ns3.21 ± 0.16 b–f15.6 ± 0.79 lm
Kothamalli SambaRed326.54 ± 0.52 c–f3.18 ± 0.25 cde2.05 ± 0.16 ns2.06 ± 0.1623.4 ± 1.86 e–j
KullakaarRed308.43 ± 0.50 ab3.21 ± 0.19 cde1.85 ± 0.11 ns2.62 ± 0.16 g–l28.3 ± 1.69 c–g
Kuruvai KalanchiumWhite328.80 ± 0.96 ab3.16 ± 0.34 cde2.10 ± 0.23 ns2.78 ± 0.30 c–j31.9 ± 3.47 bcd
Kuzhiyadichan SambaRed338.36 ± 0.32 ab3.48 ± 0.13 bc2.19 ± 0.09 ns2.41 ± 0.09 jkl35.2 ± 1.36 ab
Mappilai SambaRed318.48 ± 0.59 ab3.16 ± 0.22 cde2.05 ± 0.14 ns2.68 ± 0.18 e–j30.1 ± 2.08 bcd
MattaikkarRed365.64 ± 0.35 f5.64 ± 0.35 a1.76 ± 0.11 ns1.00 ± 0.06 m40.4 ± 2.53 a
Milagu SambaWhite255.75 ± 0.59 ef2.74 ± 0.28 d–j1.83 ± 0.19 ns2.10 ± 0.22 kl15.7 ± 1.61 lm
Muttrina SannamWhite287.97 ± 0.83 abc2.39 ± 0.25 hij1.59 ± 0.17 ns3.34 ± 0.35 abc16.5 ± 1.72 lm
NavaraRed397.88 ± 0.49 abc2.98 ± 0.18 c–i1.89 ± 0.12 ns2.65 ± 0.16 f–k24.4 ± 1.51 e–i
NootripathuWhite268.12 ± 0.61 abc3.27 ± 0.24 b–e2.09 ± 0.16 ns2.48 ± 0.19 i–l30.5 ± 2.28 bcd
NorunganRed348.77 ± 0.41 ab3.09 ± 0.14 c–f2.19 ± 0.10 ns2.84 ± 0.13 c–j31.9 ± 1.50 bcd
Panangattu KudavazhaiRed288.22 ± 0.42 ab3.01 ± 0.15 c–h1.98 ± 0.10 ns2.73 ± 0.14 e–j26.8 ± 1.36 d–h
PoongarRed178.47 ± 0.67 ab3.31 ± 0.26 b–e2.26 ± 0.18 ns2.56 ± 0.20 h–l34.3 ± 2.73 b
Salem SannaWhite307.71 ± 0.46 bcd2.34 ± 0.14 ij1.77 ± 0.11 ns3.30 ± 0.20 a–d17.0 ± 1.01 lm
Seeraga SambaWhite225.73 ± 0.62 ef2.36 ± 0.26 hij1.70 ± 0.18 ns2.43 ± 0.26 jkl12.4 ± 1.35 m
Sivappu KowniRed388.80 ± 0.34 ab3.13 ± 0.12 c–f1.83 ± 0.07 ns2.81 ± 0.11 c–j28.4 ± 1.10 c–f
Thaalathootha NamakWhite277.59 ± 0.52 bcd2.34 ± 0.16 ij1.82 ± 0.13 ns3.25 ± 0.22 abcde17.2 ± 1.18 lm
ThooyamalliWhite277.57 ± 0.47 bcd2.42 ± 0.15 g–j1.78 ± 0.11 ns3.13 ± 0.20 b–h17.4 ± 1.09 klm
Vaasanai Seeraga SambaRed197.94 ± 0.81 abc2.95 ± 0.30 c–j2.23 ± 0.23 ns2.69 ± 0.28 e–j27.8 ± 2.85 d–h
Data are presented as the mean ± SE (n = 3). Means followed by the same letter within each row are not significantly different at 5% level. Note: ns—non significant; “a–d”—abcd.
Table 2. Classification of Cauvery Deltaic traditional rice varieties based on length–width ratio and seed size.
LandraceL/W RatioShapeLandracesSeed Size (mm3)Size
Mattaikkar1.00 ± 0.06 mRoundSeeraga Samba23.0 ± 2.50 mSmall
KallundriKaar1.00 ± 0.10 mRoundMilagu Samba28.8 ± 2.95 lmSmall
Kothamalli Samba2.06 ± 0.16BoldKichili Samba29.1 ± 1.48 lmSmall
Milagu Samba2.10 ± 0.22 klMediumMuttrinaSannam30.3 ± 3.16 lmMedium
Karukka2.10 ± 0.22 klMediumSalem Sanna31.8 ± 1.89 mMedium
Kuzhiyadichan Samba2.41 ± 0.09 jklMediumKallundriKaar32.0 ± 3.28 klmMedium
Seeraga Samba2.43 ± 0.26 jklMediumThaalathoothaNamak32.3 ± 2.23 jklmMedium
Karunguruvai2.43 ± 0.15 jklMediumThooyamalli32.5 ± 2.03 ijklmMedium
Nootripathu2.48 ± 0.19 i–lMediumBhavani Sannam35.0 ± 2.78 hijklMedium
Poongar2.56 ± 0.20 h–lMediumKarukka36.8 ± 3.83 hijklLarge
Chithiraikaar2.59 ± 0.28 g–lMediumKattanur41.8 ± 1.96 ghijkLarge
Kullakaar2.62 ± 0.16 g–lMediumKaruppuKowni42.0 ± 3.14 ghijLarge
Navara2.65 ± 0.16 f–kMediumKallukkar42.2 ± 2.64 ghiLarge
Mappilai Samba2.68 ± 0.18 e–jMediumKothamalli Samba42.7 ± 3.40 fghLarge
VaasanaiSeeraga Samba2.69 ± 0.28 e–jMediumNavara44.3 ± 2.75 efhLarge
PanangattuKudavazhai2.73 ± 0.14 e–jMediumChinnar44.5 ± 2.65 efghLarge
KuruvaiKalanchium2.78 ± 0.30 c–jMediumPanangattuKudavazhai49.1 ± 2.50 defgLarge
SivappuKowni2.81 ± 0.11 c–jMediumKullakaar50.1 ± 2.99 cdefgLarge
Iluppai Poo Samba2.82 ± 0.19 c–jMediumSivappuKowni50.5 ± 1.96 cdefgLarge
Norungan2.84 ± 0.13 c–jMediumVaasanaiSeeraga Samba52.1 ± 5.34 bcdefLarge
KaruppuKowni2.97 ± 0.22 c–jMediumIluppai Poo Samba52.2 ± 3.60 bcdefLarge
Kattanur3.06 ± 0.14 b–iSlenderKarunguruvai52.7 ± 3.27 bcdeLarge
Thooyamalli3.13 ± 0.20 b–hSlenderMappilai Samba54.9 ± 3.79 abcLarge
Kallukkar3.14 ± 0.20 b–gSlenderNootripathu55.4 ± 4.15 abcdLarge
Kichili Samba3.21 ± 0.16 b–fSlenderMattaikkar55.9 ± 3.50 abcdLarge
ThaalathoothaNamak3.25 ± 0.22 a–eSlenderKuruvaiKalanchium58.5 ± 6.36 abcdLarge
Salem Sanna3.30 ± 0.20 a–dSlenderNorungan59.2 ± 2.78 abcLarge
MuttrinaSannam3.34 ± 0.35 abcSlenderChithiraikaar60.7 ± 6.61 abLarge
Bhavani Sannam3.63 ± 0.29 abSlenderPoongar63.3 ± 5.03 aLarge
Chinnar3.80 ± 0.23 aSlenderKuzhiyadichan Samba63.8 ± 2.48 aLarge
Data are presented as the mean ± SE (n = 3). Means followed by the same letter within each row are not significantly different at 5% level. Note: “a–d”—abcd.
Table 3. Gravimetric properties influenced by the Cauvery Deltaic traditional rice varieties.
VarietiesBulk Density (g/mL) nsTapped Density (g/mL) nsTrue Density (g/mL)Porosity (%)Carr’s IndexHausner Ratio ns
Bhavani Sannam0.96 ± 0.081.16 ± 0.092.00 ± 0.12 b41.8 ± 2.61 f–i17.11 ± 1.36 ab1.21 ± 0.10
Chinnar0.91 ± 0.051.10 ± 0.072.00 ± 0.18 b45.3 ± 4.17 efg16.89 ± 1.01 abc1.20 ± 0.07
Chithiraikaar1.02 ± 0.111.06 ± 0.122.00 ± 0.12 b47.1 ± 2.81 c–f3.78 ± 0.41 o1.04 ± 0.11
Iluppai Poo Samba0.94 ± 0.061.10 ± 0.082.50 ± 0.18 a55.9 ± 3.96 ab14.90 ± 1.03 a–f1.18 ± 0.08
Kallukkar0.98 ± 0.061.18 ± 0.071.67 ± 0.06 bc29.2 ± 1.10 j–n16.61 ± 1.04 a–d1.20 ± 0.08
KallundriKaar0.96 ± 0.101.08 ± 0.111.67 ± 0.08 bc34.9 ± 1.58 ij11.34 ± 1.16 i–l1.13 ± 0.12
Karukka0.94 ± 0.101.00 ± 0.101.67 ± 0.11 bc39.9 ± 2.73 ghi6.07 ± 0.63 no1.06 ± 0.11
Karunguruvai1.11 ± 0.071.18 ± 0.072.50 ± 0.24 a52.7 ± 5.03 a–d6.21 ± 0.39 no1.07 ± 0.07
KaruppuKowni0.97 ± 0.071.11 ± 0.081.43 ± 0.07 cd22.2 ± 1.06 no12.64 ± 0.95 f–j1.14 ± 0.09
Kattanur1.01 ± 0.051.15 ± 0.052.00 ± 0.10 b42.3 ± 2.18 e–h12.31 ± 0.58 g–k1.14 ± 0.05
Kichili Samba0.96 ± 0.051.15 ± 0.062.00 ± 0.17 b42.3 ± 3.64 e–h17.06 ± 0.87 abc1.21 ± 0.06
Kothamalli Samba0.99 ± 0.081.15 ± 0.092.50 ± 0.18 a54.2 ± 4.00 abc13.69 ± 1.09 e–i1.16 ± 0.09
Kullakaar0.99 ± 0.061.18 ± 0.072.00 ± 0.12 b40.8 ± 2.55 f–i16.32 ± 0.97 a–d1.19 ± 0.07
KuruvaiKalanchium0.86 ± 0.090.95 ± 0.101.25 ± 0.12 de23.7 ± 2.19 l–o10.26 ± 1.12 j–m1.11 ± 0.12
Kuzhiyadichan Samba0.98 ± 0.041.15 ± 0.041.67 ± 0.10 bc30.9 ± 1.84 jkl14.67 ± 0.57 b–g1.17 ± 0.05
Mappilai Samba0.95 ± 0.071.08 ± 0.071.67 ± 0.12 bc35.1 ± 2.49 hij11.92 ± 0.82 h–l1.14 ± 0.08
Mattaikkar0.96 ± 0.061.04 ± 0.071.43 ± 0.05 cd27.0 ± 1.02 k–o8.25 ± 0.52 mn1.09 ± 0.07
Milagu Samba1.01 ± 0.101.05 ± 0.111.43 ± 0.06 cd26.7 ± 1.21 k–o3.82 ± 0.39 o1.04 ± 0.11
MuttrinaSannam0.91 ± 0.101.01 ± 0.112.50 ± 0.17 a59.5 ± 4.08 a9.84 ± 1.02 klm1.11 ± 0.12
Navara0.99 ± 0.061.19 ± 0.072.00 ± 0.19 b40.3 ± 3.85 f–i16.80 ± 1.04 a–d1.20 ± 0.07
Nootripathu0.96 ± 0.071.09 ± 0.081.43 ± 0.07 cd23.4 ± 1.12 mno11.84 ± 0.89 jkl1.13 ± 0.08
Norungan1.01 ± 0.051.18 ± 0.061.67 ± 0.09 bc29.0 ± 1.49 jk–n14.61 ± 0.68 c–g1.17 ± 0.05
PanangattuKudavazhai0.95 ± 0.051.14 ± 0.062.00 ± 0.12 b42.8 ± 1.71 f–i17.27 ± 0.88 a1.21 ± 0.06
Poongar0.98 ± 0.081.14 ± 0.091.67 ± 0.12 bc31.5 ± 2.32 jk14.34 ± 1.14 d–h1.17 ± 0.09
Salem Sanna1.02 ± 0.061.13 ± 0.071.00 ± 0.01 e31.0 ± 0.43 jk9.69 ± 0.58 lm1.11 ± 0.07
Seeraga Samba1.03 ± 0.111.17 ± 0.131.67 ± 0.01 bc29.6 ± 0.16 j–m12.45 ± 1.35 f–j1.14 ± 0.12
SivappuKowni0.92 ± 0.041.09 ± 0.042.00 ± 0.02 b45.7 ± 0.57 d–g15.57 ± 0.60 a–e1.18 ± 0.05
ThaalathoothaNamak0.96 ± 0.071.09 ± 0.082.00 ± 0.03 b45.5 ± 0.74 d–g12.35 ± 0.85 g–j1.14 ± 0.08
Thooyamalli0.92 ± 0.060.96 ± 0.061.67 ± 0.11 bc42.4 ± 2.93 efg4.35 ± 0.27 o1.05 ± 0.07
VaasanaiSeeraga Samba0.97 ± 0.101.01 ± 0.102.00 ± 0.01 b49.5 ± 0.23 b–e4.12 ± 0.42 o1.04 ± 0.11
Data are presented as the mean ± SE (n = 3). Means followed by the same letter within each row are not significantly different at 5% level. Note: ns—non significant; “a–d”—abcd.
Table 4. The empirical relation between the flow properties and the results obtained with two well-known tests (repose Carr’s index and Hausner ratio measurements).
Flow PropertyCarr’s IndexVarietiesHausner RatioVarieties
Excellent≤10Chithiraikaar1.00–1.11Chithiraikaar
Milagu SambaMilagu Samba
VaasanaiSeeraga SambaVaasanaiSeeraga Samba
ThooyamalliThooyamalli
KarukkaKarukka
KarunguruvaiKarunguruvai
MattaikkarMattaikkar
Salem SannaSalem Sanna
MuttrinaSannamMuttrinaSannam
KuruvaiKalanchiumc
Good11–15KuruvaiKalanchium1.12–1.18KallundriKaar
KallundriKaarNootripathu
NootripathuMappilai Samba
Mappilai SambaKattanur
KattanurThaalathoothaNamak
ThaalathoothaNamakSeeraga Samba
Seeraga SambaKaruppuKowni
KaruppuKowniKothamalli Samba
Kothamalli SambaPoongar
PoongarNorungan
NorunganKuzhiyadichan Samba
Kuzhiyadichan SambaIluppai Poo Samba
Iluppai Poo SambaSivappuKowni
Fair16–20SivappuKowni1.19–1.25Kullakaar
KullakaarKallukkar
KallukkarNavara
NavaraChinnar
ChinnarKichili Samba
Kichili SambaBhavani Sannam
Bhavani SannamPanangattuKudavazhai
PanangattuKudavazhai
Table 5. Effect of traditional rice varieties on engineering properties.
VarietiesEquivalent
Diameter (mm)
Geometric
Mean
Diameter (mm) ns
Arithmetic Mean
Diameter (mm)
Square
Mean
Diameter (mm) ns
Sphericity%Aspect RatioSurface Area (mm2)
Bhavani Sannam3.29 ± 0.26 c–g3.27 ± 0.264.19 ± 0.33 a–d3.60 ± 0.2938.7 ± 3.08 e0.28 ± 0.02 ij33.6 ± 2.67 e–i
Chinnar3.56 ± 0.21 a–g3.54 ± 0.214.59 ± 0.27 ab3.91 ± 0.2337.7 ± 2.25 e0.26 ± 0.02 j39.4 ± 2.35 b–e
Chithiraikaar4.00 ± 0.43 abc3.93 ± 0.434.68 ± 0.51 a4.24 ± 0.4645.7 ± 4.97 cde0.39 ± 0.04 c–h48.5 ± 5.28 a
Iluppai Poo3.80 ± 0.26 a–f3.74 ± 0.264.56 ± 0.31 ab4.07 ± 0.2843.2 ± 2.98 cde0.35 ± 0.02 e–j43.8 ± 3.02 abc
Kallukkar3.53 ± 0.22 a–g3.48 ± 0.224.38 ± 0.27 ab3.82 ± 0.2440.5 ± 2.53 de0.32 ± 0.02 f–j38.0 ± 2.38 c–g
KallundriKaar3.28 ± 0.34 c–g3.18 ± 0.333.30 ± 0.34 de3.25 ± 0.3381.2 ± 8.32 a1.00 ± 0.10 a31.7 ± 3.24 e–i
Karukka3.37 ± 0.35 b–g3.33 ± 0.353.73 ± 0.39 b–e3.50 ± 0.3653.4 ± 5.56 c0.48 ± 0.05 bc34.7 ± 3.62 d–h
Karunguruvai3.85 ± 0.24 a–f3.75 ± 0.234.49 ± 0.28 ab4.07 ± 0.2545.8 ± 2.84 cde0.41 ± 0.03 b–f44.2 ± 2.74 abc
KaruppuKowni3.51 ± 0.26 a–g3.48 ± 0.264.23 ± 0.32 abc3.76 ± 0.2843.2 ± 3.24 cde0.34 ± 0.03 e–j37.9 ± 2.84 c–h
Kattanur3.53 ± 0.17 a–g3.47 ± 0.164.34 ± 0.20 ab3.81 ± 0.1840.9 ± 1.92 de0.33 ± 0.02 f–j37.8 ± 1.77 c–h
Kichili Samba3.10 ± 0.16 fg3.08 ± 0.163.80 ± 0.19 a–e3.35 ± 0.1741.7 ± 2.12 de0.31 ± 0.02 g–j29.7 ± 1.51 ghi
Kothamalli Samba3.55 ± 0.28 a–g3.49 ± 0.283.92 ± 0.31 a–e3.69 ± 0.2953.4 ± 4.25 c0.49 ± 0.04 b38.4 ± 3.05 c–f
Kullakaar3.78 ± 0.23 a–f3.69 ± 0.224.50 ± 0.27 ab4.03 ± 0.2443.7 ± 2.61 cde0.38 ± 0.02 c–h42.7 ± 2.54 a–d
KuruvaiKalanchium3.94 ± 0.43 a–d3.88 ± 0.424.69 ± 0.51 a4.20 ± 0.4644.1 ± 4.80 cde0.36 ± 0.02 e–i47.3 ± 5.15 ab
Kuzhiyadichan Samba4.07 ± 0.16 abc4.00 ± 0.164.68 ± 0.18 a4.28 ± 0.1747.8 ± 1.85 cde0.42 ± 0.04 b–f50.1 ± 1.95 a
Mappilai Samba3.86 ± 0.27 a–f3.80 ± 0.264.56 ± 0.31 ab4.11 ± 0.2844.8 ± 3.09 cde0.37 ± 0.02 e–i45.4 ± 3.13 abc
Mattaikkar4.26 ± 0.27 a3.82 ± 0.244.35 ± 0.27 ab4.15 ± 0.2667.8 ± 4.25 b1.00 ± 0.03 a45.9 ± 2.88 abc
Milagu Samba3.11 ± 0.32 fg3.06 ± 0.313.44 ± 0.35 cde3.23 ± 0.3353.3 ± 5.46 c0.48 ± 0.06 bcd29.5 ± 3.02 hi
MuttrinaSannam3.16 ± 0.33 efg3.12 ± 0.323.99 ± 0.42 a–e3.44 ± 0.3639.1 ± 4.07 de0.30 ± 0.05 hij30.5 ± 3.18 f–i
Navara3.60 ± 0.22 a–g3.54 ± 0.224.25 ± 0.26 abc3.83 ± 0.2444.9 ± 2.78 cde0.38 ± 0.03 d–h39.3 ± 2.44 b–e
Nootripathu3.88 ± 0.29 a–e3.81 ± 0.294.49 ± 0.34 ab4.09 ± 0.3147.0 ± 3.52 cde0.40 ± 0.02 b–g45.6 ± 3.42 abc
Norungan3.94 ± 0.18 a–d3.90 ± 0.184.68 ± 0.22 a4.20 ± 0.2044.4 ± 2.08 cde0.35 ± 0.03 e–j47.7 ± 2.24 ab
PanangattuKudavazhai3.71 ± 0.19 a–f3.66 ± 0.194.41 ± 0.22 ab3.96 ± 0.2044.5 ± 2.27 cde0.37 ± 0.02 e–i42.1 ± 2.14 a–d
Poongar4.03 ± 0.32 abc3.98 ± 0.324.68 ± 0.37 a4.27 ± 0.3447.0 ± 3.74 cde0.39 ± 0.03 c–h49.9 ± 3.97 a
Salem Sanna3.19 ± 0.19 d–g3.17 ± 0.193.94 ± 0.23 a–e3.45 ± 0.2141.1 ± 2.45 de0.30 ± 0.02 hij31.5 ± 1.88 e–i
Seeraga Samba2.87 ± 0.31 g2.84 ± 0.313.26 ± 0.35 e3.02 ± 0.3349.6 ± 5.40 cd0.41 ± 0.04 b–h25.4 ± 2.76 i
SivappuKowni3.79 ± 0.15 a–f3.70 ± 0.144.59 ± 0.18 ab4.06 ± 0.1642.0 ± 1.63 bcde0.36 ± 0.01 e–j42.9 ± 1.67 a–d
ThaalathoothaNamak3.20 ± 0.22 d–g3.19 ± 0.223.92 ± 0.27 a–e3.46 ± 0.2442.0 ± 2.89 cde0.31 ± 0.02 g–j31.9 ± 2.20 e–i
Thooyamalli3.22 ± 0.20 d–g3.19 ± 0.203.92 ± 0.25 a–e3.46 ± 0.2242.2 ± 2.64 cde0.32 ± 0.02 f–j32.0 ± 2.00 e–i
Vaasanai Seeraga Samba3.76 ± 0.39 a–f3.73 ± 0.384.37 ± 0.45 ab3.98 ± 0.4147.0 ± 4.82 cde0.37 ± 0.04 e–i43.8 ± 4.49 abc
Data are presented as the mean ± SE (n = 3). Means followed by the same letter within each row are not significantly different at the 5% level. Note: ns—non significant; “a–d”—abcd.
Table 6. Pearson correlation coefficients between various physical properties of traditional rice varieties.
LWTSSL/WEDSVARBDTADCIHRSAGMDAMDSMDTDP
L10.541 **0.789 **0.791 **0.886 **0.850 **0.419 *0.722 **0.1480.745 **0.738 **0.1740.781 **0.853 **0.868 **0.936 **0.892 **0.0620.108
W 10.859 **0.748 **0.2340.893 **0.905 **0.795 **0.873 **0.803 **0.777 **0.0620.789 **0.827 **0.869 **0.798 **0.852 **−0.103−0.075
T 10.788 **0.588 **0.969 **0.858 **0.748 **0.661 **0.935 **0.918 **0.1470.933 **0.898 **0.975 **0.937 **0.963 **−0.114−0.072
SS 10.426 *0.867 **0.498 **0.986 **0.369 *0.607 **0.578 **0.0020.611 **0.975 **0.863 **0.866 **0.870 **0.0440.042
L/W 10.608 **0.2500.333−0.0560.645 **0.657 **0.2590.698 **0.534 **0.639 **0.736 **0.668 **0.0190.090
ED 10.800 **0.849 **0.622 **0.908 **0.888 **0.1230.912 **0.955 **0.998 **0.980 **0.996 **−0.055−0.015
S 10.514 **0.937 **0.862 **0.852 **0.1560.848 **0.642 **0.788 **0.692 **0.757 **−0.187−0.142
V 10.433*0.576 **0.543 **−0.0300.575 **0.954 **0.835 **0.830 **0.842 **0.0300.026
AR 10.654 **0.643 **0.1020.638 **0.480 **0.593 **0.476 **0.558 **−0.186−0.158
BD 10.987 **0.1610.966 **0.762 **0.914 **0.880 **0.903 **−0.131−0.070
TAD 10.3140.982 **0.736 **0.895 **0.865 **0.885 **−0.104−0.054
CI 10.3550.0590.1330.1540.1370.1440.093
HR 10.766 **0.919 **0.899 **0.912 **−0.089−0.036
SA 10.953 **0.949 **0.957 **0.0060.023
GMD 10.986 **0.998 **−0.052−0.011
AMD 10.993 **−0.0130.032
SMD 1−0.0370.005
TD 10.979 **
P 1
Note: L—length, W—width, T—thickness, SS—seed size, L/W—length/width ratio, ED—equivalent diameter (mm), S—sphericity, V—volume, AR—aspect ratio, BD—bulk density, TAD—tapped density, CI—Carr’s index, HR—Hausner ratio, SA—surface area, GMD—geo mean diameter, AMD—arithmetic mean diameter, SMD—square mean diameter, TD—true density, and P—porosity. Correlations are significant at the * p < 0.05 level and ** p < 0.01 level (2-tailed).
Table 7. Principle component analysis of thirty traditional rice varieties.
Parameters PC1PC2PC3PC4PC5
Eigenvalue 7.8384.8622.3061.8861.289
% variance 41.325.612.19.96.8
Cumulative variance 41.366.84478.98088.90595.689
Length 0.528−0.8080.1930.112−0.058
Width 0.5640.774−0.0310.007−0.032
Thickness0.6930.149−0.136−0.1040.043
Seed size0.9960.0120.0200.0260.013
L/W ratio−0.151−0.9470.1740.039−0.100
Equivalent diameter0.9820.1480.0330.045−0.016
Sphericity−0.0440.973−0.122−0.071−0.001
Volume0.9710.1850.0170.020−0.009
Aspect ratio0.0410.979−0.066−0.044−0.050
Bulk density−0.0220.073−0.1080.0670.986
Tapped density0.012−0.0850.6880.0150.720
True density 0.078−0.0550.0870.9700.101
Porosity0.019−0.102−0.1530.967−0.025
Carr’s index0.043−0.1720.980−0.038−0.035
Hausner ratio0.043−0.1830.978−0.033−0.033
Surface area0.9970.0080.0270.0360.007
Geometric mean diameter 0.9970.0030.0350.046−0.001
Arithmetic mean diameter0.897−0.3650.1530.098−0.067
Square mean diameter0.986−0.1080.0790.069−0.024
Note—Highly weighted variables were bolded.
Disclaimer/Publisher’s Note: The statements, opinions and data contained in all publications are solely those of the individual author(s) and contributor(s) and not of MDPI and/or the editor(s). MDPI and/or the editor(s) disclaim responsibility for any injury to people or property resulting from any ideas, methods, instructions or products referred to in the content.

