1. Introduction
Diabetes is a severe (can be long-lasting) condition where the body cannot generate enough insulin or utilize the insulin it produces. The longer a patient has diabetes and has poor blood sugar management, the greater the chance of complications, some of which could be fatal. Numerous illnesses, including kidney damage, nerve damage, eye damage, cardiovascular disease, hearing loss, Alzheimer’s, skin issues, infections, foot damage, and numerous other complications, can be brought on by diabetes [
1].
Globally, 1.5 million deaths were recorded from diabetes in 2019, according to the World Health Organization (WHO). The organization approved five worldwide coverage and treatment goals for diabetes in May 2022, which are to be met by 2030 [
2]. Diabetes affected 536.6 million people aged 20 to 79 worldwide in 2021, with a forecast rise to 783.2 million by 2045. Diabetes affected men and women at almost the same proportions, while people aged 75 to 79 had the highest prevalence. Estimates show that high-income countries had a greater frequency than low-income ones (11.1% vs. 5.5%) and in urban regions (12.1%) than in rural ones (8.3%) in 2021. Over a billion people globally, or more than 10.5% of all adults, now have diabetes, which affects a little over half a billion people [
3].
To avoid complications from DR, the WHO and the American Academy of Ophthalmology advise patients with diabetes to have eye exams at least once a year. This early evaluation would prevent progression caused by any examination delay [
4]. However, for two critical reasons, this advice is inappropriate in many countries. First, several patients, particularly in developing countries, cannot afford routine eye tests. Secondly, not enough medical professionals to meet the demand for ophthalmologists and not enough screening equipment due to the rise in diabetes patients [
5]. Additionally, patients with early-stage DR do not show explicit symptoms or have vision problems.
Due to excessive blood sugar levels, DR is a secondary illness or consequence of diabetes that damages a diabetic person’s eyes. Identification of diabetic patients with retinopathy helps to avoid vision loss. Retinopathy can be avoided with early identification and a healthy lifestyle. Through techniques like image processing and deep learning models, artificial intelligence detects DR [
6,
7,
8]. Proliferative (PrDR) and non-proliferative (NPrDR) retinopathy are the two stages of DR grading. The retina is healthy without DR, and there are three levels of NPrDR: mild, moderate, and severe [
6,
9].
Transfer learning applies knowledge from one problem to a similar one. It allows a pre-trained model to apply information from a massive quantity of labeled data to a similar task and then fine-tune it to the target task using relatively small amounts of labeled data [
10]. Collecting labeled data is both time-consuming and expensive in various practical applications. Transfer learning can solve this problem by starting with a pre-trained model that is already familiar with the core patterns and features of the data. It enables satisfactory results with a substantially smaller amount of labeled data than traditional methods require [
11].
This work aims to detect DR from fundus images. It uses three publicly accessible datasets. Four pre-trained models based on CNN—MobileNetV2, VGG16, InceptionV3, and DenseNet121—have been used in this work, with several evaluation parameters, including loss, accuracy, recall, precision, and specificity. Each dataset is implemented with the same transfer learning methods, and the results are analyzed. Finally, the three datasets are combined to form a single data set and are tested on the models. The main objective of this work is as follows:
To evaluate the performance of models built using MobileNetV2, DenseNet121, VGG16, and InceptionV3 on retinal fundus images.
To train and test a model using three publicly available datasets and integrate it into a new dataset.
Hence the research question for this study is as follows: How do four pre-trained models (MobileNetV2, VGG16, InceptionV3, and DenseNet121) perform on the combined dataset compared to three independent datasets in terms of accuracy, recall, specificity, and precision for DR classification tasks?
The remaining study structure is classified as the review of the previous studies in
Section 2. The materials and methods in
Section 3 describe different datasets used, the class imbalance problem, data augmentation, transfer learning, and the model implementation procedure.
Section 4 presents the experimental results by analyzing four models with three datasets and an integrated dataset, followed by
Section 5′s study discussion. The work is concluded in
Section 6 with future enhancements.
2. Related Works
By creating unique features and designing software that analyses retinal images, numerous techniques have been investigated to address the problem of DR grading. This kind of approach is complex and labor-intensive. The ophthalmologist must also use his knowledge of designing traits and labeling retinal pictures. On the other hand, this necessity is one of the significant issues that must be addressed [
12]. Most of these traditional approaches are unsuccessful in figuring out the answers and understanding how things fit together. It retains many irrelevant picture-specific features, such as rotation, brightness, and size, which impact performance and accuracy rather than learning valuable data [
13]. High-performance optic recognition and classification to identify and separate the afflicted retinal areas have been feasible with the advent of AI approaches such as machine learning (ML) and deep learning (DL) [
14].
The basis of the transfer learning strategy theory is that the approach was previously trained on a sizable image database and could be adjusted to fit the necessary set of data [
15]. This technique has become popular over the past few years because of the availability of large pre-trained models and the lack of labeled data for many real-world challenges [
16]. The Quadratic Weighted Kappa was employed for analyzing the DR prediction in a study by Chilukoti [
17]. They used EfficientNet b3 pre-trained model for the classification. In a paper published by Viji [
18], different models like VGG, Xception, ResNet, Inception, and EfficientNet were employed and achieved an accuracy of 99.36% with 0.986 recall.
In [
19], from the input dataset, features were extracted using a CNN model, and the classification was performed using a support vector machine model. Compared to classifying using the CNN model, this strategy offered faster execution. Medical imaging is crucial at all fundamental health difficulty levels and various medical diseases. DR grading from fundus photos has been the subject of much research using a variety of transfer learning approaches using publicly available datasets. Rahhal et al., [
20] employed Inception [
21], VGG16 [
22], DenseNet [
23], MobileNet [
24], and ResNet models [
25], and VGG16 led to a 100% accuracy rate. The learnable parameters are reduced when multiple layers are stacked without using spatial pooling for CNN models, which are simpler to train [
26]. Kothare and Malpe [
27] constructed a support vector machine and Naive Bayes model with a binary pattern approach. The algorithm was applied to choose pertinent features. As opposed to this, the models were used to categorize patients as having the condition. Concerning accuracy, execution time, and memory use, the support vector machine performs better than the naive Bayes.
Hussain et al. [
28] sought to build an accessible predictor and classifier for hard exudates using artificial neural networks (ANN). Feature extraction and detection were performed using the Speed Up Robust Features technique. For classification, however, Feed-Forward Backpropagation ANN was employed. The work’s major flaw is that it only used a dataset containing 48 photos. Ahmad et al., compare multiple designs, including Inception-ResNetV2, ResNet50, NASNet, InceptionV3, VGG16, DenseNet121, Xception, and VGG19 in the article [
29]. The models carried out classification and localization tasks, which were trained on a proprietary dataset and tested on the Messidor-2 dataset. The CNN and Contrast Limiting Adaptive Histogram Equalization (CLAHE) approaches increased the area under the curve and the fundus images’ quality (23). The CLAHE technique has been introduced, amplifying the retinal vessels to enhance the preprocessing stage.
Various ML classifiers have been merged to enhance DR detection and reduce the error rate [
30]. Accurate diagnosis and DR measurement can be performed using fundus images. An ophthalmologist must have much training and dedication to analyze DR using fundus images manually. DR was effectively categorized using deep learning techniques like CNN and transfer learning using models like ResNet, VGG, and GoogleNet [
20,
31,
32]. In a previous article by Fayyaz [
33], the authors employed a variety of SVM kernels with Ant Colony System (ACS) feature selection method. It evaluates a technique for detecting DR using 250, 550, and 750 features. The cubic SVM classifier significantly outperformed all other kernels, with an accuracy of 92.6%, 91.8%, and 93%, respectively, for 250, 550, and 750 attributes. With the APTOS-2019 dataset, a different study by Nahiduzzaman [
34] utilized an extreme learning machine (ELM) model and reached an accuracy of 97.27%.
A CNN architecture employed for image segmentation tasks is called U-Net. In the work by Jena [
35], segmentation was performed utilizing an asymmetric deep learning architecture for DR screening using U-Net networks. CLAHE is used to analyze and improve the green channel images. For APTOS and MESSIDOR, the non-DR detection accuracy was 98.6% and 91.9%, while the PrDR detection accuracy was 96.8% and 95.76%.
Data augmentation is the most popular method for addressing imbalance issues with image categorization [
36]. It is a collection of strategies for producing more data pieces from existing data to enhance the quantity of data artificially. The images can be improved in various ways, including cropping the image, inverting it horizontally or vertically, resizing it, and rotating it [
37]. In a paper by Mungloo-Dilmohamud [
38], using a data augmentation strategy enhances the standard of transfer learning in classifying DR images.
Table 1 shows the summary table of the related works in DR.
3. Materials and Methods
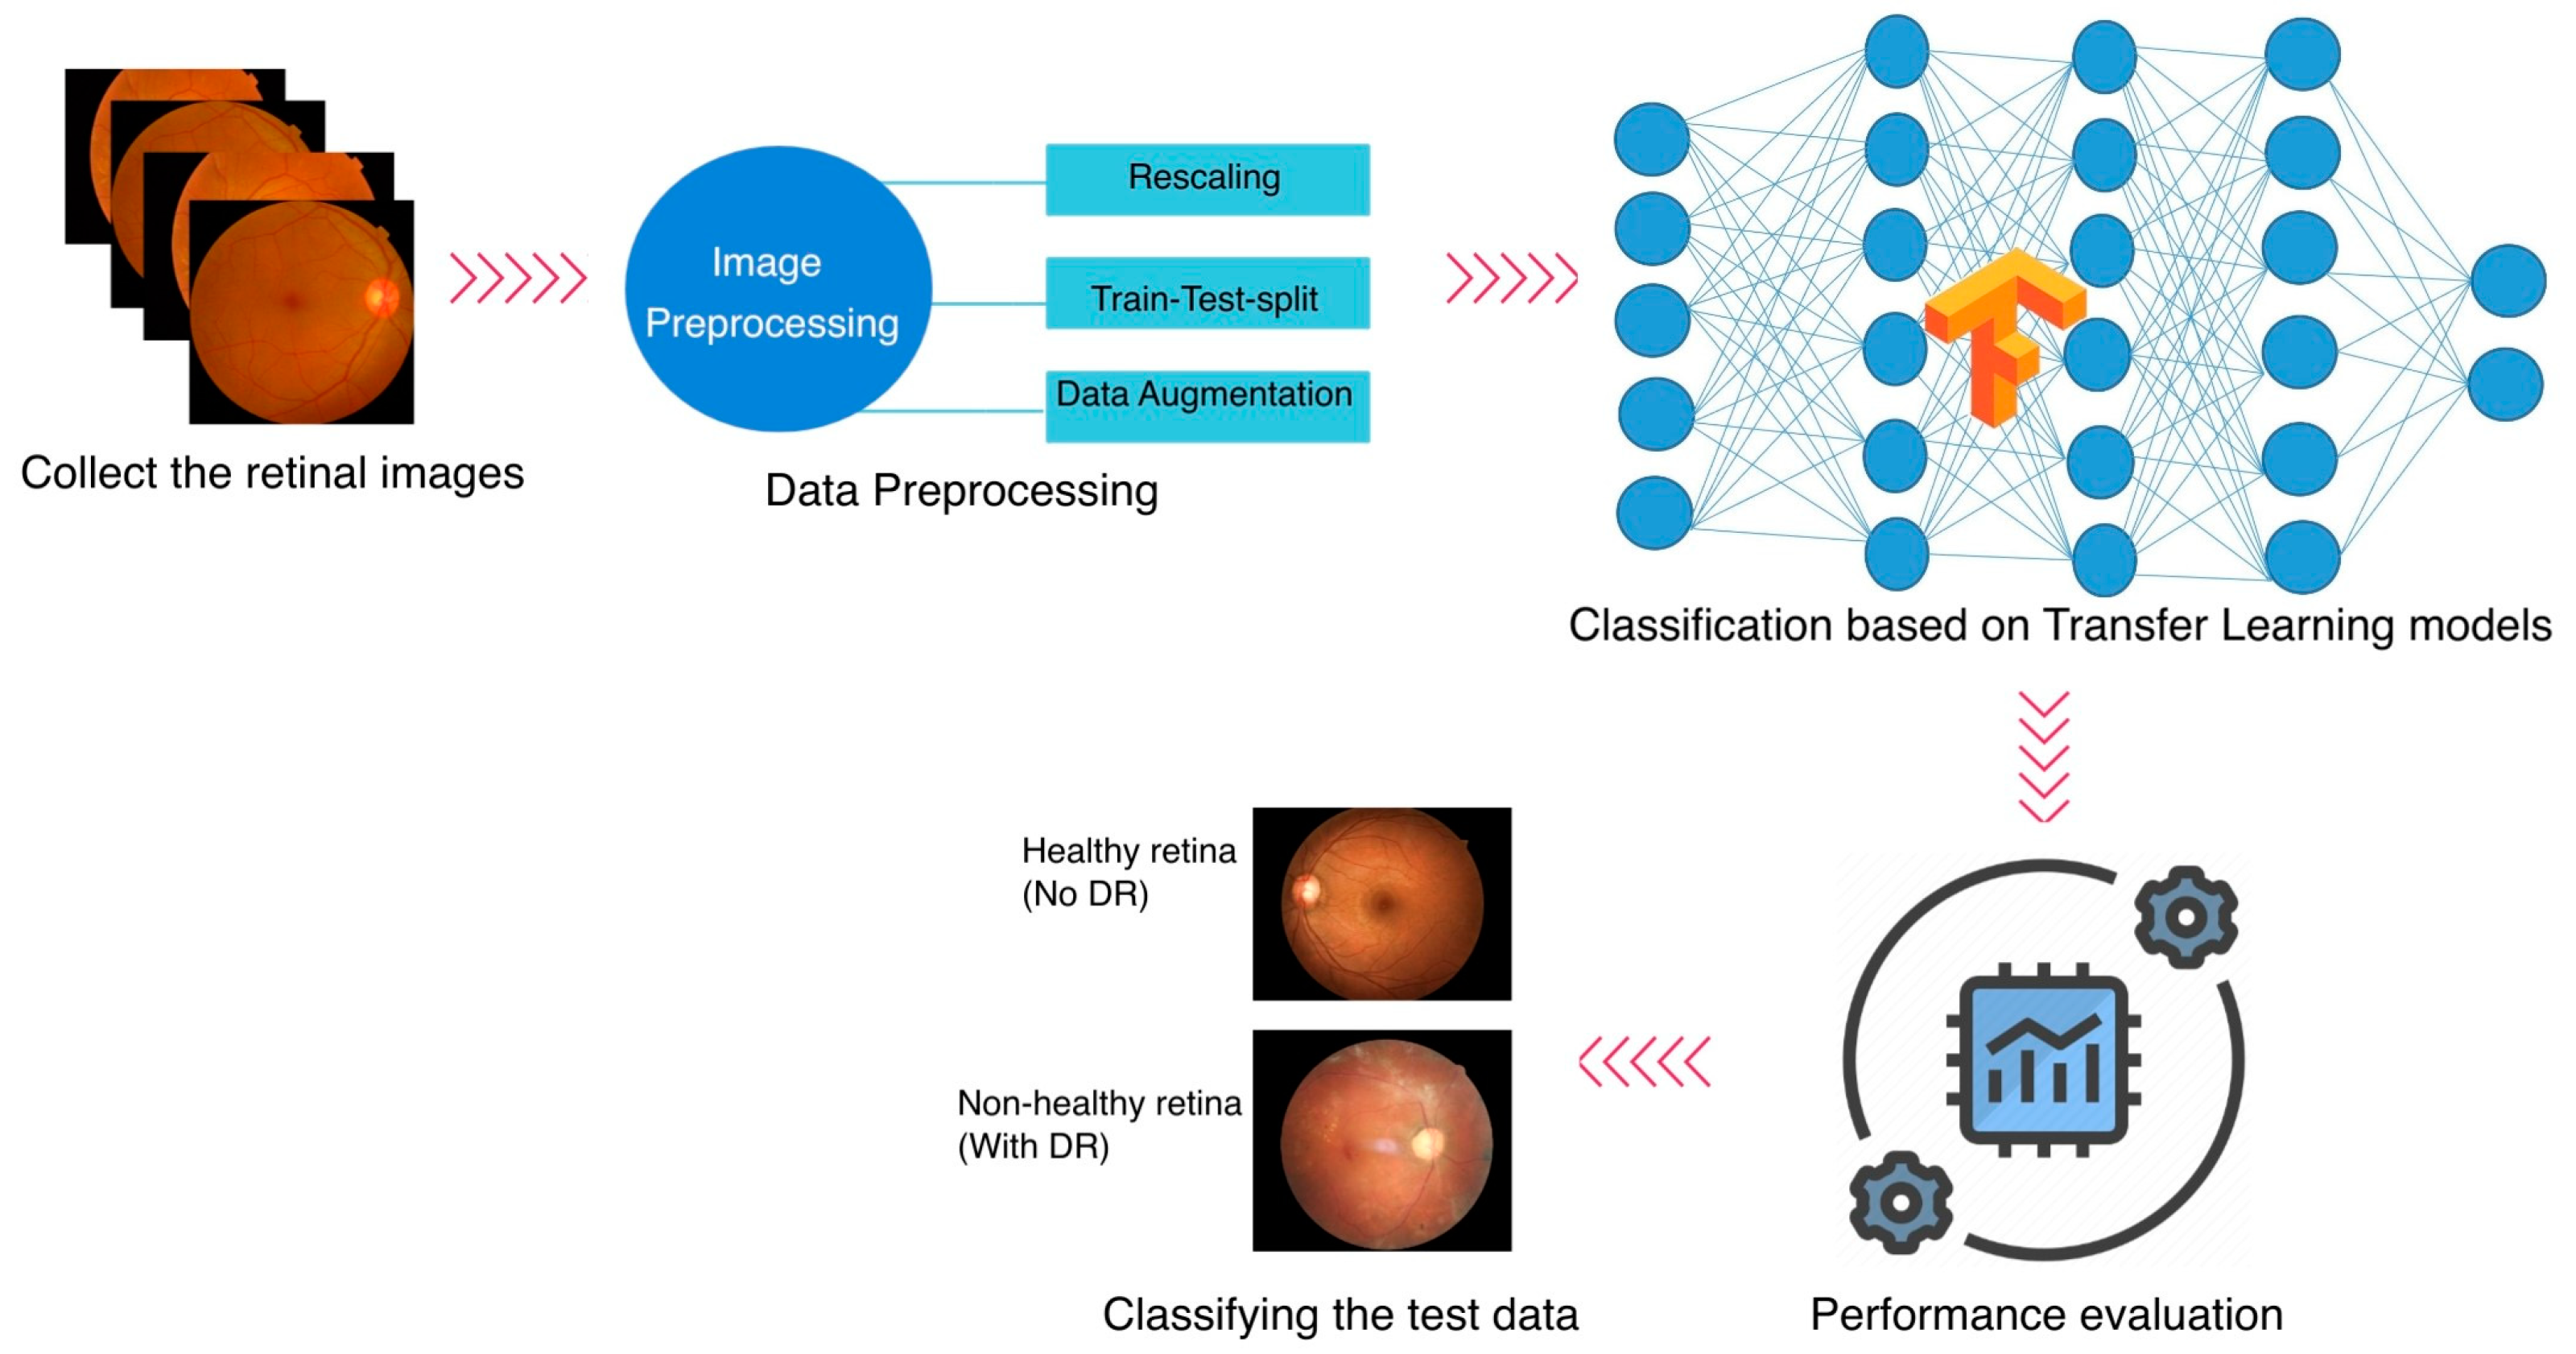
Even though ML first appeared in the healthcare industry several years ago, plenty of openings must be filled, and advancements should be considered. Most medical datasets about DR have a few problems. Many datasets only have a few images, which is not enough for the learning process to work effectively. Additionally, many datasets lack labels, forcing ophthalmologists to analyze and categorize the images according to their medical knowledge. Most of the studies have investigated the DR classification on a specific dataset. In this study, three different publicly accessible datasets are employed for the DR classification task, and an integrated dataset is generated by combining the three. The methodology of the study is explained in
Figure 1. The study follows a binary classification task.
3.1. Datasets
Three datasets from India, the United States, and China are used in this study, namely Asia Pacific Tele-Ophthalmology Society (APTOS) [
55], Eye Picture Archive Communication System (EyePACS) [
56], and Ocular Disease Intelligent Recognition (ODIR) [
57] datasets, respectively. For the APTOS and EyePACS datasets, only the normal and PrDr retinal databases are employed in this study. The PrDR is labeled class 1, and the normal retina class 0.
The APTOS DR severity scale is a reliable and valid tool for grading the severity of DR. It has been extensively applied in Asia-Pacific clinical practice and research. It has also been utilized in creating and assessing computer-aided diagnostic tools for DR that employ retinal pictures to identify and categorize the condition’s severity automatically. The dataset contains 5990 retinal images, of which 3662 are in the training set and 1928 are in the testing stage. The test phase data has no specific labels provided; hence, the 3662-training data are downloaded for this study. There are 1805 class 0 images and 295 class 1 images within it. The statistics indicate that it is approximately six times as many images in class 0 as in class 1.
A Chinese dataset called ODIR was compiled by Shanggong Medical Technology Co., Ltd., Shanghai, China, from data on 5000 patients at various hospitals. Eight labels comprise this dataset, one normal and the other seven representing various retinal illnesses, including pathological myopia, hypertension, glaucoma, cataract, age-related macular degeneration, DR, and other abnormalities. There are 14,400 images in this dataset. DR is only considered for this study, which consists of 2873 normal retinal images and 1608 with DR.
A free retinopathy screening platform with headquarters in the United States offers the EyePACS dataset. EyePACS has been extensively utilized in numerous DR screening programs, making it possible to test sizable populations efficiently and affordably. There are 35,126 images total for both eyes, divided into five classes, where 73.4% of the images in this dataset are healthy and free of DR symptoms, which is a significant imbalance issue [
58]. The work is based on a randomly selected portion of the images. The class distribution of this dataset is 2010 images for class 0 and 708 images for class 1.
3.2. Data Augmentation
If a binary classification project is used, the dataset is deemed unbalanced if the first class’s data set is disproportionately more minor than the second [
59,
60]. The minority class is the one with the least information. In comparison, most of the class is referred to as having a lot of information. The performance of the prediction process is greatly hampered by this disproportion distribution, particularly for the minority class, where it reduces the model’s capacity for learning and causes it to be biased. Furthermore, if the minor class makes up less than 5% of the data, there is a severe problem. The accuracy in this situation will be at least 95%, even if the model incorrectly detects the minor class data. In some applications, this circumstance can be acceptable. However, this problem can undermine the model’s validity in real-world applications.
Data augmentation methods come in various forms [
38]. Nevertheless, geometric transformation is the most well-liked strategy [
38,
61]. It has therefore been applied to the chosen datasets in this study to tackle the class imbalance challenge. Different transformations have been employed, such as height shift, width shift, horizontal flip, vertical flip, and rotation.
Table 2 shows the distribution of data before and after applying data augmentation. The data are combined to make a new dataset. The total count for the integrated data is 6688 for class 0 and 7110 for class 1.
The train-test-split method is chosen with a ratio of 70:30 for model selection. The training set is employed to fit the model or discover the underlying patterns in the data. The testing set examines the model’s performance, specifically how effectively it generalizes to novel, untested data. The total number of training images is 1263, 1407, and 2011 for class 0 and 1242, 1488, and 2250 for class 1 concerning APTOS, EyePACS, and ODIR, respectively. Similarly, 542, 603, and 862 for class 0 and 528, 636, and 966 for class 1 are the count for the test set from APTOS, EyePACS, and ODIR, respectively.
3.3. Transfer Learning Models
Transfer learning is frequently employed when training neural networks to produce the best results [
42,
62]. It can be explained as training a model from start to finish on a dataset with the right amount of data from a related field, then using the target dataset’s insufficient data to fine-tune it. Instead of beginning from scratch, this approach initializes the model with a strong foundation [
63,
64].
One of CNN’s main flaws is the requirement for a sizable number of training samples. Its depth and number of parameters decide the data volume needed for a network; the more layers and parameters a network has, the more data it needs [
65,
66]. Otherwise, there would be a performance-decreasing overfitting issue. However, a significant obstacle in creating DL models for the medical industry is data scarcity. Consequently, it would be advantageous to apply the transfer learning principle to medical projects [
12,
67].
The second iteration of Google’s MobileNet network is known as MobileNetV2. The main goal in creating this network is to keep costs and complexity low, making it easy to use for detection and classification on mobile devices or other devices with constrained resources like memory and energy. Low energy consumption models can benefit medical devices and resource-constrained developing nations. It demonstrates potency in extracting features, segmentation, and object detection [
68].
The Visual Geometry Group (VGG) at Oxford University created the model known as VGG16 in 2014. The primary framework VGGNet has given rise to several modifications, including VGG1, VGG13, VGG16, and VGG19. Among those models, the last two versions, VGG16 and VGG19, are considered more common. Medical applications frequently employ the VGG16 architecture to recognize and categorize diverse clinical images [
31]. The model’s learnable parameter layers are represented by the model’s weighted layers, which total 16. Despite having a modest kernel size, it has a very long processing time [
19].
Google created InceptionV3 in 2015 as a third iteration of the InceptionV1 network, also known as GoogLeNet, based on the CNN model [
69]. The goal of this version is to use less computational power than earlier versions. It has been demonstrated that Inception models are more efficient than VGG regarding memory usage, calculations, and several noticeably reduced parameters [
62].
Strong gradient flow, efficient computing, smooth error signal propagation, and reduced feature complexity are benefits of the DenseNet121 model. The vanishing gradient problem is the primary goal of this network’s construction for the first time [
19]. As the number of layers rises, this issue arises. The more information is lost or deleted, the deeper the network is. DenseNet121 resolves this issue by interconnecting the network’s layers [
52]. The overview of the transfer learning model is depicted in
Figure 2.
3.4. Evaluation Metrics
Each data instance—in this case, an image—has four potential outcomes that are categorized, which are true positive (TrPos), true negative (TrNeg), false positive (FaPos), and false negative (FaNeg). A TrPos indicates that the model accurately predicted an optimistic class and a TrNeg suggests that the model accurately predicted a negative class. A FaPos denotes that the model produced an overly optimistic class forecast. Like the FaPos, a FaNeg implies that the model, in error, made a negative class prediction [
70].
TrPos and TrNeg are the perfect examples in the medical industry since they involve a patient classification for the ill person and a patient classification for the healthy person. The FaNeg example, however, is the most severe instance where a sick person may be mistakenly labeled as healthy rather than unwell. This misclassification in some disorders can be fatal. In the DR, misdiagnosis can result in significant disease progressions that could eventually result in blindness.
The most widely used statistic for assessing a model’s effectiveness at making predictions is its accuracy score (Equation (1)). A loss metric measures the model performance, the sum of mistakes on each occurrence in a training or testing dataset. The precision metric concerns how many positive cases are labeled as positive or how many patients with DR are indeed DR predictions. This score reflects how accurately the model identified the disease from the data. Precision (Equation (2)) is typically utilized when it is necessary to ensure that good forecasts come true.
On the other hand, the specificity (Equation (3)) meter, or TrNeg rate, displays the number of negative classes accurately identified as such, or in our case, the number of healthy people correctly identified as such. A false alarm with a moderate cost would be to label a healthy person as ill. However, if the condition is serious, telling the person about it could set off a panic attack that could be harmful depending on his physical and mental health. Therefore, in some circumstances, having certainty about the diagnosis is advantageous before making it public, which is what the specificity metric offers.
Among all the real positive cases, recall (also known as sensitivity or TrPos rate) (Equation (4)) determines the positive points that were correctly anticipated. The recall measure is significant and necessary in medical applications where the cost of the incorrect prediction, particularly the false negative instance, is quite expensive, especially when the disease has considerable side effects or is contagious and rapidly spreading.
4. Results
The python libraries such as TensorFlow [
71] and Scikit-learn [
72] are used to implement the models in this study. NVidia Titan V GPU is used for DL purposes. VGG16, MobileNetV2, InceptionV3, and DenseNet121 are the four CNN models employed in this work with transfer learning. With a batch size of 32, the total epochs were fixed to 30. In medical image classification, recall measurement is usually regarded as a better performance indicator than accuracy, precision, or specificity because it more accurately depicts the clinical value of classification outcomes [
73].
The top, dense, fully connected layers are removed in charge of classifying data to build the final classification layer according to the proposed method. Sigmoid activation is used for binary classification. To solve the overfitting problem, the EarlyStopping and ReduceLRonPlateau methods are utilized in this study as regularisation approaches. Depending on the supplied settings, the model will terminate training once it obtains the best outcome before it starts to overfit. EarlyStopping parameter examines the validation loss, and if it is stable or increasing for five epochs, then the model stops iterating and saves the best model. Similarly, if the loss value stays the same for two successive epochs, the ReduceLRonPlateau method modifies the learning rate by a factor of 0.1.
Table 3 depicts the parameters employed in the study.
Table 4 displays the APTOS’s performance with four models. The table shows that the MobileNetV2 and DenseNet121 models have identical recall, precision, and accuracy scores of 0.9850, indicating that they perform equally well on this task. The InceptionV3 model also has a better recall value of 0.9830 but a precision of 0.9683, suggesting a higher true positive rate. The VGG16 model has a much lower recall score of 0.3902 but a high precision score of 0.9952, indicating that it misses more true positive cases. The specificity value of all models is also high, meaning the model correctly identifies negative cases and has fewer false positives. Overall, the APTOS model performs very well, with all models achieving high accuracy scores of at least 0.6981. However, the DenseNet121 and MobileNetV2 models perform best on this task.
The following dataset, EyePACS, underwent the same process, and the results are illustrated in
Table 5. The DenseNet121 model produced the best results with a minor loss and the highest accuracy. During 30 epochs with 64 batch sizes, DenseNet121 achieved scores of 0.1412 in training loss, 0.2933 in validation loss, and 0.8910 in accuracy, recall, precision, and specificity. The MobileNetV2 and InceptionV3 models also have relatively high recall, precision, and accuracy scores, with recall and precision scores of over 0.87 and accuracy scores of above 0.8773. The VGG16 model, on the other hand, has a lower recall score of 0.7154 but a high precision score of 0.9420, indicating that it accurately identifies true positive cases but misses many cases. The accuracy score for the VGG16 model is 0.8313, which is lower than the other models evaluated. The specificity value of all models is also high, meaning the model correctly identifies negative cases and has fewer false positives. Overall, the EyePACS model performs well, with all models achieving high accuracy scores of at least 0.8313. However, the DenseNet121 model is the best performer on this task.
Looking at
Table 6, the DenseNet121 model has the highest recall, precision, and accuracy scores, all of which are 0.7582. The MobileNetV2 model also has relatively high recall, precision, and accuracy scores, with 0.75. The VGG16 model has a recall score of 0.7743, which is higher than the other models, but a lower precision score of 0.7151, indicating that it identifies false positive cases. The accuracy score for the VGG16 model is 0.7177, the lowest among the models evaluated. The InceptionV3 model has the lowest recall score of 0.6739, indicating that it misses more true positive cases. The specificity values are reasonably high, with a score above 0.65 for all models. Overall, the ODIR model performs reasonably well, with all models achieving accuracy scores of at least 0.6723. However, the DenseNet121 and MobileNetV2 models perform best on this task.
Table 7 shows the evaluation metrics results for the model trained on a combined dataset, which includes data from the APTOS, ODIR, and EyePACS datasets. The DenseNet121 and VGG16 models have the highest recall, precision, and accuracy scores, all of which are 0.9897 and 0.9879, respectively. The MobileNetV2 model also has high recall, precision, and accuracy scores, with 0.9851. The InceptionV3 model has lower recall and precision scores than the other models, with scores of 0.9715 and 0.9727, respectively. However, its accuracy score of 0.9721 is still high. The specificity value of all models is also high, meaning the model correctly identifies negative cases and has fewer false positives. Overall, the model trained on the combined dataset performs very well, with all models achieving high accuracy scores of at least 0.9721.
5. Discussions
The data type plays a crucial role and significantly influences the outcomes. In this study, different datasets are combined regardless of the patient’s origin and are trained on four different pre-trained models, namely VGG16, InceptionV3, MobilenetV2, and DenseNet121. The system had undergone proof-of-concept development on a relatively limited scale. It may be expanded (as a future enhancement) to incorporate more datasets and models from many new ethnic groups and nations.
Many researchers have used pretrained transfer learning models to predict and classify DR retinal images. Almost all works are trained on a single dataset. The VGG16, Densenet121, InceptionV3, and MobileNetV2 models are recognized for effective use as a CNN model for DR classification. Rahhal et al. [
20] show an accuracy of 100% in classifying DR with the VGG16 model. With five classes in DR, Rocha et al. [
31] attained an accuracy of 89.8% and 90.2% for six categories. Bilal et al. [
47] trained InceptionV3 with three different datasets and achieved an accuracy of 97.92% with EyePACS, 94.59% in Messidor-2, and 93.52% with the DIARETDB0 dataset. Hagos and Kant [
54] showed an accuracy of 90.9% with a binary classification of DR with the InceptionV3 model. Bagadi et al. [
74] achieved an accuracy of 95% with the DenseNet121 model for the APTOS dataset in classifying the DR images. Sarki et al. investigated the subject of grading DR [
75] using MobileNetV1 and MobileNetV2 as well as other transfer learning techniques. Using MobileNetV2, they could classify with 78.1% accuracy, and using MobileNetV1, only 58.3% accuracy. Sheikh S.O. [
76] generated a model with the MobileNetV2 employing a dataset combined by EyePACS, APTOS, and Messidor2 and achieved an accuracy of 91.68%.
Figure 3 depicts the training and validation loss of this study. The APTOS model performs very well, with the DenseNet121 and MobileNetV2 models, with an accuracy of 98.5% and recall of 0.985. There is no massive difference in the loss value of these two models. For the EyePACS dataset, all the models perform better regarding loss value. The evaluation metrics show the DenseNet121 model with an accuracy and recall of 0.891. Similar is the loss value results for the ODIR dataset. However, VGG16 offers a recall value of 0.7743 and the DenseNet121 with an accuracy of 75.82%.
The combined dataset has all models with better training and validation loss. The DenseNet121 model has the highest recall, precision, and accuracy scores, all of which are 0.9897, which is high compared to Sheikh S.O. [
76].
The paired
t-test compares each model’s performance on the combined dataset with their performance on three independent datasets. The alpha or the significant value is set to 0.05. There is a statistically significant difference between the evaluation metrics of the two datasets if the assessed
p-value is less than 0.05. Hence, the null hypothesis is rejected. The significance is described in
Table 8. The combined dataset’s performance is compared with three individual datasets (APTOS, EyePACS, and ODIR) using four evaluation metrics (recall, precision, specificity, and accuracy) for DR classification tasks.
The results show no significant difference in performance for any matrices between the combined and APTOS datasets. However, there is a significant difference between the combined dataset and the EyePACS or ODIR datasets. Overall, these results suggest that the combined dataset performs differently than the EyePACS and ODIR datasets but is like the APTOS dataset. The study also concludes that combining multiple datasets improves performance compared to individual datasets alone.
Plotting the ROC (Receiver Operating Characteristic) Curve is a reliable method of assessing the classification accuracy of a classifier. By charting the True Positive Rate (TPR) and the False Positive Rate (FPR), we can see how the classifier behaves for each threshold. The better the model does in categorizing the data, the closer the ROC curve touches the upper left corner of the figure. To determine how much of the plot lies beneath the curve, we may compute the AUC (area under the curve). The model is better the closer AUC gets to 1 [
77]. The AUC score and the ROC curve of the combined dataset evaluated on four models are illustrated in
Figure 4. The black diagonal dashed line represent the 50% area. From the plot, the combined model shows a better classification of DR and normal retinal images with the DenseNet121 model with an AUC score of 0.9947. The AUC score of MobileNetV2 is 0.9897, VGG16 is 0.9608, and InceptionV3 is 0.9781.
The AUC score of the other three datasets is depicted in
Figure 5, the diagonal black dashed line represents the 50% area. The ODIR shows the least performance, and the APTOS has a similar performance to that of the combined (also concluded from the statistical analysis in
Table 8). When using DenseNet121, the APTOS has a higher AUC score of 0.9902, and EyePACS has a higher AUC score of 0.9320. With the MobileNetV2 model, ODIR has a score of 0.7278 for AUC.
The comparison with previous works is depicted in
Table 9. The transfer learning methods used in this study achieved better performance when compared to related works with binary and multi-classification.
Evaluating models on multiple datasets can provide insight into how well they generalize to new and diverse data. Each dataset may have biases that might influence the overall findings. Consequently, merging the datasets that were publicly available from people of varying ethnicities is a potential solution to the issue of producing biased results. This information may be used to decide which model is appropriate for a particular task or to pinpoint areas that want development.
6. Conclusions
This study investigated the performance of four distinct transfer learning models with each of the four separate data sets. Using the datasets (APTOS, EyePACS, ODIR, and the combined) with preprocessing and data augmentation approaches, we got encouraging findings on our DR classification model in this study. Pretrained models for classifying DR classes include VGG16, InceptionV3, DenseNet121, and MobileNetV2. The APTOS data has the highest accuracy and recall (98.50%) with MobileNetV2 and DenseNet121 models. The test results of EyePACS showed that DenseNet121 has the highest accuracy and recall of 89.10%, while ODIR shows 75.82% accuracy with DenseNet121 and 0.7743 recall value with VGG16. In the combined dataset the DenseNet121 model outperforms other models with high accuracy, recall, specificity, and precision (98.97%). The statistical results suggest that the combined dataset performs differently than the EyePACS and ODIR datasets (p-value less than 0.05) but is like the APTOS dataset (p-value greater than 0.05). Using pre-trained models and transfer learning can increase the effectiveness and accuracy of DL models while requiring less training data and resources. It can be particularly beneficial in applications such as medical diagnosis. The established approach can be widely adopted to accommodate additional screenings for diabetic patients performed by clinics to identify DR and refer them to an ophthalmologist to begin the right course of treatment before it progresses into blindness.
Even though the transfer learning strategy described in this work for the categorization of DR has shown some encouraging findings, there are limitations to the work that needs to be taken into consideration. The study used only a small dataset size and evaluated balanced data. Also, it is not clinically validated. The study may be expanded (as a future enhancement) to incorporate more datasets and models from many new ethnic groups and nations. Also, the model can be deployed into a mobile application as a future enhancement to test with actual patient data.


