
A Multi-Source Data Fusion Method for Assessing the Tunnel Collapse Risk Based on the Improved Dempster–Shafer Theory

Abstract
:1. Introduction
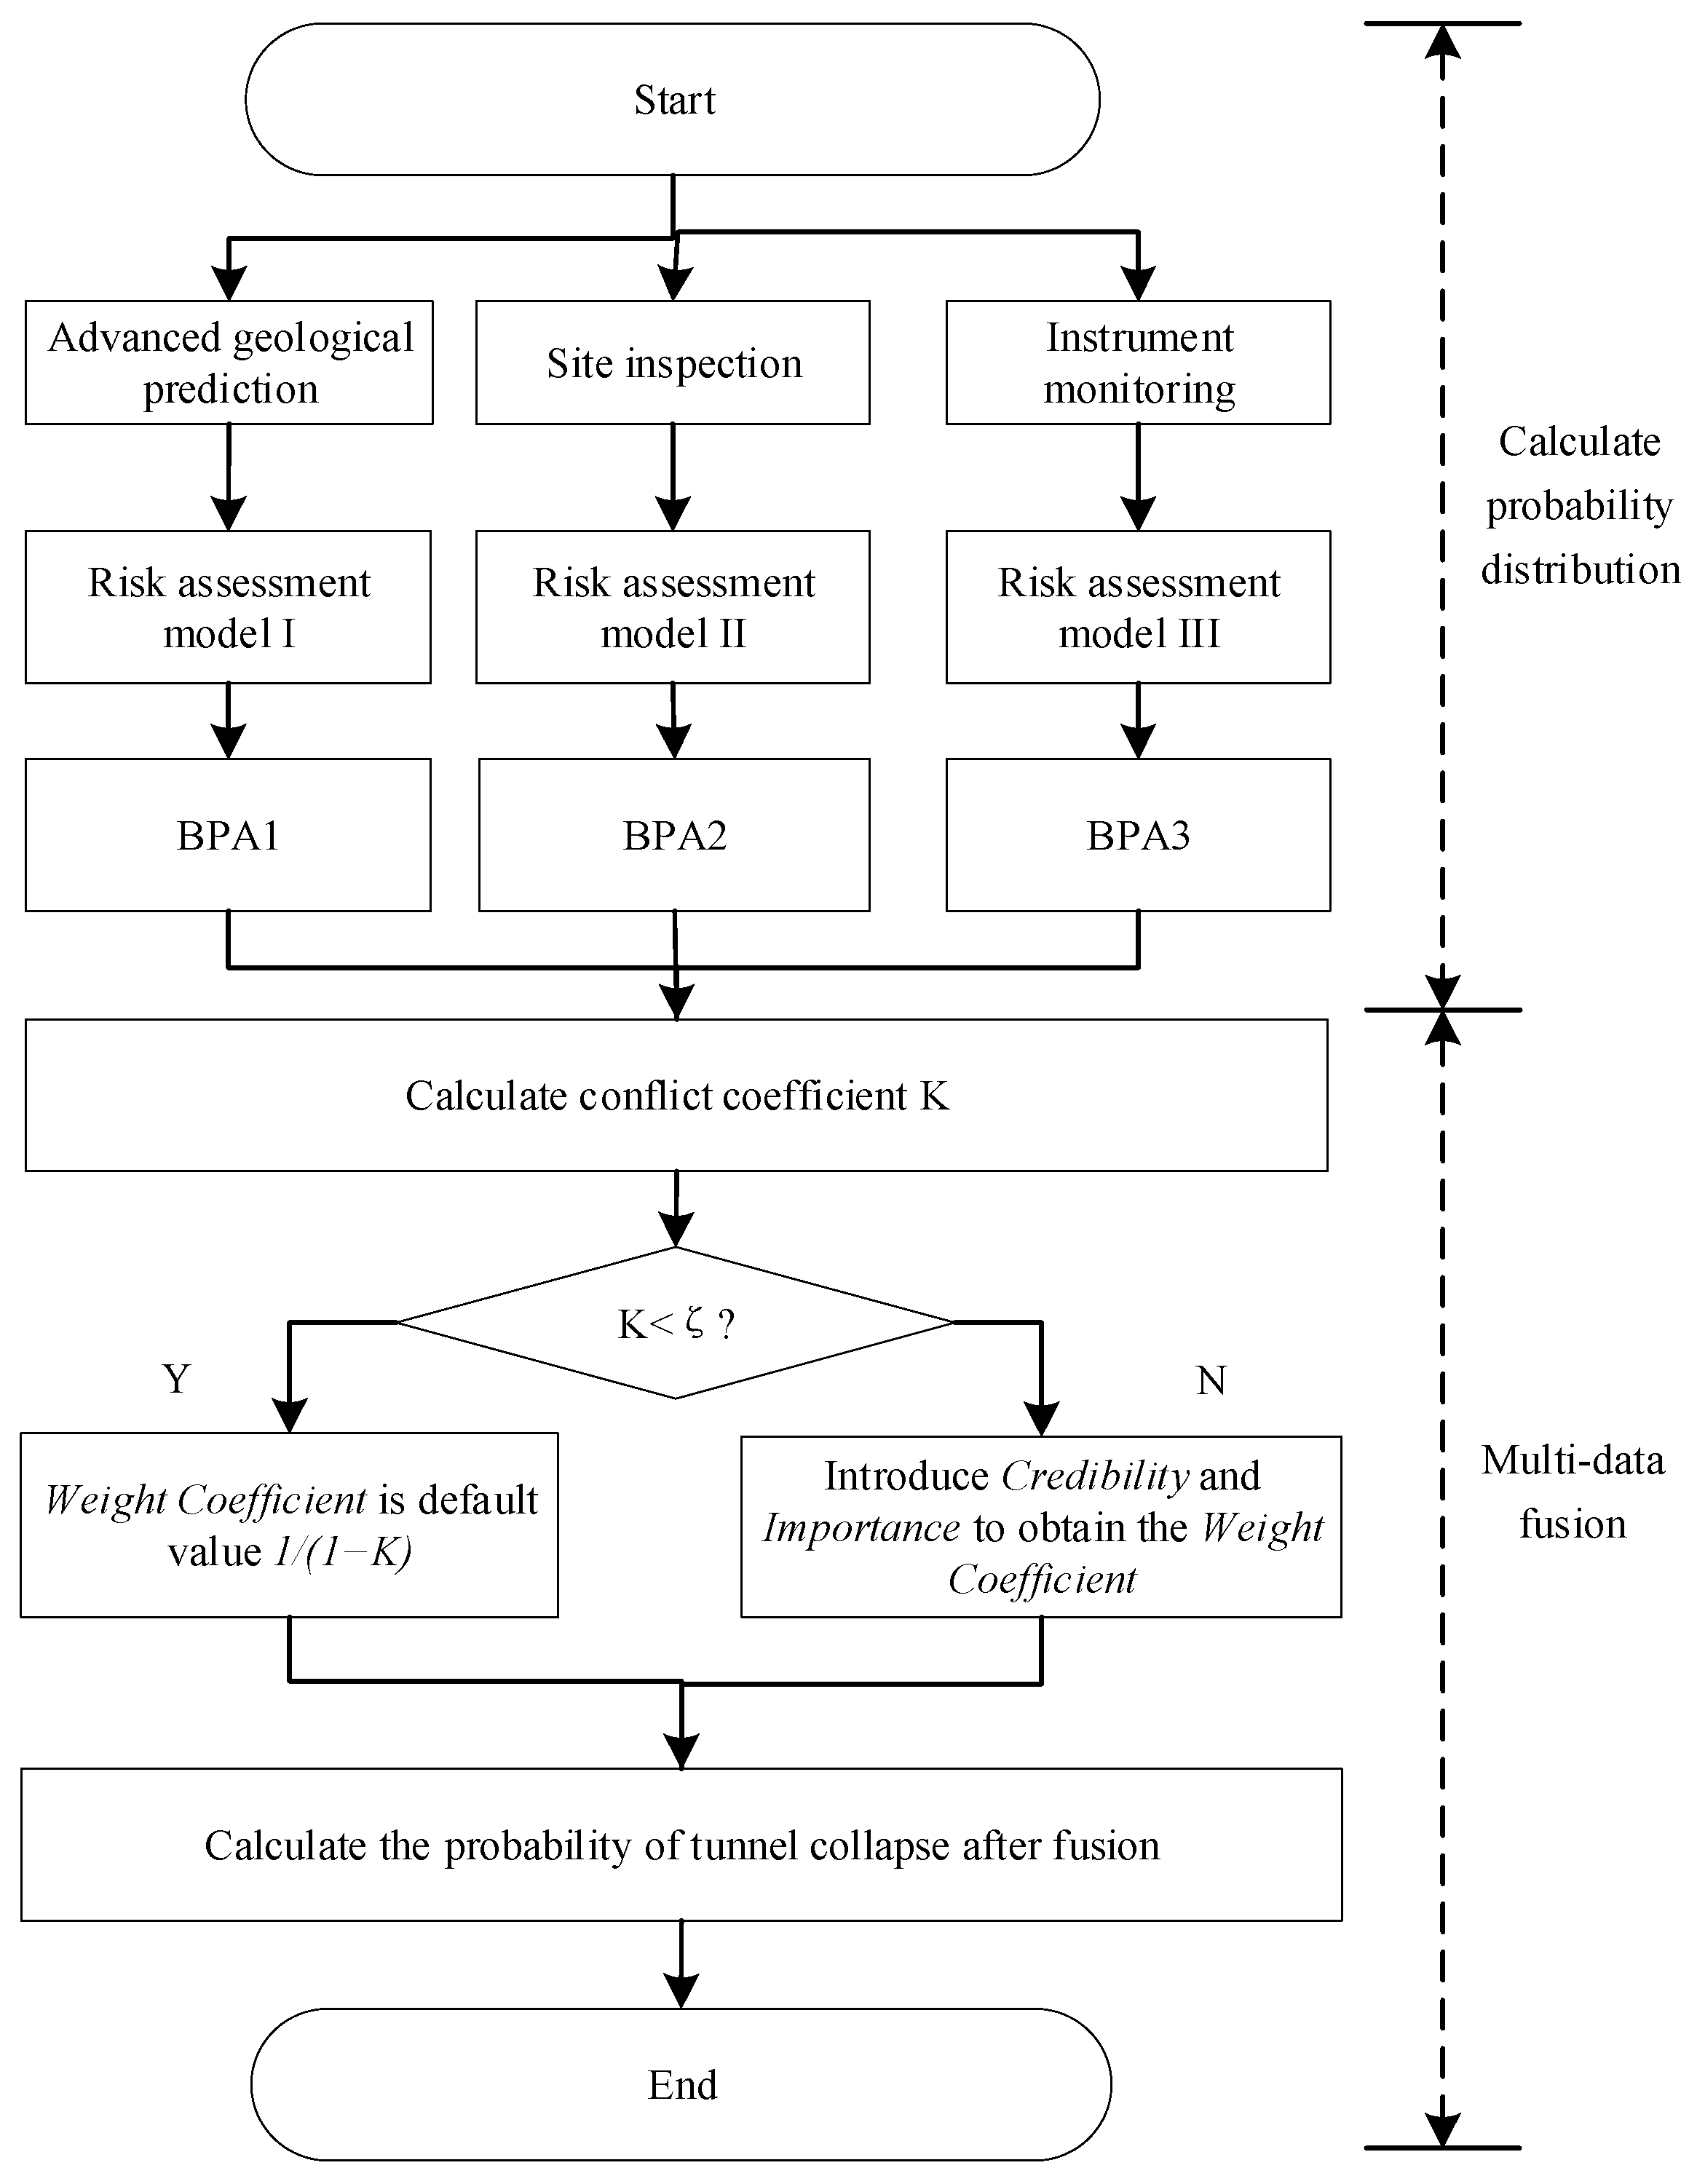
2. Methodology
2.1. Basic Probability Assignment Calculation of Different Evidence Sources
2.1.1. Cloud Model
2.1.2. Gradient Boosting Decision Tree
2.1.3. Support Vector Machines
2.2. Improved D-S Evidence Fusion Collapse Risk Assessment
3. Case Study
3.1. Case Background
3.2. Collapse Risk Assessment Based on Advance Geological Forecast Data
3.3. Collapse Risk Assessment Based on Site Inspection Data
3.4. Collapse Risk Assessment Based on Instrument Monitoring Data
3.5. Collapse Risk Assessment Based on Multi-Source Data Fusion Method
- (1)
- The multi-source information fusion model has good fault tolerance. The fusion model can correct the wrong classifier result by the important rating and reliability. Taking the test sample section No. 5 as an example, the collapse failure probability value obtained by the three single-information source model are , and . According to Equation (10), the credibility can be obtained as . It can be seen from Table 9 that the importance value of the fusion model is . According to Equation (12), the value of BPA, which is combined credibility and importance rating, can be obtained asFirstly, evidence e1 and evidence e2 are fused, and the probability distribution result after fusion is . Then it is fused with evidence e3, and the probability distribution result after fusion is . After normalization, the final BPA result after fusion is . The actual collapse level is Level III. As shown in Table 10, wrong conclusions are given by traditional D-S model. The reason is that the improved D-S model takes into account the importance and credibility, which allows e1 to correct e2 and e3. Through the above analysis, the traditional D-S model is highly sensitive to high conflict evidence when there is a high conflict of evidence, so its performance is poor. In contrast, the improved D-S model, which can be corrected for incorrect classifiers based on the importance rating and confidence of the correct classifier, has better fault tolerance.
- (2)
- The multi-source information fusion method proposed in this paper simultaneously considers information from three sources: advance geological forecast data, site inspection data and instrument monitoring data, which provide a more comprehensive understanding of tunnel collapse risk, thus reducing data uncertainty and improving the accuracy of assessment. Compared with the single information source risk assessment method, the multi-source information fusion assessment has higher accuracy.
- (3)
- When the evaluation results of three single information sources has high conflict (e.g., Tunnel section No. 5), the fusion result of the improved D-S theory is better than the traditional D-S theory. The traditional D-S theory accumulates consensus support only and rejects a proposition completely if it is opposed by any evidence, no matter what support it may acquire from any other evidence. As a result, when three kinds of single information evaluation give high conflict results, the traditional D-S theory will give a fusion result contrary to common sense. The improved method has high accuracy when merging high conflict information sources because of considering the importance rating and credibility.
4. Discussion
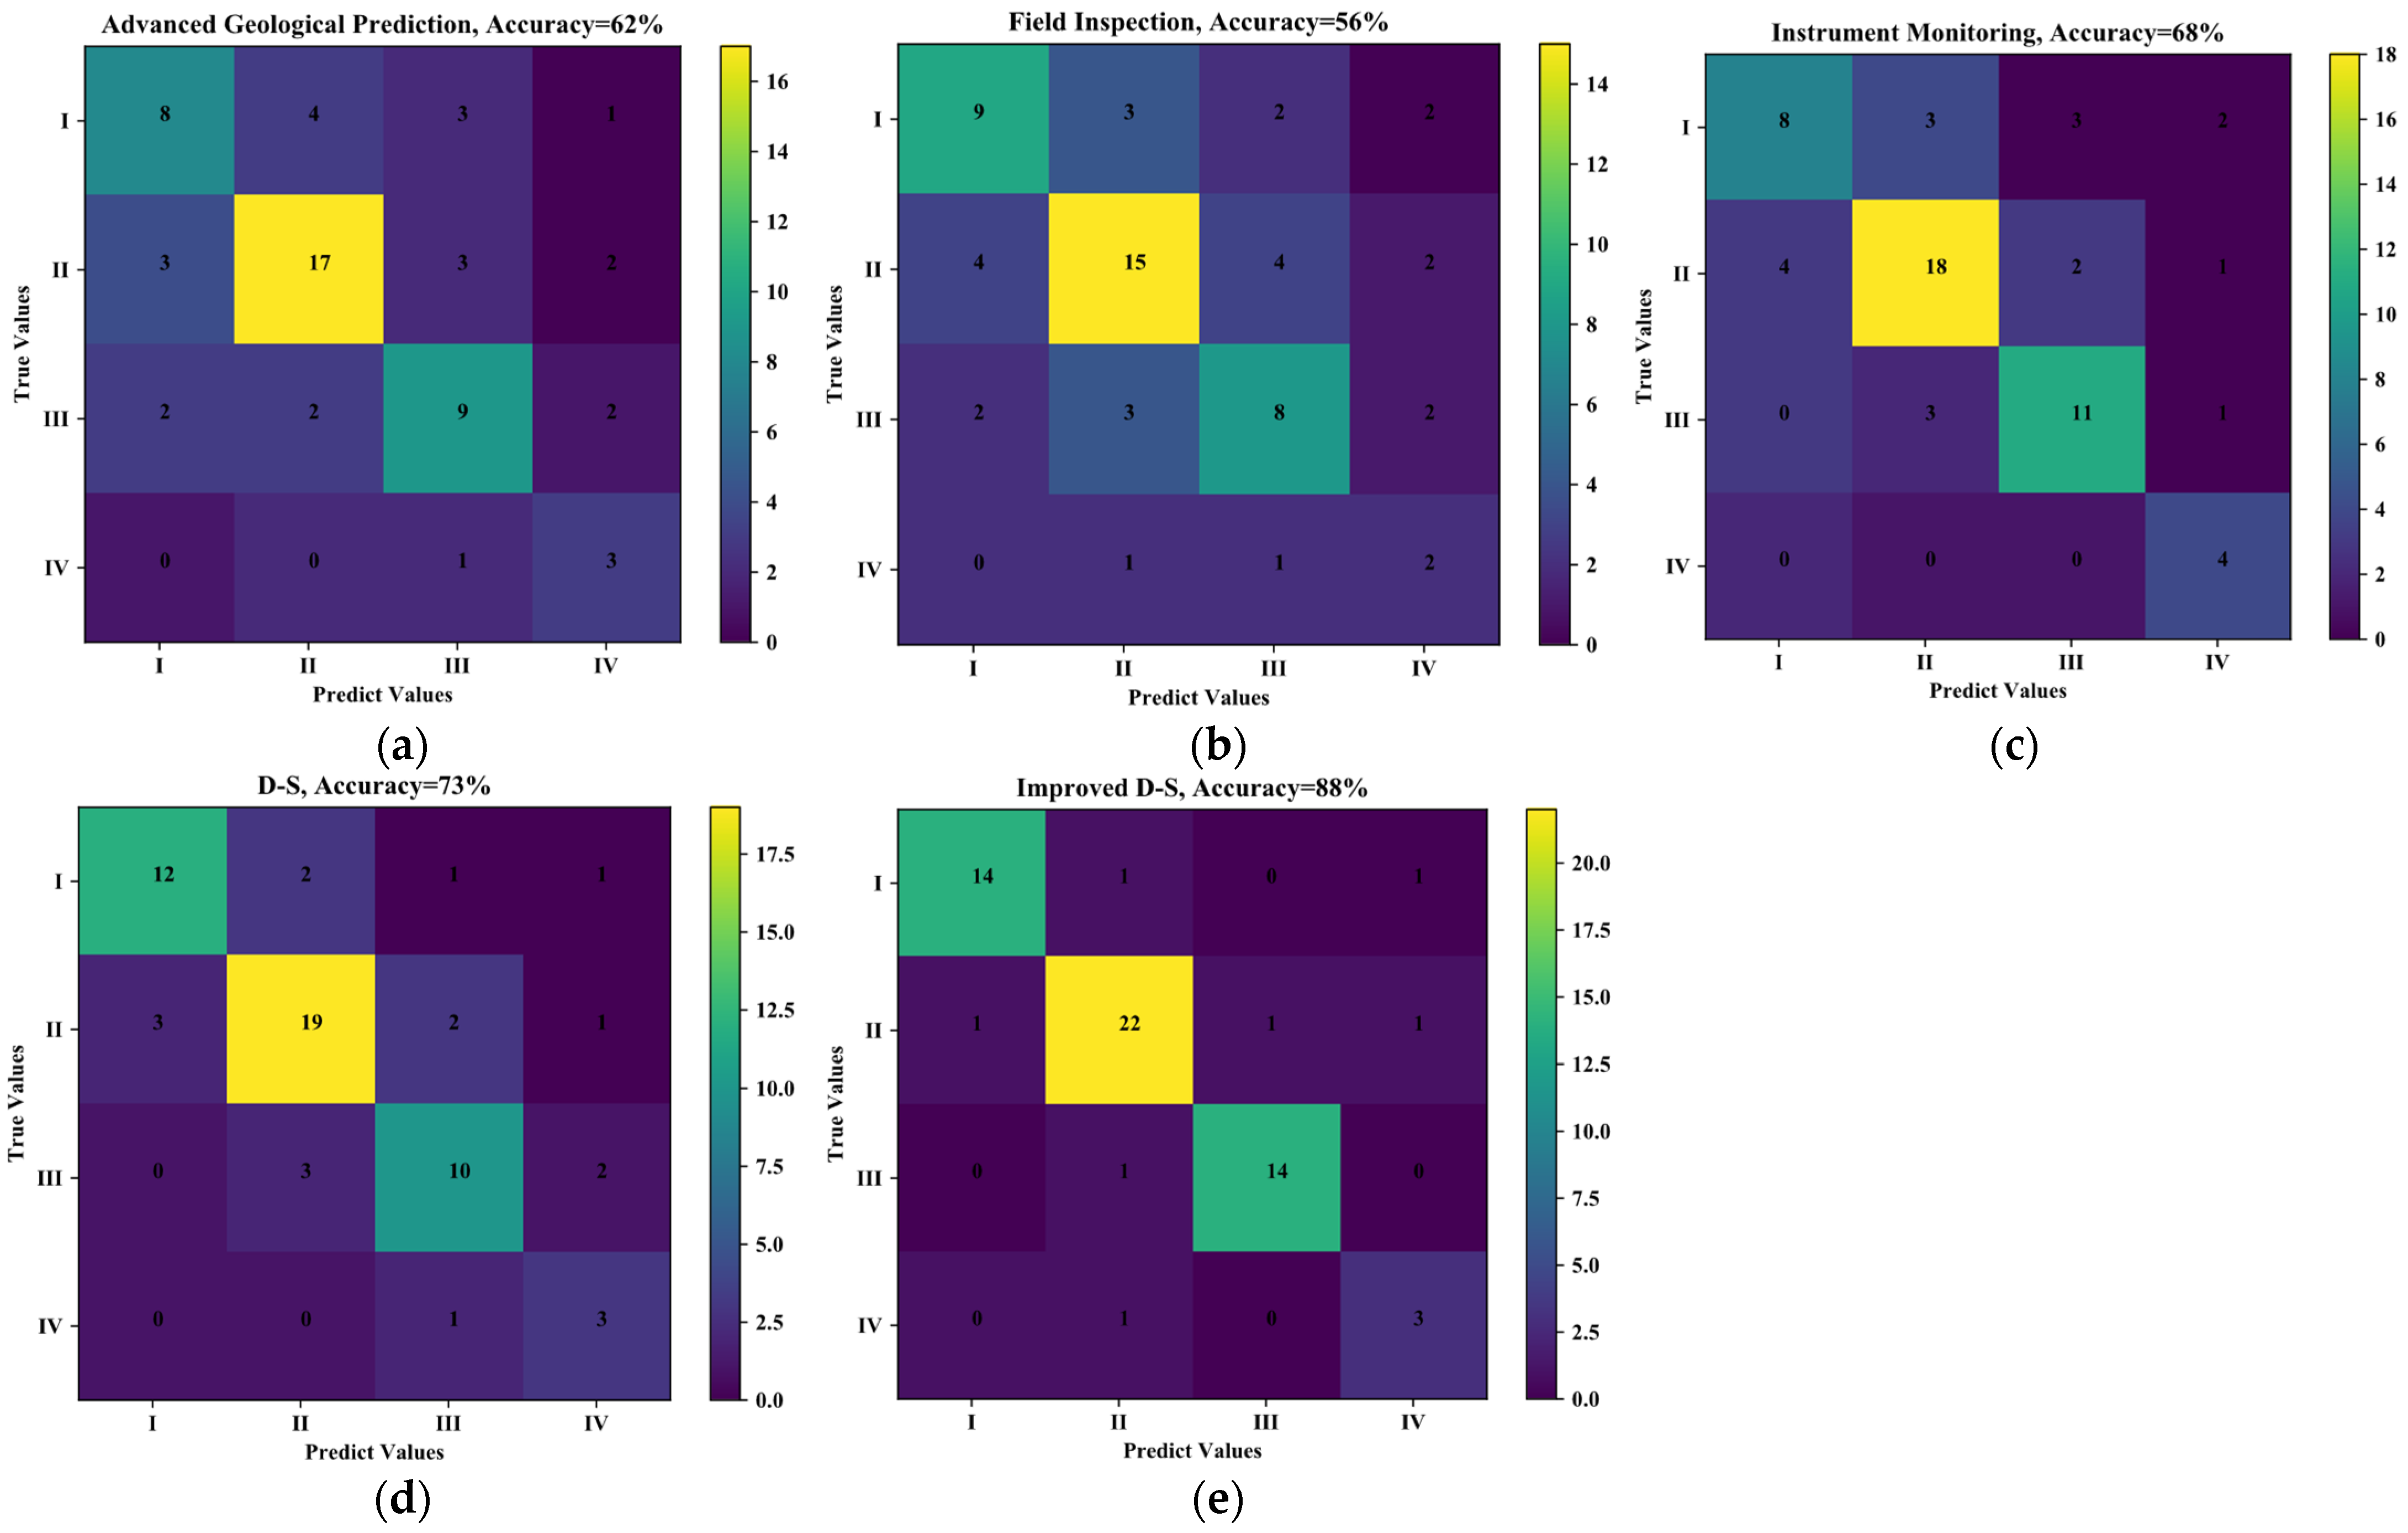
- (1)
- Figure 6 is the confusion matrix diagram of different models. The ordinate represents the test results, the abscissa represents the real results and the numbers in the diagram represent the number of tunnel sections. In Figure 6a, the total number of tunnel sections is 60, which is the sum of all tunnel sections in the figure. In the figure, the number 8 indicates that the number of tunnel sections with ‘risk prediction grade I and actual grade I’ is 8. Similarly, the number 4 indicates that the number of tunnel sections with ‘risk prediction grade II but actual grade I’ is 4. Therefore, the number of tunnel sections with the same prediction level and the actual level can be obtained by adding the numbers of the diagonals in the figure, that is, the number of tunnel sections predicted by the model is correct. The ratio of the number of tunnel sections to the total number of tunnel sections can obtain the prediction accuracy of the model. The accuracy of Advanced Geological Prediction (Figure 6a) is 62% ((8 + 17 + 9 + 3)/(8 + 4 + 3 + 1 + 3 + 17 + 3 + 2 + 2 + 2 + 9 + 2 + 0 + 0 + 1 + 3)). Similarly, the accuracy of Field Inspection (Figure 6b) is 56%, the accuracy of Instrument Monitoring (Figure 6c) is 68%, the accuracy of Traditional D-S (Figure 6d) is 73% and the accuracy of Improved D-S (Figure 6e) is 88%.
- (2)
- The accuracy of the single-source information evaluation method (Figure 6a–c) is less than 70%, which cannot provide accurate decision-making suggestions for construction. The single information source method does not fully consider the risk factors of collapse, making the assessment slightly biased. The accuracy of the traditional D-S evidence fusion method is 73% (Figure 6d), which is slightly higher than that of the single-source information evaluation method, but the accuracy is still low, and it cannot provide accurate guidance for the construction site. As shown in Figure 6e, the multi-source information fusion method has a high evaluation accuracy (88%). This is because the multi-source information model comprehensively considers the advanced geological forecast, on-site inspection and monitoring data, making the evaluation model closer to the actual situation. At the same time, the proposed method considers the importance and credibility, ameliorating the high conflict evidence, making full use of the available information, and improving the accuracy of the evaluation results.
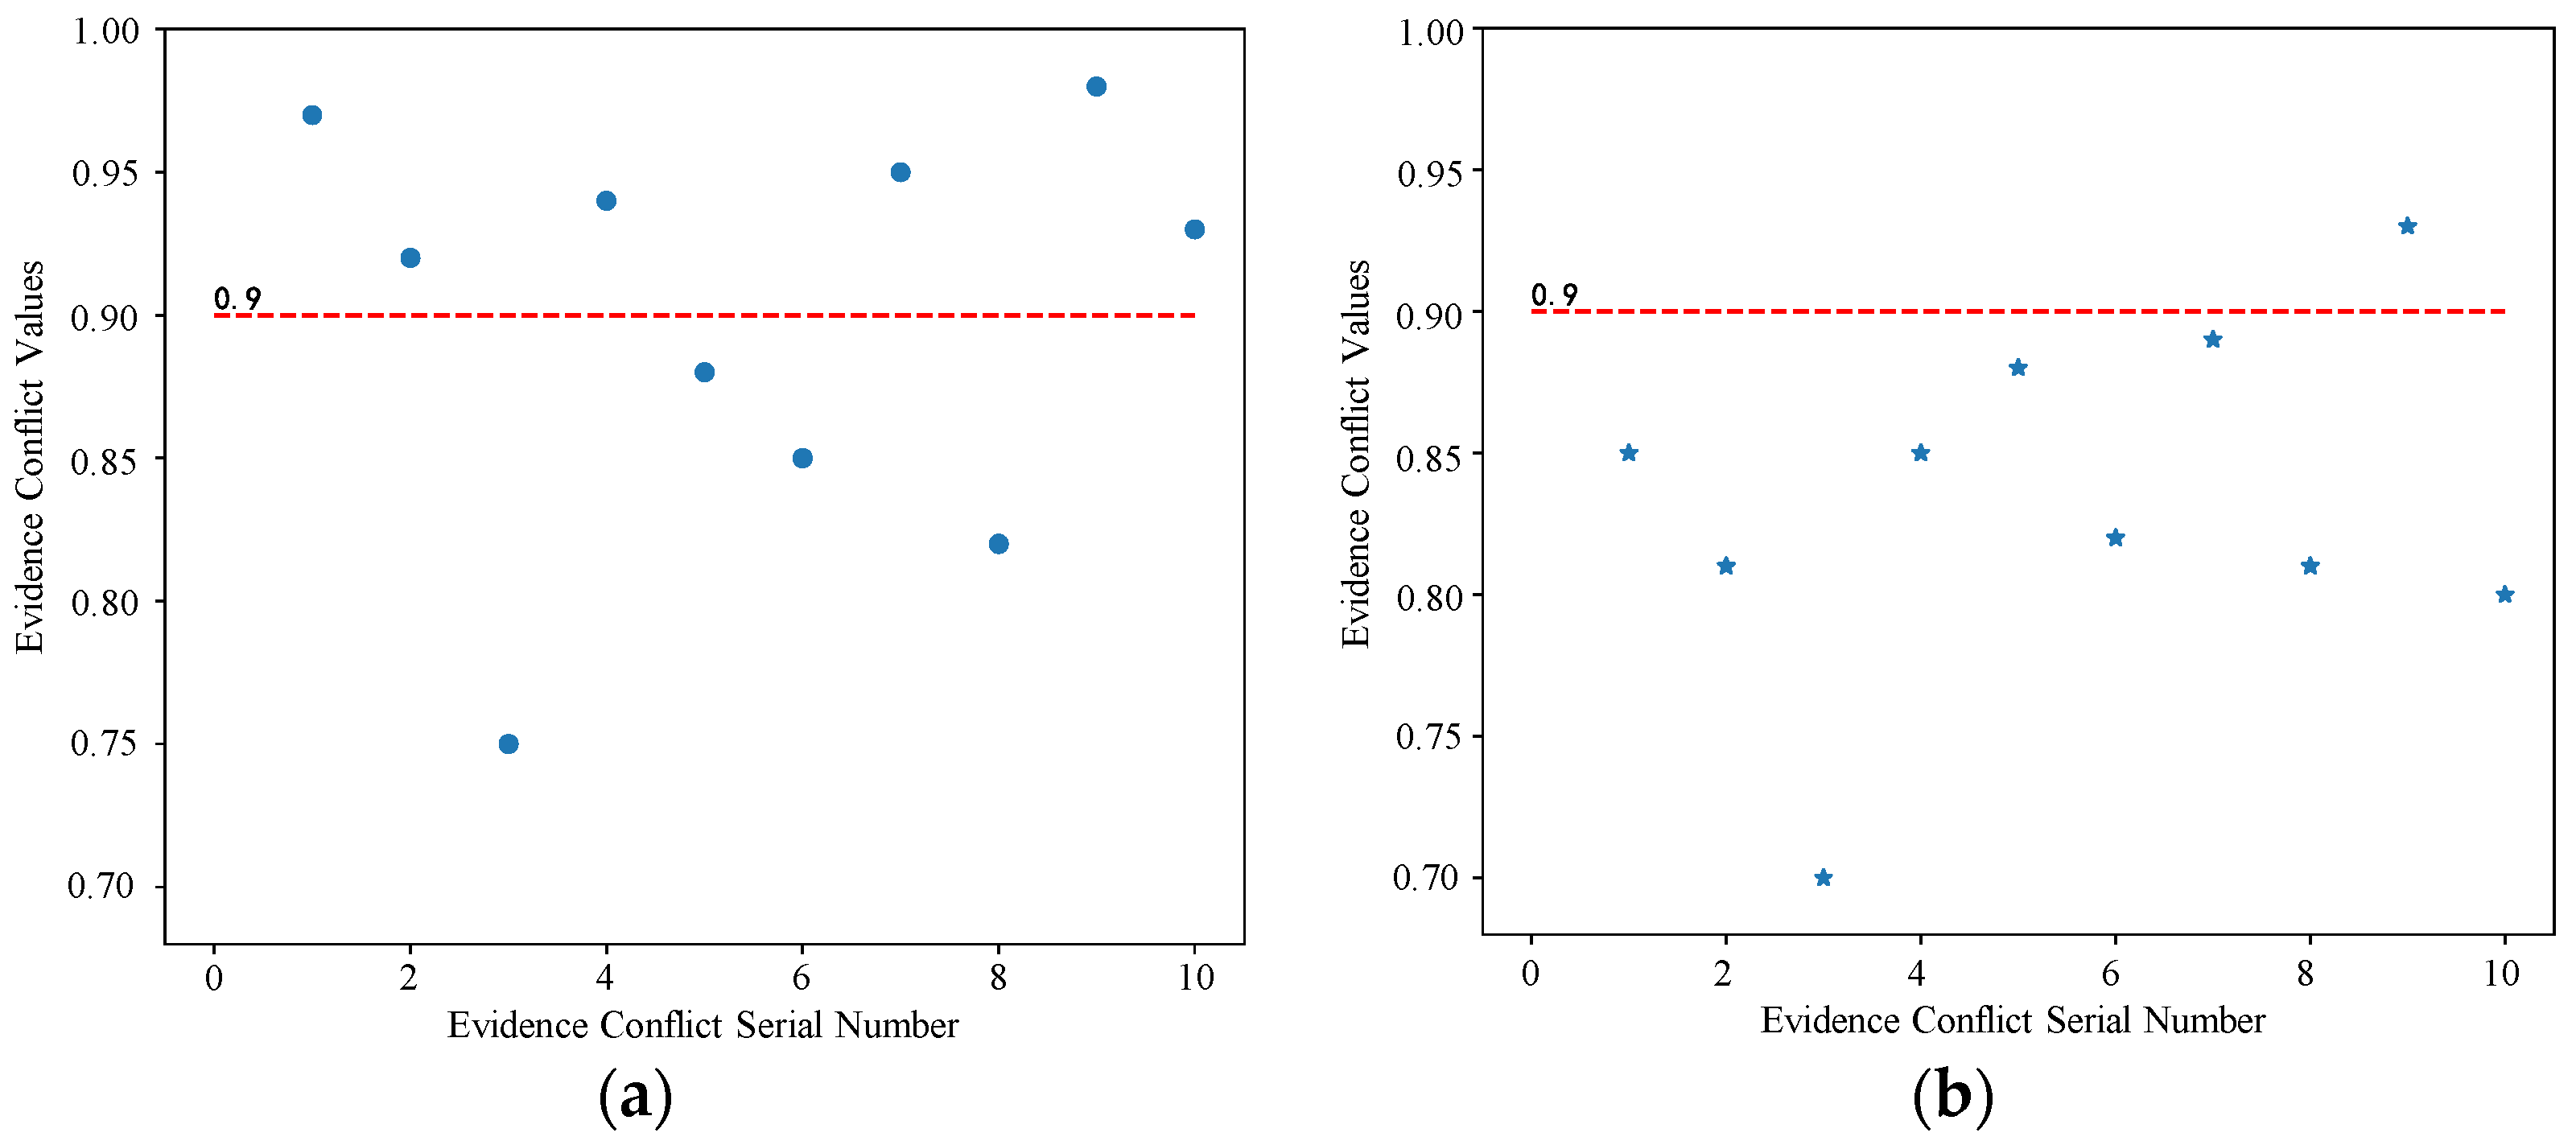
- (3)
- The traditional D-S method and the proposed method are used to evaluate the risk of section YK223 + 473 respectively. Taking the conflict threshold as the reference value, the traditional D-S method (Figure 7a) has some evidence conflict values higher than the threshold and are more discrete. After the proposed method (Figure 7b) is identified and adjusted, the excess evidence conflict has been greatly improved, which is basically below the threshold. In addition, the adjusted evidence conflict values are relatively concentrated and less discrete. The analysis results further show that the proposed method not only has higher recognition accuracy, but also can effectively improve the high evidence conflict.
5. Conclusions and Future Work
- (1)
- It can synthesize multi-source information to obtain a more accurate result for tunneling collapse risk assessment. Due to many influencing factors, the tunneling collapse risk assessment is a multi-attribute decision making problem. Single-source assessment methods have difficulty fully considering all risk factors, resulting in biased prediction results. The performance of the fused model is better than the single information sources model with higher precision.
- (2)
- Compared with the traditional D-S theory, the improved method has more advantages in dealing with high conflict information. When the risk assessment results of three single information sources are inconsistent, the improved fusion model considers the importance rating and credibility of the assessment results, which improves the accuracy of the final assessment results.
Author Contributions
Funding
Institutional Review Board Statement
Informed Consent Statement
Data Availability Statement
Conflicts of Interest
References
- Chen, W.; Zhang, G.-H.; Wang, H.; Chen, L.-B. Risk assessment of mountain tunnel collapse based on rough set and conditional information entropy. Rock Soil Mech. 2019, 40, 3549–3558. [Google Scholar] [CrossRef]
- Zhang, N.; Di, Y.-T.; Li, S.-R. Application of AHP-LEC Method to Risk Assessment of Subway Tunnel Construction. J. Mil. Transp. Univ. 2018, 20, 85–89. [Google Scholar] [CrossRef]
- Zhai, Q.; Gu, W.-H. Risk Assessment of Tunnel Collapse by EW-AHP and Unascertained Measure Theory. Saf. Environ. Eng. 2020, 27, 92–97. [Google Scholar] [CrossRef]
- Saaty, T.-L. Correction to: Some mathematical concepts of the analytic hierarchy process. Behaviormetrika 2021, 48, 193–194. [Google Scholar] [CrossRef]
- Zhang, C.-X.; Wu, S.-C.; Wu, J. Study on risk assessment model of collapse during construction of mountain tunnel and its application. J. Saf. Sci. Technol. 2019, 15, 128–134. [Google Scholar] [CrossRef]
- Xie, Z.-L.; He, X.-B. Analysis of Risks in Long-distance Floating Transportation of Immersed Tunnel Segment in Complex Inland River and Their Countermeasures. Tunn. Constr. 2016, 36, 1095–1100. [Google Scholar] [CrossRef]
- Wu, Z.-H. Study on Identification and Assessment of Safety Risk in Shield Construction of Crossing-River Tunnel. Master’s Thesis, Guangxi University, Guangxi, China, 2019. (In Chinese). [Google Scholar]
- Zhang, G.-H.; Chen, W.; Jiao, Y.-Y.; Hao, W.; Cheng, T.-W. A failure probability evaluation method for collapse of drill-and-blast tunnels based on multistate fuzzy Bayesian network. Eng. Geol. 2020, 276, 105752. [Google Scholar] [CrossRef]
- Mortazavi, A. Bayesian Interactive Search Algorithm: A New Probabilistic Swarm Intelligence Tested on Mathematical and Structural Optimization Problems. Adv. Eng. Softw. 2021, 155, 102994. [Google Scholar] [CrossRef]
- Mortazavi, A. Interactive fuzzy Bayesian search algorithm: A new reinforced swarm intelligence tested on engineering and mathematical optimization problems. Expert Syst. Appl. 2022, 187, 115954. [Google Scholar] [CrossRef]
- Kamal, A.; Mortazavi, A.; Cakici, Z. Optimal Design of RC Bracket and Footing Systems of Precast Industrial Buildings Using Fuzzy Differential Evolution Incorporated Virtual Mutant. Arab. J. Sci. Eng. 2023, 48, 1–17. [Google Scholar] [CrossRef]
- Khakzad, N.; Khan, F.; Amyotte, P. Safety analysis in process facilities: Comparison of fault tree and Bayesian network approaches. Reliab. Eng. Syst. Saf. 2011, 96, 925–932. [Google Scholar] [CrossRef]
- Chen, W.; Wang, W.; Zhang, G.-H.; Wang, C.-T.; Zhong, G.-Q. Evaluation of Tunnel Collapse Susceptibility Based on T-S Fuzzy Fault Tree and Bayesian Network. J. Shang Hai Jiao Tong Univ. 2020, 54, 820–830. [Google Scholar] [CrossRef]
- Guo, D.; Li, J.-H.; Li, X.; Li, Z.-F.; Li, P.-X.; Chen, Z.-Y. Advance prediction of collapse for TBM tunneling using deep learning method. Eng. Geol. 2022, 299, 106556. [Google Scholar] [CrossRef]
- Wei, X.-Y.; Jin, C.-L.; Gong, L.; Zhang, X.; Ma, M.-H. Risk evaluation of railway tunnel water inrush based on PCA-improved RBF neural network model. J. Railw. Sci. Eng. 2021, 18, 794–802. [Google Scholar] [CrossRef]
- Zhang, P.-F.; Li, T.-R.; Wang, G.-Q. Multi-source information fusion based on rough set theory: A review. Inf. Fusion 2021, 68, 85–117. [Google Scholar] [CrossRef]
- Wu, B.; Qiu, W.; Huang, W.; Meng, G.; Nong, Y.; Huang, J. A Multi-Source Information Fusion Evaluation Method for the Tunneling Collapse Disaster Based on the Artificial Intelligence Deformation Prediction. Arab. J. Sci. Eng. 2022, 47, 5053–5071. [Google Scholar] [CrossRef]
- Zuo, Y.L.; Zhu, H.H.; Li, X.J. Estimation of rock mass discontinuity spacing distributions using maximum entropy principle. Chin. J. Rock Mech. Eng. 2017, 36 (Suppl. S1), 3492–3498. [Google Scholar] [CrossRef]
- Pan, Y.; Zhang, L.-M.; Wu, X.-G.; Skibniewski, J.-M. Multi-classifier information fusion in risk analysis. Inf. Fusion 2020, 60, 121–136. [Google Scholar] [CrossRef]
- Zhang, L.-M.; Wu, X.-G.; Zhu, H.-P.; AbouRizk, M.-S. Perceiving safety risk of buildings adjacent to tunneling excavation: An information fusion approach. Autom. Constr. 2016, 73, 88–101. [Google Scholar] [CrossRef]
- Li, S.-C.; Liu, C.; Zhou, Z.-Q.; Li, L.-P.; Shi, S.-S.; Yuan, Y.-C. Multi-sources information fusion analysis of water inrush disaster in tunnels based on improved theory of evidence. Tunn. Undergr. Space Technol. 2021, 113, 103948. [Google Scholar] [CrossRef]
- Wu, B.; Qiu, W.; Huang, W. A multi-source information fusion approach in tunnel collapse risk analysis based on improved Dempster–Shafer evidence theory. Sci. Rep. 2022, 12, 3626. [Google Scholar] [CrossRef] [PubMed]
- Guo, Q.; Wen, W.-L.; Wang, Y.-N.; Qi, L.-G. Basic Probability Assignment Generation Method and Application Based on Cloud Model. J. Electron. Inf. Technol. 2022, 44, 1–8. [Google Scholar] [CrossRef]
- Zhang, L.-M.; Wu, X.-G.; Ding, L.-Y. A novel model for risk assessment of adjacent buildings in tunneling environments. Build. Environ. 2013, 65, 185–194. [Google Scholar] [CrossRef]
- Meng, W.-L. Prediction of Ground Deformation and Assessment of Constructions Risks of Excavation Face during Shield Tunneling in Weathered Stratum. Master’s Thesis, Shanghai Jiao Tong University, Shanghai, China, 2019. (In Chinese). [Google Scholar] [CrossRef]
- Liu, Y.; Lian, J.; Bartolacci, M.-R.; Zeng, Q.-A. Density-Based Penalty Parameter Optimization on C-SVM. Sci. World J. 2014, 2014, 851814. [Google Scholar] [CrossRef]
- Wang, Y.; Zhang, L.-M. Feature-based evidential reasoning for probabilistic risk analysis and prediction. Eng. Appl. Artif. Intell. 2021, 102, 104237. [Google Scholar] [CrossRef]
- Xu, X.-B.; Zheng, J.; Yang, J.-B.; Xu, D.-L.; Chen, Y.-W. Data classification using evidence reasoning rule. Knowl.-Based Syst. 2017, 116, 144–151. [Google Scholar] [CrossRef]
- Yang, Y.; Han, D.-Q. A new distance-based total uncertainty measure in the theory of belief functions. Knowl.-Based Syst. 2016, 94, 114–123. [Google Scholar] [CrossRef]
- Gao, X.-X.; Chen, M.-Y.; Wang, T.-Y. Design and optimization for the separation of a ternary methyl methacrylate-methanol-water mixture to save energy. Energy Sources Part A Recovery Util. Environ. Eff. 2020, 2020, 1–10. [Google Scholar] [CrossRef]


| Evaluation Indicators | Collapse Level | |||
|---|---|---|---|---|
| I | II | III | IV | |
| Uniaxial compressive strength of rock/MPa | 80~120 | 30~80 | 10~30 | 5~10 |
| Surrounding rock integrity factor | 0.75~1 | 0.45~0.75 | 0.2~0.45 | 0~0.2 |
| Angle between the main structural surface and the cave axis/° | 80~90 | 50~80 | 10~50 | 0~10 |
| Discontinuous structural surface state | 0~0.2 | 0.2~0.5 | 0.5~0.8 | 0.8~1 |
| Indicators | I | II | III | IV | ||||||||
|---|---|---|---|---|---|---|---|---|---|---|---|---|
| Ex | En | He | Ex | En | He | Ex | En | He | Ex | En | He | |
| Uniaxial compressive strength of rock/MPa | 80 | 6.67 | 0.004 | 60 | 8.33 | 0.004 | 20 | 3.33 | 0.004 | 7.5 | 0.83 | 0.004 |
| Surrounding rock integrity factor | 0.875 | 0.042 | 0.004 | 0.55 | 0.05 | 0.004 | 0.25 | 0.042 | 0.004 | 0.1 | 0.033 | 0.004 |
| Angle between the main structural surface and the cave axis/° | 85 | 1.67 | 0.004 | 65 | 5 | 0.004 | 30 | 6.67 | 0.004 | 5 | 1.67 | 0.004 |
| Discontinuous structural surface state | 0.1 | 0.033 | 0.004 | 0.25 | 0.05 | 0.004 | 0.6 | 0.05 | 0.004 | 0.9 | 0.033 | 0.004 |
| Index | Probability over Level I | Probability over Level II | Probability over Level III | Probability over Level IV | Predicted Label | True Label | Index | Probability over Level I | Probability over Level II | Probability over Level III | Probability over Level IV | Predicted Label | True Label |
|---|---|---|---|---|---|---|---|---|---|---|---|---|---|
| No. 1 | 0.35 | 0.45 | 0.1 | 0.1 | II | I | No. 31 | 0 | 0.01 | 0.54 | 0.45 | III | IV |
| No. 2 | 0.15 | 0.7 | 0 | 0.15 | II | II | No. 32 | 0.4 | 0.55 | 0 | 0.05 | II | I |
| No. 3 | 0.1 | 0.2 | 0.1 | 0.6 | IV | III | No. 33 | 0.22 | 0.78 | 0 | 0 | II | II |
| No. 4 | 0.06 | 0.6 | 0.2 | 0.14 | II | II | No. 34 | 0.35 | 0.5 | 0.15 | 0 | II | I |
| No. 5 | 0.1 | 0.1 | 0.65 | 0.15 | III | III | No. 35 | 0 | 0.05 | 0.85 | 0.1 | III | III |
| No. 6 | 0 | 0.18 | 0.2 | 0.62 | IV | IV | No. 36 | 0.45 | 0.01 | 0.54 | 0 | III | I |
| No. 7 | 0.55 | 0.15 | 0.2 | 0.1 | I | I | No. 37 | 0.36 | 0.1 | 0.46 | 0.08 | III | I |
| No. 8 | 0.2 | 0 | 0.7 | 0.1 | III | III | No. 38 | 0 | 0.45 | 0.55 | 0 | III | II |
| No. 9 | 0.1 | 0.9 | 0 | 0 | II | II | No. 39 | 0 | 0.94 | 0.06 | 0 | II | II |
| No. 10 | 0 | 0.88 | 0.12 | 0 | II | II | No. 40 | 0 | 1 | 0 | 0 | II | II |
| No. 11 | 0.74 | 0.06 | 0.1 | 0.1 | I | I | No. 41 | 0.1 | 0.9 | 0 | 0 | II | II |
| No. 12 | 0.35 | 0.03 | 0.52 | 0.1 | III | I | No. 42 | 0.86 | 0.04 | 0.1 | 0 | I | I |
| No. 13 | 0.15 | 0 | 0.75 | 0.1 | III | III | No. 43 | 0 | 0 | 0.1 | 0.9 | IV | IV |
| No. 14 | 0 | 0 | 0.95 | 0.05 | III | III | No. 44 | 0 | 0.14 | 0.86 | 0 | III | III |
| No. 15 | 0.4 | 0.48 | 0.1 | 0.02 | II | I | No. 45 | 0.8 | 0.2 | 0 | 0 | I | I |
| No. 16 | 0.85 | 0 | 0.05 | 0.1 | I | I | No. 46 | 0 | 0.6 | 0.4 | 0 | II | III |
| No. 17 | 0.7 | 0 | 0.3 | 0 | I | III | No. 47 | 0 | 0.92 | 0.08 | 0 | II | II |
| No. 18 | 0 | 0.76 | 0.04 | 0.2 | II | II | No. 48 | 0.1 | 0.2 | 0.65 | 0.05 | III | III |
| No. 19 | 0 | 0.4 | 0.6 | 0 | III | II | No. 49 | 0.48 | 0.42 | 0.1 | 0 | I | II |
| No. 20 | 0.1 | 0.1 | 0.72 | 0.08 | III | III | No. 50 | 0.1 | 0.42 | 0 | 0.48 | IV | II |
| No. 21 | 0 | 0.1 | 0.9 | 0 | III | III | No. 51 | 0.6 | 0.1 | 0 | 0.3 | I | I |
| No. 22 | 0.54 | 0.46 | 0 | 0 | I | II | No. 52 | 0 | 0.4 | 0.06 | 0.54 | IV | II |
| No. 23 | 0.58 | 0 | 0.4 | 0.02 | I | III | No. 53 | 0 | 0.95 | 0 | 0.05 | II | II |
| No. 24 | 0.05 | 0.75 | 0 | 0.2 | II | II | No. 54 | 0.05 | 0.42 | 0.48 | 0.05 | III | II |
| No. 25 | 0 | 0.53 | 0.44 | 0.03 | II | III | No. 55 | 0.03 | 0.87 | 0.1 | 0 | II | II |
| No. 26 | 0.7 | 0 | 0.15 | 0.15 | I | I | No. 56 | 0.1 | 0.82 | 0 | 0.08 | II | II |
| No. 27 | 0.75 | 0.1 | 0.15 | 0 | I | I | No. 57 | 0 | 0 | 0.14 | 0.86 | IV | IV |
| No. 28 | 0.12 | 0.88 | 0 | 0 | II | II | No. 58 | 0.42 | 0.02 | 0 | 0.56 | IV | I |
| No. 29 | 0 | 0 | 0.4 | 0.6 | IV | III | No. 59 | 0 | 0.9 | 0.1 | 0 | II | II |
| No. 30 | 0 | 0.85 | 0.15 | 0 | II | II | No. 60 | 0.55 | 0.45 | 0 | 0 | I | II |
| Evaluating Indicator | Factor Level | ||||
|---|---|---|---|---|---|
| I | II | III | IV | ||
| Design factors | Excavation span (m) (x1) | <7 | 7~10 | 10~14 | >14 |
| Depth-to-height ratio (x2) | >20 | 15~20 | 10~15 | <10 | |
| Geological factors | Surrounding rock grade (x3) | 81~100 | 61~81 | 41~60 | <40 |
| Bias (x4) | <10° | 10~25° | 25~40° | >40° | |
| Construction factors | Excavation methods (x5) | CRD | CD | Bench cut method | Full face method |
| Stratum reinforcement measures (x6) | Full section curtain grouting and advance support | Pipe shed support and advance support | Curtain grouting and advance support | Anchor bolts and advance support | |
| Waterproof and drainage measures (x7) | 76~100 | 51~75 | 26~50 | 0~25 | |
| main stiffness of initial support (x8) | >2 | 1~2 | 0.5~1 | <0.5 | |
| Management factors | monitoring and measurement (x9) | >4 times/day | 3 times/day | 2 times/day | 1 times/day |
| Construction quality qualification (x10) | 90~100% | 80~90% | 70~80% | 60~70% | |
| Accuracy of geological survey (x11) | >90% | 75~90% | 60~75% | <60% | |
| Timeliness of main support (x12) | <30 min | 30~60 min | 60~120 min | >120 min | |
| Index | Probability over Level I | Probability over Level II | Probability over Level III | Probability over Level IV | Predicted Label | True Label | Index | Probability over Level I | Probability over Level II | Probability over Level III | Probability over Level IV | Predicted Label | True Label |
|---|---|---|---|---|---|---|---|---|---|---|---|---|---|
| No. 1 | 0.4 | 0.2 | 0.1 | 0.3 | I | I | No. 31 | 0 | 0.15 | 0 | 0.85 | IV | IV |
| No. 2 | 0.25 | 0.55 | 0.1 | 0.1 | II | II | No. 32 | 0 | 0 | 1 | 0 | III | I |
| No. 3 | 0 | 0.2 | 0.8 | 0 | III | III | No. 33 | 0.12 | 0.88 | 0 | 0 | II | II |
| No. 4 | 0.08 | 0.52 | 0.3 | 0.1 | II | II | No. 34 | 0.05 | 0.95 | 0 | 0 | II | I |
| No. 5 | 0.3 | 0.4 | 0 | 0.3 | II | III | No.35 | 0 | 0.1 | 0.8 | 0.1 | III | III |
| No. 6 | 0.1 | 0.3 | 0.5 | 0.1 | III | IV | No. 36 | 0.44 | 0.56 | 0 | 0 | II | I |
| No. 7 | 0.9 | 0.1 | 0 | 0 | I | I | No. 37 | 0.45 | 0 | 0.55 | 0 | III | I |
| No. 8 | 0.1 | 0.1 | 0.6 | 0.2 | III | III | No. 38 | 0 | 0 | 0.85 | 0.15 | III | II |
| No. 9 | 0 | 0 | 0.96 | 0.04 | III | II | No. 39 | 0 | 0.84 | 0.16 | 0 | II | II |
| No. 10 | 0.18 | 0.82 | 0 | 0 | II | II | No. 40 | 0.12 | 0.78 | 0.1 | 0 | II | II |
| No. 11 | 0.82 | 0 | 0.03 | 0.15 | I | I | No. 41 | 0 | 0.74 | 0.16 | 0.1 | II | II |
| No. 12 | 0.4 | 0.6 | 0 | 0 | II | I | No. 42 | 0.84 | 0.14 | 0.02 | 0 | I | I |
| No. 13 | 0 | 0.1 | 0.9 | 0 | III | III | No. 43 | 0.1 | 0.8 | 0.1 | 0 | II | IV |
| No. 14 | 0 | 0 | 1 | 0 | III | III | No. 44 | 0.15 | 0 | 0.85 | 0 | III | III |
| No. 15 | 0.05 | 0.2 | 0.1 | 0.65 | IV | I | No. 45 | 0.86 | 0 | 0.04 | 0.1 | I | I |
| No. 16 | 0.7 | 0.3 | 0 | 0 | I | I | No. 46 | 0 | 0 | 0.35 | 0.65 | IV | III |
| No. 17 | 0 | 0.55 | 0.45 | 0 | II | III | No. 47 | 0.92 | 0 | 0.08 | 0 | I | II |
| No. 18 | 0 | 0.85 | 0.15 | 0 | II | II | No. 48 | 0 | 0 | 0.85 | 0.15 | III | III |
| No. 19 | 0.2 | 0 | 0 | 0.8 | IV | II | No. 49 | 0.58 | 0 | 0.42 | 0 | I | II |
| No. 20 | 0.7 | 0.1 | 0.1 | 0.1 | I | III | No. 50 | 0 | 0.4 | 0.6 | 0 | III | II |
| No. 21 | 0.1 | 0 | 0.9 | 0 | III | III | No. 51 | 0.8 | 0 | 0.2 | 0 | I | I |
| No. 22 | 0.56 | 0.44 | 0 | 0 | I | II | No. 52 | 0 | 0.48 | 0.52 | 0 | III | II |
| No. 23 | 0 | 0.6 | 0.4 | 0 | II | III | No. 53 | 0 | 0.9 | 0.1 | 0 | II | II |
| No. 24 | 0 | 0.86 | 0 | 0.14 | II | II | No. 54 | 0 | 0 | 0.25 | 0.75 | IV | II |
| No. 25 | 0 | 0.08 | 0.4 | 0.52 | IV | III | No. 55 | 0.1 | 0.8 | 0 | 0.1 | II | II |
| No. 26 | 0.85 | 0.05 | 0 | 0.1 | I | I | No. 56 | 0 | 1 | 0 | 0 | II | II |
| No. 27 | 0.75 | 0.15 | 0.1 | 0 | I | I | No. 57 | 0 | 0 | 0.25 | 0.75 | IV | IV |
| No. 28 | 0 | 0.75 | 0 | 0.25 | II | II | No. 58 | 0.45 | 0.01 | 0 | 0.54 | IV | I |
| No. 29 | 0.75 | 0.1 | 0.15 | 0 | I | III | No. 59 | 0.2 | 0.7 | 0.1 | 0 | II | II |
| No. 30 | 0.05 | 0.95 | 0 | 0 | II | II | No. 60 | 0.6 | 0.4 | 0 | 0 | I | II |
| Tunnel Collapse Level | Daily Deformation (mm/d) | Cumulative Deformation (mm) |
|---|---|---|
| I (Safe) | 0 ≤ x < 2 | 0 ≤ y < 50 |
| II (Deformation is formed) | 2 ≤ x < 5 | 50 ≤ y < 100 |
| III (Small-scale collapse) | 5 ≤ x < 10 | 100 ≤ y < 200 |
| IV (Large-scale collapse) | 10 ≤ x < 20 | 200 ≤ y < 300 |
| Distance from Monitoring Point to Palm Face (D) | 1B | 2B | 3B | 4~6B |
|---|---|---|---|---|
| 0.5 | 0.75 | 0.85 | 1 |
| Index | Probability over Level I | Probability over Level II | Probability over Level III | Probability over Level IV | Predicted Label | True Label | Index | Probability over Level I | Probability over Level II | Probability over Level III | Probability over Level IV | Predicted Label | True Label |
|---|---|---|---|---|---|---|---|---|---|---|---|---|---|
| No. 1 | 0.5 | 0.3 | 0 | 0.2 | I | I | No. 31 | 0 | 0 | 0 | 1 | IV | IV |
| No. 2 | 0 | 0.3 | 0.6 | 0.1 | III | II | No. 32 | 0.35 | 0.65 | 0 | 0 | II | I |
| No. 3 | 0.2 | 0.6 | 0.1 | 0.1 | II | III | No. 33 | 0 | 0.75 | 0.25 | 0 | II | II |
| No. 4 | 0.04 | 0.1 | 0.5 | 0.36 | III | II | No. 34 | 0.4 | 0.55 | 0 | 0.05 | II | I |
| No. 5 | 0 | 0.1 | 0.4 | 0.5 | IV | III | No. 35 | 0 | 0 | 0.9 | 0.1 | III | III |
| No. 6 | 0.02 | 0.1 | 0.28 | 0.6 | IV | IV | No. 36 | 0.44 | 0 | 0.56 | 0 | III | I |
| No. 7 | 0.7 | 0.2 | 0.1 | 0 | I | I | No. 37 | 0.46 | 0 | 0.04 | 0.5 | IV | I |
| No. 8 | 0 | 0 | 0.86 | 0.14 | III | III | No. 38 | 0 | 1 | 0 | 0 | II | II |
| No. 9 | 0.1 | 0.9 | 0 | 0 | II | II | No. 39 | 0.25 | 0.58 | 0.17 | 0 | II | II |
| No. 10 | 0 | 0.86 | 0.14 | 0 | II | II | No. 40 | 0 | 0.78 | 0 | 0.22 | II | II |
| No. 11 | 1 | 0 | 0 | 0 | I | I | No. 41 | 0.05 | 0.95 | 0 | 0 | II | II |
| No. 12 | 0.4 | 0 | 0.6 | 0 | III | I | No. 42 | 0.4 | 0.6 | 0 | 0 | II | I |
| No. 13 | 0 | 0.32 | 0.68 | 0 | III | III | No. 43 | 0 | 0 | 0.2 | 0.8 | IV | IV |
| No. 14 | 0.1 | 0.1 | 0.7 | 0.1 | III | III | No. 44 | 0 | 0.2 | 0.6 | 0.2 | III | III |
| No. 15 | 0.4 | 0.06 | 0.54 | 0 | III | I | No. 45 | 0.9 | 0.1 | 0 | 0 | I | I |
| No. 16 | 0.65 | 0.05 | 0.2 | 0.1 | I | I | No. 46 | 0 | 0.6 | 0.4 | 0 | II | III |
| No. 17 | 0 | 0.1 | 0.9 | 0 | III | III | No. 47 | 0 | 0.85 | 0 | 0.15 | II | II |
| No. 18 | 0.2 | 0.75 | 0.05 | 0 | II | II | No. 48 | 0 | 0.25 | 0.75 | 0 | III | III |
| No. 19 | 0 | 1 | 0 | 0 | II | II | No. 49 | 0.55 | 0.45 | 0 | 0 | I | II |
| No. 20 | 0 | 0 | 0.95 | 0.05 | III | III | No. 50 | 0 | 0.4 | 0 | 0.6 | IV | II |
| No. 21 | 0 | 0.2 | 0.8 | 0 | III | III | No. 51 | 0.75 | 0.1 | 0.1 | 0.05 | I | I |
| No. 22 | 0.6 | 0.35 | 0 | 0.05 | I | II | No. 52 | 0.56 | 0.44 | 0 | 0 | I | II |
| No. 23 | 0 | 0 | 1 | 0 | III | III | No. 53 | 0.2 | 0.7 | 0 | 0.1 | II | II |
| No. 24 | 0 | 0.68 | 0 | 0.32 | II | II | No. 54 | 0 | 0.85 | 0.15 | 0 | II | II |
| No. 25 | 0 | 0.58 | 0.42 | 0 | II | III | No. 55 | 0 | 0.9 | 0.1 | 0 | II | II |
| No. 26 | 0.8 | 0 | 0 | 0.2 | I | I | No. 56 | 0.1 | 0.6 | 0.1 | 0.2 | II | II |
| No. 27 | 0.6 | 0.3 | 0.1 | 0 | I | I | No. 57 | 0 | 0 | 0.3 | 0.7 | IV | IV |
| No. 28 | 0 | 0.85 | 0.1 | 0.05 | II | II | No. 58 | 0.42 | 0.1 | 0 | 0.48 | IV | I |
| No. 29 | 0 | 0 | 1 | 0 | III | III | No. 59 | 0.1 | 0.8 | 0.1 | 0 | II | II |
| No. 30 | 0.05 | 0.65 | 0 | 0.3 | II | II | No. 60 | 0.7 | 0.25 | 0.05 | 0 | I | II |
| Evidence | Level | Precision | Recall | Specificity | F1-Score | Support |
|---|---|---|---|---|---|---|
| E1 | I | 0.62 | 0.5 | 0.89 | 0.55 | 16 |
| II | 0.74 | 0.68 | 0.83 | 0.71 | 25 | |
| III | 0.56 | 0.6 | 0.84 | 0.58 | 15 | |
| IV | 0.38 | 0.75 | 0.91 | 0.5 | 4 | |
| E2 | I | 0.6 | 0.56 | 0.86 | 0.58 | 16 |
| II | 0.68 | 0.6 | 0.8 | 0.64 | 25 | |
| III | 0.53 | 0.54 | 0.84 | 0.53 | 15 | |
| IV | 0.25 | 0.5 | 0.89 | 0.33 | 4 | |
| E3 | I | 0.67 | 0.5 | 0.91 | 0.57 | 16 |
| II | 0.75 | 0.72 | 0.83 | 0.73 | 25 | |
| III | 0.69 | 0.73 | 0.89 | 0.71 | 15 | |
| IV | 0.5 | 1 | 0.93 | 0.67 | 4 |
| Sample Index | Classifier Outputs | Probability over Level I | Probability over Level II | Probability over Level III | Probability over Level IV | Predicted Label | True Label | Description |
|---|---|---|---|---|---|---|---|---|
| No. 1 | E1 | 0.35 | 0.45 | 0.1 | 0.1 | II | I | |
| E2 | 0.4 | 0.2 | 0.1 | 0.3 | I | I | ||
| E3 | 0.5 | 0.3 | 0 | 0.2 | I | I | ||
| K = 0.897, t = [0.5, 0.33, 0.6], r = [0.790, 0.707, 0.671] | ||||||||
| D-S | 0.68 | 0.26 | 0 | 0.06 | I | I | ||
| Improved D-S | 0.5 | 0.3 | 0 | 0.2 | I | I | ||
| No. 2 | E1 | 0.15 | 0.7 | 0 | 0.15 | II | II | |
| E2 | 0.25 | 0.55 | 0.1 | 0.1 | II | II | ||
| E3 | 0 | 0.3 | 0.6 | 0.1 | III | II | ||
| K = 0.883, t = [0.5, 0.33, 0.6], r = [0.741, 0.790, 0.791] | ||||||||
| D-S | 0 | 0.9 | 0 | 0.1 | II | II | ||
| Improved D-S | 0 | 0.8 | 0.2 | 0 | II | II | ||
| No. 3 | E1 | 0.1 | 0.2 | 0.1 | 0.6 | IV | III | K = 0.968 > 0.95. Only the result of Improved D-S is correct. |
| E2 | 0 | 0.2 | 0.8 | 0 | III | III | ||
| E3 | 0.2 | 0.6 | 0.1 | 0.1 | II | III | ||
| K = 0.968, t = [0.5, 0.33, 0.6], r = [0.763, 0.834, 0.892] | ||||||||
| D-S | 0 | 0.75 | 0.25 | 0 | II | III | ||
| Improved D-S | 0 | 0.33 | 0.67 | 0 | III | III | ||
| No. 4 | E1 | 0.06 | 0.6 | 0.2 | 0.14 | II | II | |
| E2 | 0.08 | 0.52 | 0.3 | 0.1 | II | II | ||
| E3 | 0.04 | 0.1 | 0.5 | 0.36 | III | II | ||
| K = 0.862, t = [0.5, 0.33, 0.6], r = [0.801, 0.735, 0.834] | ||||||||
| D-S | 0 | 0.9 | 0.1 | 0 | II | II | ||
| Improved D-S | 0 | 0.8 | 0.2 | 0 | II | II | ||
| No. 5 | E1 | 0.1 | 0.1 | 0.65 | 0.15 | III | III | K = 0.9735 > 0.95. Only the result of Improved D-S is correct. |
| E2 | 0.3 | 0.4 | 0 | 0.3 | II | III | ||
| E3 | 0 | 0.1 | 0.4 | 0.5 | IV | III | ||
| K = 0.9735, t = [0.5, 0.33, 0.6], r = [0.733, 0.685, 0.707] | ||||||||
| D-S | 0 | 0.15 | 0 | 0.85 | IV | III | ||
| Improved D-S | 0.1 | 0.2 | 0.4 | 0.3 | III | III | ||
| No. 6 | E1 | 0 | 0.18 | 0.2 | 0.62 | IV | IV | |
| E2 | 0.1 | 0.3 | 0.5 | 0.1 | III | IV | ||
| E3 | 0.02 | 0.1 | 0.28 | 0.6 | IV | IV | ||
| K = 0.874, t = [0.5, 0.33, 0.6], r = [0.786, 0.779, 0.834] | ||||||||
| D-S | 0 | 0 | 0.2 | 0.8 | IV | IV | ||
| Improved D-S | 0 | 0.05 | 0.15 | 0.8 | IV | IV | ||
Disclaimer/Publisher’s Note: The statements, opinions and data contained in all publications are solely those of the individual author(s) and contributor(s) and not of MDPI and/or the editor(s). MDPI and/or the editor(s) disclaim responsibility for any injury to people or property resulting from any ideas, methods, instructions or products referred to in the content. |
© 2023 by the authors. Licensee MDPI, Basel, Switzerland. This article is an open access article distributed under the terms and conditions of the Creative Commons Attribution (CC BY) license (https://creativecommons.org/licenses/by/4.0/).
Share and Cite
Wu, B.; Zeng, J.; Zhu, R.; Zheng, W.; Liu, C. A Multi-Source Data Fusion Method for Assessing the Tunnel Collapse Risk Based on the Improved Dempster–Shafer Theory. Appl. Sci. 2023, 13, 5606. https://doi.org/10.3390/app13095606
Wu B, Zeng J, Zhu R, Zheng W, Liu C. A Multi-Source Data Fusion Method for Assessing the Tunnel Collapse Risk Based on the Improved Dempster–Shafer Theory. Applied Sciences. 2023; 13(9):5606. https://doi.org/10.3390/app13095606
Chicago/Turabian StyleWu, Bo, Jiajia Zeng, Ruonan Zhu, Weiqiang Zheng, and Cong Liu. 2023. "A Multi-Source Data Fusion Method for Assessing the Tunnel Collapse Risk Based on the Improved Dempster–Shafer Theory" Applied Sciences 13, no. 9: 5606. https://doi.org/10.3390/app13095606