1. Introduction
In recent years, a large number of marine engineering projects have been constructed in China, such as transmission line towers, drilling platforms, cross-sea bridges, port terminals, wind turbines, etc., among which the development of offshore wind power projects is particularly rapid [
1,
2,
3,
4,
5]. To tackle the challenges posed by the intricate offshore environment, these structures often rely on the pile group, as the preferred choice for foundation design [
6,
7]. The oceanic environment necessitates that the pile foundations for offshore structures be engineered to endure not only the gravitational forces of the superstructure, but also the onslaught of horizontal cyclic loads, including wind, waves, and currents. These cyclical loads often vary in direction and magnitude throughout the lifespan of the project, posing a significant challenge to the safe operation of the structure [
8]. The complex loads acting on the offshore wind turbine foundation can cause permanent lateral deformation of the structure [
9]. According to the opinions of some scholars, the marine clay layer is prone to long-term cyclic loads, which triggers a constant remodeling of the soil around the pile foundation. This, in turn, leads to a gradual decline in the stiffness and shear strength of the soil, ultimately causing cumulative deformation of the pile foundation [
10]. Moreover, the creation and release of surplus pore water pressure at the periphery of offshore pile groups during the application of cyclic horizontal loads could potentially impact the operational functionality of the foundation [
11,
12]. Therefore, examining the long-term response of the pile group to cyclic horizontal loading is critical in developing effective design approaches for offshore wind turbine foundations.
While there have been numerous numerical simulations conducted to investigate the dynamic response of offshore structures [
13,
14,
15,
16], inaccurate parameter selection during such simulations might result in predictive errors. Therefore, in order to thoroughly examine the long-term loading characteristics of pile group foundations in saturated clay soil under horizontal cyclic loading, the most effective approach is the implementation of long-term loading tests. These tests are comprised of both field and model experiments. Notably, Feagin et al. [
17] and Rollins et al. [
18] have successfully carried out such tests, proposing the force characteristics of the pile group foundation under horizontal cyclic loads, as well as the correlation between the pile group effect and the spacing of piles. The field tests can truly reflect the cyclic loading characteristics of pile foundations in the actual working conditions and verify the feasibility of numerical analysis. However, this kind of method usually takes a long time and has high costs. Therefore, in attempts to explore the behavior of the pile group foundation under long-term loading, indoor model tests have become a routine method. These tests typically comprise centrifugal tests and 1 g model tests.
Numerous scholars have undertaken centrifugal tests on the pile group foundation as a means to rectify the issue of stress–strain state inconsistency between prototypes and models [
19,
20,
21,
22,
23]. Although these tests are able to effectively replicate the working conditions of the prototypes, they are accompanied by notable constraints stemming from the limitations in the construction scale of core equipment, such as centrifuges and vibration tables. Consequently, the execution of these model tests has been more challenging. In contrast to field tests and centrifugal model tests, the 1 g model tests have the characteristics of high controllability, good repeatability, and high-test efficiency. Significant findings have been achieved through 1 g model tests since the 1970s. Singh et al. [
24] carried out an experimental model of the horizontal cyclic load on the pile group in sandy soils, investigating the effects on the pile body’s horizontal displacement, bearing angle, and bending moment. Moss et al. [
25] proposed a pile group design method considering the cyclic effects based on the model experiment of the 1 × 5 pile group model under the action of a bidirectional cyclic load. Subsequently, Mastorakis et al. [
26] conducted a series of model experiments to study the horizontal cyclic characteristics of the pile group in soft soil foundations. In recent years, Niemann et al. [
27] further demonstrated that the pile group effect exacerbates the cyclic effects on piles under horizontal cyclic loads based on pile group model tests in clay soils. Moreover, Karkush et al. [
28] conducted unidirectional cyclic loading tests on the pile group in soils with varying impurities, revealing the nonlinear effect of impurities on the loading–displacement relationship of pile groups. Raongjant et al. [
29] studied different types of clays and analyzed the load deflection and bending moment curves of the pile group. Abbas et al. [
30] analyzed the effects of axial load and pile shape on the performance of the pile group under cyclic loading. Overall, the 1 g model test is widely used to investigate the load-bearing deformation characteristics and evolution law of pile groups under horizontal cyclic loads.
At present, considerable efforts have been dedicated to investigating the bearing characteristics of pile group foundations under horizontal cyclic loading. In addition, some scholars have delved into the correlation between the cumulative deformation of the pile group foundation and the weakening of soil circulation around the pile, as well as the dynamic response of pore water pressure evolution and soil pressure variation near the pile under horizontal cyclic loading [
31,
32]. Nevertheless, existing studies predominantly rely on numerical models, while experimental studies have primarily been limited to a few hundred repetitions, failing to truly capture the long-term behavior of pile group foundations under sustained loading.
In this paper, the small-scale model test of the pile group foundation using the self-designed indoor model test cyclic loading system under horizontal cyclic loading was carried out, and the number of cycles was over when studying the force deformation characteristics of the pile group foundation and the dynamic response of the soil around the pile in saturated clay under horizontal cyclic loading. The self-designed indoor cyclic loading system and the corresponding testing procedure are introduced first. Subsequently, the accumulative deformation of the bearing platform, the horizontal cyclic stiffness, and the bending moment of the pile shaft, as well as the dynamic response of saturated clay under horizontal cyclic loading on the cumulative deformation of the pile group, are fully examined. Finally, the application fields of the research results are pointed out.
2. Model Test
In this section, a sketch of the high pile cap model is displayed first, then the soil properties are illustrated, and finally, the test program is introduced.
2.1. High-Rise Pile Cap Model
This model experiment takes a coastal offshore wind power project in China as the research background. The prototype pile has a diameter of 1.25 m, a length of 43.75 m, and a burial depth of 35 m. It is obvious that performing prototype tests is not a feasible option. Consequently, the authors intend to conduct an experimental model study and extrapolate prototype experimental outcomes based on the model experimental outcomes. The initial phase of model experimentation necessitates determining the similarity ratio of the experiment. Nonetheless, because of the interdependent effects of intricate factors such as fluid dynamics and pile–soil systems on offshore engineering, employing a unified similarity principle for the comprehensive design of dynamic responses at diverse locations is challenging. Hence, this article solely focuses on similarity design concerning the primary influencing factors of the experiment. The similarity criteria in the equation are called
, which involves a set of physical parameters including stress (
), strain (
), elastic modulus (
), Poisson’s ratio (
), friction angle (
), cohesion (
), load (
), length (
), and displacement (
). Among these, length and bulk density are regarded as the fundamental quantity group, with their respective units denoted by
and
, and the relationship between the remaining physical quantity, length, and bulk density is in a dimensionless form. The similarity criteria and similarities used in this article are shown in
Table 1.
During the model tests, hollow aluminum alloy was employed as the material for fabricating the model piles. In accordance with Buckingham’s II similarity theorem and taking into consideration the constraints of the loading equipment and the model slot used in the tests, the geometric similarity ratio of the model pile was set at 1:50.
Figure 1 depicts the specifications of the model pile, including a pipe diameter of 25 mm, a thickness of 2 mm, and a length of 875 mm. The elastic modulus of the model pile was measured at 71 GPa. In order to replicate real-world conditions, the model pile was inserted into the soil to a depth of 700 mm, with a suspended section extending 175 mm above the muddy surface. In addition, because of the hollow structure inside the model pile, the bottom of the model pile used in this test was sealed with rubber in order to avoid the formation of a soil plug effect at the end of the pile, so as to meet the stiffness requirement of the model pile.
In order to avoid boundary effects, the distance from the side pile to the edge of the bearing platform was taken as 37.5 mm. The height of the pile embedded in the bearing platform was determined as 50 mm [
33]. Rollins et al. [
18] discovered that the group pile effect became gradually less pronounced as the distance between piles increased, and it was negligible when the spacing exceeded six times the diameter of the piles. Therefore, to delve deeper into the interrelation between pile spacing and the pile group effect, as well as to minimize limitations imposed by testing sites, the pile spacings were set to three, four, and five times the diameter of the piles. Consequently, three sets of bearing platforms in different sizes were designed, and the sketches of the high-rise pile cap models are shown in
Figure 2.
2.2. Soil Properties
In this study, the foundation soil consisted of two layers, the upper layer was a 70 cm-thick saturated clay layer, and the lower layer was a 10 cm-thick sandy soil layer. The bottom layer was filled with sandy soil, mainly to provide drainage channels to accelerate soil consolidation and drainage, and the sandy soil was selected from Yangtze River. The clay layer was selected from 80% white kaolin raw mineral powder, which is off-white. The parameters of the soil properties are shown in
Table 2, and
Figure 3 shows the grain grading curve of the clay sample. The saturated clay of the test was off-white, fluid–plastic, had high compressibility, and its moisture content was 45–55%, in this study.
Preparation and filling of the foundation soil is a key point of the pile foundation model test. In this test, before filling the model soil, kaolin soil was layered in the pool at a height of 10 cm to minimize disturbance, and then water was sprinkled evenly on each layer to allow free infiltration of water and left for one month to make it completely saturated before filling. In addition, in order to ensure the uniformity of the soil layer, the model soil was filled by means of layered pre-pressure, in combination with the experience of previous tests [
34]. Before the process of filling the soil layer, the pile group model was fixed in a position perpendicular to the angle steel, which ensured that the position of the model pile remained unaffected during the filling process. The filling process entailed the following steps: (1) Affixing a scale onto the tempered glass on both sides of the model box to ensure the thickness of each layer during the filling process. Simultaneously, the inner wall of the model box is lined with non-woven geotextile to create drainage channels that expedite drainage consolidation. (2) Utilizing the steel angle on the bearing platform to center and fix the pile group model in the middle of the model box, guaranteeing that the entire model is perfectly perpendicular to the loading direction. (3) Filling the bottom of the model box with 10 cm of river sand and thoroughly compacting it with prefabricated compaction equipment. (4) Pouring the previously prepared saturated clay into the model box in 10 cm layers and roughening the layers, then executing 12 h of pre-compression. (5) After completing the filling process, the model soil was left to stand for 24 h, with a constant water depth of 1 cm maintained on the soil surface, before proceeding with the loading test.
2.3. Sketch of the Test Program
The pile foundation is mainly subjected to horizontal cyclic loads such as winds and waves in the marine environment. Therefore, the amplitude, frequency, and duration of the above cyclic loads were mainly simulated by the simplified sinusoidal-type load in the indoor test.
Figure 4 depicts a custom-designed horizontal cyclic loading system in this paper, comprising of a power module, sliding module, and counterforce module. The system includes a reaction steel frame, a small motor, a frequency regulator, an eccentric wheel, a connecting rod, a coupling, and other essential components. The power module consists of a motor, an eccentric wheel, and a frequency regulator, which are responsible for providing varying amplitudes and frequencies for cyclic loading in this model test. In addition, the sliding module is primarily composed of a connecting rod and a linear slide bearing, which ensures the directionality of the loading in this model test. The counterforce module mainly adopts the counterforce steel frame to support the horizontal cyclic loading device to reduce the mechanical vibration during loading and prevent the loading device from tipping over. It is worth mentioning that with reference to the experimental equipment designed by Wang et al. [
35], the horizontal cyclic loading system of this study used the principle of a motor-driven eccentric wheel, driving the spring motion to realize the cyclic loading onto the pile foundation. The test loading system is capable of performing horizontal cyclic loading with varying amplitudes, frequencies, cycles, and loading paths, according to the requirements of model experiments. In
Figure 5, the loading curves obtained from the tensile and compressive sensors during the test are presented.
The overall dimensions of the model box were 1.35 m × 1.2 m × 0.9 m. The side wall of the model box is tempered glass, and the overall frame is connected by steel plates. The sensor layout for this test is shown in
Figure 6.
In this test, data were collected using a Dong Hua DH-5922 dynamic signal acquisition system with 16 channels. This is an advanced computer-based system for intelligent dynamic signal analysis and testing, designed to provide comprehensive signal processing capabilities for a range of on-site applications. It features a complete set of hardware components required for dynamic signal testing, including signal conditioners (such as strain, vibration, etc.), DC voltage amplifiers, anti-aliasing filters, A/D converters, sampling control, and computer communication. At the same time, it also provides user-friendly control and analysis software.
The data acquisition frequency was 10 Hz in this test, and the test was terminated when the following phenomena occurred: (1) the cyclic time reached 5000 times, and (2) the lateral displacement on the mud surface exceeded 10 mm.
The horizontal static loading test of the pile foundation is a reliable method to test the horizontal bearing capacity of the pile foundation. In this study, the slow maintenance loading method was used to apply a horizontal static force to the pile group foundation in the model test. The slow maintenance loading method is a graded loading method, which takes 1/10 of the maximum bearing capacity of the pile foundation as the loading amount of each load level. After each level of loading, the horizontal displacement of the pile foundation was observed at the time nodes of 5 min, 10 min, 15 min, 30 min, 45 min, and 60 min, and then every 30 min, and the next level of loading was applied after the horizontal displacement of pile foundation was maintained in balance. According to the trial calculation before the test, the load for each stage in this paper was 50 N. In this paper, when the horizontal load displacement at the mud surface of the pile group increases to 10 mm, 75% of the corresponding horizontal load value is taken as the horizontal bearing capacity of the pile group [
36]. As depicted in
Figure 7, the load–displacement curves for varying pile spacings demonstrated that the horizontal bearing capacity of the pile group was 320 N for pile spacing set at 3 times the pile diameter, 340 N for pile spacing set at 4 times the pile diameter, and 380 N for pile spacing set at 5 times the pile diameter.
Poulos et al. [
37] defined the horizontal loading ratio (CLR) as the ratio of the horizontal cyclic loading amplitude (
) to the horizontal bearing capacity (
). By adjusting the CLR, the horizontal cyclic load with different amplitudes was applied to the pile group model, in turn, and the test conditions were finally determined, as shown in
Table 3. Based on the findings from previous research, it has been observed that the frequency of wind and wave loads is relatively low, predominantly concentrated within the frequency range of 0 to 1 Hz. Boominathan et al. [
38] found that the lateral dynamic response of the pile–soil system in the clay foundation is influenced by the model box boundary effect when the loading frequency exceeds 2 Hz. Therefore, a loading frequency of 1 Hz was chosen for this model experiment. In addition, the previous studies showed that the cumulative displacement development of pile foundations is mainly concentrated in the early stage of loading, and after the number of cycles exceeds 1000 times, the cumulative displacement of pile foundations gradually tends to be stable, so the number of cycles was taken as 5000 for this test.
3. Results and Discussion
3.1. The Accumulated Deformation of the Pile Group Subjected to Horizontal Cyclic Loading
It is well-known that the pile group will generate a round-trip overturning motion with the change of the load direction under horizontal cyclic loading, and the mono-piles will rotate around the connection point between the top of the pile and the bearing platform. In addition, the center of the pile group foundation will also experience horizontal displacement.
In this section, an investigation will be conducted on the cumulative deformation of a pile group in saturated clay soil under varying amplitudes and periods.
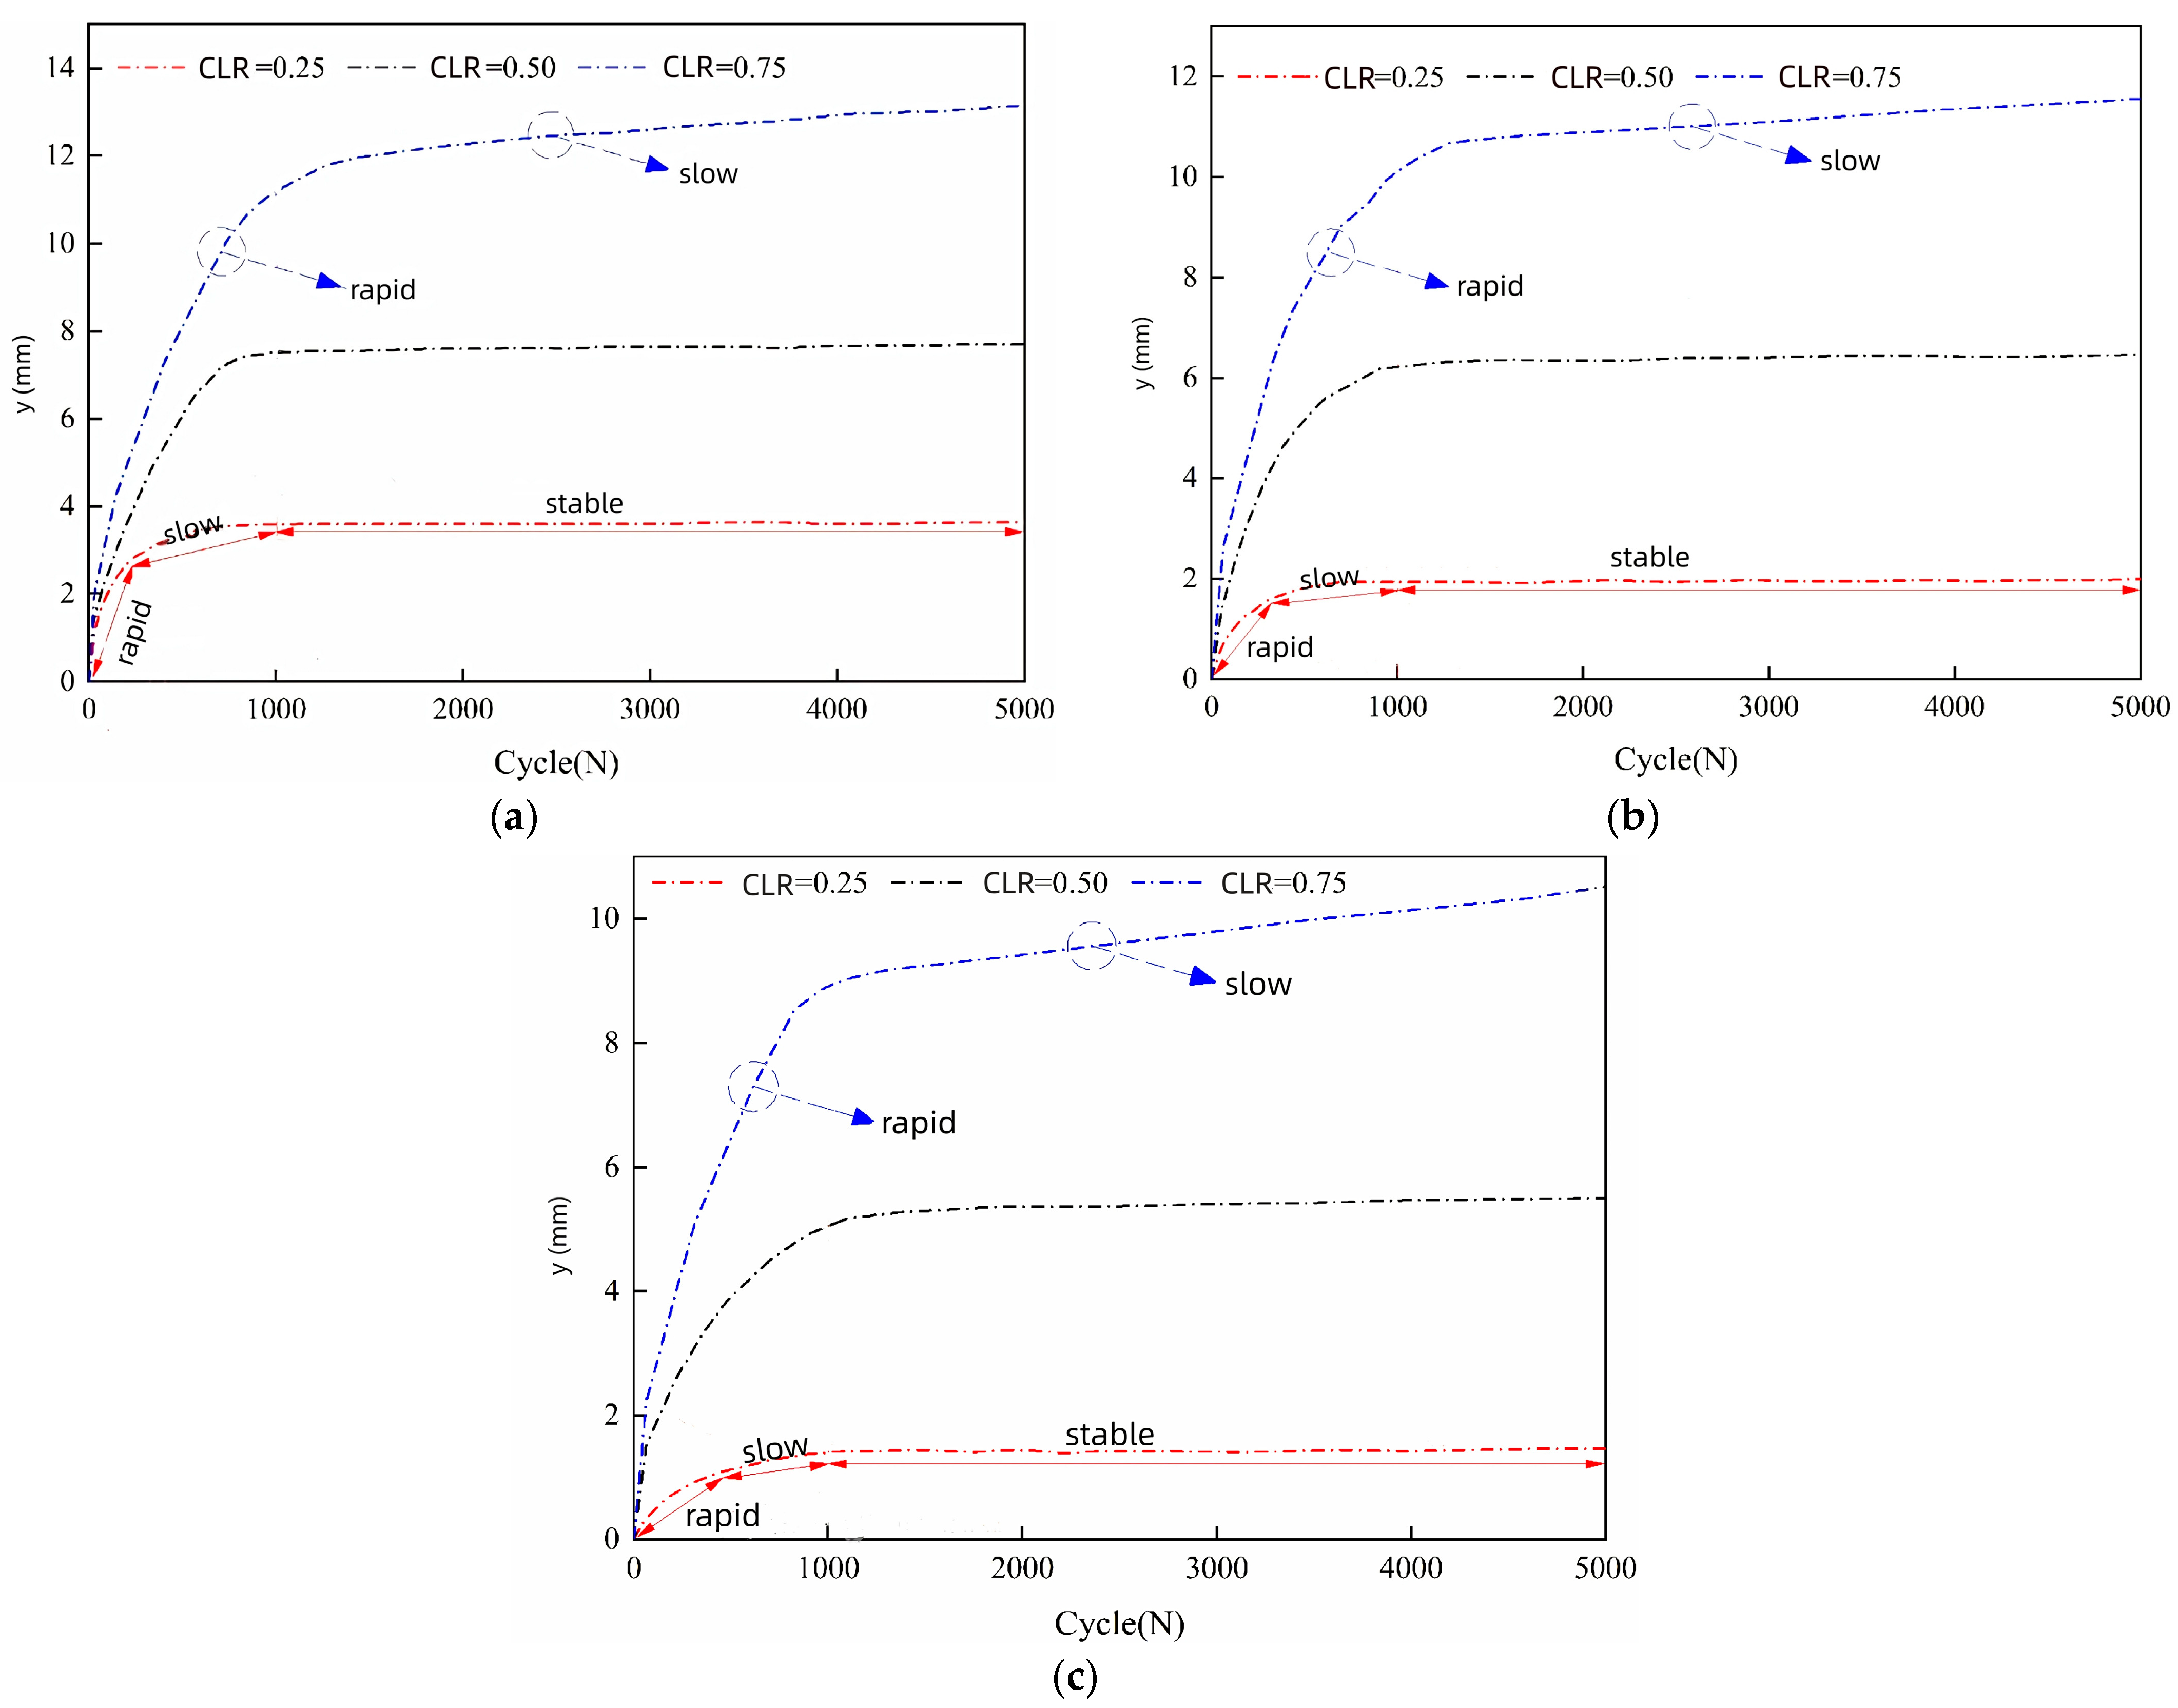
Figure 8 shows the variations of the displacement of the bearing platform with the number of cycles, and
Figure 9 depicts the changes in the rotation angle of the bearing platform with respect to the number of cycles, denoted by N. In this context, “y” represents the displacement of the bearing platform, while “θ” denotes the rotation angle of the bearing platform.
As illustrated in
Figure 8, when the amplitude of horizontal cyclic loading was small (
), the variations of the horizontal deformation at the bearing platform with the number of cycles were roughly in two stages: (1) the deformation development stage and (2) the deformation stabilization stage. During the first 1000 loading cycles, the horizontal deformation of the bearing platform was in the growth stage. It can be observed from
Figure 8 that at the early stage of loading, the horizontal deformation of the bearing platform rapidly increased, and the deformation of the pile group continuously increased with the increase of cycles. After a period of loading, the horizontal deformation of the bearing platform slowly grew, and the growth rate of deformation gradually slowed down compared with the early loading. After undergoing 1000 loading cycles, the horizontal deformation of the bearing platform stabilized and ceased to increase. However, when the amplitude of the horizontal cyclic loading was higher (
), the horizontal deformation of the bearing platform exhibited a sharp increase during the initial 1000 cycles, and still increased in the subsequent cycles. Although there was no stable trend in the curve, the growth rate was significantly slower than that in the first 1000 cycles. Meanwhile, the cyclic loading amplitude and pile spacing also have a large influence on the horizontal deformation of the bearing platform. When the pile spacing was set at 3 times the pile diameter, the horizontal deformation of the bearing platform was 3.4 mm, 7.6 mm, and 11.6 mm at 1000 cycles, with the increase of the loading amplitude. When
, the horizontal deformation of the bearing platform increased by 52.6%, compared with
, and when
, the horizontal deformation of the bearing platform increased by 123.5%, compared with
. The above conditions indicate that the horizontal deformation of the bearing platform increases with the increase of the cyclic load amplitude. In addition, when
, the horizontal deformation of the bearing platform at 1000 cycles was observed to be 2 mm and 1.4 mm for pile spacings set at 4 times and 5 times the pile diameter, respectively. This represents a decrease of 41.2% and 58.8% compared to the pile spacing set at 3 times the pile diameter. These findings suggest that the horizontal deformation of the bearing platform diminishes as the pile spacing increases under similar force conditions.
As shown in
Figure 9, when
, the angle of the bearing platform rapidly increased at the beginning of loading, and then the growth rate slowed down and finally tended to level off. When
, the angle of the bearing platform first sharply developed, and then it slowly grew, without a tendency to stabilize. Meanwhile, when the pile spacing was set at 3 times the pile diameter, with the increase of
, the rotation angle of the bearing platform was 0.23°, 0.35°, and 0.59° at 1000 cycles, and the rotation angle of the bearing platform increased by 156.5% and 68.6% at
, compared with
and
, which shows that the rotation angle of the bearing platform increased with the increase of the cyclic loading ratio (
). When
was 0.25, the rotation angle of the bearing platform was 0.23°, 0.19°, and 0.16° at 1000 cycles, with an increase in the pile spacing. A decrease of 17.4% and 30.4% was observed for the rotation angle of the bearing platform when the pile spacing was set at 4 and 5 times the pile diameter, respectively, compared to when it was set at 3 times the pile diameter. This indicates a gradual decrease in the rotation angle of the bearing platform in relation to the increased pile spacing.
The reason for the above cumulative deformation characteristics of pile groups can be attributed to the remodeling of the soil around the pile under horizontal cyclic loading. In the stage of deformation development, the soil particles moved rapidly, the original arrangement was destroyed, and the internal strain of the soil body increased accordingly, which caused the soil body around the pile to produce large deformation and continuously accumulate; thus, leading to the rapid increase of deformation of the pile group foundation at the beginning of loading. After loading for a period of time, the soil particles moved at a low speed, but the movement trend was obviously weaker than that at the beginning of loading, and the arrangement of soil particles gradually entered a stable state. This accelerated the deformation growth rate of the soil around the pile to slow down, and the deformation rate of the pile group foundation was also significantly reduced. In the stage of deformation stabilization, the soil particles almost stopped moving, and the arrangement of soil particles basically remained stable. Therefore, the deformation of the soil around the pile no longer increased, and the deformation of the pile group also entered into the stabilization stage.
3.2. The Influence of Soil Response on Cumulative Deformation of the Pile Group
To explore the impact of the soil dynamic response on the accumulated deformation of the pile group, the horizontal cyclic loading-induced soil cracks and the pore water pressure in the vicinity of the pile–soil interface will be investigated in this section.
In this test, the presence of cracks in the soil surrounding the pile is regarded as localized damage within the pile–soil system induced by horizontal loading.
Figure 10 displays the development of soil cracks around the pile under different pile spacings. As shown in
Figure 10, the development of cracks within the soil around the pile under horizontal cyclic loading followed the following process: (1) At the beginning of loading, a micro-crack was generated in the soil behind the pile, and with the increase of cycles, the micro-crack started to link up, and formed a circular crack around the pile side; then, the crack width widened, and the depth continuously extended under the continuous action of horizontal loading. (2) The water in the upper layer of soil around the pile continuously drained along the crack and interacted with the soil around the pile, causing the mud to flow into the crack, which then softened the soil surrounding the pile. (3) The pile foundation underwent repeated movements under cyclic loading, which resulted in the compression of the soil in front of the pile. As a result, the displaced soil was forced upwards, forming an elevated and convex slope. (4) The soil around the pile was driven by the pile foundation and performed a reciprocal movement under the horizontal cyclic loading, which then generated a cyclic tension crack, and eventually manifested as a radial crack perpendicular to the pile foundation at the end of the test. (5) The mud flowed into the crack, and the crack at the pile–soil interface kept extending outward and downward under the coupling effect between the horizontal cyclic loading and the cohesive force of the silty clay, which made the pile–soil interface become completely detached.
It can also be observed from
Figure 10 that the above phenomenon became weaker and weaker under the same loading amplitude with the increase of the pile spacing, and there was also no pile–soil separation when the pile spacing was set at 5 times the pile diameter, but the overall development law was still similar. The findings of this study suggest that the observed phenomenon can be attributed to the influence of the pile group effect. Specifically, it was observed that there was a larger superimposed area of soil stress and plastic deformation around the pile with the smaller pile spacing, resulting in more significant soil movement in the vicinity of the pile.
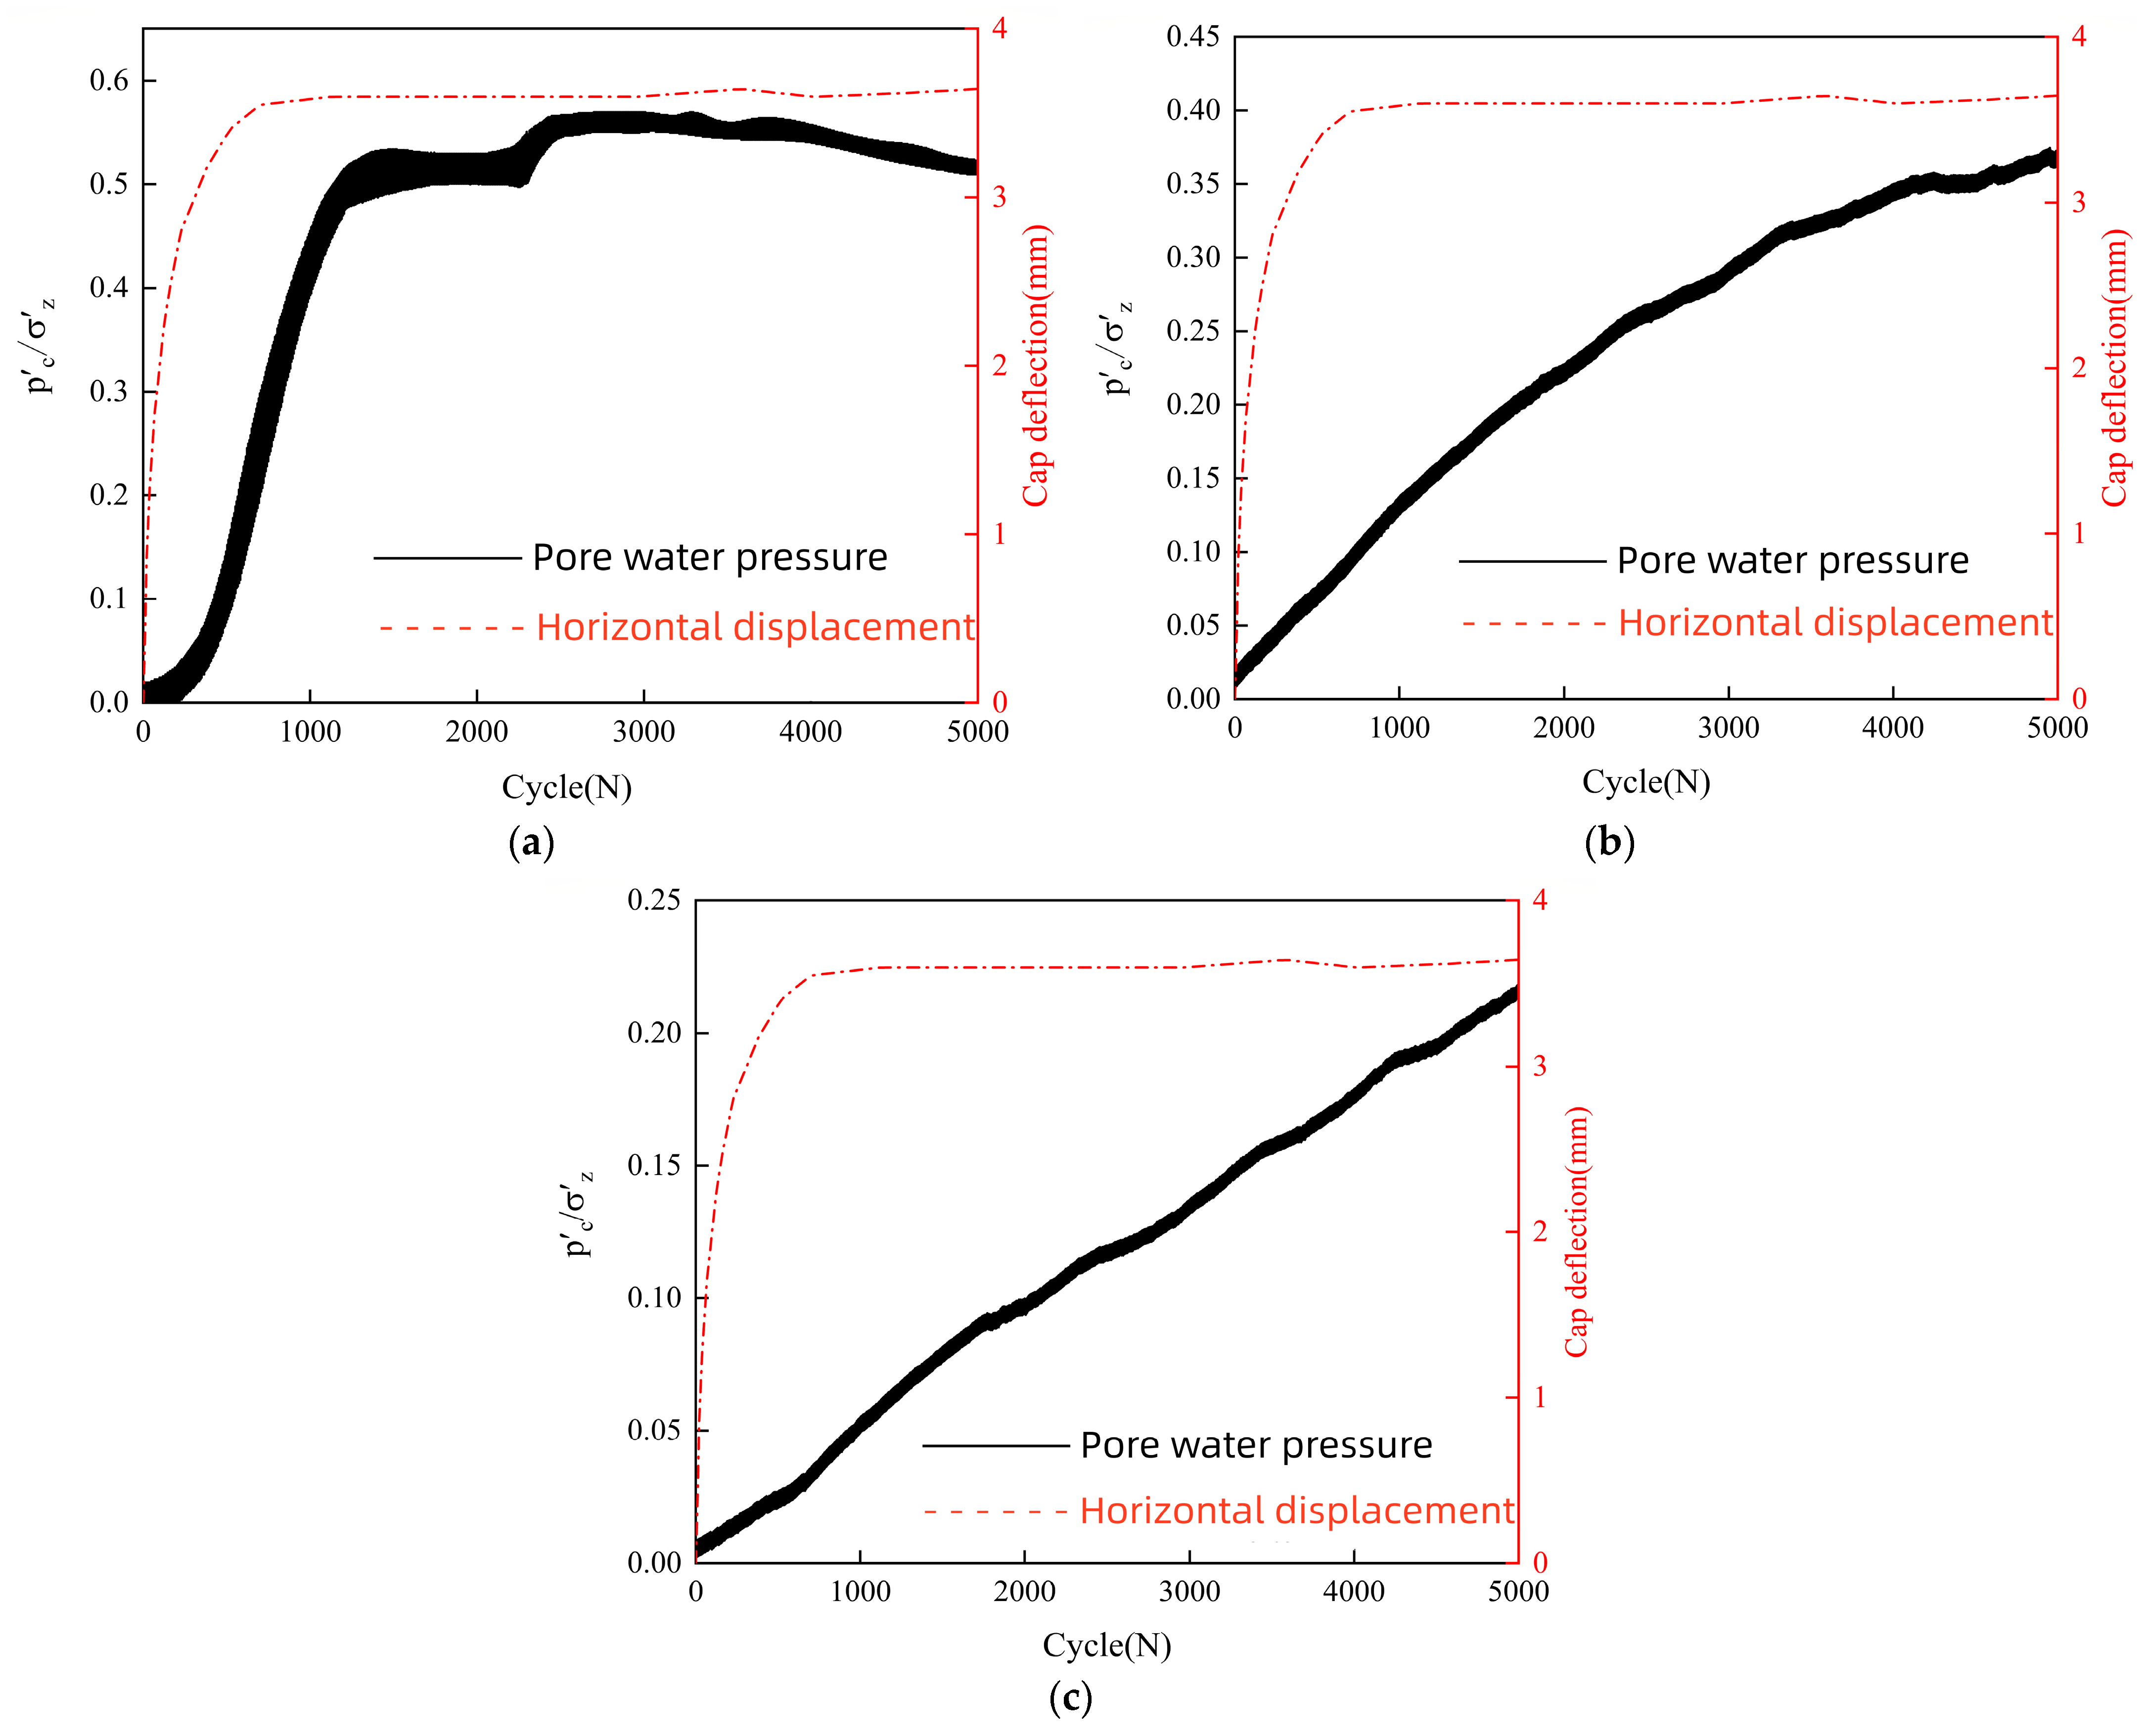
Under the cyclic horizontal loading, the pore water pressure in the vicinity of the pile group foundation in saturated clay soil exhibited a cumulative effect. This can result in a reduction in the effective stress within the saturated clay soil, ultimately leading to a degradation in the bearing capacity of the pile group foundation.
Figure 11 shows the variations of pore water pressure at different depths near pile 1 in the pile group foundation, where
is the measured pore water pressure, and
is the vertical effective stress at the same depth.
As depicted in
Figure 11, the pore water pressure adjacent to the pile increased with the increase of cycles. The rate of growth for the pore water pressure at the location of the P2 and P3 sensors rapidly sped up during the initial cycles, but gradually decelerated thereafter (the schematic diagram of sensor arrangement is shown in
Figure 6). The cause is that the P2 and P3 sensors were situated in the middle of the foundation soil, where the pore water in the soil surrounding the pile is unable to dissipate rapidly under the influence of horizontal cyclic loading, resulting in an escalation of pore water pressure. However, the pore water pressure in the location of the P1 sensor tended to decrease in the later period. This is likely because the water in the pore space was continuously discharged from the crack with the development of the crack in the later period, and the pore water pressure was gradually dissipated with the increase of the crack.
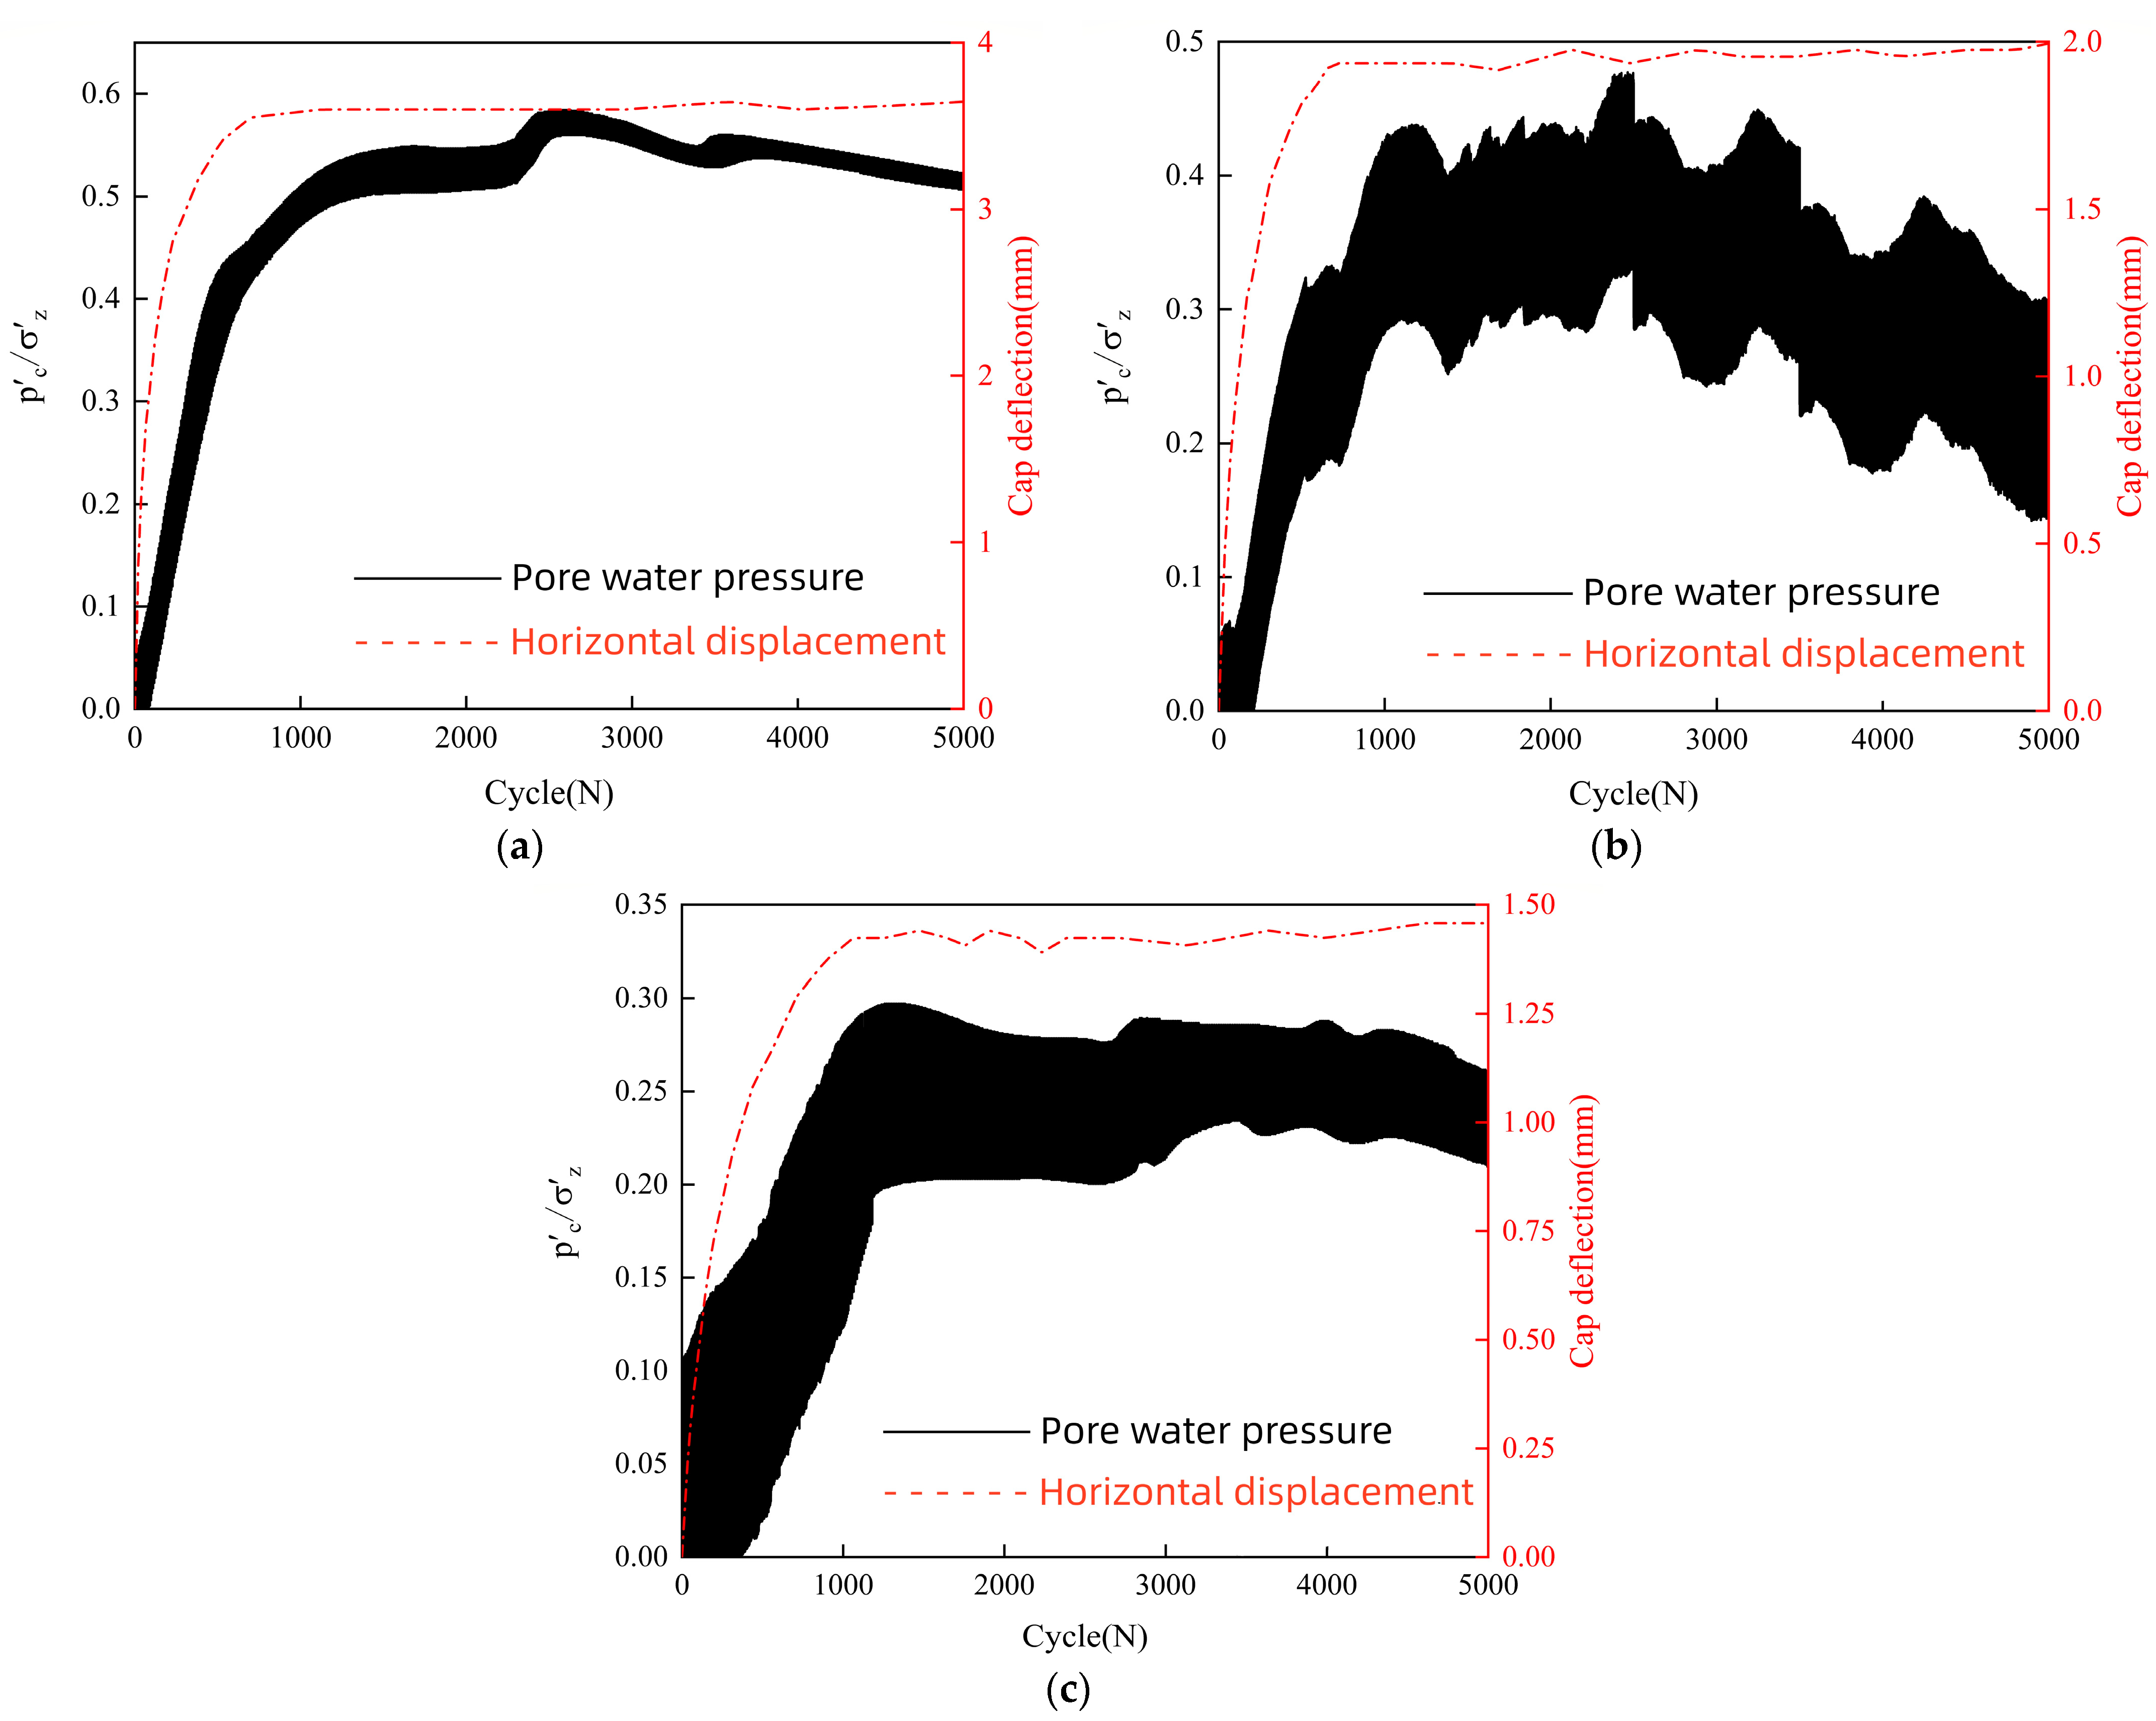
In order to investigate the trend of pore water pressure development in relation to the varying pile spacings, this study employed pile 2 as a representative case for analysis.
Figure 12 depicts the development of pore water pressure for pile spacings set at 3, 4, and 5 times the pile diameter, with a depth of 2 times the pile diameter (the location of the P4 sensor). The results revealed the same variation pattern for the pore water pressure at different pile spacings: It underwent rapid development during the initial 1000 cycles, followed by a subsequent declining trend. However, significant differences in values were observed beyond 1000 cycles. Specifically, the pore water pressure under pile spacing set at 3 times the pile diameter demonstrated an increase of approximately 30% compared to that of pile spacing set at 4 times the pile diameter. Similarly, the pore water pressure under pile spacing set at 4 times the pile diameter showed an increase of about 25% compared to that of pile spacing set at 5 times the pile diameter. This observation indicates that the cumulative effect of pore water pressure weakens with a larger pile spacing due to the pile group effect. Additionally, a shorter pile spacing results in a higher pore water pressure, as the softening of saturated clay becomes more prominent due to the decrease in effective stress within the soil, leading to larger horizontal cumulative deformation of the pile group.
In addition, from
Figure 11 and
Figure 12, it can be found that the super pore water pressure on the pile side was basically consistent with the trend of cumulative deformation of the pile group. Therefore, the cumulative deformation process of the pile group can be explained by the generation of super pore water pressure and the dissipation of super pore water pressure in the process of cyclic loading. During the development stage of horizontal deformation of the pile group, the excess water in the pore space of the soil on the pile side may not be able to effectively drain in the early stage, resulting in rapid accumulation of excess pore water pressure under the influence of horizontal cyclic loading. According to the effective stress principle, the effective stress decreases with the rise of pore water pressure, which directly leads to the decrease of soil strength, the increase of soil deformation, and the sharp increase of horizontal deformation of the pile group. In the later stage, due to the accumulation rate of super pore water pressure on the pile side gradually decreasing, the growth rate of soil deformation decreased, and the accumulation rate of horizontal displacement of the pile group became slow. In the stabilization stage of pile group horizontal deformation, the super pore water pressure on the pile side no longer increased, the soil deformation tended to be smooth, and the pile group horizontal accumulated deformation tended to be stable.
3.3. The Investigation of the Relationship between Pile Bending Moment and Soil Depth
This paper presents an analysis of the bending moments of each pile shaft, using data measured from the strain gauge during the test. The calculation of the bending moment was based on the theory of elastic foundation beams, which can be shown in Equation (1):
where
represents the bending moment of the pile,
denotes the pile diameter,
and
represent the tensile strain and compressive strain of the pile side, respectively, and
is the bending stiffness of the pile.
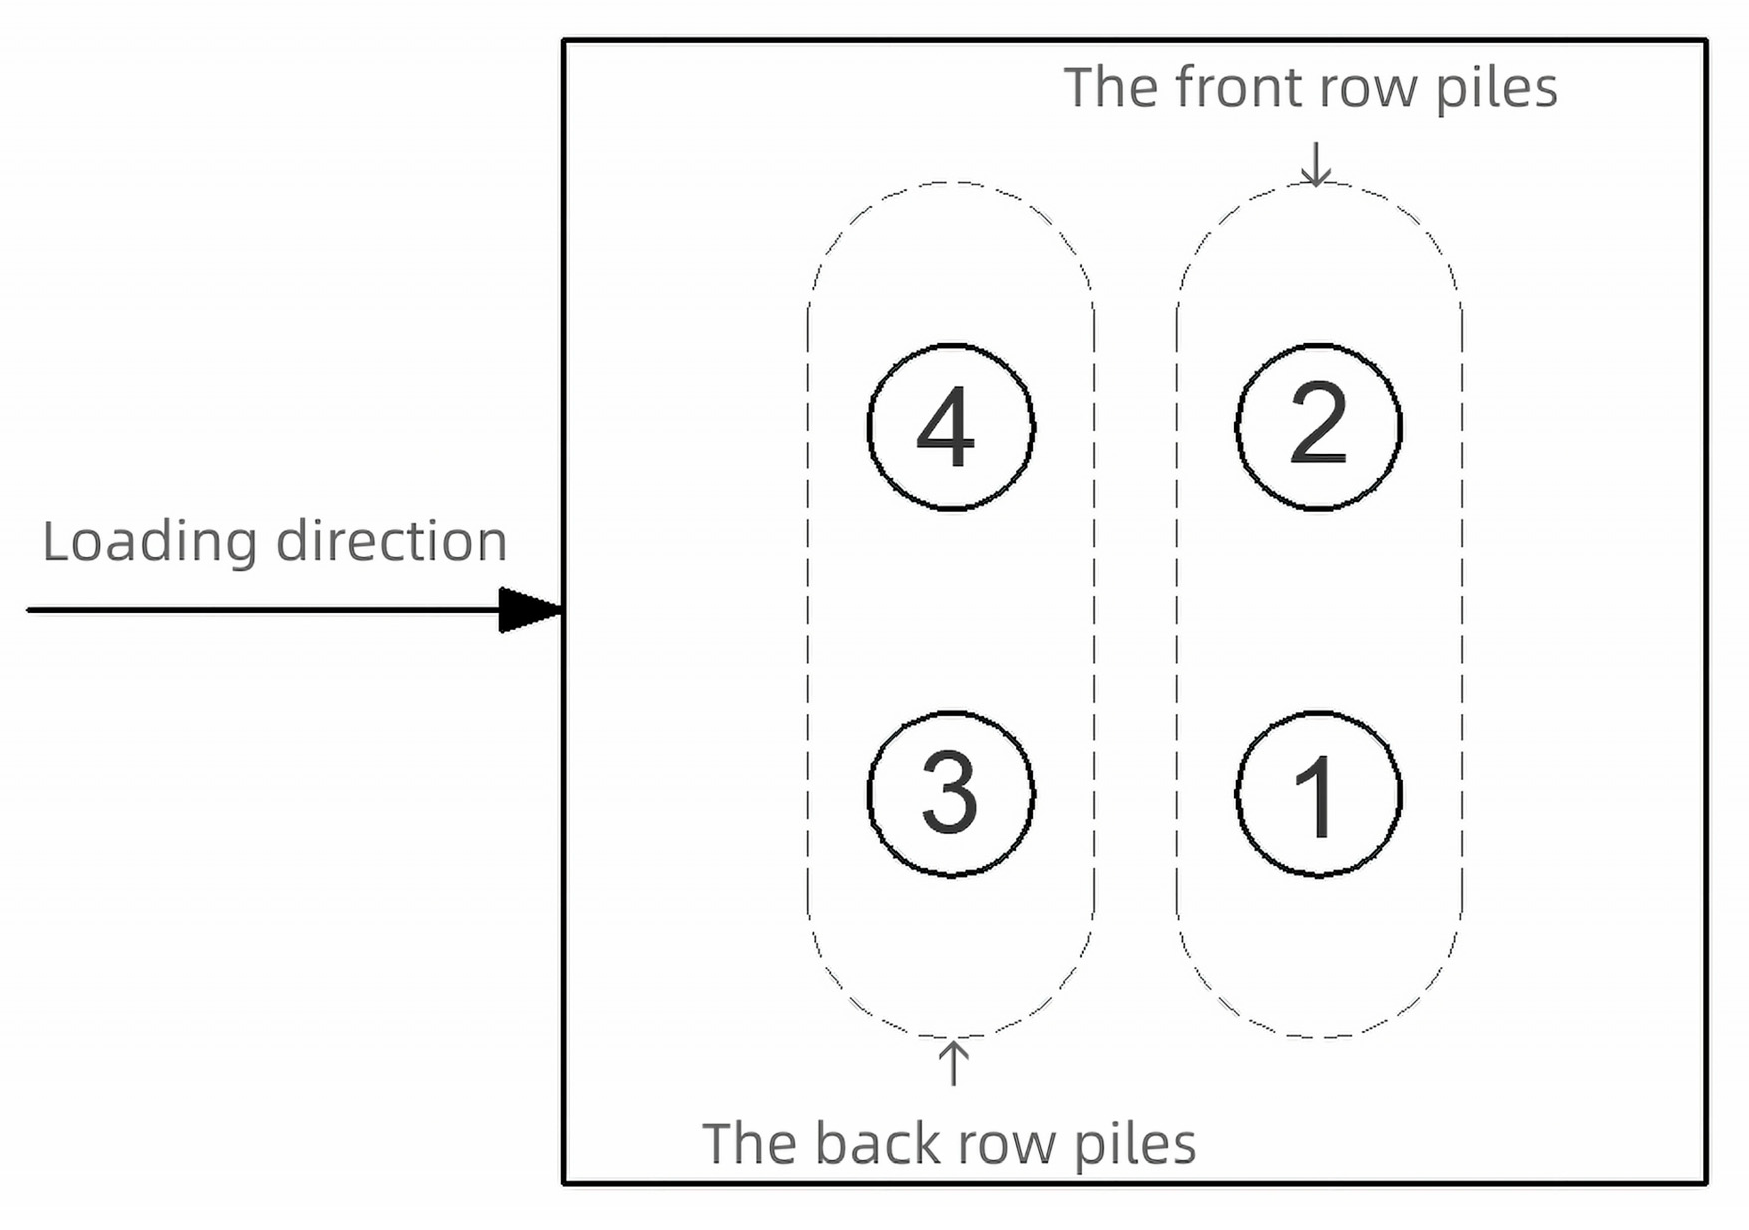
The arrangement of the pile group is shown in
Figure 13. Considering the symmetry of the bearing deformation, this paper only discussed the bending moment distribution of piles 1, 2, and 3.
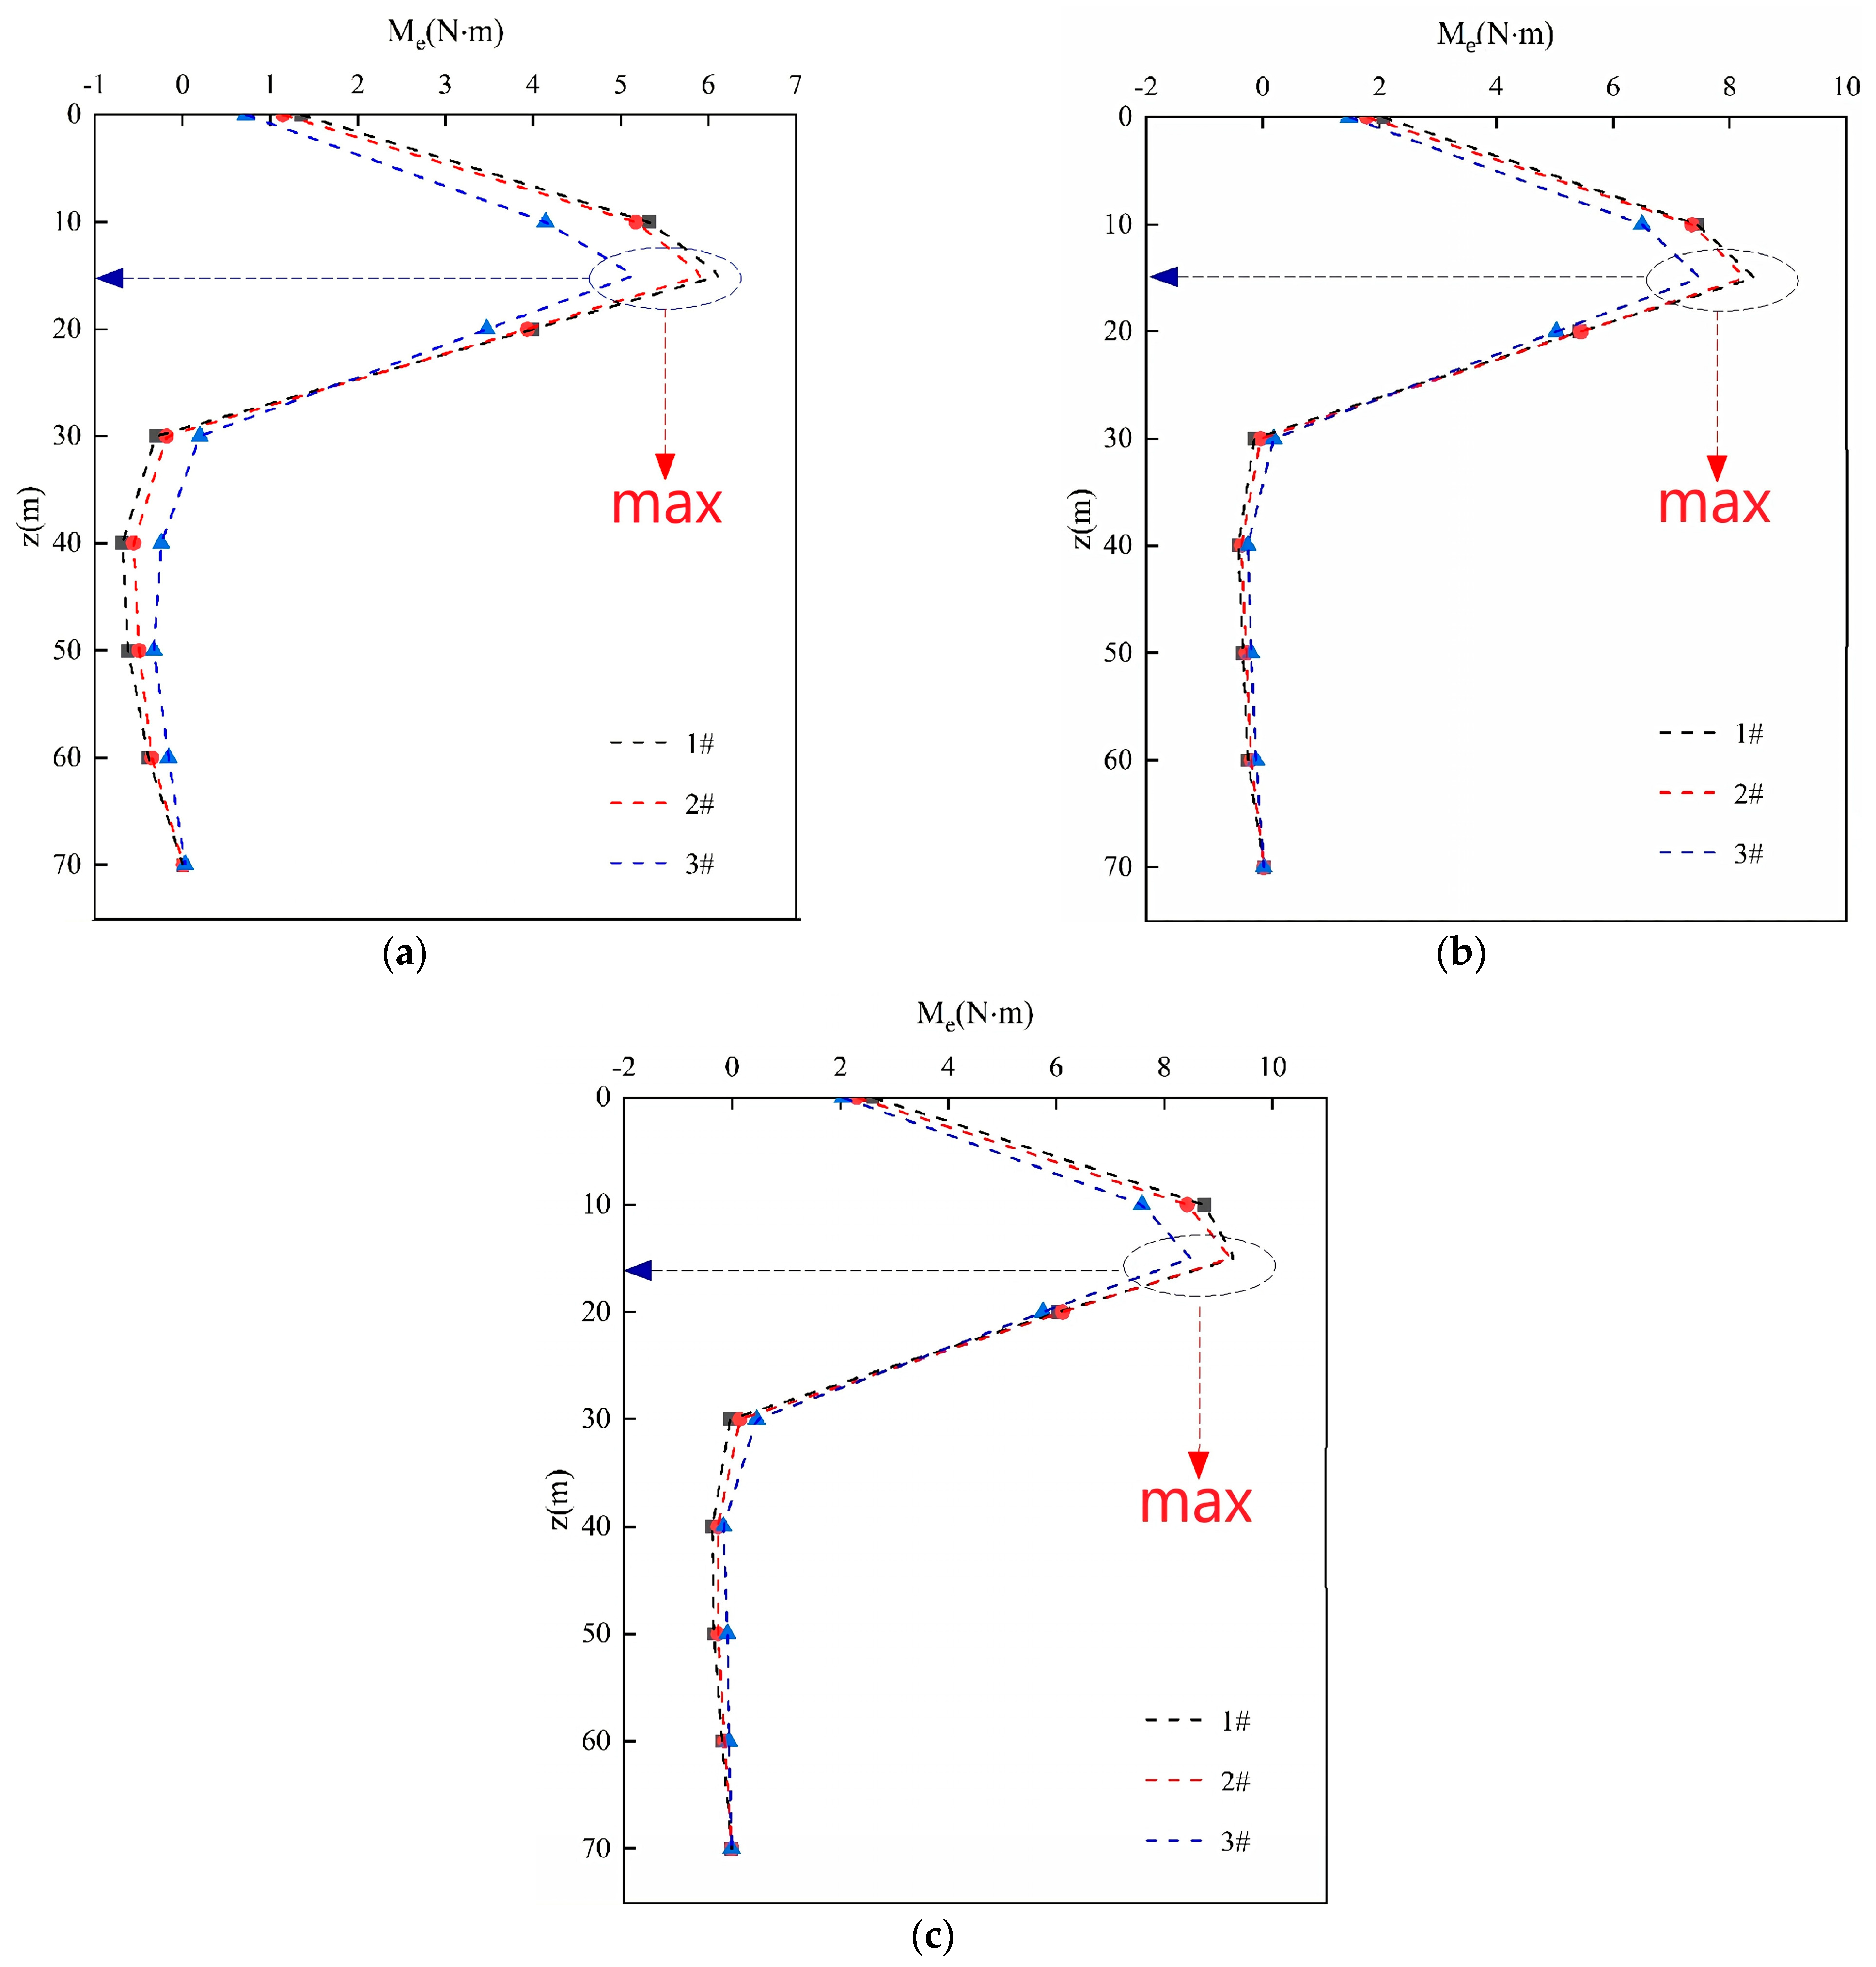
Figure 14 shows the variation of the moment of the pile group along the soil depth for different piles. As shown in
Figure 14, when s = 3D and CLR = 0.25, the bending moment of each pile at the mud surface increased by 60–70% after 1000 cycles, compared with that at 10 cycles, and by 5–10% at 5000 cycles compared with that at 1000 cycles, which shows a similar law to the horizontal deformation of the bearing platform. At the same time, the pile bending moment of each pile at 1000 cycles was more than 90% of that at 5000 cycles, which indicates that the effect of horizontal cyclic loading on the pile bending moment was mainly concentrated in the early stage of loading. In the whole loading cycle, the bending moment of the pile exhibited a continuous increase with the burial depth, reaching its peak at a depth of Z = 15–20 cm (approximately 6–8 times the pile diameter). Subsequently, the bending moment of the pile gradually decreased with a further increase in the burial depth, and a point of reverse bending was observed at the burial depth of Z = 30 cm. As the burial depth exceeded 30 cm, the pile bending moment gradually approached 0 N·m. This indicates that the effect of horizontal cyclic loading on the pile–soil system of the pile foundation was mainly in the range of 0–30 cm (approximately 0–12 times the pile diameter) below the mud surface and was concentrated in the middle and upper parts of the foundation soil. Meanwhile, with the increase of cyclic loading, the maximum value of the pile bending moment was also increased, and there was a downward trend in the location of the maximum value of the bending moment due to the development of cracks around the pile.
It was also found from
Figure 14 that the development of the bending moment for each pile was different under the same force environment due to the influence of the pile–soil–pile interaction. Moreover, the bending moment distribution of pile 1 was similar to pile 2, and they increased by 9–16% compared with pile 3. Therefore, it can be concluded that the bending moment of front-row piles was larger than the back-row piles under the horizontal cyclic loading.
3.4. The Horizontal Cyclic Stiffness of the Pile Group
In this section, the pile group deformation in the perspective of foundation stiffness will be evaluated. Referring to the article of Zhang X et al. [
10], the ratio of the loading amplitude (
) to the difference between the maximum displacement (
) and the minimum displacement (
) in each cycle is taken as the horizontal cyclic stiffness (
), which can be expressed in Equation (2):
The cyclic load–displacement curves for CLR = 0.25, CLR = 0.5, and CLR = 0.75, with the pile spacing set at 4 times the pile diameter and the loading cycle set at 10 times, are depicted in
Figure 15a (where CLR represents the cyclic load ratios). It was observed that the horizontal cyclic stiffness of the pile group decreased as the loading amplitude increased, and the pile group stiffness was reduced from 56.67
to 21.25
when CLR increased from 0.25 to 0.75, and its reduction could be up to 62.5%. The incorporation of the horizontal cyclic stiffness of the pile group not only reflects the nonlinear behavior of the soil, but also supports the trend that the accumulative horizontal deformation of the pile group increased with the increase of the load amplitude.
In addition, when the pile spacing was set at 4 times and CLR = 0.5, the load–displacement curves of the pile group foundation under different cycles are illustrated in
Figure 15b. The number of cycles increased from 10 to 5000 times, and the pile group stiffness increased from 28.33 KN/m to 42.7 KN/m. As depicted in
Figure 15b, it is evident that the horizontal cyclic stiffness of the pile group escalated with the progression of cycles. Notably, the disparity between the maximum and minimum displacements within a single cycle diminished as the cycles increased, which led to a gradual stabilization of the horizontal cumulative deformation of the pile group.
The findings of this investigation hold some possibilities for augmenting the stability and safety of diverse structures, including bridges, wind turbines, and offshore platforms that are subjected to cyclic loads. Furthermore, these findings could shed light on the optimization of the pile group design under seismic loads. It is worth noting that there exists a substantial correlation between the cumulative deformation of piles and the pore water pressure around the structure. Therefore, in similar research and engineering endeavors, meticulous attention should be paid to the development of pore water pressure around the piles, particularly during the initial cycles, in order to accurately evaluate the dynamic response and deformation of the soil. Regular monitoring after project completion is highly recommended.
In addition, in the design and monitoring of pile groups, it is imperative to consider the loading conditions of different rows of piles, and the burial depth and arrangement of piles should be reasonably chosen. Moreover, it should be noted that the stiffness of the group pile foundation is not a static parameter throughout the cyclic process, despite conventionally being treated as such in the design phase. Hence, it is prudent to recommend that in future projects of a similar nature, the stiffness of materials should be reasonably selected, to ensure the secure and stable performance of the structure throughout its entire lifespan.


