1. Introduction
In the Beyond 5G and 6G eras, advanced high-speed communication is essential for the emergence of new attractive services such as AI-empowered applications, virtual reality, and tactile Internet [
1,
2,
3,
4]. Millimeter-wave (mmWave) communication, which can provide multi-Gbps data rates, will make it possible to offload the user’s computation and storage resources to the edge/cloud computing server to enable such new services [
5]. However, since mmWave communication has a higher directional link due to its high carrier frequency, i.e., 30 GHz to 300 GHz, the communication quality is sensitive to various factors. In addition, the communication range is relatively short.
IEEE 802.11ad [
6], the main product of mmWave communication at 60 GHz, will spread rapidly and be applied in many Wi-Fi networks after this. As its communication performance significantly differs from the existing Wi-Fi products due to the high carrier frequency, it is essential to properly understand the communication performance for the building of a network and during operation to obtain the most powerful performance. So far, many papers have analyzed the communication performance of IEEE 802.11ad. They provide valuable insights through mathematical and empirical analysis. The mathematical analysis reveals the logical characteristics, and the empirical study contributes to the network design based on an actual environment.
We need a measurement method to understand the communication performance for building and managing an effective IEEE 802.11ad network, i.e., in the operational phase. In particular, a simple and inexpensive measurement is necessary because non-specialists, such as end-users, will also set up their IEEE 802.11ad networks that do not require a license. However, although many papers provide the details of communication performance by using various measurement methods, so far we still do not yet have enough of a discussion on a measurement method for non-specialists, as far as we know.
Thus, this paper proposes a multilayer measurement methodology with open-source tools for evaluating IEEE 802.11ad communication quality. Although users usually pay attention to throughput, which directly affects the communication performance of applications, there is a requirement to check communication quality through multilayer indicators to build and manage a stable IEEE 802.11ad network.
The measurement methodology consists of the following three contents:
- (1)
Simple and inexpensive measurement tools;
- (2)
Easy-to-understand measurement indicators;
- (3)
Concrete measurement methods.
Although many papers introduce excellent measurement methods to investigate the details of target communication quality, almost all of them need special skills and expensive equipment. Since the IEEE 802.11ad network does not require a license, non-specialists must also build and manage their network. However, it may be difficult for non-specialists to execute the same measurement, such as those from existing studies, and understand communication performance for the measurement results. We then select open-source measurement tools and propose the indicators. In addition, we show the concrete measurement methods. Therefore, this paper contributes to providing a reference model of measurement methodology for non-specialists by presenting a measurement methodology for building and managing their wireless networks using high frequencies, which will be the mainstream in the future.
Note that this paper takes over the basic idea of our previous study [
7]. The major updates are as follows: First, we add extensive surveys on measurement related to mmWave and IEEE 802.11ad. Second, we reinvestigate the existing open-source measurement tools and indicators, and we also use
iw as a more appropriate wireless network performance measurement tool instead of
iwconfig. In addition, the scope of applications for these tools is clarified. The paper then explains our proposal in detail and provides more empirical results and discussions.
The rest of the paper is organized as follows:
Section 2 introduces related work on mmWave and IEEE 802.11ad communication evaluation.
Section 3 proposes our measurement methodology with open-source measurement tools.
Section 4 presents evaluations for each indicator, and
Section 5 concludes with our remarks.
2. Related Work
This section extensively presents evaluation studies of IEEE 802.11ad communication performance to discuss a simple and inexpensive IEEE 802.11ad measurement for non-specialists. We also describe the differences between this study and others throughout this survey.
Many existing works provide analytical/simulation models and empirical results on mmWave and IEEE 802.11ad communication performance. Reference [
8] proposed an analytical/simulation model to analyze the dependencies of the contention period and the number of sectors on the MAC delay and throughput. In [
9], 6G wireless channel measurements, characteristics, and models were comprehensively reviewed for their trends and challenges. Simulation models have also been developed to evaluate the protocol performance with parameters in different scenarios [
10,
11,
12,
13,
14]. References [
10,
11] implemented the IEEE 802.11ad model for ns-3 [
15], which is known as one of the dominant network simulators. References [
12,
13,
14] proposed an integrated simulation framework to evaluate the communication performance of UAVs in the mmWave environment. Simulators are very helpful and cost-effective for investigating communication and protocol performances in various scenarios. Such analytical/simulation models are indispensable for understanding the general characteristics at the R&D stage.
Empirical studies based on real environments are also crucial in the diffusion and operational phases. The subsequent studies provided practical evaluations for various characteristic aspects. References [
16,
17,
18] focus on the characteristics of a wireless link, and reference [
19] attempts to understand the interference characteristics and effectiveness of interference mitigation techniques using 802.11ad commercial off-the-shelf (COTS) devices. However, since special equipment such as a vector network analyzer and a software radio system is required, a high level of expertise and trained experience are necessary. References [
20,
21,
22,
23,
24] target the communication performance, i.e., throughput, with
iperf3 [
25].
Furthermore, the measurement studies in [
26,
27,
28,
29,
30,
31] investigated communication performance in various fields. In [
26], the authors studied the actual impact of consumer-grade hardware in real environments. References [
27,
28,
29] investigated the influence of attenuation factors, such as interference, materials, and non-LOS, on communication performance in a vehicular environment. In [
30], the authors measured drone communication using mmWaves in a real environment. Reference [
31] also measured communication performance and throughput, RSSI, and power consumption for IEEE 802.11ad COTS devices in an indoor environment. In addition, these studies employed a throughput indicator with
iperf3. References [
32,
33,
34] developed original measurement tools that could lead to a sophisticated measurement tool. In [
35], RSSI was measured by a smartphone application.
As described above, many studies investigated the communication performance of Wi-Fi, including IEEE 802.11ad, in different ways, with different tools, and in various environments. On the other hand, reference [
36] concluded, “Generally none of the examined metrics on its own, can be used for accurately determining the quality of a link. However, each metric can reveal interesting behavioral aspects of the link. A potential technique that would intelligently combine some of the metrics could yield an accurate representation of the link quality”. Hence, organizing easy-to-understand metrics contributes to stable IEEE 802.11ad networks.
Table 1 summarizes the measurement tools and the performance indicators for the existing IEEE 802.11ad measurement studies described above. Almost all studies employ
iperf3 to measure throughput because the indicator is directly related to an application. In addition, the metric is easy to understand, even for non-specialists. However, since the throughput shows the communication performance for end-to-end, it does not necessarily represent the wireless link quality, or is signal strength alone sufficient. Thus, we need more information that is easy to understand, even for non-specialists. Since the above existing studies have their original objective, they employ different indicators using different measurement tools. Thus, this paper discusses a simple and inexpensive methodology that non-specialists can use. For this purpose, we discuss which open-source tools and metrics can be used to measure the communication quality of IEEE802.11ad.
3. Multilayer Measurement Methodology
This section proposes a multilayer measurement methodology with open-source tools for evaluating IEEE 802.11ad communication quality. As described above, building and managing a stable IEEE 802.11ad network requires a measurement method without the need for expensive equipment and high expertise.
Section 3.1 first describes the objective and requirements for our measurement methodology, and then
Section 3.2 proposes our measurement methodology considering open-source tools and performance indicators.
3.1. Objectives and Requirements
While IEEE 802.11ad provides multi-Gbps communication performance, the communication quality is vulnerable due to its high frequency of 60 GHz compared to the existing 2.4/5 GHz Wi-Fi networks. To spread unlicensed IEEE802.11ad networks, measurement indicators that are relatively easy to understand, even for non-specialists, are necessary. Thus, this paper proposes a measurement methodology that considers indicators on multilayers. In addition, the following two requirements should be satisfied to avoid the need for expensive equipment and advanced expertise:
- (1)
Utilizing open-source measurement tools;
- (2)
Employing easy-to-understand indicators.
As described in
Section 2, the existing studies are based on the various viewpoints of their research. However, a low-cost and easy-to-understand measurement concept is necessary to build and manage a stable IEEE 802.11ad network because non-specialists, such as end-users, may be involved in network management. Therefore, as for requirement (1), open-source tools are strong candidates for low costs. Additionally, as for requirement (2), easy-to-understand indicators at multiple layers, such as throughput, delay, and signal strength, are desired to understand communication performance in an IEEE 802.11ad network.
3.2. Measurement Tools, Performance Indicators, and Measurement Methodology
This section describes a measurement methodology that considers open-source measurement tools and performance indicators. First,
Section 3.2.1 presents the performance indicators of open-source measurement tools.
Section 3.2.2 proposes a measurement methodology with them.
3.2.1. Performance Indicators of Open-Source Measurement Tools
Our methodology employs the open-source tools
iperf3,
ping, and
iw for obtaining performance indicators of multilayers. Here, we explain the characteristics of each measurement tool. The
iperf3 is one of the representative measurement tools, and its main feature is its active measurement of the throughput by TCP and UDP traffic at the transport layer. The throughput indicator is often used as a primary communication performance indicator because it directly affects applications. In addition, the measurement log provides various metrics for TCP and UDP communications. In a TCP measurement log, while a sender (
iperf3 client) provides throughput and retries results, a receiver (
iperf3 server) does throughput. On the other hand, in UDP measurement, a sender provides throughput, and a receiver does throughput, jitter, and lost datagrams.
Table 2 summarizes the performance indicators employed in this paper.
The ping is a well-known network command to verify connectivity at the IP layer. It provides RTT and packet loss information as a network performance indicator.
The iw command is a configuration utility for wireless devices. It runs on Linux and provides various functions, such as device configuration, scanning, and station statistics for RSSI, Tx/Rx bytes, Tx/Rx packets, Tx/Rx bitrates, and Tx failed. We employ RSSI and Tx bitrate to help to evaluate wireless link quality. RSSI is commonly used to show wireless conditions and is familiar to non-specialists. On the other hand, the Tx bitrate indicates the logical transmission speed for the modulation and coding scheme currently used at the Phy/MAC layers. Although it is not a familiar indicator, it is also easier to understand wireless conditions due to using concrete transmission speed values. Note that we employ only the Tx bitrate because our preliminary experiments showed that the Rx bitrate was the same value as the Tx bitrate.
3.2.2. Measurement Methodology
These measurement tools can evaluate network performance from different perspectives, as shown in
Table 2. In our concepts, the measurements are divided into two layers: the IP network layer and the wireless network layer. The IP network layer measurement evaluates end-to-end communication performance, and the wireless network layer measurement evaluates wireless link performance. Since the communication performance of the IP network layer includes that of the wireless network layer, it is unnecessary to investigate all indicators in every evaluation.
The measurement methodology is as follows: The communication performance of the IP network layer is evaluated with iperf3 and ping first. Throughput is the most straightforward indicator that judges whether the communication performance meets the application’s requirements. If the result is satisfactory, no further consideration would be necessary. Alternatively, if a user is concerned about the communication performance for real-time applications such as network games, then packet loss, RTT, and jitter should also be examined.
If the communication performance of the IP network layer is unsatisfactory, further investigation of the wireless condition is required. The measurement tool iw provides RSSI and Tx bitrates as the wireless link information. RSSI is a well-known indicator of a wireless link. However, it is insufficient for properly understanding the wireless condition because the RSSI value cannot detect interference. Hence, the communication performance may be poor even if the RSSI value is high. Additionally, it would be difficult for non-specialists to understand such a condition.
Our methodology introduces Tx bitrates. Tx bitrates would be a helpful indicator for understanding a wireless link performance because the logical transmission speed is directly related to the throughput. Since IEEE 802.11ad employs a rate adaptation mechanism in that the bitrate is adjusted according to the wireless network conditions, checking the bitrate is effective for judging whether the wireless network environment is proper.
Figure 1 illustrates concrete measurement methods. Our methodology introduces measurement nodes, i.e., sender and receiver, and an operational PC. For instance, in
Figure 1a, the AP is a measurement node for STA1. However, it is difficult for users to run the tools on separate nodes simultaneously. Of course, users can operate both nodes via either of the nodes, but the operation may cause unnecessary traffic within the target communication flow. In addition, it is also difficult to operate two devices via the IEEE 802.11ad link if either device is not within the same communication range or if both are at a distance where the communication is unstable. Therefore, our methodology employs an operation PC to manage the measurement nodes.
As shown in
Figure 1, the operation PC communicates with the measurement nodes via
ssh over an ad hoc mode and wired line. That is, in addition to an IEEE 802.11ad interface, the STA has a Wi-Fi interface, i.e., 2.4/5 GHz, to establish the ad hoc connection. It means that as the operation PC controls the nodes via an ad hoc connection, unnecessary traffic does not generate in the IEEE 802.11ad communication.
In
Figure 1a, since we use a configurable AP running hostapd [
37], the AP can execute the measurement tools. However, a commercial AP generally cannot run them. So, as illustrated in
Figure 1b, we introduce another measurement node connected to an AP via a wired line. Only the wireless node, i.e., STA, can obtain the
iw result in the measurement.
4. Experimental Evaluation
This section demonstrates the measurement experiments conducted with our methodology and discusses the empirical results. First,
Section 4.1 explains the experimental scenarios and settings; then,
Section 4.2,
Section 4.3, and
Section 4.4 analyze the characteristics of the communication performance indicators for the three target scenarios.
Section 4.5 discusses the measurement methodology.
4.1. Experimental Scenarios and Settings
This section evaluates communication performance by IEEE 802.11ad in the following three scenarios:
Scenario 1 (S1): antenna direction;
Scenario 2 (S2): distance between STA and AP;
Scenario 3 (S3): multiple STAs.
S1 evaluates the impact of antenna direction on communication performance due to a highly directional link from IEEE 802.11ad, and S2 examines the relationship between distance and communication performance. Finally, S3 evaluates communication performance affected by two STAs at different distances. Note that the experiments are based on the topology of (a) in
Figure 1.
As for the experimental settings, the stations (STAs) and access point (AP) use an Intel
® NUC Kit NUC7i7DNHE [
38] attached with an SX-PCIAD [
39], which implements IEEE 802.11ad in the 60 GHz band. They use Ubuntu 16.04.6 LTS, and the hostapd software [
37] is run to work as an AP.
The three tools execute simultaneously during measurement. The tool iperf3 measures TCP and UDP communication performance, while for TCP measurement, the server and client programs run on the AP and STA sides; in UDP measurement, the STA sends data to the AP at 2 Gb/s. In addition, ping obtains the indicators, including the RTT and packet loss, every 100 msec, and then iw works to get the wireless information every 500 msec. Note that a one-minute measurement is executed ten times.
4.2. Scenario 1: Antenna Direction
This scenario evaluates the performance impact by antenna direction.
Section 4.2.1 describes the experimental environment, and
Section 4.2.2 and
Section 4.2.3 explain the communication performance of IP and wireless network layers, respectively.
4.2.1. Experimental Environment of Scenario 1
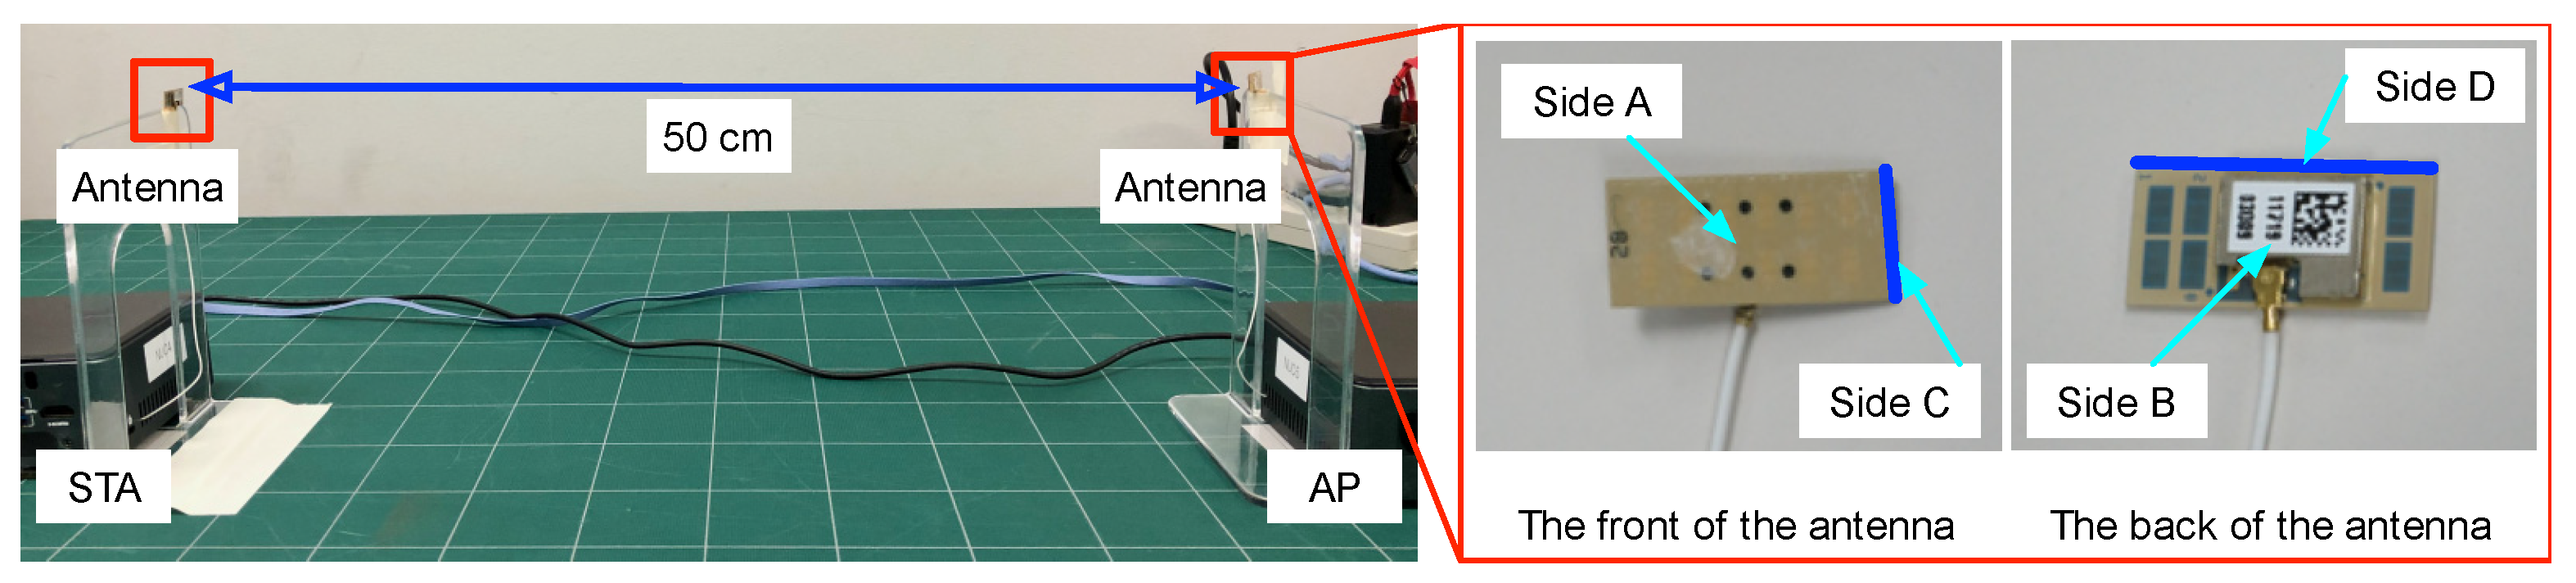
S1 examines the impact of the antenna direction on communication performance. As shown in
Figure 2, the distance between the STA and AP is 50 cm, and the four sides of the antenna are investigated. Side A/A means that Side A of the STA’s antenna faces Side A of the AP’s antenna. The traffic flow is from the STA to the AP.
4.2.2. Results of IP Network Layer in Scenario 1
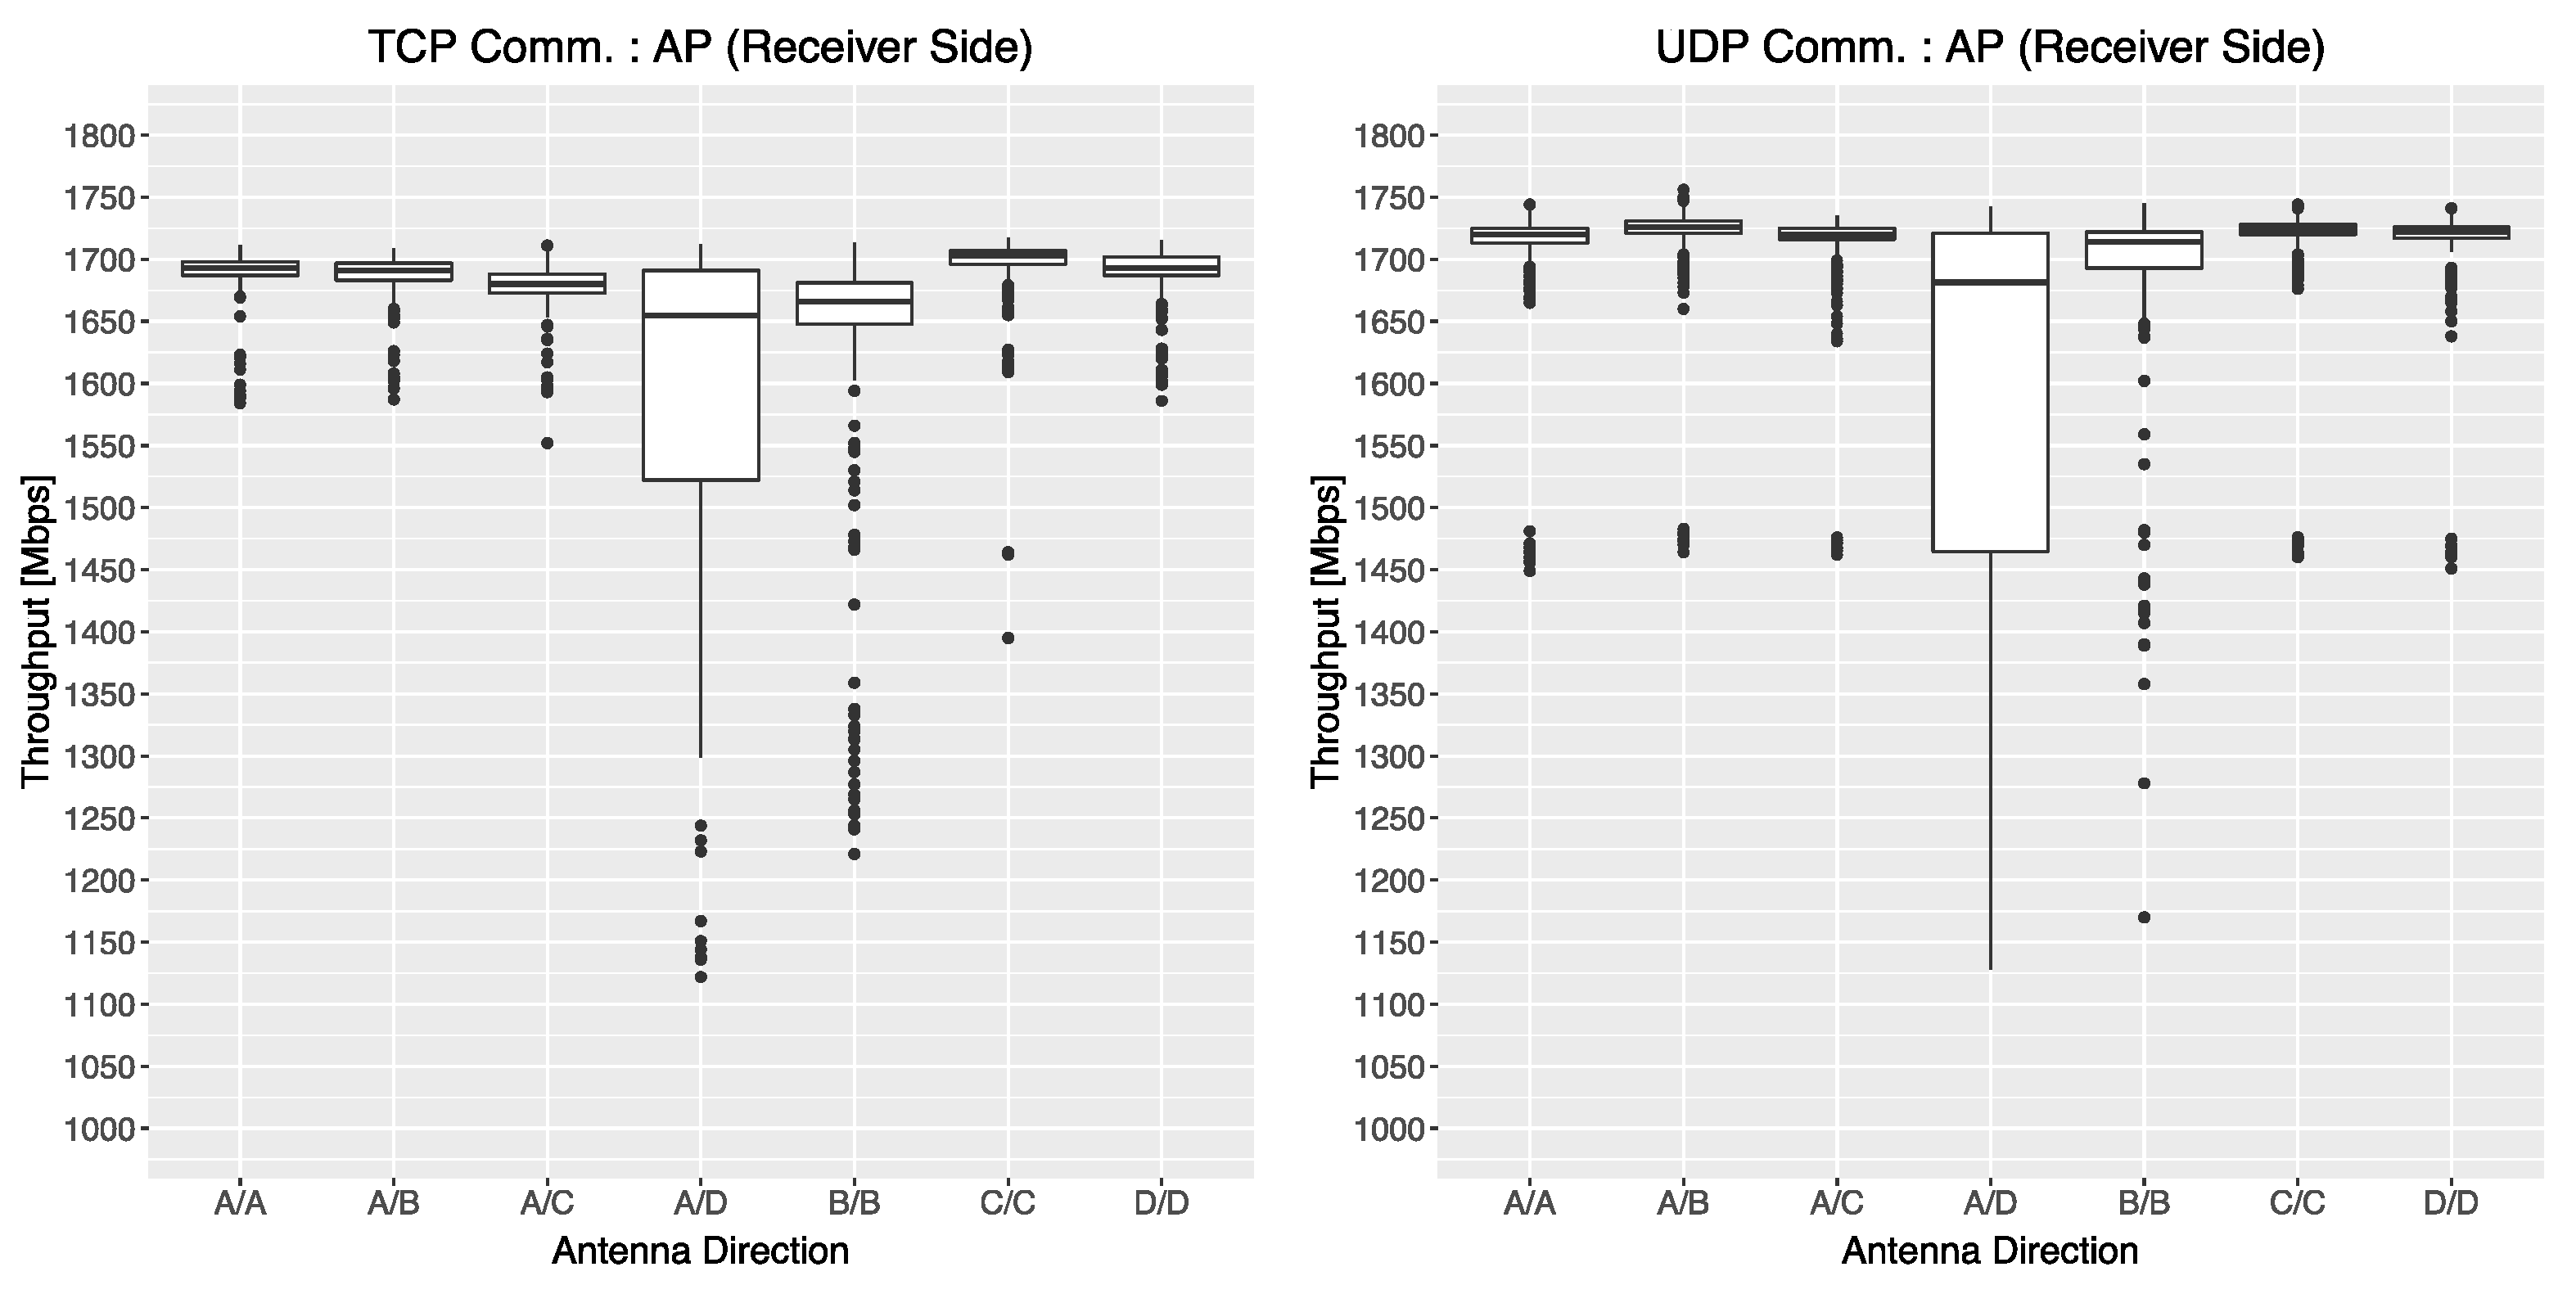
Figure 3 shows the throughput results of the TCP and UDP communications on the AP side. Both graphs have almost the same performance trend, except for the A/D and B/B combinations. In addition, we can see that the UDP result is slightly superior to the TCP result because UDP has no traffic control like TCP. The results show that even at close range, the direction of the antenna may have some impact.
We next examine retry and jitter as the other indicators of
iperf3. The results demonstrated no retry for TCP communication.
Figure 4 shows the jitter results of UDP communication on the AP side, and we can see that the jitter is relatively stable. Hence, the
iperf3 results provide the necessary information to verify that the communication requirements of the application are met. If an application requires real-time, we also examine the results of the
ping tool.
The
ping provides RTT and packet loss between a sender and a receiver. In the measurement, the results had no packet loss. That is, we can see that the network did not have problems such as congestion and link quality degradation. In
Figure 5, the RTT of A/D is higher than the others during TCP communication. In addition, during UDP communication, the RTTs of A/D, B/B, and D/D on the STA side have a somewhat significant variance compared with the other combinations. However, the results are considered to show adequate communication performance in IEEE 802.11ad communication by actual equipment.
4.2.3. Results of Wireless Network Layer in Scenario 1
If the communication performances of the IP network layer have some degradation, the communication performance of the wireless network layer should be examined to check the causes of the degradation. Here, we investigate the results of the wireless network layer when the communication performance is considered to be adequate. Understanding the reference characteristics is helpful for later discussions and comparisons.
Since three measurement tools are simultaneously run to collect the logs in our methodology, we can assess the communication performance from the iw results for the wireless network layer as needed. The methodology focuses on values of RSSI and Tx bitrates in the information that the iw provides. Although RSSI is a familiar indicator for showing wireless conditions, it is difficult to estimate the communication quality from the RSSI value. Furthermore, even if the RSSI value is high, it cannot detect performance degradation due to radio interference and other factors. Thus, to supplement it, our methodology employs Tx bitrates that show the logical transmission speed by the rate adaptation algorithm implemented in IEEE 802.11 series products as an additional indicator. For instance, the IEEE 802.11ad interface that we used supports eight bitrates: 27.5, 385.0, 770.0, 962.5, 1155.0, 1540.0, 1925.0, and 2310.0 Mb/s.
Figure 6 shows the RSSI results. From the graphs, we can see that the RSSI fluctuates to some extent, but estimating the actual communication quality, such as throughput, packet loss, RTT, and jitter, is difficult from these values. On the other hand,
Table 3 shows the percentage of each Tx bitrate observed by the
iw every 500 ms. Note that the values in bold in the table indicate the mode of the Tx bitrate at each distance. Since the Tx bitrate changes quickly in intervals shorter than 500 ms, collecting actual Tx bitrates for all transmissions is impossible. However, since the table shows that a Tx bitrate of 2310 Mb/s is statistically used in more than 95% of the transmissions, we can assess that the wireless link is relatively stable. In addition, there were no transmission failures during the measurement. On the contrary, if many low Tx bitrates are used, the communication quality is assessed to be degraded. Hence, RSSI can check primary wireless conditions, and Tx bitrate helps confirm the occurrence of communication quality degradation.
4.3. Scenario 2: Distance between STA and AP
The communicable distance is essential information in a wireless network because fluctuating RSSIs or interruptions occur as the communication distance increases.
Section 4.3.1 explains a measurement environment for evaluating communicable distance. Then,
Section 4.3.2 and
Section 4.3.3 examine the communication performances of the two network layers.
4.3.1. Experimental Environment of Scenario 2
Figure 7 illustrates the measurement environment for evaluating the communicable distance. In the measurement, the distance between STA and AP is taken every 10 m up to 60 m and every 5 m after 60 m. The operation PC connects to the AP via a wired line and to the STA via an ad hoc connection.
4.3.2. Results of IP Network Layer in Scenario 2
First, we look into the communication performance obtained by the
iperf3.
Figure 8 shows the throughput of TCP and UDP communications on the AP side. From the graphs, we can see that the increase in distance significantly impacts communication performance. In the measurement, the communication at 40 m experienced a degradation of almost 40%, and the degradation trend is not linear for the distance. In addition, there is practically no communication at 90 m. Therefore, compared with the reference data acquired in the stable environment, it can be seen that the communication quality begins to deteriorate at 10 m.
Table 4 shows the average number of retransmitted TCP packets and connection failures for ten measurements. The retransmission of the TCP packets increased after 65 m. In addition, we can see that it is unsuitable for the communication environment because of its connection failure after 95 m. From the results, since the retransmission of the TCP packets leads to significant TCP communication degradation, a distance where retransmission does not occur is desirable.
Next, we examine the performance indicators of UDP communication.
Figure 9 shows the jitter result of UDP communication on the AP side. Note that the results of 95 m and 100 m are omitted because they cannot be appropriately evaluated due to some connection failures. The left graph shows that the jitter values start to vary at 40 m. Furthermore, in the right figure with the y-axis scale spanning from 0 to 0.4 ms, the jitter and the variance increase as the distance increases. From the results, we can see that even if an application requirement meets the throughput, the jitter requirement may not be met.
Let us look at the communication performance for the
ping.
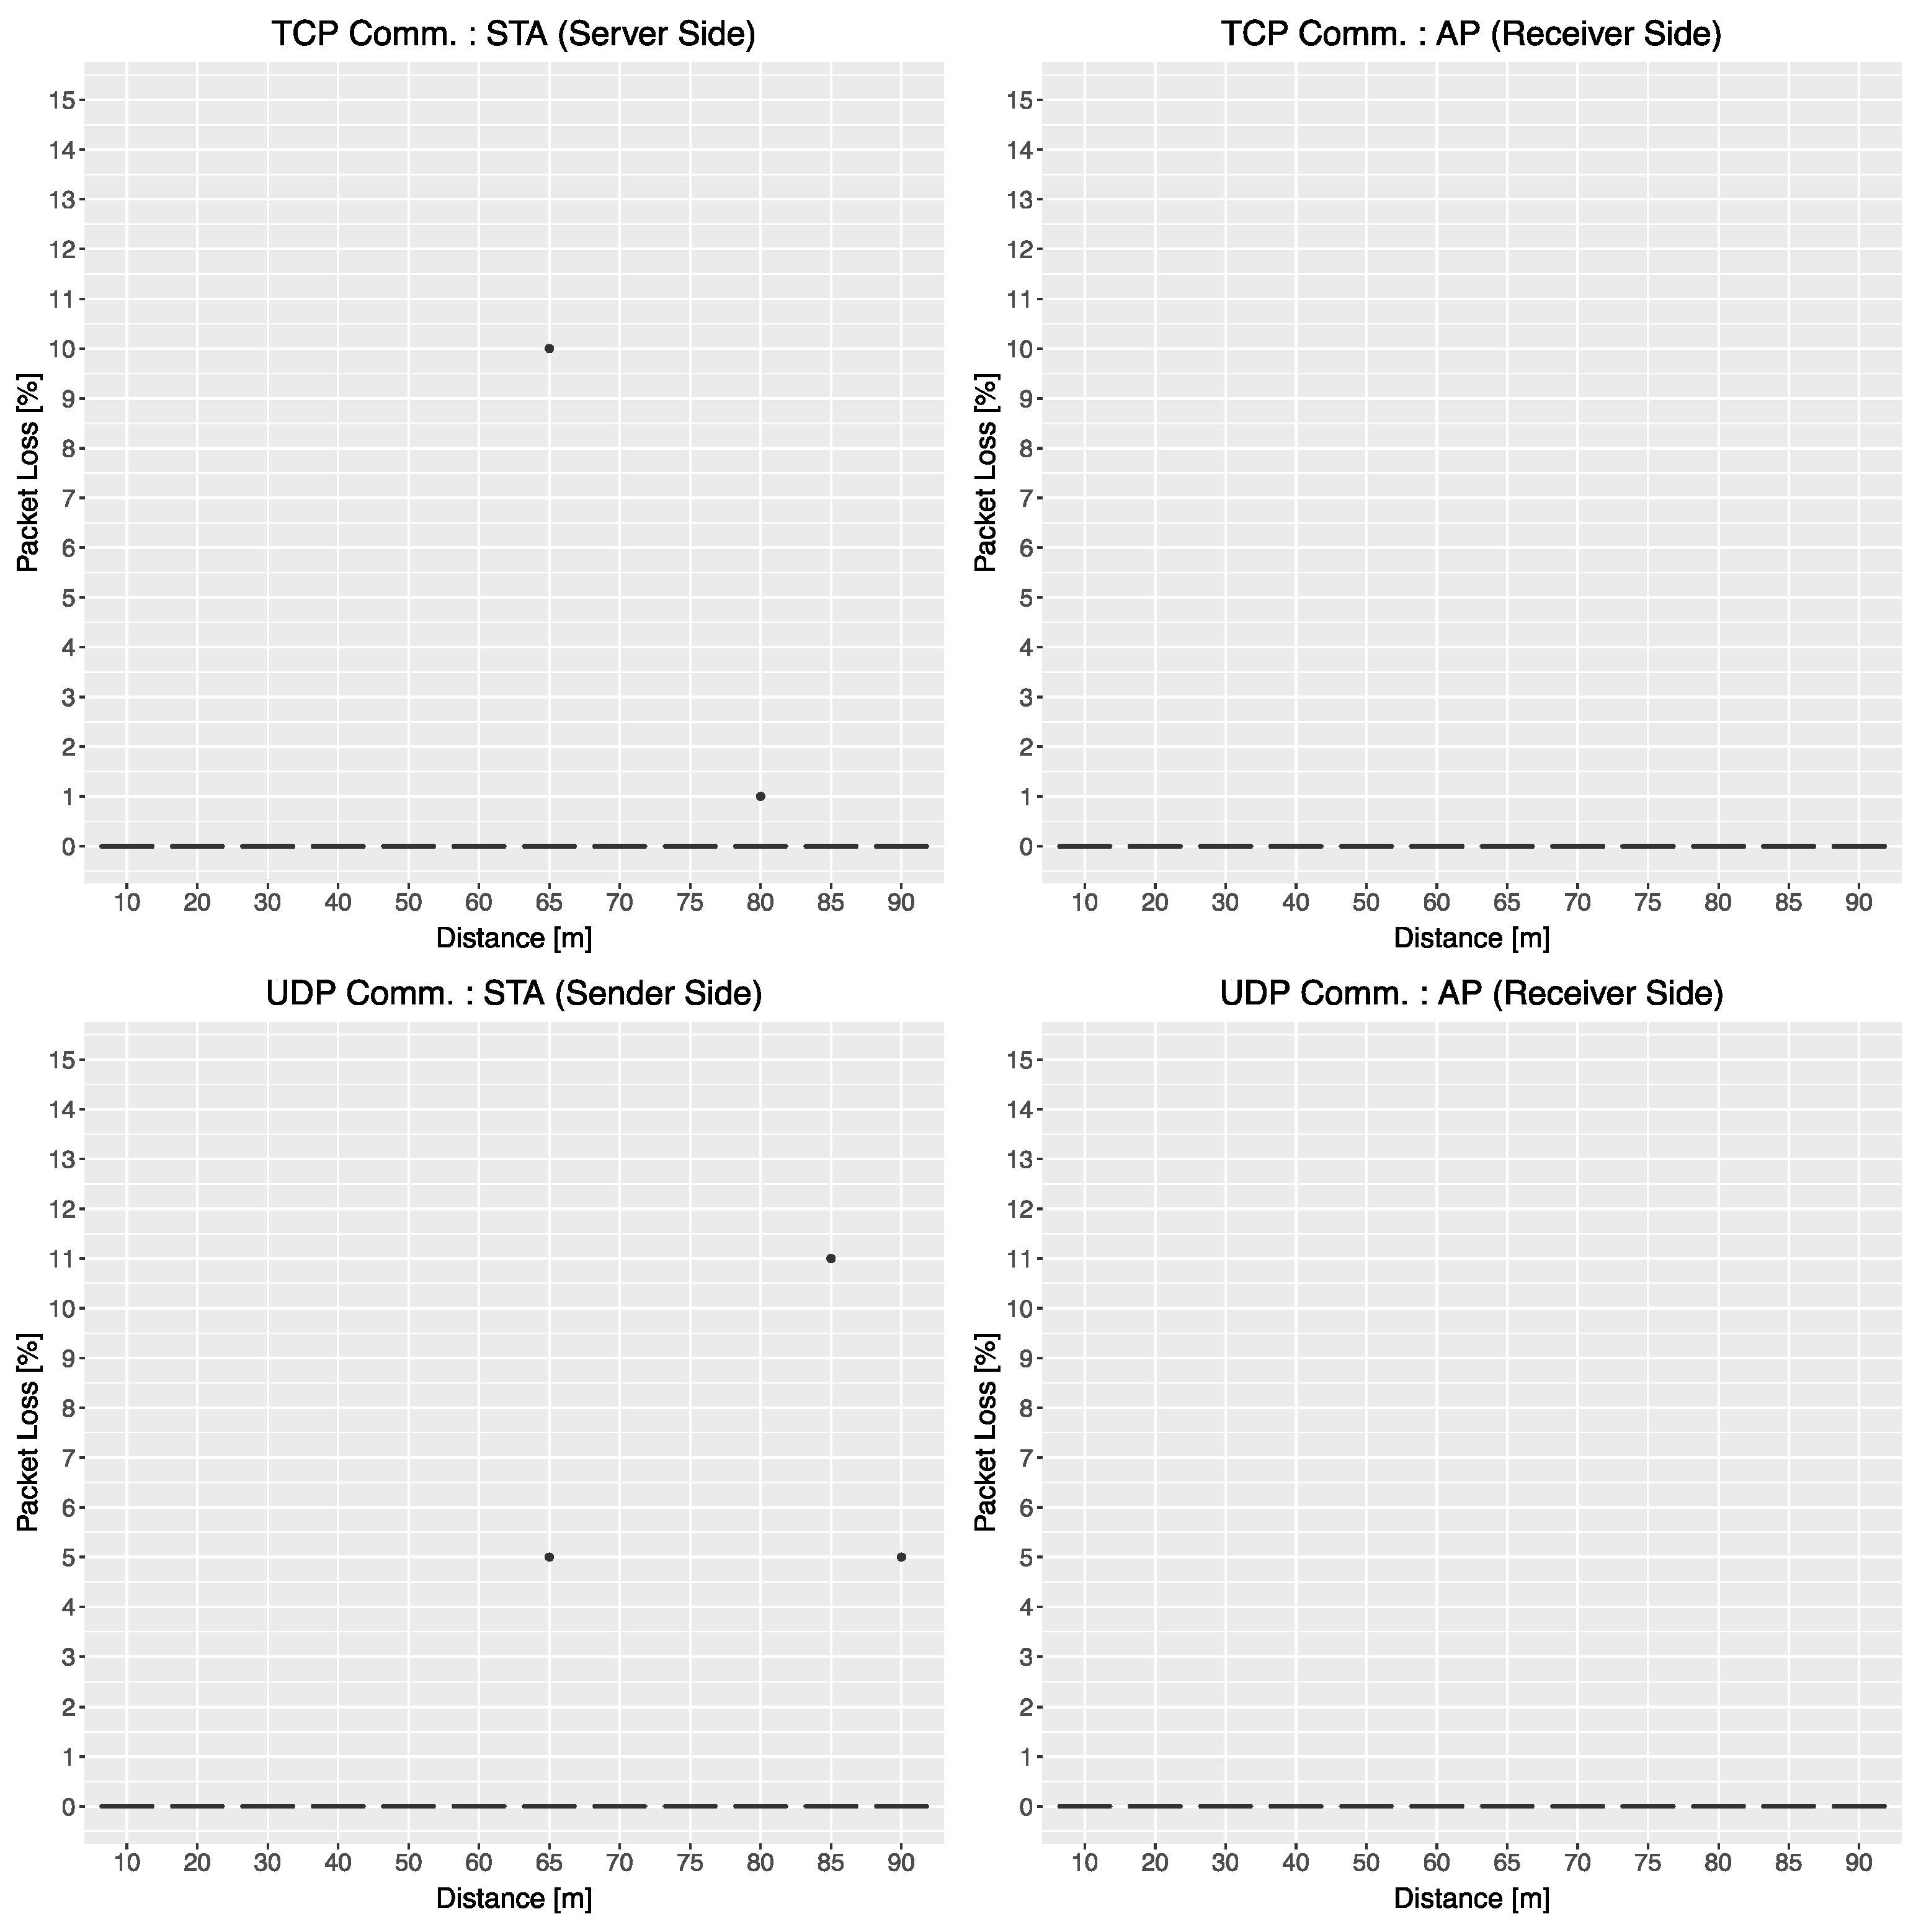
Figure 10 and
Figure 11 show the RTT and packet loss rates of TCP and UDP communication on both sides, respectively. Packet loss was observed after 60 m, and RTT increased after 60 m.
4.3.3. Results of Wireless Network Layer in Scenario 2
We now examine the results of the wireless network layer.
Figure 12 shows the RSSI of TCP and UDP communications on both sides. Compared with the RSSI results of Scenario 1 (see
Figure 6), the RSSI at 10 m is already significantly degraded, i.e., approximately 10 dBm. After that, there is a relatively small difference in the RSSIs, but RSSI values suddenly dropped at 30 m. In addition, by analyzing the log file in detail, we found that the log file records two types of errors. One error is that the
iw result included inaccurate values of 0 in RSSI. The other is that all information about the wireless interface, including Tx bitrates, was not logged. Since this type of erroneous information is output when the wireless connection is unstable, it would be helpful as one of the decision indicators.
Table 5 summarizes the occurrence of invalid and missing values. The table indicates the average number of RSSI values of 0 and no information. The invalid RSSI began to emerge at 30 m. On the other hand, no information began to occur at 65 m. The results show that assessing the trend between throughput and RSSI is difficult.
Table 6 shows the percentage of each Tx bitrate observed by the
iw on the STA. Note that the values in bold in the table indicate the mode of the Tx bitrate at each distance. For instance, the mode of Tx bitrate at 20 m is 1925.0 Mb/s, and the Tx bitrate for the mode degrades as the distance increases. Even if the RSSI is not significantly reduced, the throughput will also be reduced as the Tx bitrate degrades. Therefore, the Tx bitrate is a more appropriate indicator of wireless link quality than RSSI, and it is an easy-to-understand metric for non-specialists.
4.4. Scenario 3: Multiple STAs
As primary investigations, the above two scenarios evaluated the communication quality between one STA and one AP. However, multiple STAs exist in an actual environment. Therefore, this section explains how to assess the scenario, and it examines the impact of communication quality by multiple STAs. As an example, we employ the two STAs located at different distances. The scenario will give more interesting insights than a scenario for two STAs at the same distances.
Section 4.4.1 explains the measurement environment, and
Section 4.4.2 and
Section 4.4.3 examine the impact of communication quality on the IP and wireless network layers, respectively.
4.4.1. Experimental Environment of Scenario 3
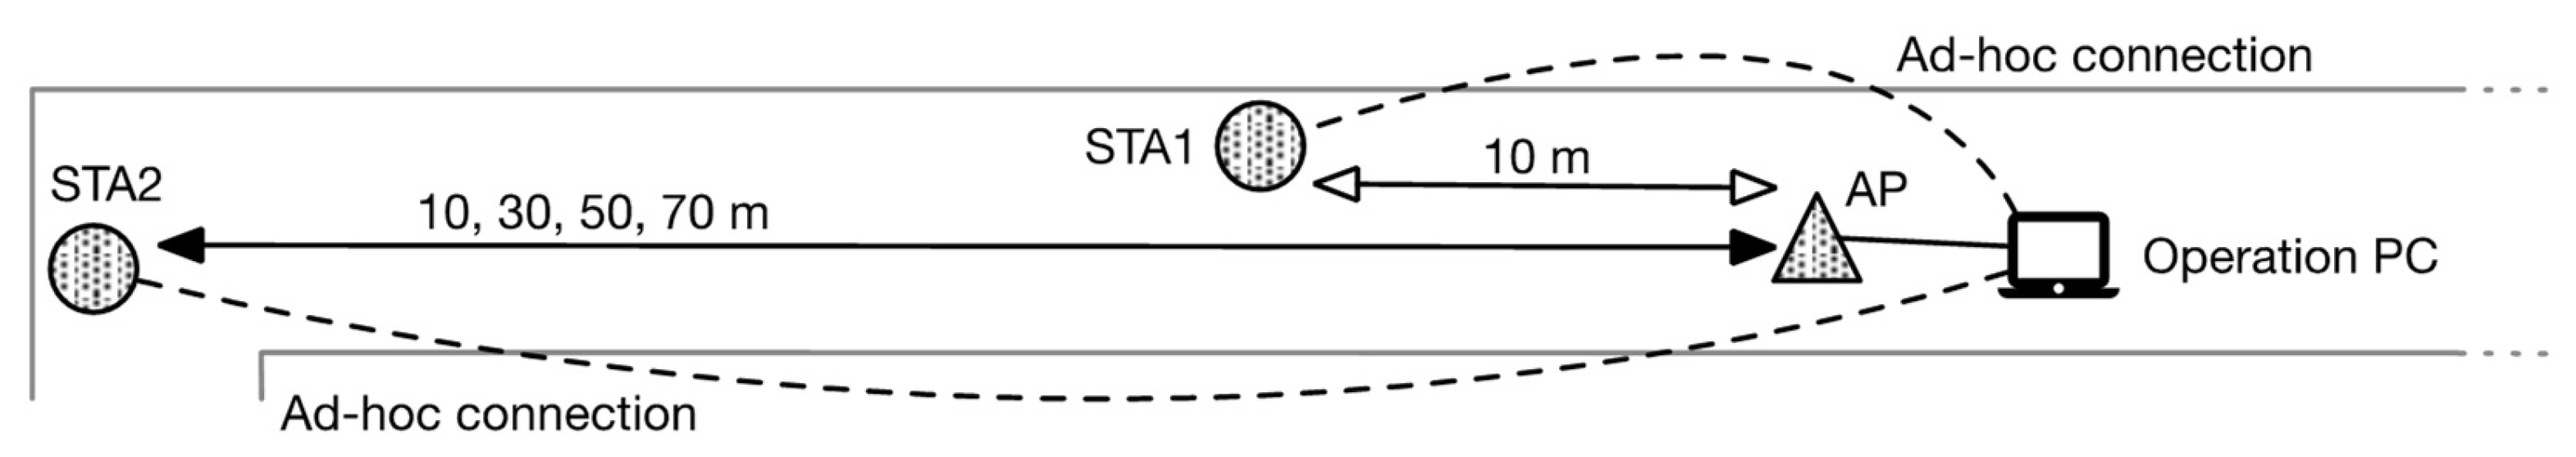
Figure 13 illustrates a measurement environment for evaluating the impact of communication quality by multiple STAs. The two STAs are located at different distances. The distance between AP and STA1 is fixed at 10 m, and between AP and STA2 it is set to 10, 30, 50, and 70 m. That is, we have the following four measurements:
Measurement 1 (M1): STA1 at 10 m and STA2 at 10 m;
Measurement 2 (M2): STA1 at 10 m and STA2 at 30 m;
Measurement 3 (M3): STA1 at 10 m and STA2 at 50 m;
Measurement 4 (M4): STA1 at 10 m and STA2 at 70 m.
Figure 13.
Measurement environment for two STAs.
Figure 13.
Measurement environment for two STAs.
As in the previous experiments, the operation PC is connected to the AP and the two STAs via a wired line and ad hoc connections.
4.4.2. Results of IP Network Layer in Scenario 3
Figure 14 shows the throughputs of TCP and UDP communications. The x-axis label indicates each STA for the four measurements. “M[1–4]” indicates the measurement number. The first distance is STA1, and the second is STA2. That is, M1_10m, M2_30m, M3_50m, and M4_70m are for STA2. In TCP communication, two STAs have almost the same throughput trend, even if the distance of the STA2 increases. On the other hand, there is no consistent trend for UDP communication. Therefore, in TCP communication, an STA with poor communication affects another STA with stable communication.
Table 7 shows the retransmitted TCP packets and the connection failures in the TCP communication. Compared to the results of
Section 4.3.2, the retransmissions of the TCP packets occur at relatively close distances. The occurrence can lead to a decrease in the throughput. On the other hand, no connection failures occur in the measurements.
Figure 15 shows the jitter results for UDP communication. While the left graph shows that the jitter outliers of STA2 grow as the distance increases, there is no characteristic trend in the distribution in the right figure.
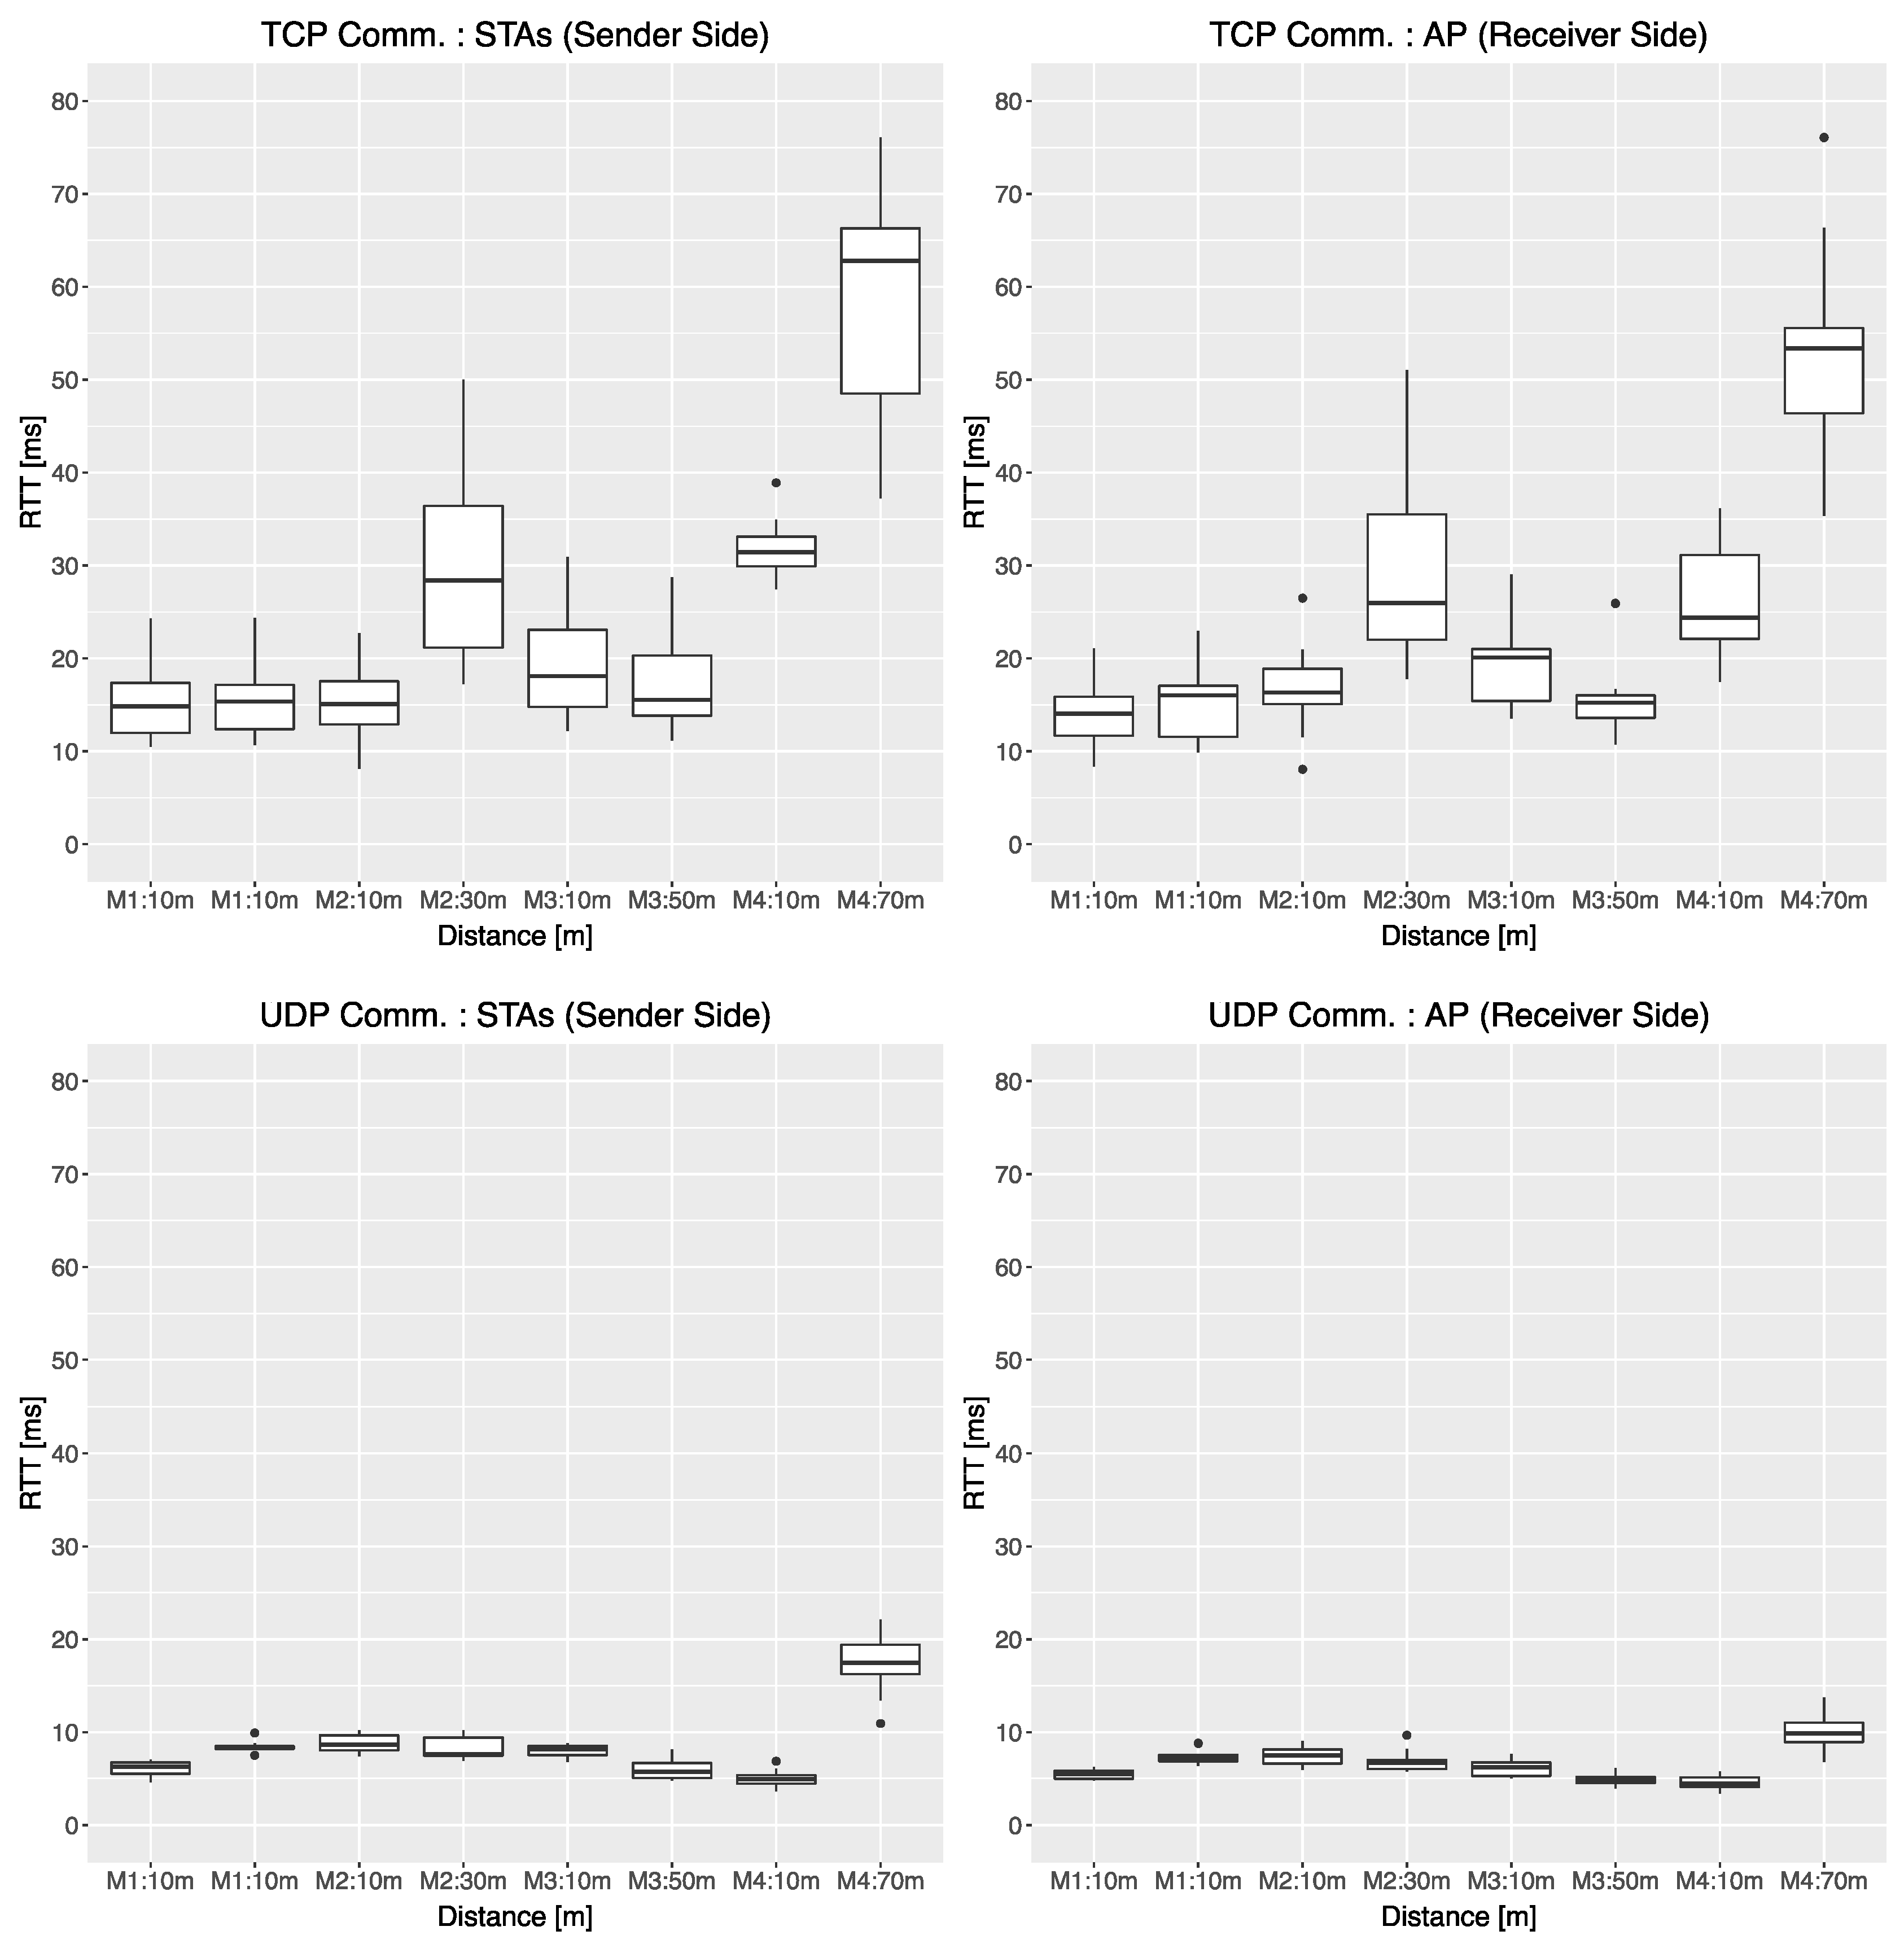
Figure 16 shows the
ping results of STA1, STA2, and the AP. Each STA sends ICMP packets to the AP, whereas the AP sends ICMP packets to each STA, i.e., the AP executes two
ping commands for the two STAs. Compared to the throughputs in
Figure 14, the RTTs increase as the throughputs decrease. There seems to be a correlation. On the other hand, for UDP communication, the RTT is relatively stable, except for the STA2 of 70 m. Note that there are no lost packets in the
ping results.
4.4.3. Results of Wireless Network Layer in Scenario 3
Figure 17 shows the RSSI of two STAs and an AP. The graphs show the same trend for both TCP and UDP communications, and as described above, it is difficult to adequately detect degradation in communication quality. Therefore, although the RSSI is sensitive to environmental changes such as obstacles, it is not sensitive to an increase in traffic, such as an increase in STAs.
Table 8 shows the invalid RSSI values in the
iw results. There were no invalid values in the experiments, but there were missing values on the STA1 side. The occurrence increases as the distance from STA2 increases.
Table 9 indicates the percentage of the Tx bitrates used at both STAs. Note that the values in bold in the table indicate the mode of the Tx bitrate at each distance. While the Tx bitrate value of STA2 decreases as the distance of STA2 increases, the Tx bitrate of 2310.0 Mb/s is used above 90% on STA1. This result indicates that using a lower bitrate affects the throughput of other STAs because the wireless medium is a shared medium.
4.5. Discussions
We showed the benefits and importance of multilayer measurements using open-source tools from the empirical results of the above three scenarios. Let us summarize the results for the three measurement scenarios.
In Scenario 1, we evaluated communication performance by the impact of antenna direction. The results showed no significant differences in communication quality for the impact of antenna direction at a close range, but its performance would depend on the hardware used. In addition, the methodology indicated that if real-time performance is required, it is necessary to check not only throughput, but also jitter and RTT.
In the results of the wireless network layer, assessing the impact of RSSI variations on the communication quality was difficult, even if AP and STA were at a short distance. On the other hand, we showed that Tx bitrate helps confirm the occurrence of communication quality degradation as a supplemental indicator. Thus, the measurement of Scenario 1 is essential for understanding the quality of communication as a reference value to evaluate the communication performance in Scenarios 2 and 3.
Scenario 2 examined the effect of communication distance as an essential evaluation for building a network. It was found that the throughput degrades significantly with increasing distance, even within a short distance of a few tens of meters. It may be reassuring if the throughput required by the application is achieved, but the throughput may already be degraded due to various factors. Consequently, the reference values obtained in Scenario 1 are helpful for the assessment. In addition, if retry or communication failure appears, a significant degradation of communication quality is likely to cause or have caused this.
The features of the wireless network layer in Scenario 2 are two types of errors. One error is that the iw result included inaccurate values of 0 in RSSI. The other is that all information about the wireless interface, including Tx bitrates, was not logged. For instance, if the errors appear, we can understand that the communication performance significantly degrades. In addition, checking the Tx bitrate used in the wireless layer is easy to understand. On the other hand, it is difficult to judge the degradation of communication quality from only RSSI.
Scenario 3 evaluated the communication quality in a multiterminal environment. The results are only an example, but we found that in TCP communications, an STA with a poor communication link affects the other STAs with a good communication link. On the other hand, in UDP communication, there was no advantage due to the distance to the AP, and the STA that was far from the AP sometimes had better communication quality. However, it is difficult to determine how much the communication quality is actually degraded from the results of the IP network layer. In addition, in the wireless network layer, it is difficult to determine the degradation only from RSSI. Thus, by checking the Tx bitrate, it is possible to assess the degree of degradation from the mode of Tx bitrate.
4.6. Future Work
This paper has shown that it is possible to evaluate the impact of IEEE802.11ad on communication quality using the tools and indicators. Since IEEE802.11ad will be widely used in addition to existing wireless LANs, developing an inexpensive evaluation software with open-source tools would be desirable.
However, we need to overcome the following challenging issues to achieve it. First of all, our premise is that non-specialists, such as end-users, must be able to use it easily.
- ✓
Integration of measurement tools: Although we can freely use them, obtaining and maintaining them may be difficult and troublesome for non-specialists. These tools must be integrated and auto-updated in a small product such as Raspberry Pi.
- ✓
Simple User Interface: Configuring the settings should be simple when executing the measurement. An easy-to-understand display and explanation are required.
- ✓
Procedure guide and explanation of results: The functions to explain what steps to take and the results of those steps in an easy-to-understand manner are required.
- ✓
Recording location information: Measuring the distance from the AP is tedious, so a system that can automatically measure and record the distance is required. For example, information from distance measurement applications could be used.
- ✓
Effective use of measurement logs: The product provides measurement logs in the same format. By collecting measurement logs from many users, it may be possible to give an overall forecast for a particular measurement without having to take measurements at many locations.
5. Conclusions
This paper proposed a multilayer measurement methodology with open-source tools, i.e., iperf3, ping, and iw, for evaluating IEEE 802.11ad communication. IEEE 802.11ad is one of the most promising wireless communications in the beyond 5G and 6G era. However, compared with existing Wi-Fi networks, various factors easily affect communication quality due to the high carrier frequency. It is necessary to measure various metrics of communication qualities to build an optimal network, and it is desirable to establish a simple and inexpensive measurement method for non-specialists, such as end-users, to use easily.
To this end, this paper employed three open-source tools: iperf3, ping, and iw. Iperf3 and ping mainly evaluate the IP layer indicators of throughput, jitter, packet retries, packet loss, and RTT. These indicators are considered relatively familiar to non-specialists because they are relevant to the communication quality of an application. However, they do not necessarily represent the quality of the wireless link, so indicators are also needed to understand the characteristics of the wireless link.
On the other hand, the RSSI and Tx bitrates of the iw results were used to investigate the quality of the wireless link. Although RSSI is a familiar metric for end-users, it is difficult to fully assess communication quality from only this metric. Thus, this paper proposed the use of Tx-bitrate as a supplemental indicator. Since the Tx-bitrate indicator shows the percentage of bitrate values used, end-users can intuitively understand the wireless link quality. Furthermore, two types of errors may be used as other supplemental indicators. The appearance of the errors is helpful for indicating that the wireless link quality is starting to deteriorate or has already deteriorated.
This paper also presented three specific measurement methods and measurement results. We consider that these measurements can provide a measurement method needed by users. The next step of this study is to develop integrated applications with them.
Author Contributions
Conceptualization, S.K., M.T., A.H. and H.Y.; data curation, S.K.; formal analysis, S.K. and M.T.; funding acquisition, A.H. and H.Y.; investigation, S.K. and M.T.; methodology, S.K., M.T., A.H. and H.Y.; project administration, A.H. and H.Y.; resources, M.T. and H.Y.; software, S.K., M.T. and A.H.; supervision, A.H. and H.Y.; validation, S.K. and M.T.; visualization, S.K.; writing—original draft, S.K.; writing—review and editing, S.K., M.T., A.H. and H.Y. All authors have read and agreed to the published version of the manuscript.
Funding
This research was supported by the Ministry of Internal Affairs and Communications in Japan (JPJ000254).
Institutional Review Board Statement
Not applicable.
Informed Consent Statement
Not applicable.
Data Availability Statement
The data used to support the findings of this study are available from the corresponding author upon request.
Acknowledgments
We would like to thank the anonymous reviewers for their valuable comments and feedback.
Conflicts of Interest
The authors declare that they have no conflict of interest.
References
- Letaief, K.B.; Chen, W.; Shi, Y.; Zhang, J.; Zhang, Y.-J.A. The Roadmap to 6G: AI Empowered Wireless Networks. IEEE Commun. Mag. 2019, 57, 84–90. [Google Scholar] [CrossRef]
- Nawaz, S.J.; Sharma, S.K.; Wyne, S.; Patwary, M.N.; Asaduzzaman, M. Quantum Machine Learning for 6G Communication Networks: State-of-the-Art and Vision for the Future. IEEE Access 2019, 7, 46317–46350. [Google Scholar] [CrossRef]
- Viswanathan, H.; Mogensen, P.E. Communications in the 6G Era. IEEE Access 2020, 8, 57063–57074. [Google Scholar] [CrossRef]
- Dang, S.; Amin, O.; Shihada, B.; Alouini, M.-S. What should 6G be? Nat. Electron. 2020, 3, 20–29. [Google Scholar] [CrossRef]
- Mezzavilla, M.; Polese, M.; Zanella, A.; Dhananjay, A.; Rangan, S.; Kessler, C.; Rappaport, T.T.; Zorzi, M. Public Safety Communications above 6 GHz: Challenges and Opportunities. IEEE Access 2017, 6, 316–329. [Google Scholar] [CrossRef]
- IEEE P802.11—TASK GROUP AD. Status of Project IEEE 802.11ad. Available online: https://www.ieee802.org/11/Reports/tgad_update.htm (accessed on 1 April 2022).
- Kashihara, S.; Tamai, M.; Hasegawa, A.; Yokoyama, H. Low-Cost Measurement Framework for IEEE 802.11ad Communication. In Computational Intelligence in Information Systems. CIIS 2021; Suhaili, W.S.H., Siau, N.Z., Omar, S., Phon-Amuaisuk, S., Eds.; Advances in Intelligent Systems and Computing; Springer: Cham, Switzerland, 2021; Volume 1321. [Google Scholar] [CrossRef]
- Chandra, K.; Prasad, R.V.; Niemegeers, I. Performance Analysis of IEEE 802.11ad MAC Protocol. IEEE Commun. Lett. 2017, 21, 1513–1516. [Google Scholar] [CrossRef]
- Wang, C.-X.; Huang, J.; Wang, H.; Gao, X.; You, X.; Hao, Y. 6G Wireless Channel Measurements and Models: Trends and Challenges. IEEE Veh. Technol. Mag. 2020, 15, 22–32. [Google Scholar] [CrossRef]
- Assasa, H.; Widmer, J. Implementation and Evaluation of a WLAN IEEE 802.11ad Model in Ns-3. In Proceedings of the Workshop on Ns-3, Seattle, WA, USA, 15–16 June 2016; pp. 57–64. [Google Scholar] [CrossRef]
- Assasa, H.; Widmer, J.; Ropitault, T.; Golmie, N. Enhancing the Ns-3 IEEE 802.11ad Model Fidelity: Beam Codebooks, Multi-Antenna Beamforming Training, and Quasi-Deterministic MmWave Channel. In Proceedings of the 2019 Workshop on Ns-3, Florence, Italy, 19–20 June 2019; pp. 33–40. [Google Scholar] [CrossRef]
- Shi, L.; Xu, S.; Liu, H.; Zhan, Z. QoS-Aware UAV Coverage path planning in 5G mmWave network. Comput. Netw. 2020, 175, 107207. [Google Scholar] [CrossRef]
- Qu, L.; Xu, G.; Zeng, Z.; Zhang, N.; Zhang, Q. UAV-Assisted RF/FSO Relay System for Space-Air-Ground Integrated Network: A Performance Analysis. IEEE Trans. Wirel. Commun. 2022, 21, 6211–6225. [Google Scholar] [CrossRef]
- Vlachos, E.; Mavrokefalidis, C.; Berberidis, K. Channel Estimation for UAV-based mmWave Massive MIMO Communications with Beam Squint. In Proceedings of the 2022 30th European Signal Processing Conference (EUSIPCO), Belgrade, Serbia, 29 August–2 September 2022; pp. 1696–1700. [Google Scholar] [CrossRef]
- ns-3: Network Simulator. Available online: https://www.nsnam.org (accessed on 4 April 2022).
- Wang, C.-X.; Bian, J.; Sun, J.; Zhang, W.; Zhang, M. A Survey of 5G Channel Measurements and Models. IEEE Commun. Surv. Tutor. 2018, 20, 3142–3168. [Google Scholar] [CrossRef]
- Kacou, M.; Guillet, V.; El Zein, G.; Zaharia, G. Coverage and Throughput Analysis at 60 GHz for Indoor WLAN with Indirect Paths. In Proceedings of the 2018 IEEE 29th Annual International Symposium on Personal, Indoor and Mobile Radio Communications (PIMRC), Bologna, Italy, 9–12 September 2018; pp. 1–5. [Google Scholar] [CrossRef]
- Hur, S.; Yu, H.; Park, J.; Roh, W.; Bas, C.U.; Wang, R.; Molisch, A.F. Feasibility of Mobility for Millimeter-Wave Systems Based on Channel Measurements. IEEE Commun. Mag. 2018, 56, 56–63. [Google Scholar] [CrossRef]
- Zhang, D.; Santhalingam, P.S.; Pathak, P.; Zheng, Z. Characterizing Interference Mitigation Techniques in Dense 60 GHz mmWave WLANs. In Proceedings of the 2019 28th International Conference on Computer Communication and Networks (ICCCN), Valencia, Spain, 29 July–1 August 2019; pp. 1–9. [Google Scholar] [CrossRef]
- Dahhani, M.; Jakllari, G.; Beylot, A.-L. Association and Reliability in 802.11ad Networks: An Experimental Study. In Proceedings of the 2019 IEEE 44th Conference on Local Computer Networks (LCN), Osnabrueck, Germany, 14–17 October 2019; pp. 398–405. [Google Scholar] [CrossRef]
- Aggarwal, S.; Thirumurugan, A.; Koutsonikolas, D. A first look at 802.11ad performance on a smartphone. In Proceedings of the 3rd ACM Workshop on Millimeter-Wave Networks and Sensing Systems (mmNets’19), Los Cabos, Mexico, 25 October 2019; Association for Computing Machinery: New York, NY, USA, 2019; pp. 13–18. [Google Scholar] [CrossRef]
- Nguyen, K.; Kibria, M.G.; Ishizu, K.; Kojima, F. Performance Evaluation of IEEE 802.11ad in Evolving Wi-Fi Networks. Wirel. Commun. Mob. Comput. 2019, 2019, 4089365. [Google Scholar] [CrossRef]
- Nguyen, K.; Sekiya, H. TCP behavior on multi-gigabit IEEE 802.11ad link. In Proceedings of the 2020 International Conference on Green and Human Information Technology (ICGHIT), Hanoi, Vietnam, 5–7 February 2020; pp. 58–61. [Google Scholar] [CrossRef]
- Ren, Y.; Yang, W.; Zhou, X.; Chen, H.; Liu, B. A survey on TCP over mmWave. Comput. Commun. 2021, 171, 80–88. [Google Scholar] [CrossRef]
- ESnet/Lawrence Berkeley National Laboratory. iPerf—The Ultimate Speed Test Tool for TCP, UDP and SCTP. Available online: https://iperf.fr/ (accessed on 6 May 2022).
- Saha, S.K.; Aggarwal, S.; Assasa, H.; Loch, A.; Prakash, N.M.; Shyamsunder, R.; Steinmetzer, D.; Koutsonikolas, D.; Widmer, J.; Hollick, M. Performance and Pitfalls of 60 GHz WLANs Based on Consumer-Grade Hardware. IEEE Trans. Mob. Comput. 2020, 20, 1543–1557. [Google Scholar] [CrossRef]
- Hirata, T.; Murase, T. Throughput Measurement of IEEE 802.11ad with Various Interferences on Vehicles. In Proceedings of the 2020 IEEE International Conference on Consumer Electronics—Taiwan (ICCE-Taiwan), Taoyuan, Taiwan, 28–30 September 2020; pp. 1–2. [Google Scholar] [CrossRef]
- Nino, R.; Nishio, T.; Murase, T. IEEE 802.11ad Communication Quality Measurement in In-vehicle Wireless Communication with Real Machines. In Proceedings of the 2020 11th IEEE Annual Ubiquitous Computing, Electronics & Mobile Communication Conference (UEMCON), New York, NY, USA, 28–31 October 2020; pp. 700–706. [Google Scholar] [CrossRef]
- Nino, R.; Nishio, T.; Murase, T. Throughput Measurement for IEEE 802.11ad with Various Obstacles and Reflectors by Real Machines. In Proceedings of the 2021 IEEE 3rd Global Conference on Life Sciences and Technologies (LifeTech), Nara, Japan, 9–11 March 2021; pp. 401–402. [Google Scholar] [CrossRef]
- Bielsa, G.; Mezzavilla, M.; Widmer, J.; Rangan, S. Performance Assessment of Off-The-Shelf Mm Wave Radios for Drone Communications. In Proceedings of the 2019 IEEE 20th International Symposium on “A World of Wireless, Mobile and Multimedia Networks” (WoWMoM), Washington, DC, USA, 10–12 June 2019; pp. 1–3. [Google Scholar] [CrossRef]
- Saha, S.K.; Vira, V.V.; Garg, A.; Koutsonikolas, D. A feasibility study of 60 GHz indoor WLANs. In Proceedings of the 2016 25th International Conference on Computer Communication and Networks (ICCCN), Waikoloa, HI, USA, 1–4 August 2016; pp. 1–9. [Google Scholar] [CrossRef]
- Klingler, F.; Hauptmeier, F.; Sommer, C.; Dressler, F. Poster Abstract: An Open Source Approach to Field Testing of WLAN up to IEEE 802.11ad at 60 GHz Using Commodity Hardware. In Proceedings of the IEEE INFOCOM 2020—IEEE Conference on Computer Communications Workshops (INFOCOM WKSHPS), Toronto, ON, Canada, 6–9 July 2020; pp. 1312–1313. [Google Scholar] [CrossRef]
- Zhang, X.; Ramanathan, P. WiMi: A 60 GHz Software Radio Platform for Experimental Research in Millimeter-Wave. Available online: http://xyzhang.ucsd.edu/wimi/ (accessed on 5 April 2022).
- Kim, K.-H.; Nam, H.; Schulzrinne, H. WiSlow: A Wi-Fi network performance troubleshooting tool for end users. In Proceedings of the IEEE INFOCOM 2014—IEEE Conference on Computer Communications, Toronto, ON, Canada, 27 April 2014–2 May 2014; pp. 862–870. [Google Scholar] [CrossRef]
- Thakare, J.; Vatti, R.; Dasmohapatra, R.; Gund, A. Wi-Fi Strength Measurement and its Analysis. In Proceedings of the 2017 International Conference on Current Trends in Computer, Electrical, Electronics and Communication (CTCEEC), Mysore, India, 8–9 September 2017; pp. 1159–1163. [Google Scholar] [CrossRef]
- Vlavianos, A.; Law, L.K.; Broustis, I.; Krishnamurthy, S.V.; Faloutsos, M. Assessing link quality in IEEE 802.11 Wireless Networks: Which is the right metric? In Proceedings of the 2008 IEEE 19th International Symposium on Personal, Indoor and Mobile Radio Communications, Cannes, France, 15–18 September 2008; pp. 1–6. [Google Scholar] [CrossRef]
- Malinen, J. Hostapd: IEEE 802.11 AP, IEEE 802.1X/WPA/WPA2/EAP/RADIUS Authenticator. Available online: https://w1.fi/hostapd/ (accessed on 6 May 2022).
- Intel. Intel® NUC Kit NUC7i7DNHE. Available online: https://www.intel.com/content/www/us/en/products/sku/130393/intel-nuc-kit-nuc7i7dnhe/specifications.html (accessed on 6 May 2022).
- Silex Technology America Inc. 60GHz WiFi (WiGig) for the Rest of Us—SX-PCEAD 802.11ad Module from Silex Brings 4.6Gbps Speeds to New Markets and Applications. Available online: https://www.silextechnology.com/unwired/60ghz-wifi-wigig-for-the-rest-of-us-sx-pcead-802.11ad-module-from-silex-brings-4.6gbps-speeds-to-new-markets-and-applications (accessed on 6 May 2022).
Figure 1.
Measurement overview.
Figure 1.
Measurement overview.
Figure 2.
Measurement environment for antenna direction scenario.
Figure 2.
Measurement environment for antenna direction scenario.
Figure 3.
Throughputs of TCP and UDP communications (Scenario 1).
Figure 3.
Throughputs of TCP and UDP communications (Scenario 1).
Figure 4.
Jitter of UDP communication on receiver side (Scenario 1).
Figure 4.
Jitter of UDP communication on receiver side (Scenario 1).
Figure 5.
RTTs for TCP and UDP communications on both sides (Scenario 1).
Figure 5.
RTTs for TCP and UDP communications on both sides (Scenario 1).
Figure 6.
RSSI results for TCP and UDP communications (Scenario 1).
Figure 6.
RSSI results for TCP and UDP communications (Scenario 1).
Figure 7.
Measurement environment for evaluating communication distance.
Figure 7.
Measurement environment for evaluating communication distance.
Figure 8.
Throughputs of TCP and UDP communications (Scenario 2).
Figure 8.
Throughputs of TCP and UDP communications (Scenario 2).
Figure 9.
Jitter of UDP communication on receiver side (Scenario 2).
Figure 9.
Jitter of UDP communication on receiver side (Scenario 2).
Figure 10.
RTTs of TCP and UDP communications on both sides (Scenario 2).
Figure 10.
RTTs of TCP and UDP communications on both sides (Scenario 2).
Figure 11.
Packet loss of TCP and UDP communications on both sides (Scenario 2).
Figure 11.
Packet loss of TCP and UDP communications on both sides (Scenario 2).
Figure 12.
RSSI of both sides for TCP and UDP communications (Scenario 2).
Figure 12.
RSSI of both sides for TCP and UDP communications (Scenario 2).
Figure 14.
Throughputs of TCP and UDP communications (Scenario 3).
Figure 14.
Throughputs of TCP and UDP communications (Scenario 3).
Figure 15.
Jitter of UDP Communication (Scenario 3).
Figure 15.
Jitter of UDP Communication (Scenario 3).
Figure 16.
RTTs of TCP and UDP communications on two STAs and one AP (Scenario 3).
Figure 16.
RTTs of TCP and UDP communications on two STAs and one AP (Scenario 3).
Figure 17.
RSSI of two STAs and one AP for TCP and UDP communications (Scenario 3).
Figure 17.
RSSI of two STAs and one AP for TCP and UDP communications (Scenario 3).
Table 1.
Measurement tools and performance indicators for existing work on IEEE 802.11ad.
Table 1.
Measurement tools and performance indicators for existing work on IEEE 802.11ad.
| References | [20] | [21] | [22] | [23] | [24] | [26] | [27,28,29] | [30] | [31] |
|---|
| Target Protocol | TCP | TCP | TCP
UDP | TCP | TCP | TCP | UDP | TCP | TCP
UDP |
|---|
| Measurement tools | iperf3 | Thrpt | Thrpt | ThrptRTT | Thrpt
RTT | Thrpt
| | Thrpt | Thrpt | Thrpt |
| OpenWRT | MCS
SQI
SNR
etc. | | | | | | | | |
| Sys Info. | | Voltage
PwC | | | | | | | |
| Wi-Fi driver | | | RSSI | | | MCS SQI
etc. | | | RSSI |
| Other sys. | | | | | | | | | PwC |
Table 2.
Measurement tool and performance indicators employed for multilayer measurement.
Table 2.
Measurement tool and performance indicators employed for multilayer measurement.
| Measurement Tools | Indicators | Sender | Receiver |
|---|
| TCP | UDP | TCP | UDP |
|---|
| iperf3 | Throughput | ✔ | ✔ | ✔ | ✔ |
| Retry | ✔ | | | |
| Jitter | | | | ✔ |
| ping | RTT | ✔ | ✔ | ✔ | ✔ |
| Packet loss | ✔ | ✔ | ✔ | ✔ |
| iw | RSSI | ✔ | ✔ | ✔ | ✔ |
| Tx bitrate | ✔ | ✔ | ✔ | ✔ |
Table 3.
Tx bitrates on sender side (Scenario 1).
Table 3.
Tx bitrates on sender side (Scenario 1).
| Tx Bitrates On TCP Sender Side |
|---|
| Mb/s | A/A | A/B | A/C | A/D | B/B | C/C | D/D |
|---|
| 27.5 | 0 | 0 | 0 | 0 | 0 | 0 | 0 |
| 385.0 | 0 | 0.08 | 0.42 | 0.42 | 0.17 | 0 | 0 |
| 770.0 | 0 | 0 | 0 | 0.33 | 0.25 | 0 | 0 |
| 962.5 | 0.42 | 0.33 | 0.25 | 1.17 | 0.50 | 0 | 0.50 |
| 1155.0 | 0 | 0 | 0.25 | 1.58 | 0.83 | 0 | 0 |
| 1540.0 | 0.75 | 0 | 0.50 | 1.92 | 1.83 | 0 | 0 |
| 1925.0 | 2.75 | 2.92 | 7.08 | 8.50 | 7.08 | 4.42 | 2.75 |
| 2310.0 | 96.08 | 96.67 | 91.50 | 86.08 | 89.33 | 95.58 | 96.75 |
| Tx Bitrates on UDP Sender Side |
| Mb/s | A/A | A/B | A/C | A/D | B/B | C/C | D/D |
| 27.5 | 0 | 0.17 | 0.08 | 0.08 | 0.08 | 0 | 0.25 |
| 385.0 | 0 | 0 | 0 | 0 | 0 | 0 | 0 |
| 770.0 | 0 | 0 | 0 | 0 | 0 | 0 | 0 |
| 962.5 | 0 | 0 | 0 | 0 | 0 | 0 | 0 |
| 1155.0 | 0 | 0 | 0 | 0 | 0 | 0 | 0 |
| 1540.0 | 0 | 0 | 0 | 0 | 0 | 0 | 0 |
| 1925.0 | 0 | 0 | 0 | 0 | 0 | 0 | 0 |
| 2310.0 | 100 | 99.83 | 99.92 | 99.92 | 99.92 | 100 | 99.75 |
Table 4.
The average number of retransmitted TCP packets and connection failures (Scenario 2).
Table 4.
The average number of retransmitted TCP packets and connection failures (Scenario 2).
| Dist. (m) | 10 | 20 | 30 | 40 | 50 | 60 | 65 | 70 | 75 | 80 | 85 | 90 | 95 | 100 |
|---|
| Retry | 0 | 0 | 0 | 0 | 0 | 0 | 0.2 | 4.4 | 0.2 | 0.3 | 0 | 0.1 | 67.9 | 17 |
| Failure | 0 | 0 | 0 | 0 | 0 | 0 | 0 | 0 | 0 | 0 | 0 | 0 | 0.3 | 0.4 |
Table 5.
Invalid RSSI values observed with the iw tool (Scenario 2).
Table 5.
Invalid RSSI values observed with the iw tool (Scenario 2).
| Distance (m) | 10 | 20 | 30 | 40 | 50 | 60 | 65 | 70 | 75 | 80 | 85 | 90 | 95 | 100 |
|---|
| TCP sender | Invalid | 0 | 0 | 0 | 1.4 | 0 | 0 | 1.6 | 1 | 0 | 0 | 0 | 0.1 | 4.9 | 1.8 |
| Missing | 0 | 0 | 0 | 0 | 0 | 0 | 1.2 | 0 | 0 | 0 | 0 | 0 | 34.9 | 40.5 |
| TCP receiver | Invalid | 0 | 0 | 0.2 | 0.7 | 0 | 0 | 1.8 | 0 | 0 | 0.1 | 0.2 | 0.2 | 5.4 | 2.8 |
| Missing | 0 | 0 | 0 | 0 | 0 | 0 | 1.2 | 0 | 0 | 0 | 0 | 0 | 34.5 | 40.4 |
| UDP sender | Invalid | 0 | 0 | 0 | 0 | 0 | 0.2 | 14 | 0.3 | 0.6 | 0 | 0 | 2.9 | 6.8 | 0.1 |
| Missing | 0 | 0 | 0 | 0 | 0 | 0 | 3 | 0 | 0 | 0 | 12 | 1 | 589 | 968 |
| UDP receiver | Invalid | 0 | 0 | 0 | 0 | 0.2 | 0.4 | 7.8 | 0.4 | 1 | 0.1 | 0 | 7.9 | 4.1 | 0.8 |
| Missing | 0 | 0 | 0 | 0 | 0 | 0 | 1.1 | 0 | 0 | 0 | 1.3 | 0.6 | 57.4 | 96.5 |
Table 6.
Tx bitrates on sender side (Scenario 2).
Table 6.
Tx bitrates on sender side (Scenario 2).
| Tx Bitrates on TCP Sender Side |
|---|
| Mb/s | 10 m | 20 m | 30 m | 40 m | 50 m | 60 m | 65 m |
| N/A | 0 | 0 | 0 | 0 | 0 | 0 | 1.00 |
| 27.5 | 0 | 0 | 0.08 | 0.33 | 0.08 | 0.08 | 2.50 |
| 385.0 | 0 | 0 | 0.16 | 0.33 | 1.83 | 0.33 | 1.41 |
| 770.0 | 0 | 0 | 0.83 | 0.91 | 12.91 | 5.41 | 5.50 |
| 962.5 | 0 | 1.00 | 3.58 | 3.41 | 47.50 | 8.50 | 9.66 |
| 1155.0 | 0 | 1.83 | 14.41 | 93.91 | 34.58 | 85.50 | 71.16 |
| 1540.0 | 0 | 19.16 | 73.50 | 1.08 | 2.83 | 0.16 | 8.75 |
| 1925.0 | 4.08 | 70.58 | 7.41 | 0 | 0.25 | 0 | 0 |
| 2310.0 | 95.91 | 7.41 | 0 | 0 | 0 | 0 | 0 |
| Mb/s | 70 m | 75 m | 80 m | 85 m | 90 m | 95 m | 100 m |
| N/A | 0 | 0 | 0 | 0 | 0 | 29.08 | 33.75 |
| 27.5 | 10.33 | 4.25 | 6.00 | 0.16 | 2.50 | 63.08 | 60.50 |
| 385.0 | 19.83 | 18.58 | 30.41 | 7.00 | 11.58 | 7.25 | 5.66 |
| 770.0 | 43.00 | 75.75 | 62.58 | 87.16 | 36.66 | 0.58 | 0.08 |
| 962.5 | 26.83 | 1.41 | 0.91 | 5.66 | 47.08 | 0 | 0 |
| 1155.0 | 0 | 0 | 0.08 | 0 | 2.16 | 0 | 0 |
| 1540.0 | 0 | 0 | 0 | 0 | 0 | 0 | 0 |
| 1925.0 | 0 | 0 | 0 | 0 | 0 | 0 | 0 |
| 2310.0 | 0 | 0 | 0 | 0 | 0 | 0 | 0 |
| Tx Bitrates on UDP Sender Side |
| Mb/s | 10 m | 20 m | 30 m | 40 m | 50 m | 60 m | 65 m |
| N/A | 0 | 0 | 0 | 0 | 0 | 0 | 0.25 |
| 27.5 | 0 | 0 | 0.08 | 0.16 | 0 | 1.00 | 1.91 |
| 385.0 | 0 | 0 | 0.33 | 0.33 | 0.83 | 4.50 | 4.33 |
| 770.0 | 0 | 0 | 1.50 | 0.91 | 10.33 | 8.91 | 9.66 |
| 962.5 | 0 | 0.75 | 1.58 | 1.91 | 40.91 | 15.58 | 15.75 |
| 1155.0 | 0.16 | 0.33 | 16.50 | 96.66 | 46.91 | 70.00 | 65.16 |
| 1540.0 | 0.50 | 18.25 | 79.16 | 0 | 1.00 | 0 | 2.91 |
| 1925.0 | 7.83 | 75.16 | 0.83 | 0 | 0 | 0 | 0 |
| 2310.0 | 91.50 | 5.50 | 0 | 0 | 0 | 0 | 0 |
| Mb/s | 70 m | 75 m | 80 m | 85 m | 90 m | 95 m | 100 m |
| N/A | 0 | 0 | 0 | 1.00 | 0.08 | 49.08 | 80.66 |
| 27.5 | 6.66 | 4.00 | 2.41 | 0.66 | 1.25 | 50.33 | 18.83 |
| 385.0 | 29.83 | 72.33 | 51.25 | 10.00 | 13.75 | 0.58 | 0.50 |
| 770.0 | 59.83 | 23.50 | 45.91 | 82.00 | 71.08 | 0 | 0 |
| 962.5 | 3.66 | 0.16 | 0.33 | 6.08 | 13.83 | 0 | 0 |
| 1155.0 | 0 | 0 | 0.08 | 0.25 | 0 | 0 | 0 |
| 1540.0 | 0 | 0 | 0 | 0 | 0 | 0 | 0 |
| 1925.0 | 0 | 0 | 0 | 0 | 0 | 0 | 0 |
| 2310.0 | 0 | 0 | 0 | 0 | 0 | 0 | 0 |
Table 7.
The average number of retransmitted TCP packets and connection failures (Scenario 3).
Table 7.
The average number of retransmitted TCP packets and connection failures (Scenario 3).
| | Measurement 1 | Measurement 2 | Measurement 3 | Measurement 4 |
|---|
| Distance (m) | STA1
10 m | STA2
10 m | STA1
10 m | STA2
30 m | STA1
10 m | STA2
50 m | STA1
10 m | STA2
70 m |
|---|
| Retry | 7.1 | 8.6 | 6 | 5.3 | 9.6 | 7.6 | 24.4 | 18.9 |
| Failure | 0 | 0 | 0 | 0 | 0 | 0 | 0 | 0 |
Table 8.
Invalid RSSI values observed with the iw tool (Scenario 3).
Table 8.
Invalid RSSI values observed with the iw tool (Scenario 3).
| | | TCP Communication | UDP Communication |
|---|
| STA1 | STA2 | AP
(STA1) | AP
(STA2) | STA1 | STA2 | AP
(STA1) | AP
(STA2) |
|---|
M1
STA2 = 10 m | Invalid | 0 | 0 | 0 | 0 | 0 | 0 | 0 | 0 |
| Missing | 12 | 1 | 12 | 0 | 2 | 0 | 0 | 0 |
M2
STA2 = 30 m | Invalid | 0 | 0 | 0 | 0 | 0 | 0 | 0 | 0 |
| Missing | 5 | 2 | 2 | 9 | 22 | 0 | 0 | 0 |
| M3 STA2 = 50 m | Invalid | 0 | 0 | 0 | 0 | 0 | 0 | 0 | 0 |
| Missing | 22 | 1 | 2 | 41 | 67 | 6 | 3 | 2 |
M4
STA2 = 70 m | Invalid | 0 | 0 | 0 | 0 | 0 | 0 | 0 | 0 |
| Missing | 45 | 15 | 3 | 87 | 166 | 128 | 2 | 62 |
Table 9.
Tx bitrates detected at STA1 and STA2 (Scenario 3).
Table 9.
Tx bitrates detected at STA1 and STA2 (Scenario 3).
| TCP Communications |
|---|
| Mb/s | STA1
10 m | STA2
10 m | STA1
10 m | STA2
30 m | STA1
10 m | STA2
50 m | STA1
10 m | STA2
70 m |
|---|
| N/A | 0 | 0 | 0 | 0 | 0 | 0 | 0 | 0 |
| 27.5 | 1.00 | 0.16 | 0.41 | 1.83 | 1.83 | 5.58 | 3.75 | 13.83 |
| 385.0 | 0 | 0 | 0 | 0.08 | 0 | 1.00 | 0 | 3.50 |
| 770.0 | 0.16 | 0 | 0 | 0.83 | 0.08 | 0.58 | 0.08 | 25.66 |
| 962.5 | 0.08 | 0 | 0 | 0.50 | 0.16 | 0.91 | 0.08 | 54.83 |
| 1155.0 | 0.08 | 0 | 0 | 0.83 | 0.08 | 5.25 | 0 | 2.16 |
| 1540.0 | 4.16 | 1.16 | 0 | 7.41 | 0.33 | 69.66 | 0.08 | 0 |
| 1925.0 | 1.83 | 21.00 | 1.16 | 25.00 | 5.25 | 16.83 | 1.83 | 0 |
| 2310.0 | 92.66 | 77.66 | 98.41 | 63.50 | 92.25 | 0.16 | 94.16 | 0 |
| UDP Communications |
| Mb/s | STA1
10 m | STA2
10 m | STA1
10 m | STA2
30 m | STA1
10 m | STA2
50 m | STA1
10 m | STA2
70 m |
| N/A | 0 | 0 | 0 | 0 | 0 | 0 | 0 | 0 |
| 27.5 | 0.08 | 0 | 0.16 | 0 | 0.08 | 0.50 | 1.25 | 10.66 |
| 385.0 | 0 | 0 | 0 | 0.16 | 0 | 0.16 | 0 | 5.25 |
| 770.0 | 0 | 0 | 0 | 0 | 0 | 0.50 | 0 | 45.16 |
| 962.5 | 0 | 0 | 0.25 | 0.33 | 0 | 1.41 | 0 | 38.58 |
| 1155.0 | 0.16 | 0.25 | 0.16 | 1.33 | 0 | 15.91 | 0 | 0.33 |
| 1540.0 | 0.50 | 1.50 | 0.50 | 19.16 | 0.91 | 81.50 | 0.66 | 0 |
| 1925.0 | 1.50 | 3.50 | 0 | 70.33 | 7.41 | 0 | 2.33 | 0 |
| 2310.0 | 97.75 | 94.75 | 98.91 | 8.66 | 91.58 | 0 | 95.75 | 0 |
| Disclaimer/Publisher’s Note: The statements, opinions and data contained in all publications are solely those of the individual author(s) and contributor(s) and not of MDPI and/or the editor(s). MDPI and/or the editor(s) disclaim responsibility for any injury to people or property resulting from any ideas, methods, instructions or products referred to in the content. |
© 2023 by the authors. Licensee MDPI, Basel, Switzerland. This article is an open access article distributed under the terms and conditions of the Creative Commons Attribution (CC BY) license (https://creativecommons.org/licenses/by/4.0/).


