1. Introduction
In recent years, a large number of hydraulic tunnels have been built in China. While these hydraulic tunnels help to promote social progress, they also destroy the groundwater environment. When hydraulic tunnels are being excavated, a large volume of groundwater is lost, and the groundwater levels continuously decline, causing problems such as exhaustion of surface wells and springs, groundwater leakages, and ground collapse. Groundwater leakage reduces the soil water content, with serious consequences for the ecological environment, such as decreases in, or even the disappearance of, regional vegetation [
1]. It is, therefore, very important to study how seepage fields of hydraulic tunnels evolve during construction and how groundwater levels change because of seepage around the tunnel.
Numerous researchers have studied how tunnel construction affects the groundwater environment [
2,
3,
4,
5,
6,
7,
8,
9,
10]. Underground engineering and construction disturb the groundwater environment and lead to decreases in the water resources across wide geographical areas and over considerable time periods; in some cases, the effects are irreversible and the groundwater does not recover [
11,
12,
13,
14,
15]. When precipitation events occur during the construction of a tunnel, large amounts of groundwater are discharged from natural aquifers within a certain spatial range leading to reductions in the underground water levels and local changes in the groundwater storage characteristics, such as the evolution of landing funnels and changes in groundwater seepage fields. Given that these changes might compromise groundwater supplies, algorithms of underground water inrush into such tunnels have therefore been proposed to predict how the groundwater environment would be affected by the construction of a tunnel [
16,
17]. Researchers have studied how the groundwater flow changes when rock tunnels are excavated and have found that groundwater circulation systems may be damaged by tunnel water gushing during excavation [
18,
19,
20,
21,
22]. The surface water source and some spring points may dry up during water flushing accidents in the construction phase. Studies to date, therefore, have shown that underground engineering construction can have serious effects on the groundwater environment and the supply of groundwater resources [
10,
23,
24].
During the construction of an ultra-long subway tunnel in Seoul, South Korea, in 2008, the groundwater level dropped dramatically in some parts of the project area, and a large number of underground wells dried up and were abandoned. Calculations showed that the average annual water yield reached 6.3 × 10
7 m
3, and the local groundwater environment was severely damaged [
25]. During the construction of a 7300 m tunnel on the high-speed railway line between Malaga and Cordoba in a karst area of southern Spain, there was a large water inrush with an instantaneous flow of up to 800 L/s, which resulted in serious shortages of groundwater supplies for drinking and irrigation in that area [
26]. In 2009, because of a drainage problem in the Frizenzuola Tunnel, Italy, five streams in the tunnel site were cut off and 12 springs dried up [
27]. Japanese scholars studied the groundwater levels during the construction of a tunnel in Matsumoto City, Japan. They found that a large amount of groundwater gushed into the tunnel, leading to groundwater leakages, exhaustion of springs within the scope of its influence, and decreases in the river flow in the discharge area [
28]. In 2010, the Yujiawan Reservoir dried up during the construction of the Xiyong Tunnel in Chongqing, thereby damaging the function and production ability of approximately 50 mu of farmland in Jingang Village. In March 2012, drinking water sources were depleted in Shiyuan Village, Zhongliang Town, during the construction of the Zhongliangshan Tunnel on the Lanzhou-Chongqing Railway, and more than 1300 people and 10 businesses experienced severe water shortages.
If relevant measures are not taken to control the discharge of groundwater during the construction of a tunnel, groundwater levels may decline dramatically, causing drainage of surface water within a certain range and groundwater to a certain depth. The water supplies, such as springs and municipal wells, within the range of the construction will decrease to varying degrees, with serious impacts on the lives and activities of local residents.
The Wuyue pumped storage power station in Henan Province, China, is located in the transition zone between a plain area and a mountainous area. The rivers in the study area belong to the Huaihe River system. The overall aim of this study was to reduce the impact of a tunnel construction project on the water resources and lives of residents around the construction area by gaining an accurate understanding of how groundwater resources would change during the construction period. Based on the systematic analysis of the hydrogeological characteristics and key geological structures of the area around the Wuyue pumped storage power station, a conceptual model of the hydrogeology in the area is developed. A three-dimensional unsteady seepage numerical model of groundwater that reflected the three-dimensional hydrogeological structure and unit partition of the area was established. The rate of the model convergence was studied, and then the three-dimensional unsteady seepage in the area around the Wuyue pumped storage power station was numerically simulated based on the finite element method. The seepage field of the project area under natural conditions and five possible seepage control design schemes for the tunnel construction were simulated and analyzed. From this analysis, a seepage control design scheme was identified that was approximately consistent with the anticipated water inflows during the project. This control scheme can be used as the basis for calculating and analyzing changes in the seepage and groundwater in the tailwater tunnel in a later phase of the construction.
2. Engineering Materials and Methods
2.1. Overview of the Study Area
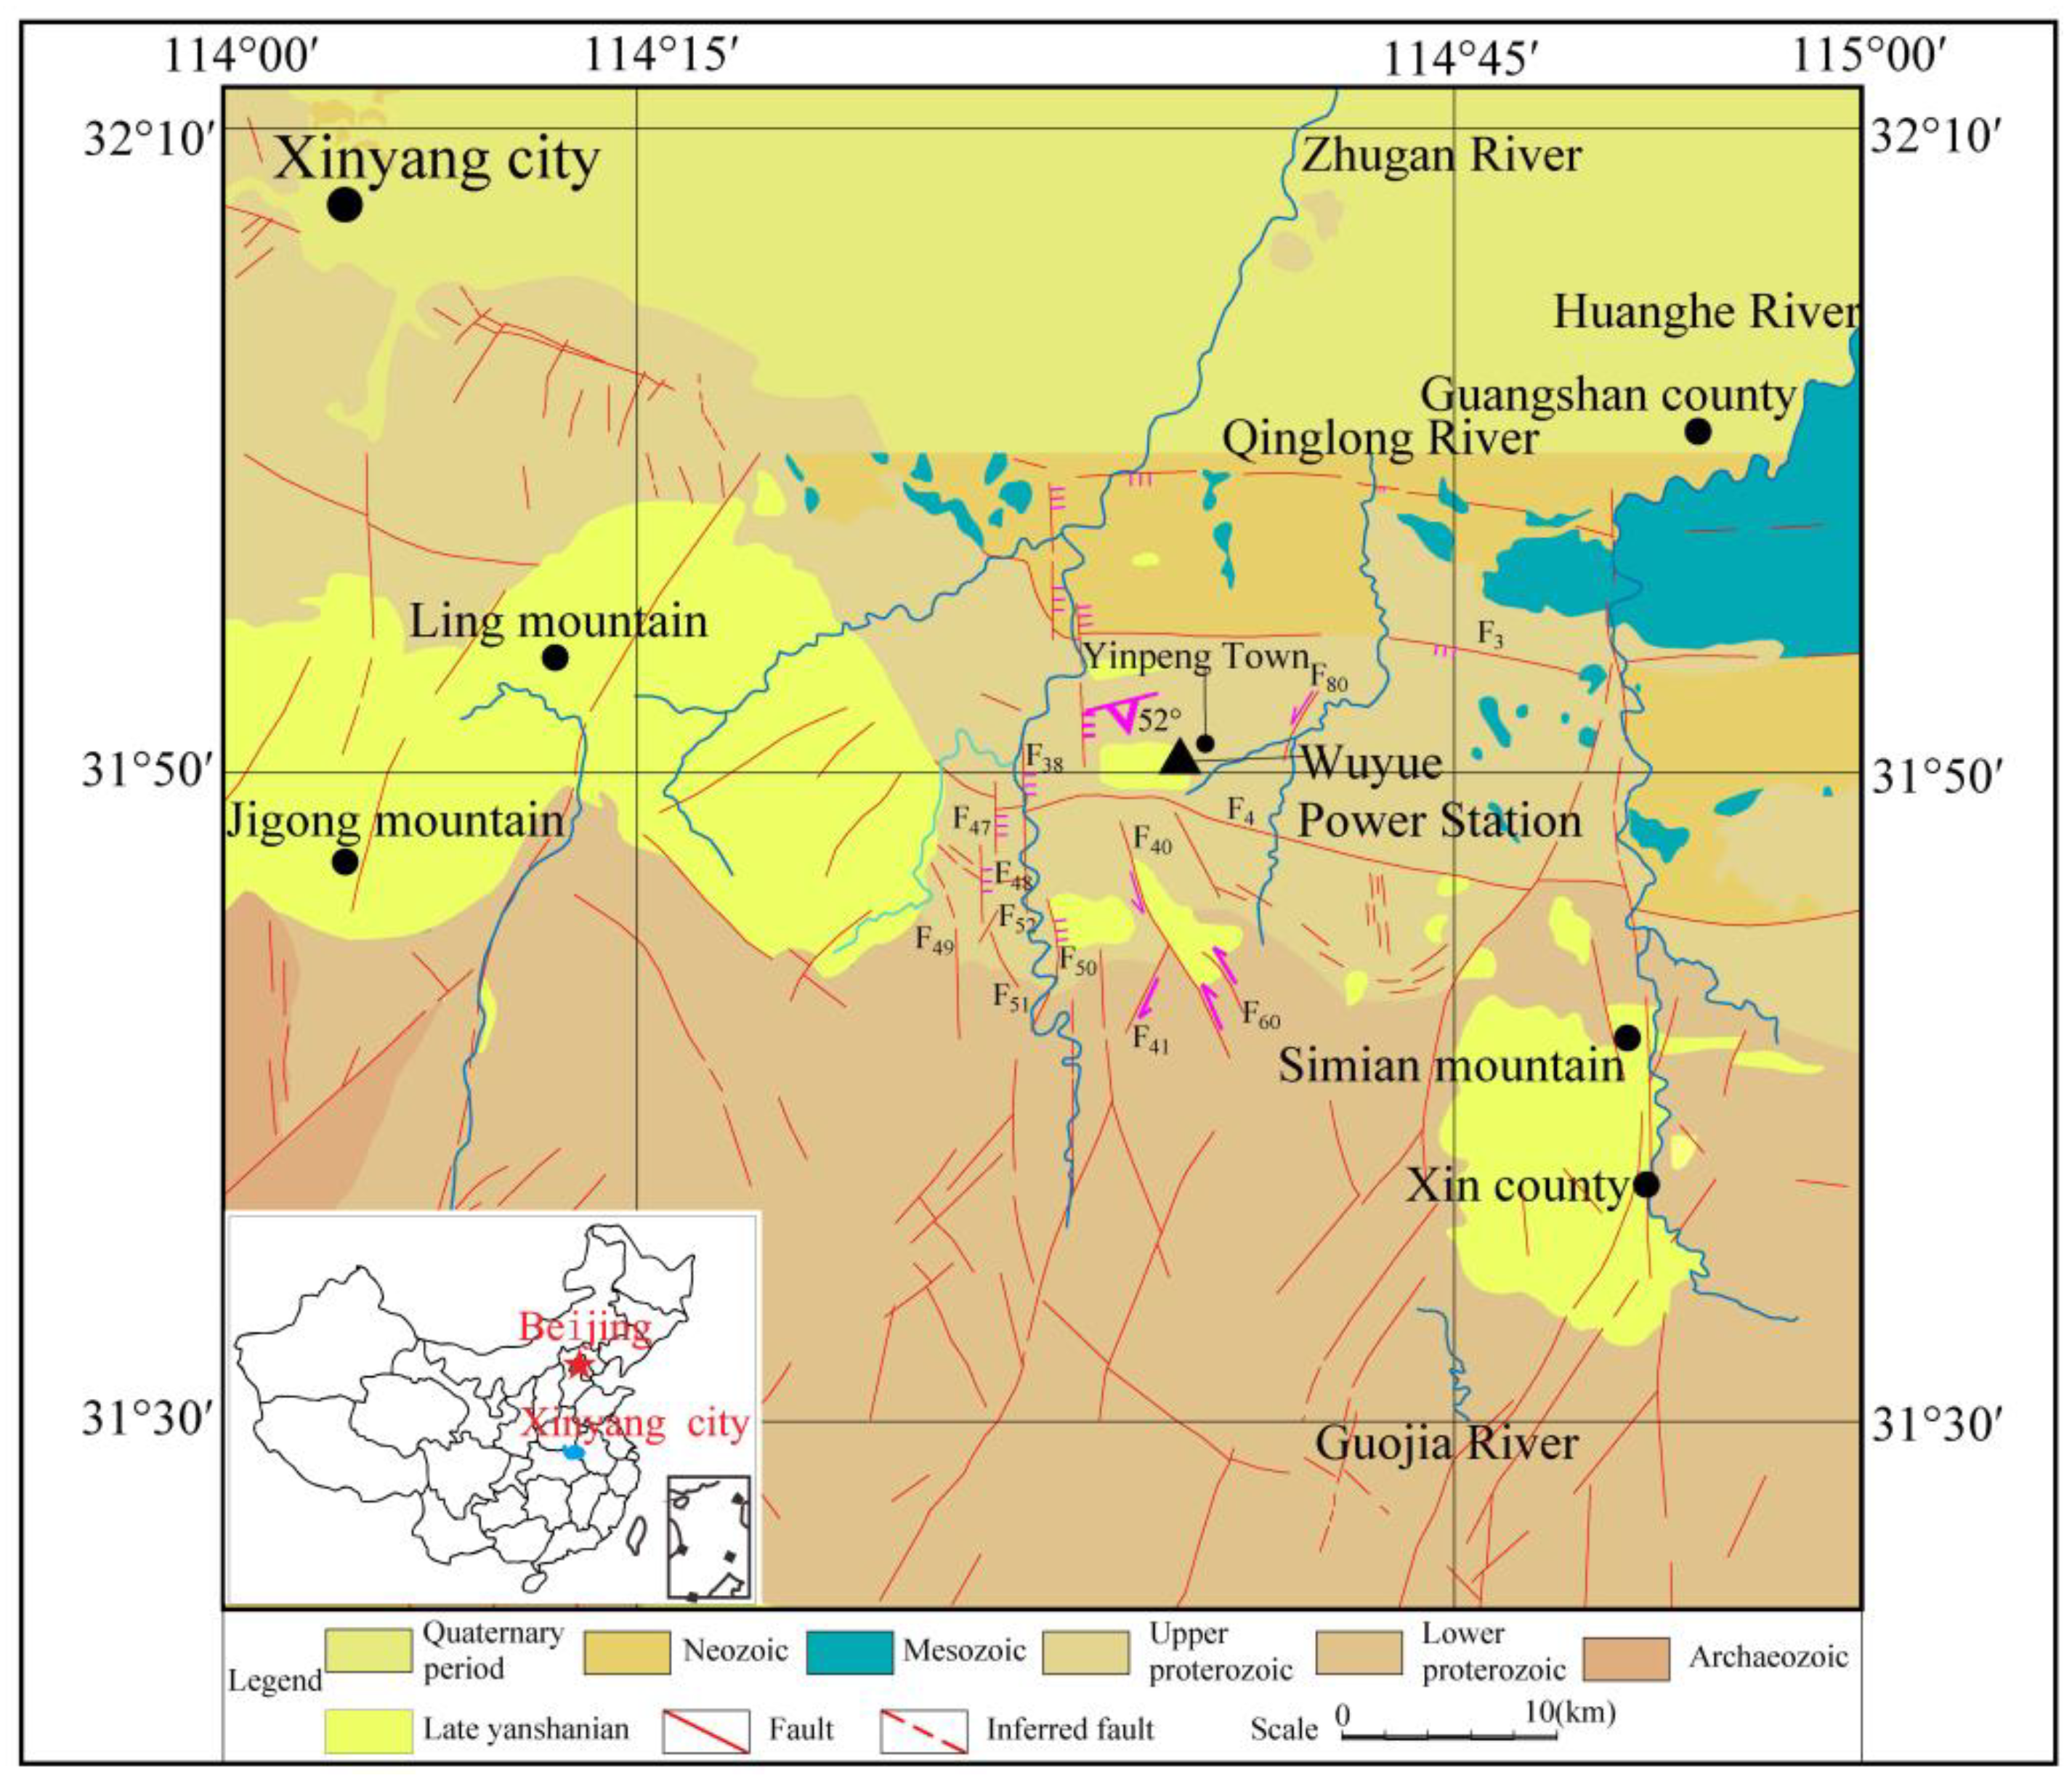
The Wuyue pumped storage power station is located in Yinpeng Township, Guangshan County, Henan Province, China. The straight-line distances between the Wuyue pumped storage power station and Zhengzhou and Xinyang are 340 and 70 km, respectively, and the Wuyue pumped storage power station is 42 km from Guangshan County by highway (
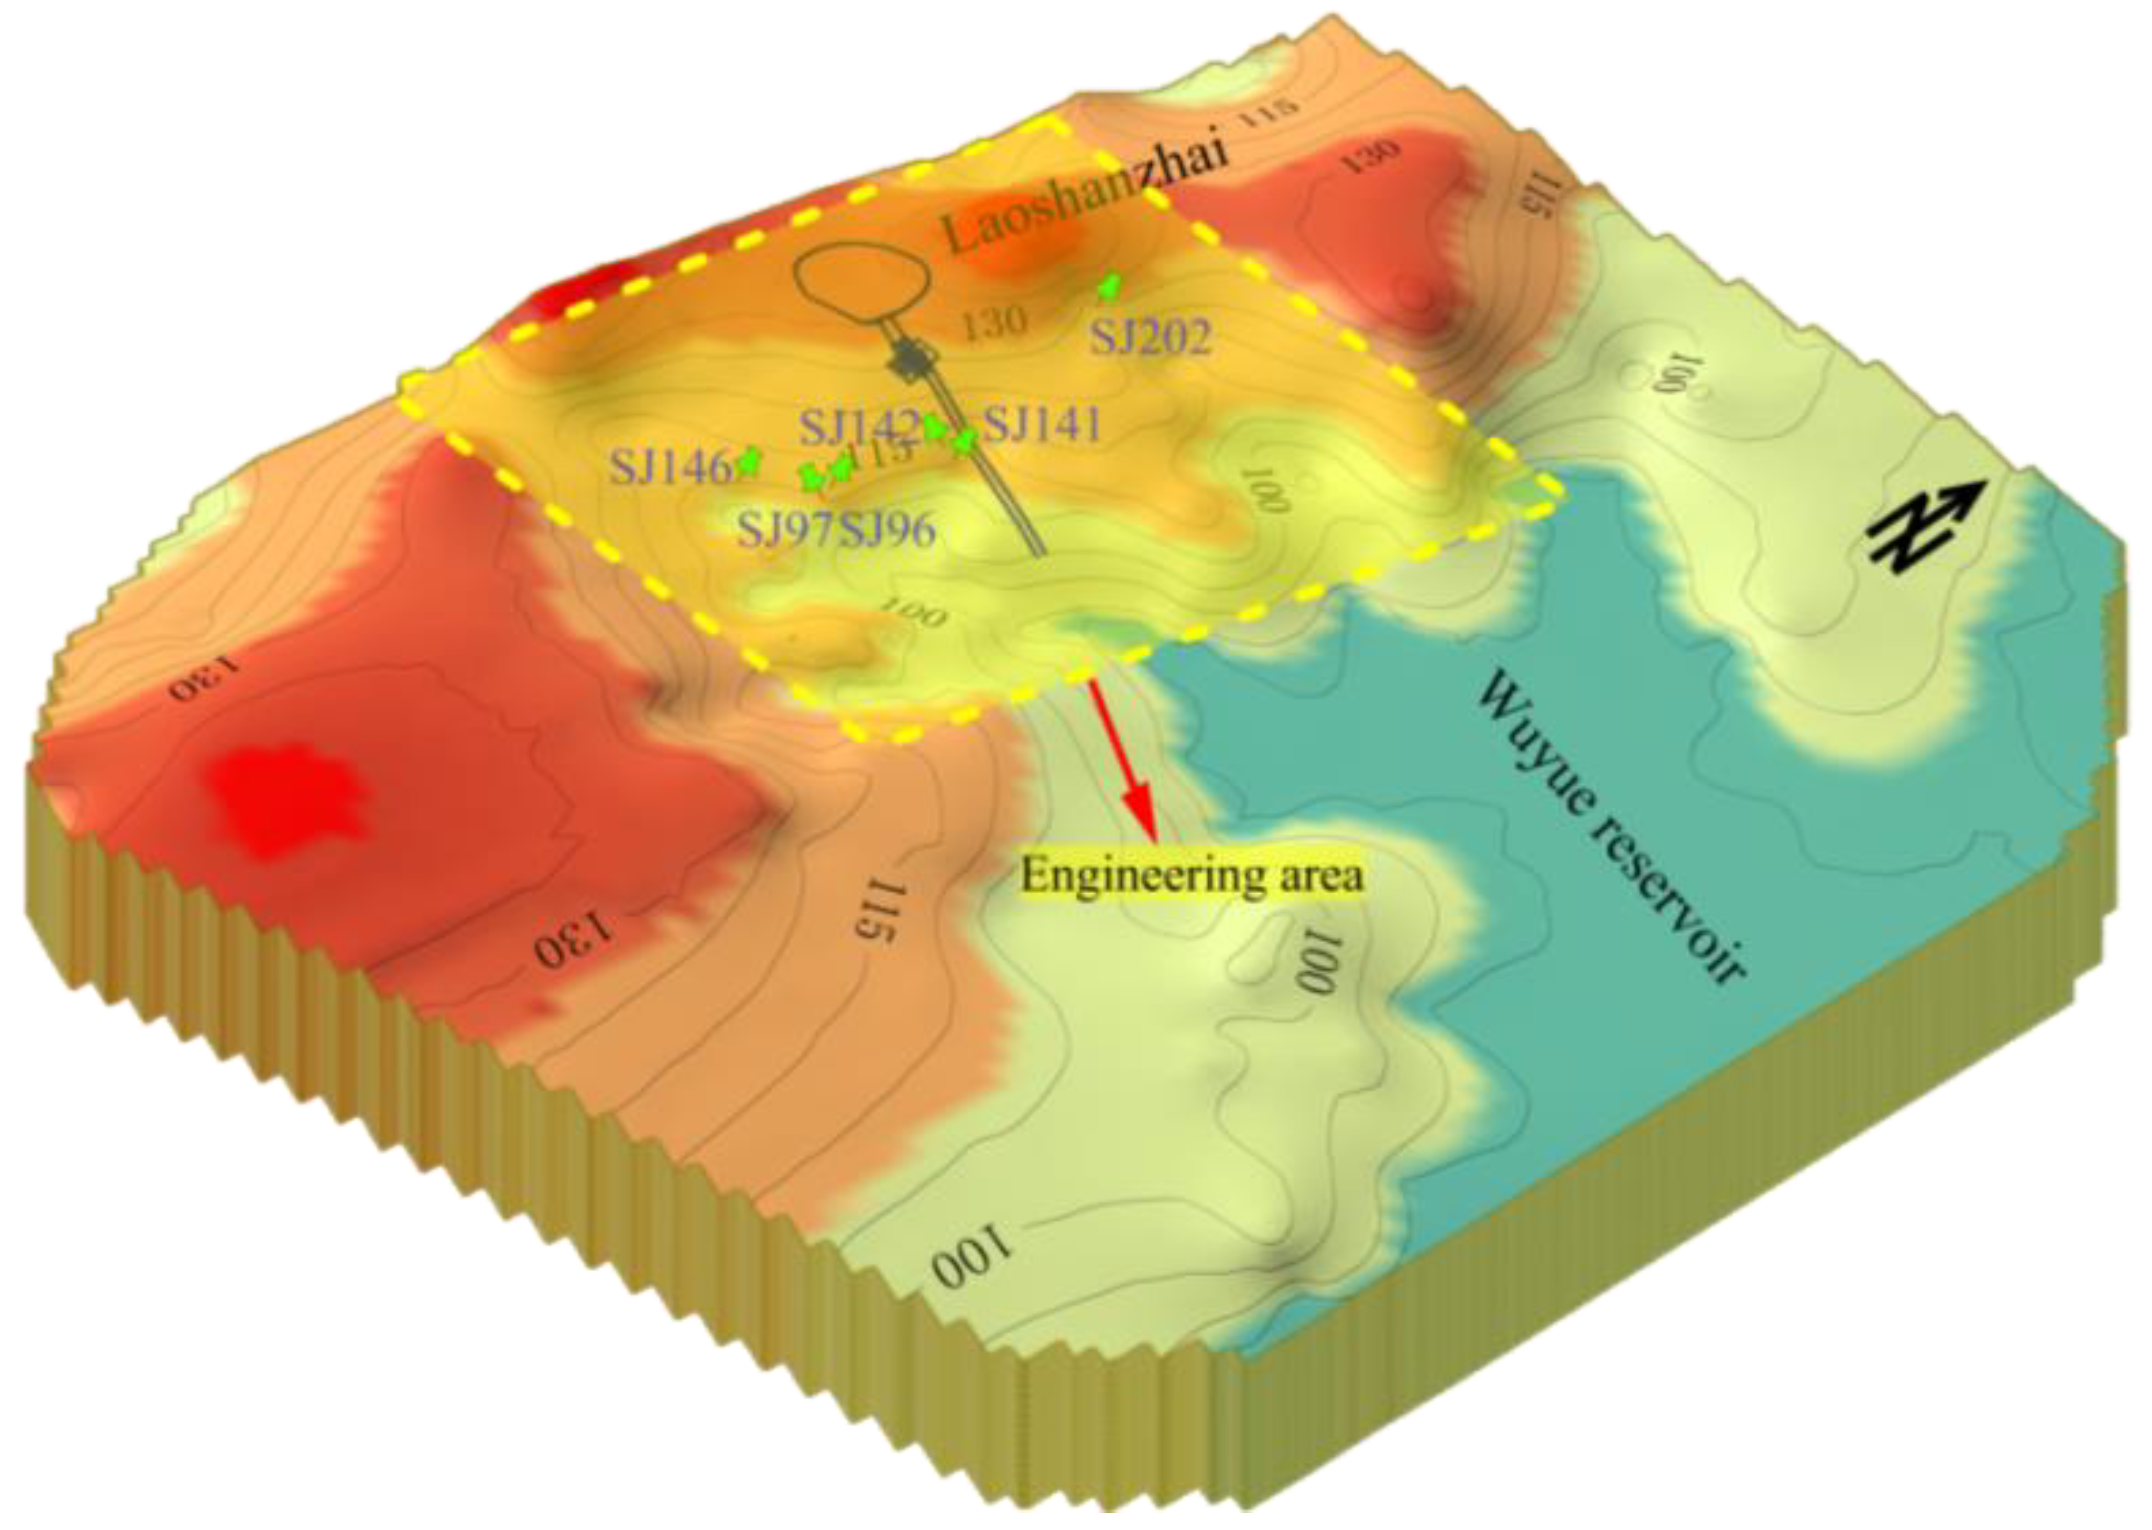
Figure 1), meaning that it is relatively easy to reach by normal transport. The project area comprises eroded low hills and gullies that are characteristic of southern Henan. The river valleys are well-developed, and the area comprises low mountains, hills, loess ridges, and river plains from south to north. The upper reservoir of the power station is in the Laoshanzhai Mountain Forest area, close to the top of the north slope of Laoshanzhai. The reservoir has three large main branches, and the power station is located at the tail of the western branch (
Figure 2). A three-dimensional digital elevation model of the engineering area is shown in
Figure 2.
The tailwater tunnel is arranged with two holes and four machines. The two main tailwater holes (diameter 8.0 m) are circular and are arranged parallel to the pressure holes at an axis orientation of N95.5° E, and the distance between the axes is 46.0 m. The design outlet floor is at an elevation of 60.0 m, the tailwater tunnel is 1456.5 m long, and the buried depth varies from 20 to 285 m. The rock surrounding the shallow tunnel is weak and severely weathered, and the rock structure is broken. The construction of a large-diameter underground cavern has resulted in considerable disturbance and destruction to a large area of rock surrounding the cavern. Therefore, the type, structure, and degree of weathering of the surrounding rock have seriously restricted the engineering design and construction.
A hydrogeological survey was carried out in the early stage of the tailwater tunnel construction to measure the water levels of the wells and ponds in the region. The results from this survey showed that there was a positive linear relationship between the groundwater level and the surface elevation, that the water level of the shallow wells was controlled by the surface elevation, and that the water was mainly from atmospheric precipitation. The hydrogeological survey results also showed that various drinking water wells were exhausted, including SJ146 in Tulou, SJ141 and SJ142 in Qiandawan, SJ96 and SJ97 in Yangshuwan, and SJ202 in Yangmingao, thereby affecting the lives of the villagers (
Figure 2).
2.2. Regional Geological Setting
The project area is near the granite intrusion of the late Yanshanian and comprises the middle Proterozoic Guishan Formation schist, the Devonian Nanwan Formation granites and schist, the late Yanshanian intrusive mid-grained granites and dikes, and unevenly distributed assorted loose deposits from the Quaternary. The geological structure is mainly characterized by small-scale faults, joint fissures, and schistosity developed in the lower reservoir area. The developed fault structure has three main directions, namely NE, NNE, and NNW. The degree of development and direction of the fault structure vary throughout the engineered area.
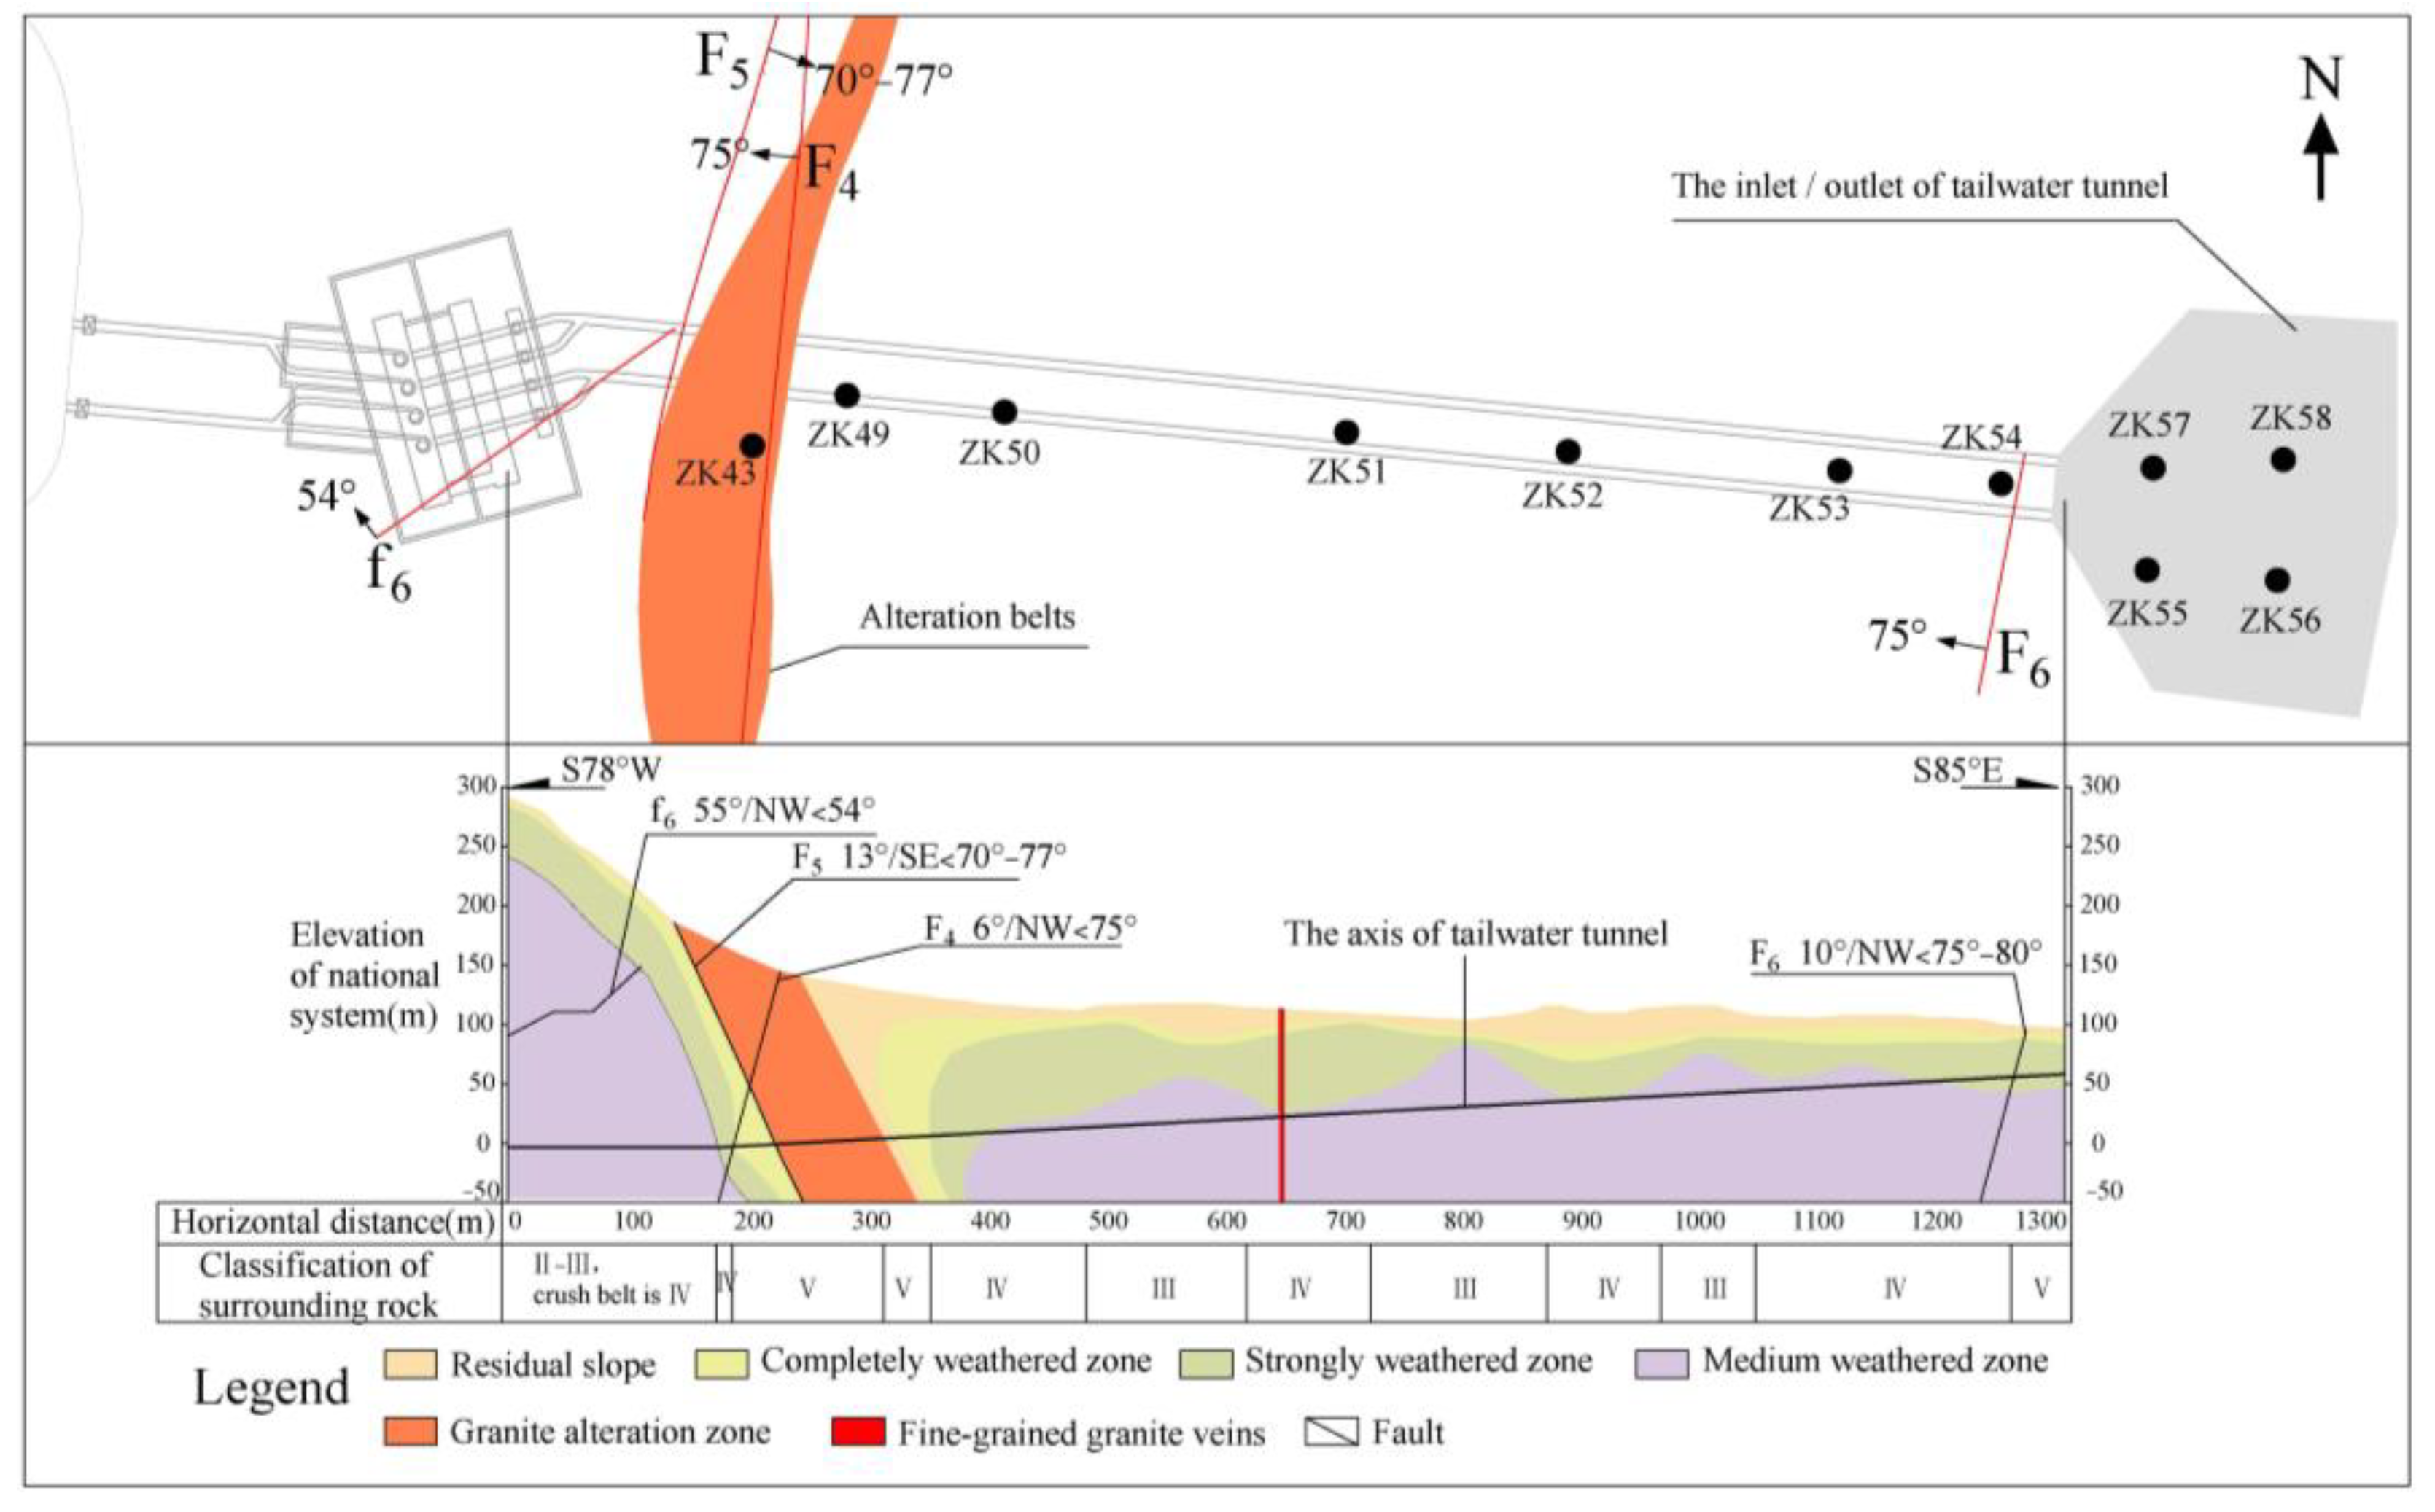
The results from a geological survey showed that the rock surrounding the tailwater tunnel was mainly granite and metamorphic schist, that the contact zone of the two lithologies had a horizontal width of 95 m, and that the altered rock in the contact zone was poorly structured. The underlying bedrock is metamorphic schist of the Nanwan Formation with a schistosity of 273°–287°/SW ˂ 65°–75°. There are 20 faults of different sizes in the engineering area, all of which have steep dip angles. Of these, three faults (F4, F5, and F6) in the tailwater tunnel strike in a NNE direction, with an occurrence of 6°–10°/NW and SE ˂ 70°–77°, and faults F4 and F5 are larger than F6 (
Figure 3).
In pile numbers W①0 + 164–W①0 + 256 and W②0 + 188–W②0 + 282 of the tailwater tunnel, there is a developed granite alteration zone with a horizontal width of approximately 95 m and a metamorphic rock area with well-developed schistotectonics. The weathering characteristics of the rock mass in the engineering area, defined by indexes such as the fracture spacing, rock quality index, p-wave velocity, and RQD, were considered when choosing the arrangement of the drilling holes (
Figure 3). The lower limit of the rock weathering exposed by the drilling of the tailwater tunnel is shown in
Table 1.
The exposed rock near the granite alteration zone along the tailwater tunnel has a relatively large burial depth in the completely weathered and strongly weathered zones because of the influence of the granite intrusion, and the degree of weathering increases as the distance to the alteration zone decreases (
Figure 3). The lower limits of the completely weathered zone and strongly weathered zone are at 8–25 and 12–33 m, respectively. The lower limit of the medium-weathered zone is 33–50 m deep, and the maximum depth is 70.5 m (ZK52). The completely weathered depths of ZK43 and ZK49 near the alteration zone are at 122.33 and 190.15 m, respectively.
2.3. Regional Hydrology
The project area is on the southern bank of the Huaihe River, and the rivers in the area are all part of the Huaihe River system. The main channel of the Huaihe River snakes through the northern part of the project area from west to east. The main tributaries in the area close to the southern bank include the Zhugan River, Qinglong River (the main channel of the upper reaches of the Zhai River), and the Huanghe River (
Figure 1); of these, the Zhugan River is the largest tributary in the area. The Zhaihe River, a first-order tributary of the Huaihe River, originates at Huangmaolao in Qianjin Township, Xinxian County, and flows from south to north through Guangshan County and Xixian County and into the Huaihe River at Baozikou, Huangchuan County. The river is 110 km long and has a basin area of 710 km
2 and a dense network of tributaries. The Wuyue pumped storage power station is on the Qinglong River, at an elevation of 565.60 m.
2.3.1. Groundwater Flow Field
During the excavation of the tunnel, groundwater flows into the tunnel, and the water level falls, causing a decrease in the surface water level and depletion of springs and wells. This problem can be solved by determining the boundary position of the seepage field, especially the boundary of the seepage-free surface. The tailwater tunnel of the Wuyue pumped storage power station is at the tail of the Wuyue Reservoir, and the hydrogeological conditions are complex.
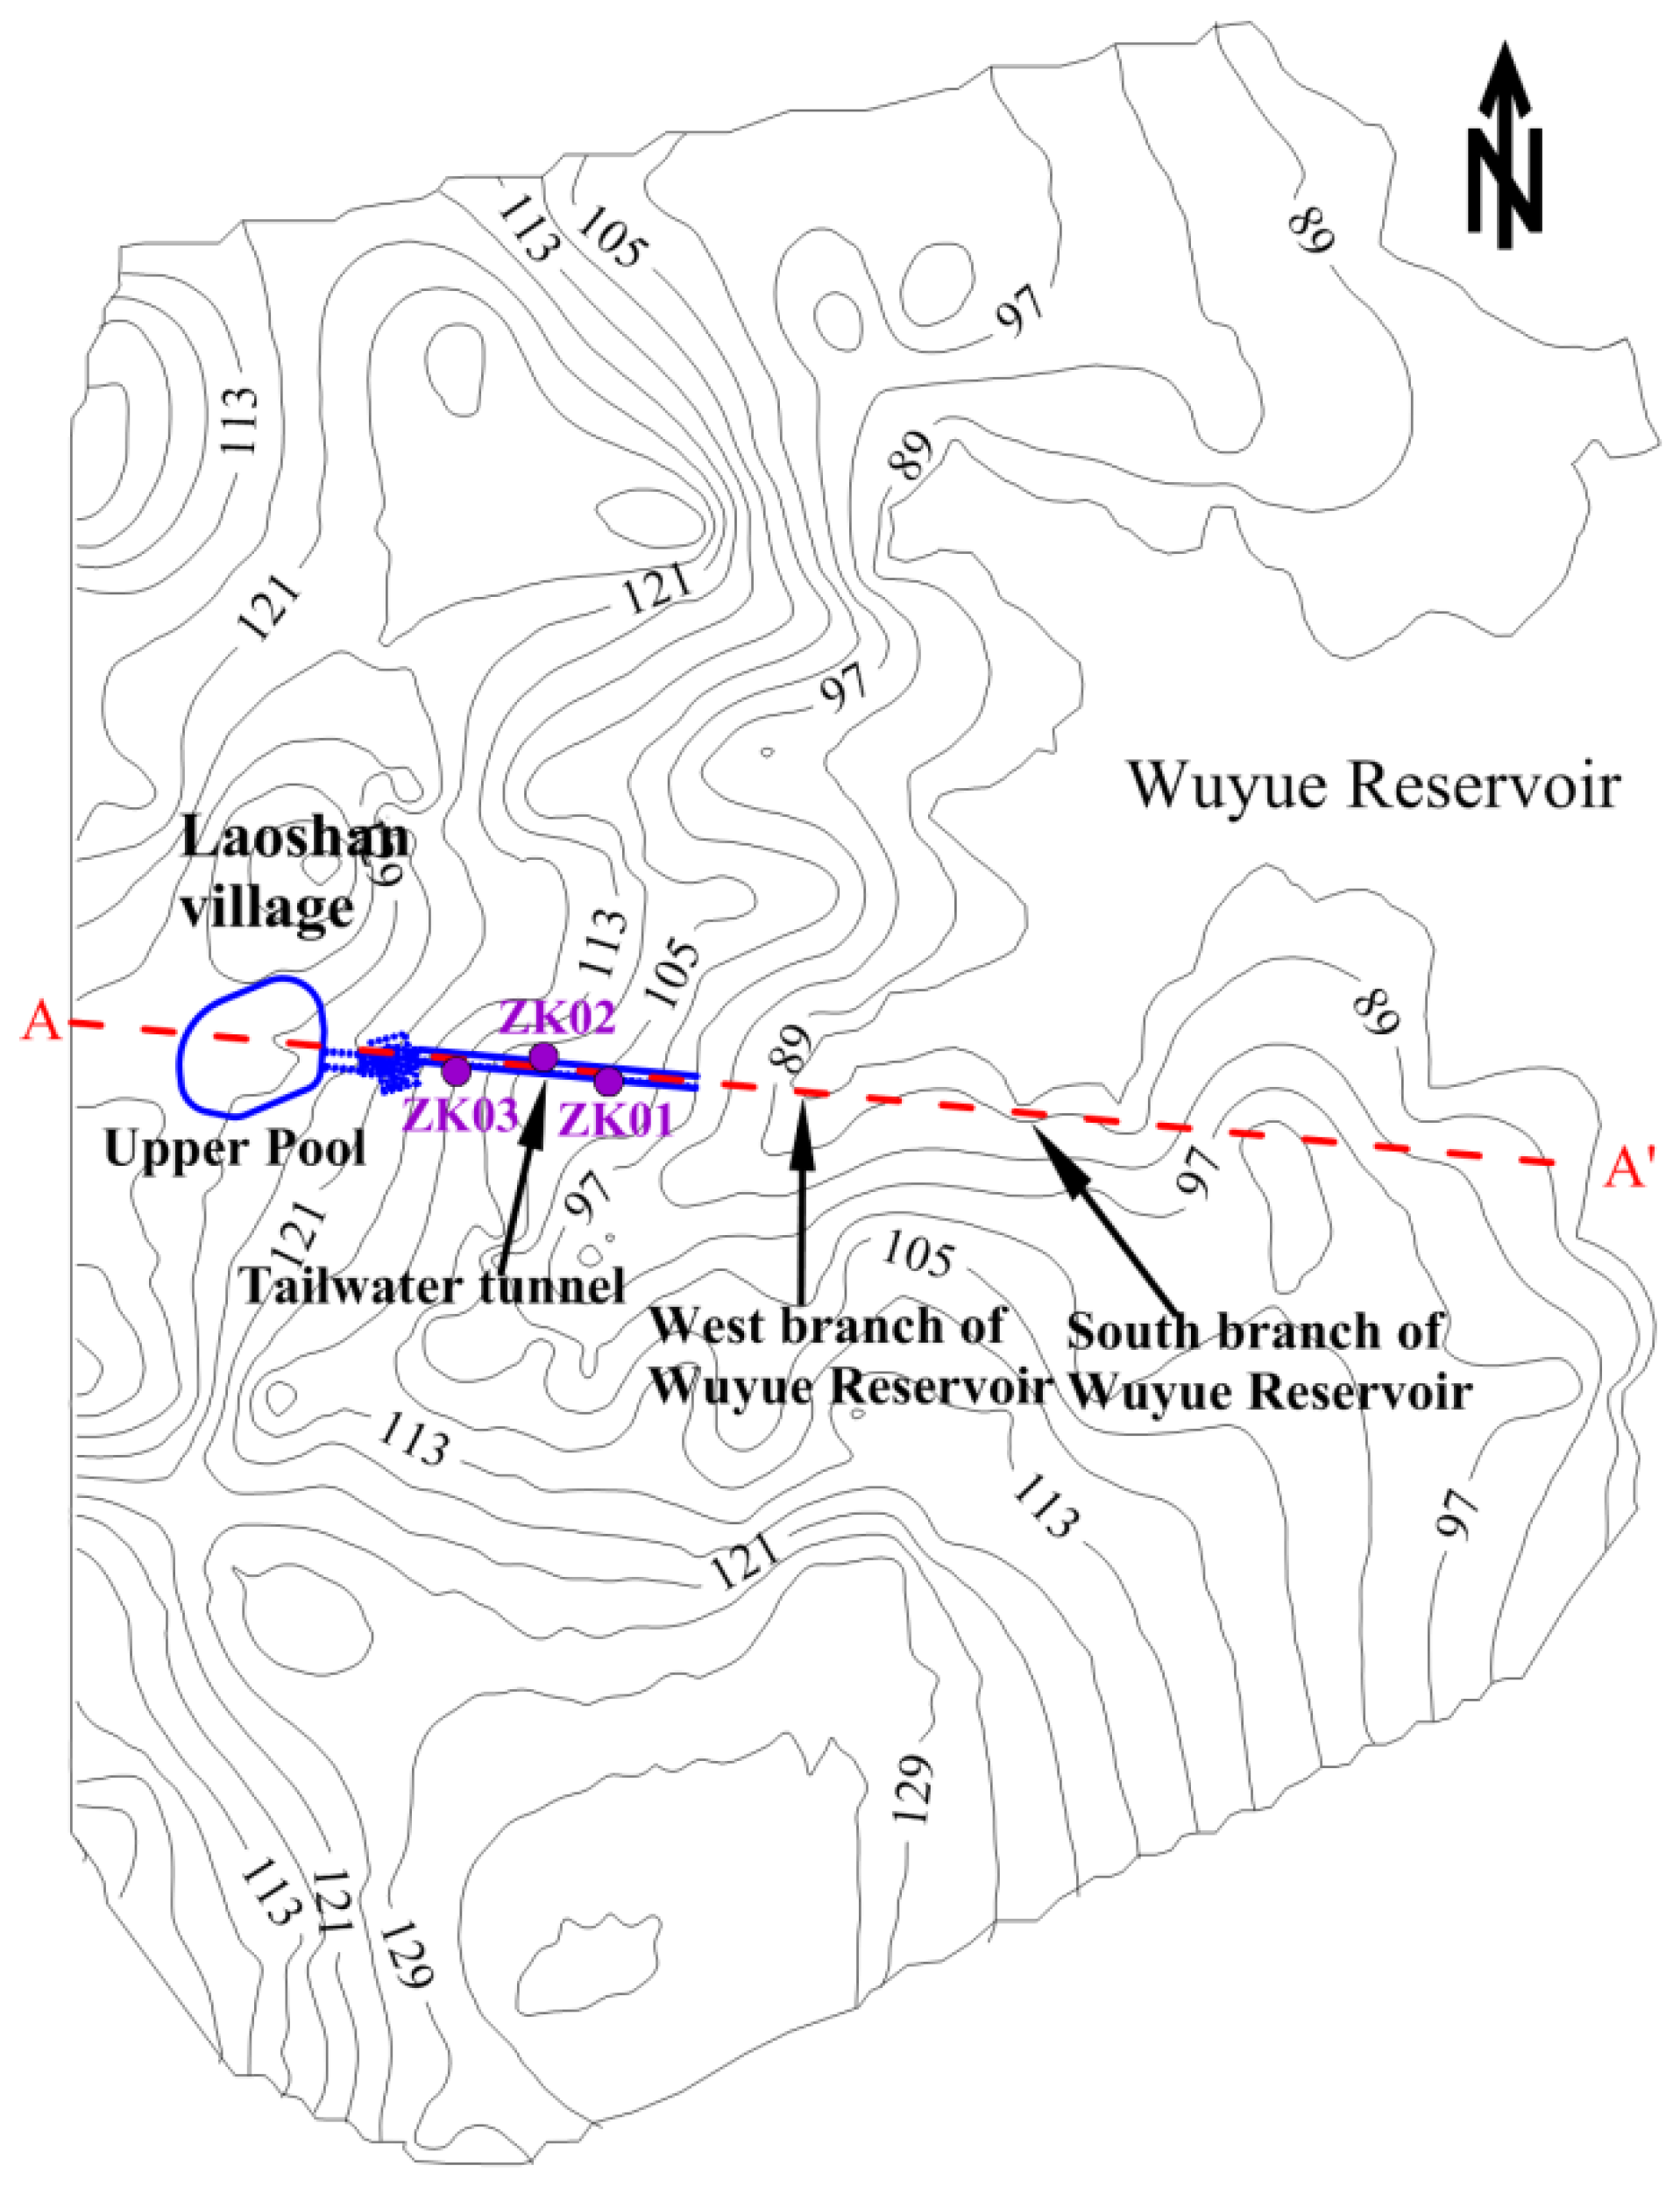
A hydrogeological investigation was carried out around the axis of the tailwater tunnel using a radiation method to determine the boundary position of the groundwater flow field and the boundary of the seepage-free surface. The northern and southern sides of the survey area were bounded by ridges, the western side was bounded by Laoshanzhai, and the eastern side was bounded by the Wuyue Reservoir, and the survey area covered approximately 70 km
2. The survey included 349 wells, 225 ponds, and 6 reservoirs. After the survey data were summarized, collated, and analyzed, the regional water level contour map was drawn with the Surfer software package (
Figure 4). The results from the hydrogeological investigation and borehole exposure showed that the groundwater types in the engineering area were controlled by the characteristics of the stratigraphic lithology and geological structure. There were two main types of groundwater in the engineering area, namely bedrock fissure water and phreatic pore water in the upper soil. There was also a small amount of fissure-confined water in the deeply weathered rock mass or in thicker parts of the Quaternary system.
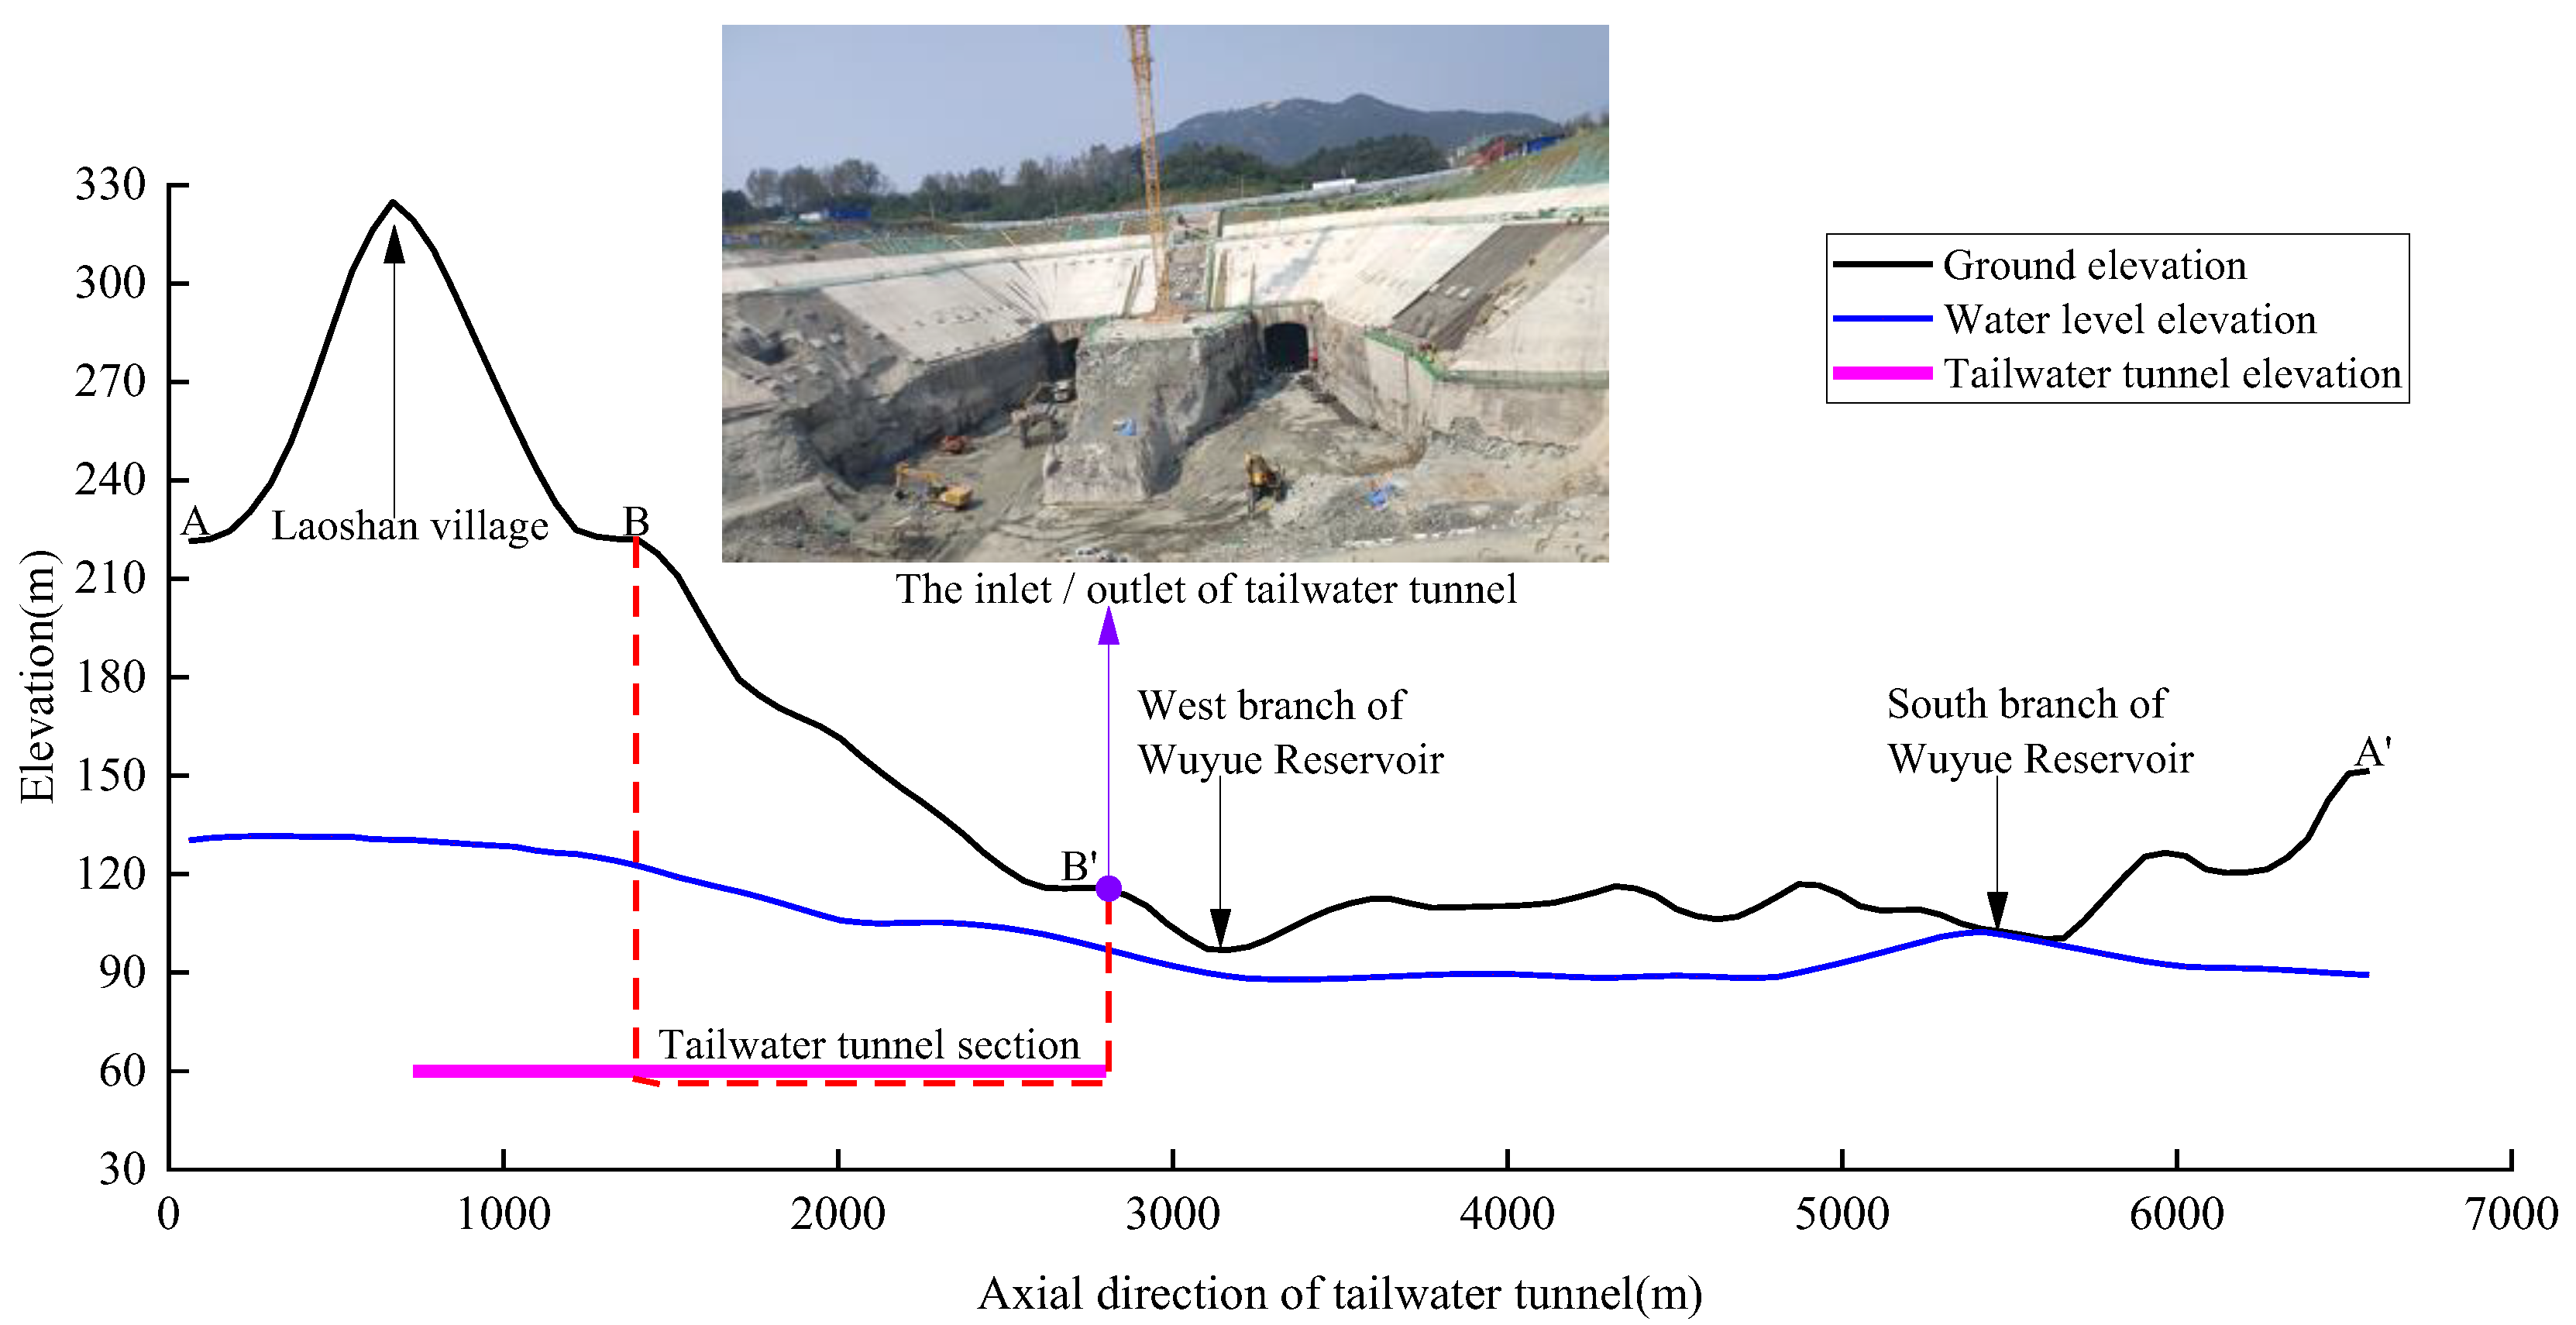
Figure 5 shows the groundwater level along the A–A’ transect (
Figure 4), the elevation information of the area, and the location and elevation of the tailwater tunnel section.
2.3.2. Seepage Field in the Engineering Area
The results of the regional hydrogeological survey show that the water level in the survey area decreased gradually from west to east, with maximum and minimum water levels of 131.7 and 88 m, respectively (Wuyue Reservoir water level). The water level was at 97 m at the inlet/outlet of the tailwater tunnel, and it increased to 122 m going westward along the axis of the tailwater tunnel (
Figure 5). The water level was higher on the western side of the tailwater tunnel than on the eastern side, and the water level on the northern side of the axis of the tunnel was higher than on the southern side (
Figure 4). In
Figure 5, curve BB’ refers to the topographic elevation change along the tailwater tunnel, and the geological structure and fault distribution in the curve BB’ section are shown in
Figure 3.
3. Numerical Calculation
3.1. Selection of Calculation Methods
The groundwater type is controlled by the properties of the stratum lithology and the geological structure. There are two main types of groundwater in the engineering area, namely bedrock fissure water and pore water in the overlying soil.
The pore water that exists in the slope deposits and residues is mainly distributed in the surface residual slope deposits and alluvial flood deposits with large gullies, and it is relatively uniformly distributed and well-connected hydraulically. The groundwater in the whole project area is dominated by the bedrock fissure type. Because of the different causes and distribution of cracks in the rock mass, there are non-uniform fissures throughout the bedrock aquifer, and bedrock fissure water develops. Under the combined effects of seepage and stress, the hydrogeological conditions of the aquifer around the tunnel will change because of the engineering work, and the seepage channels of the fractured rock mass will be dredged, meaning the aquifer permeability will increase.
In the three-dimensional seepage analysis, the rock mass is regarded as an equivalent and continuous anisotropic medium, and seepage is considered to occur mainly in the rock mass. Fracture medium seepage is commonly studied by the equivalent continuous medium seepage model and double permeability medium model. Because there were no data about the distribution of cracks in the engineering area, the double permeability medium model could not be used, so the equivalent continuous medium seepage model can be used. Given the engineering geological and hydrogeological conditions of the tailwater tunnel, the aim of the modeling was to determine the hydrogeological unit partition, seepage characteristics of each stratum, and the tunnel boundary conditions. The three-dimensional transient simulation of groundwater seepage in the tailwater tunnel was determined using the finite element method of the equivalent continuum seepage model.
3.2. Differential Equation of Seepage Analysis
Many researchers [
29,
30,
31] have studied groundwater seepage in tunnel engineering. The differential equation that governs three-dimensional seepage in a rock mass is expressed as:
and
where
is the total water head;
,
, and
are the permeability coefficients of the
,
, and
directions, respectively;
is time;
is the source sink term, which is generally a function of position and time, and
is the water content per unit volume.
3.3. Finite Element Analysis of the Three-Dimensional Seepage
In line with the variational principle, the three-dimensional seepage fixed solution problem is equivalent to solving the extreme value problem of the energy function when the coordinate axis direction is consistent with the principal seepage direction, namely:
where
is the boundary of the seepage zone.
In the process of groundwater seepage in the fractured rock mass, the seepage satisfies the continuity equation, the mass conservation equation, the initial conditions (Formula (5)), and the boundary conditions (Formula (6)).
where
is the seepage zone, and
is the known function of the water head boundary.
Using the finite element method to analyze the seepage field is the same as solving the extreme of the energy function, and the initial seepage field is inversed by the steady state analysis as the boundary head condition of the transient analysis. The seepage field in the engineering area is discretized, and then the subregions are superimposed. Assuming that the interpolation function is zero, the finite element equation for solving the seepage field is:
and
where
is the overall penetration matrix,
is the node head array,
is the flow matrix,
is the time increment,
is the water head at the beginning of the time increment, and
is the water head at the end of the time increment.
In this study, the above equations were solved using finite element software, the natural seepage field was inverted by the steady state analysis equation, and the variations in the seepage fields for the different seepage control design schemes were analyzed with the transient analysis equation.
4. Three-Dimensional Transient Seepage of the Hydrogeological Models
4.1. Inversion Model
The distribution of the fracture network in the rock mass is chaotic. The question of how the fracture network should be reflected correctly in the calculation model is the most difficult problem when studying the seepage fields of fractured rock masses. Here, the inversion method was used to solve this problem. The permeability coefficient of each hydrogeological unit in the engineering area was deduced backward with the three-dimensional model from the conditions provided by the field geological exploration, borehole pressure water test, and the hydrogeological survey.
The boundary conditions of the model were determined using the hydrogeological survey data, and the borehole water pressure test value was used as the initial value of the permeability coefficient of the model. The regional natural seepage field was simulated, and ten representative water levels were selected and compared with the measured values of the water level of the seepage field. The permeability of the hydrogeological unit partition was adjusted, and the hydrogeological model that met the engineering requirements was established.
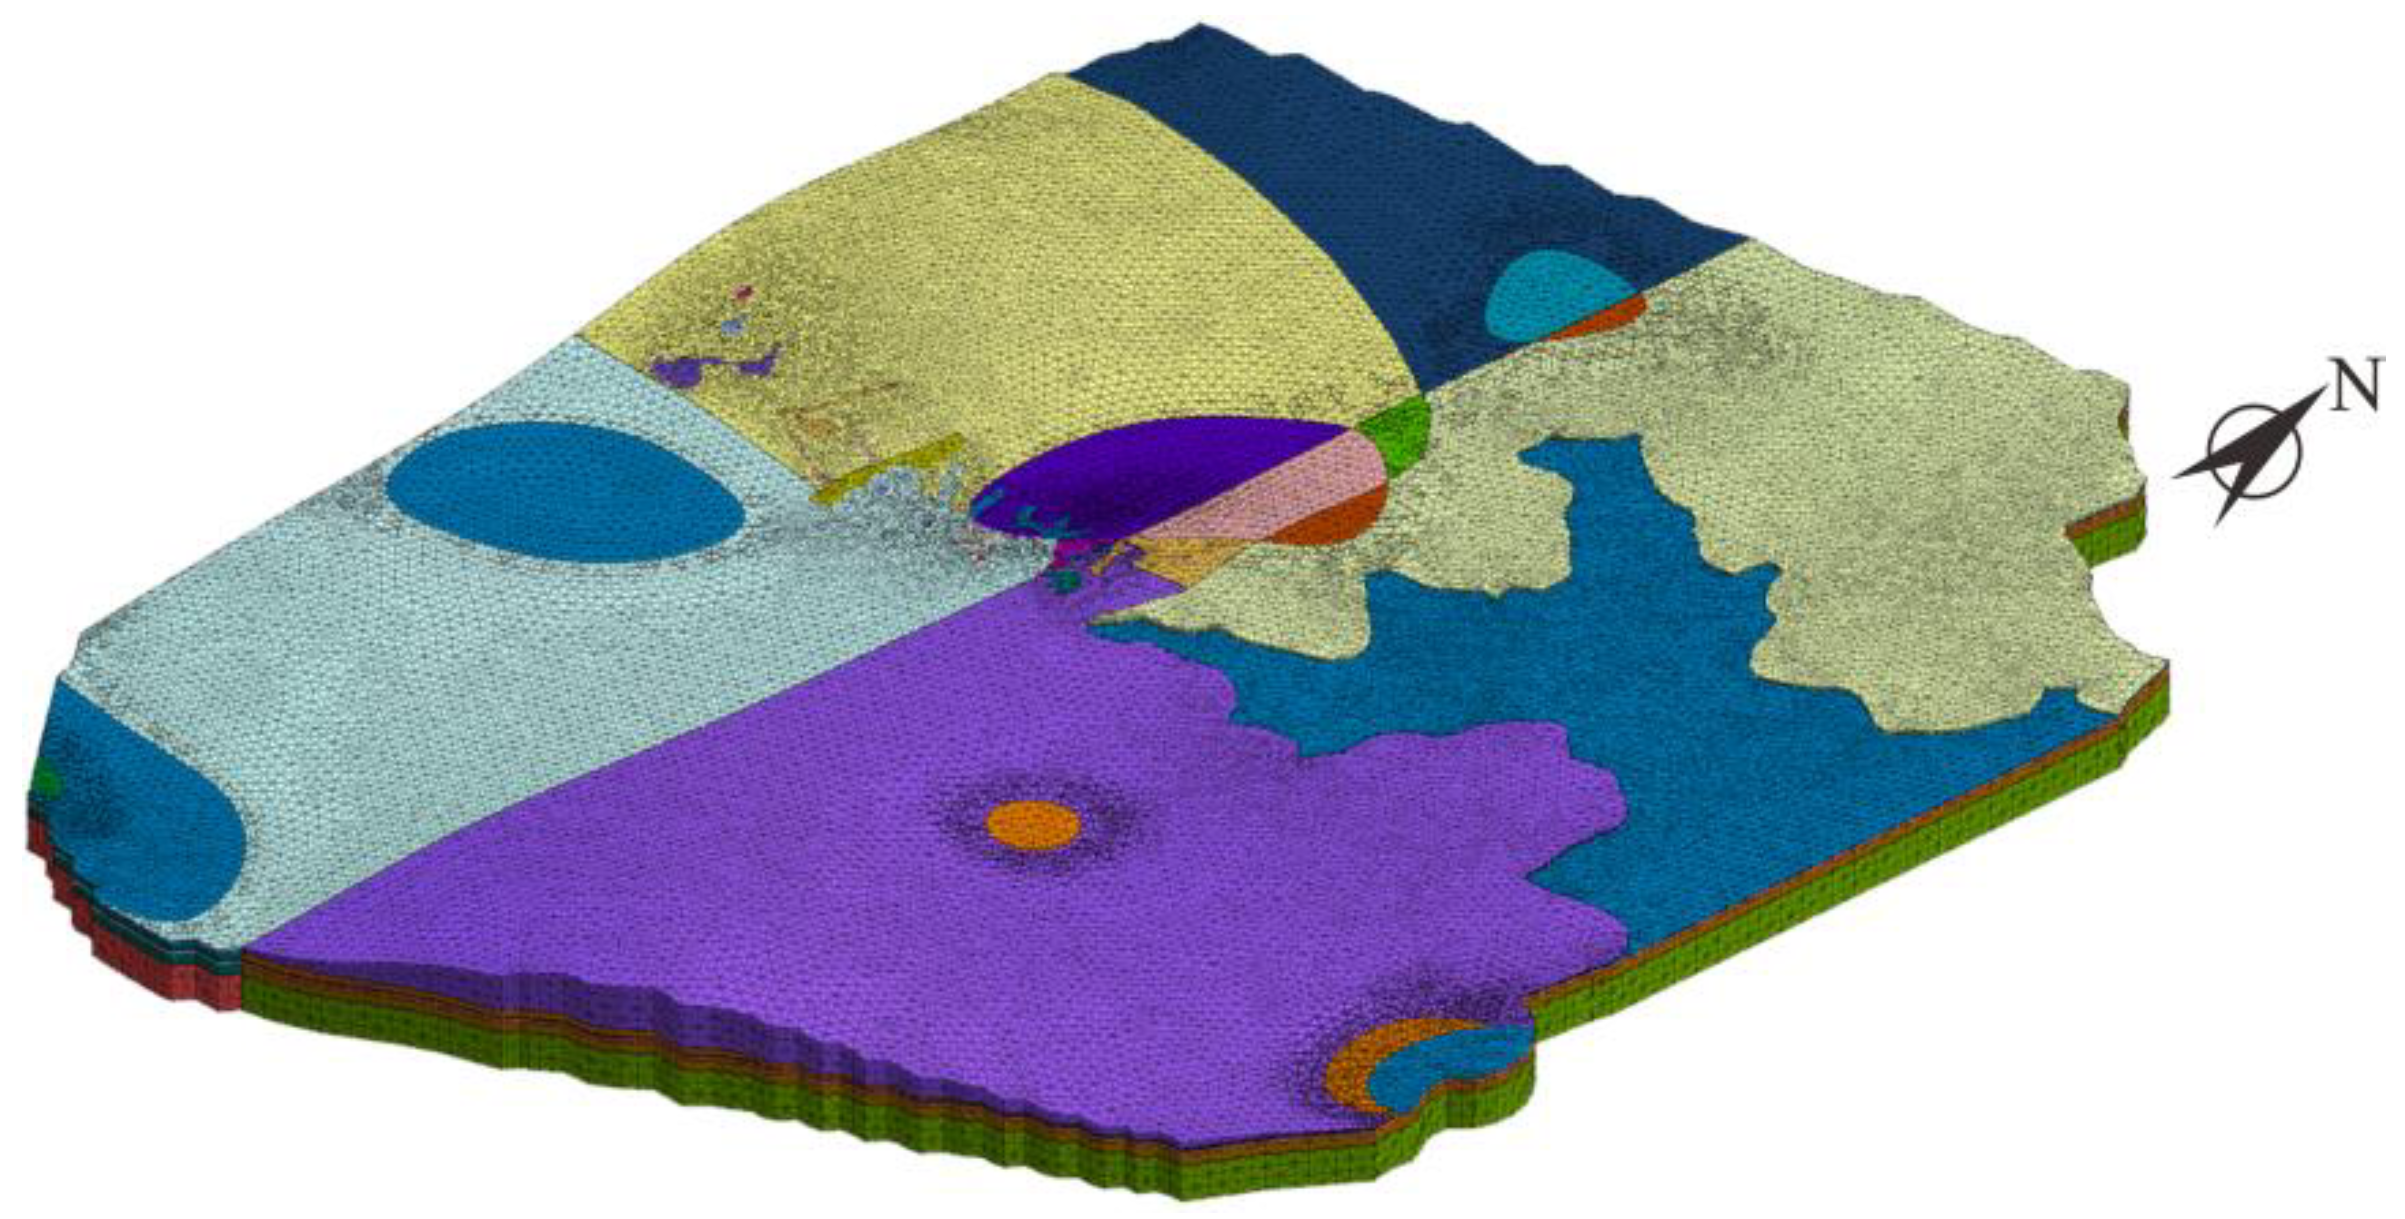
Structural planes, such as cross-connected or penetrating faults and fractures, may have roles as seepage channels in underground seepage. These discontinuous structural planes must be accurately reflected in the model in a practical engineering application before the calculation results of the model are used to guide engineering practice. To meet the scientific and engineering requirements of the numerical model, the model simulation was based on 1,003,384 discrete elements from the groundwater seepage system across the whole region (
Figure 6) and included an area of 70 km
2. From the borehole water pressure test data and weathering zoning, the calculation area was divided into four layers in the vertical direction, and the bottom boundary was a slightly weathered rock mass, which was assumed to be an impervious boundary.
The permeability coefficient,
k, is very important for seepage field analysis [
32,
33,
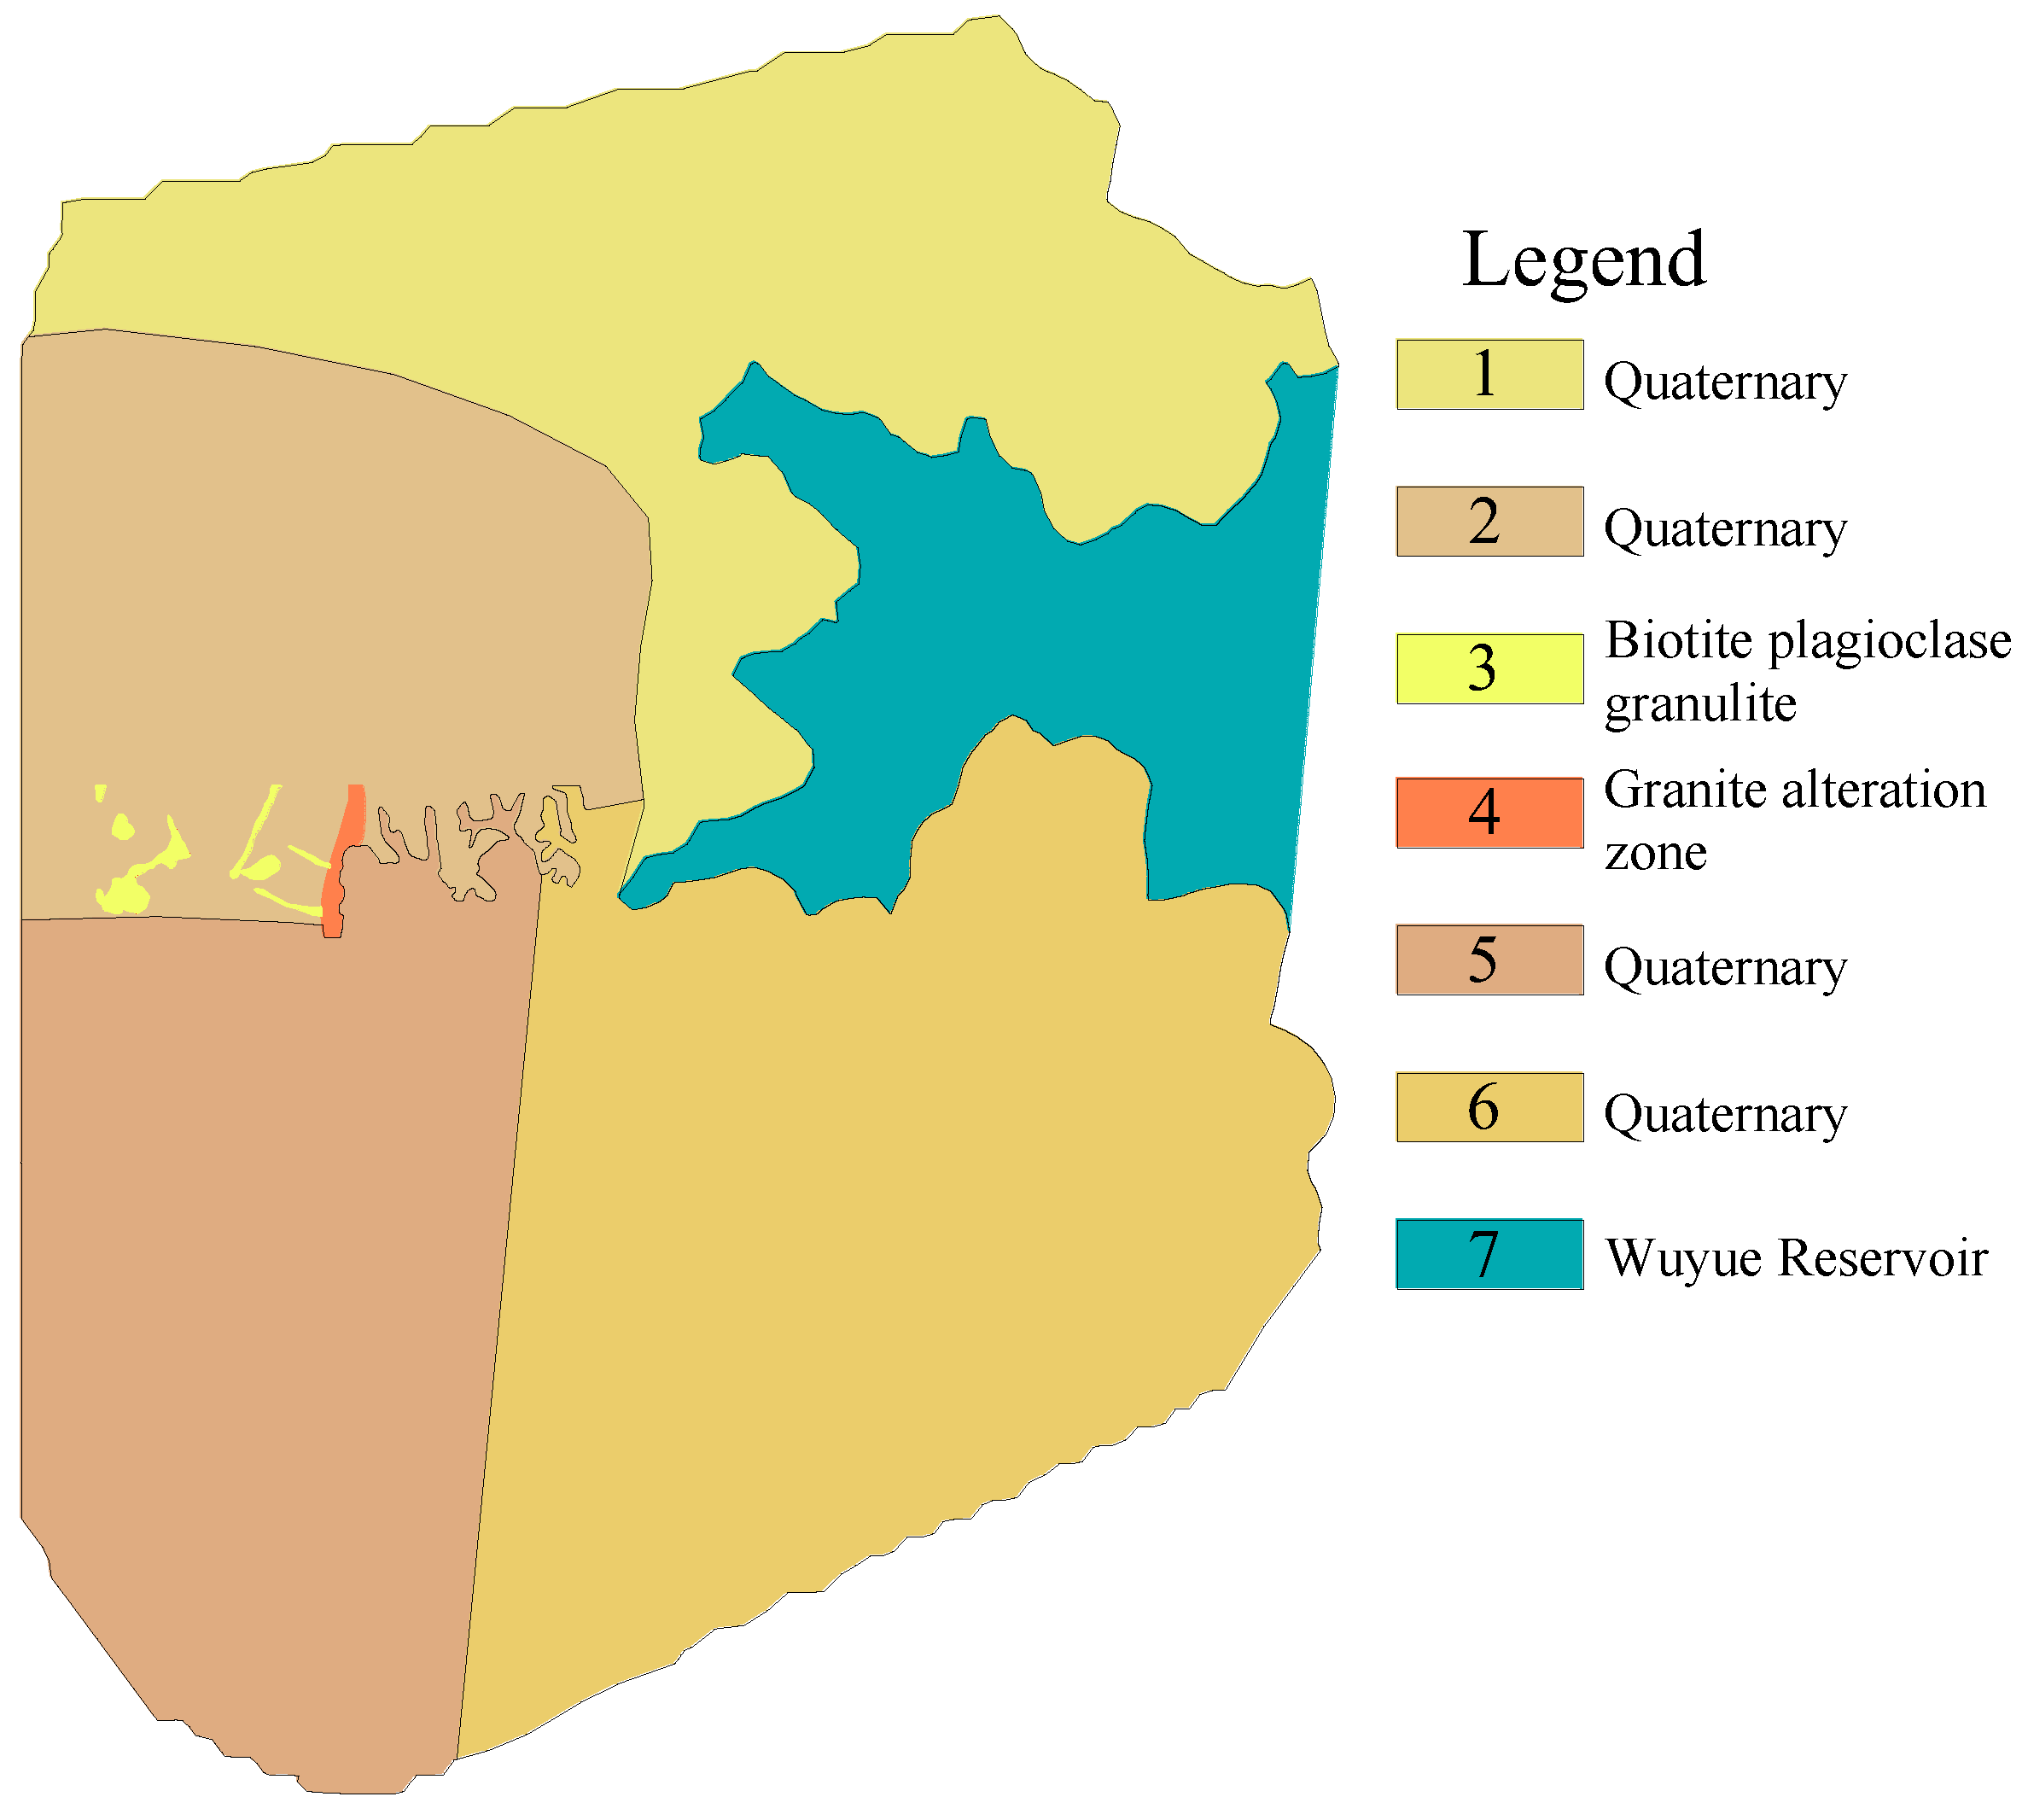
34]. Based on the lithology distribution and the permeability coefficients of the engineering area, the model was divided into 6 parameter regions (
Figure 7), in which the numbers 1–6 represent different hydrogeological partitions. Using the lithological characteristics of the engineering area, the field drilling water pressure test was carried out, and the permeability coefficient of each partition was calculated with the Babushkin formula. As the initial parameters of the model inversion, the inversion results were compared with ten monitoring points in the natural seepage field and the permeability coefficient of each partition was corrected (
Table 2).
4.2. Validation of the Inversion Model
The natural seepage field and the simulated seepage field are shown in
Figure 8. The numerical model was verified using ten identical monitoring points from
Figure 8a,b that covered the water level values of features such as the engineering area, Wuyue Reservoir, and Laoshanzhai.
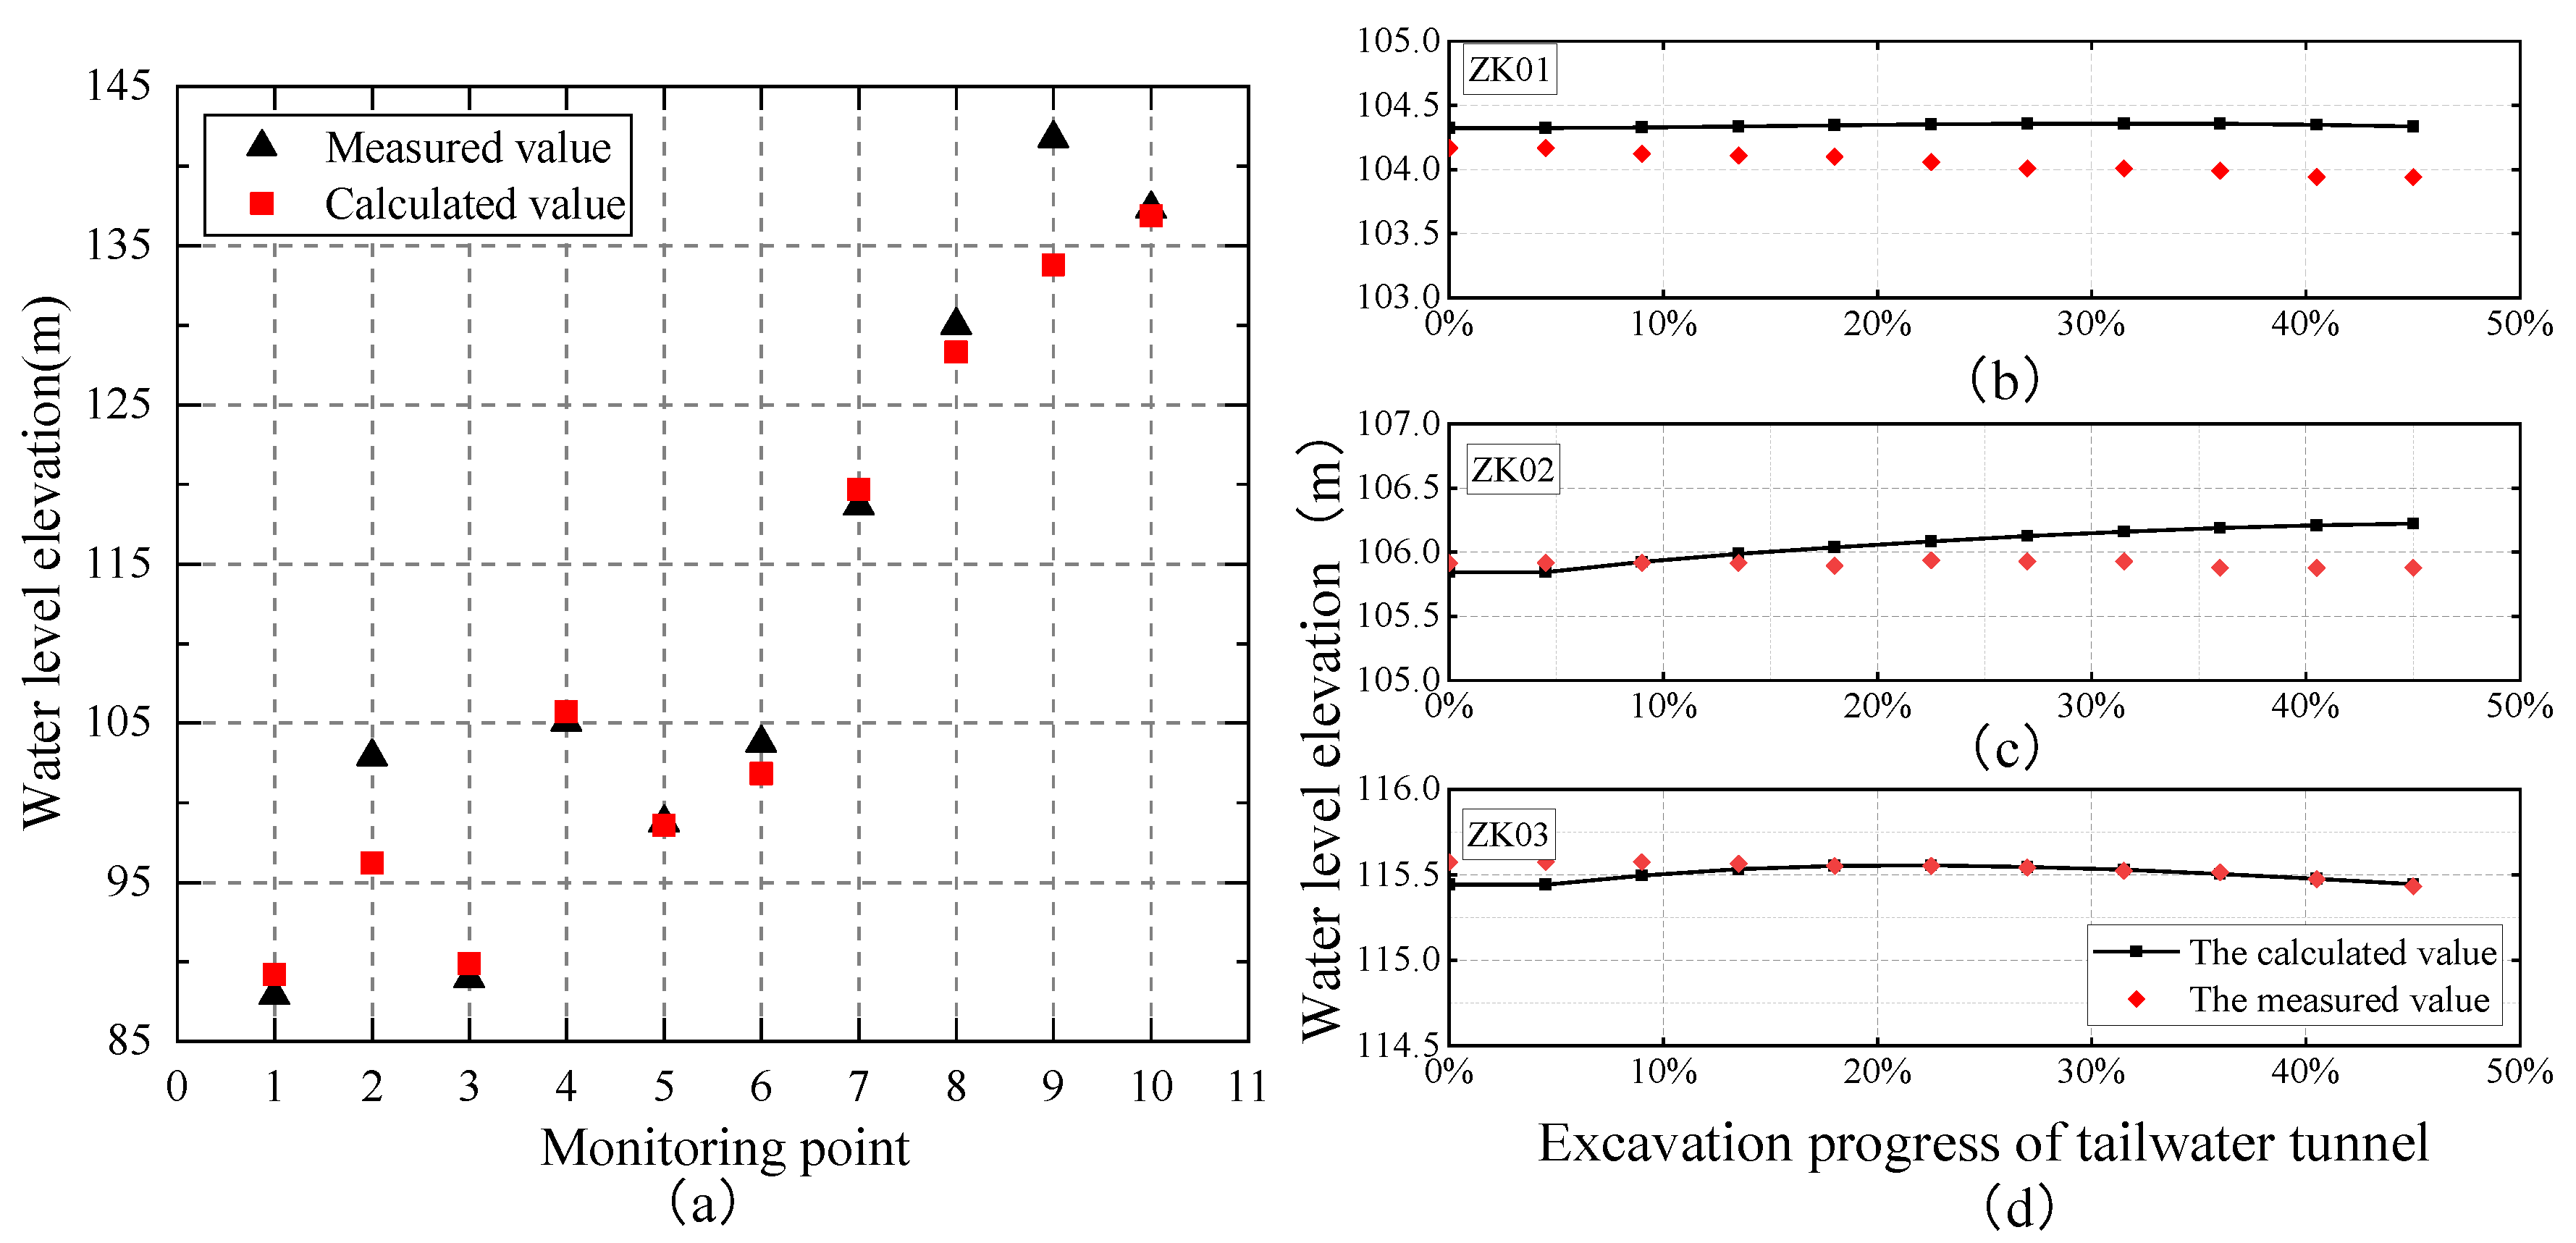
The measured and calculated water levels of the monitoring points are shown in
Figure 9a. The simulated water level was roughly consistent with the field-measured water level, and the average error of the simulated calculated water level was 1.98%.
Based on the rationality of the model parameter inversion, two seepage control schemes, namely normal seepage conditions and limited seepage conditions, were designed. The normal seepage conditions included five different transient flows, with transient flows of (1) 0–200 m3/d, (2) 0–400 m3/d, (3) 0–600 m3/d, (4) 0–800 m3/d, and (5) 0–1000 m3/d. The limiting seepage conditions included three transient flows, with transient flows of (6) 0–2000 m3/d, (7) 0–4000 m3/d, and (8) 0–5000 m3/d.
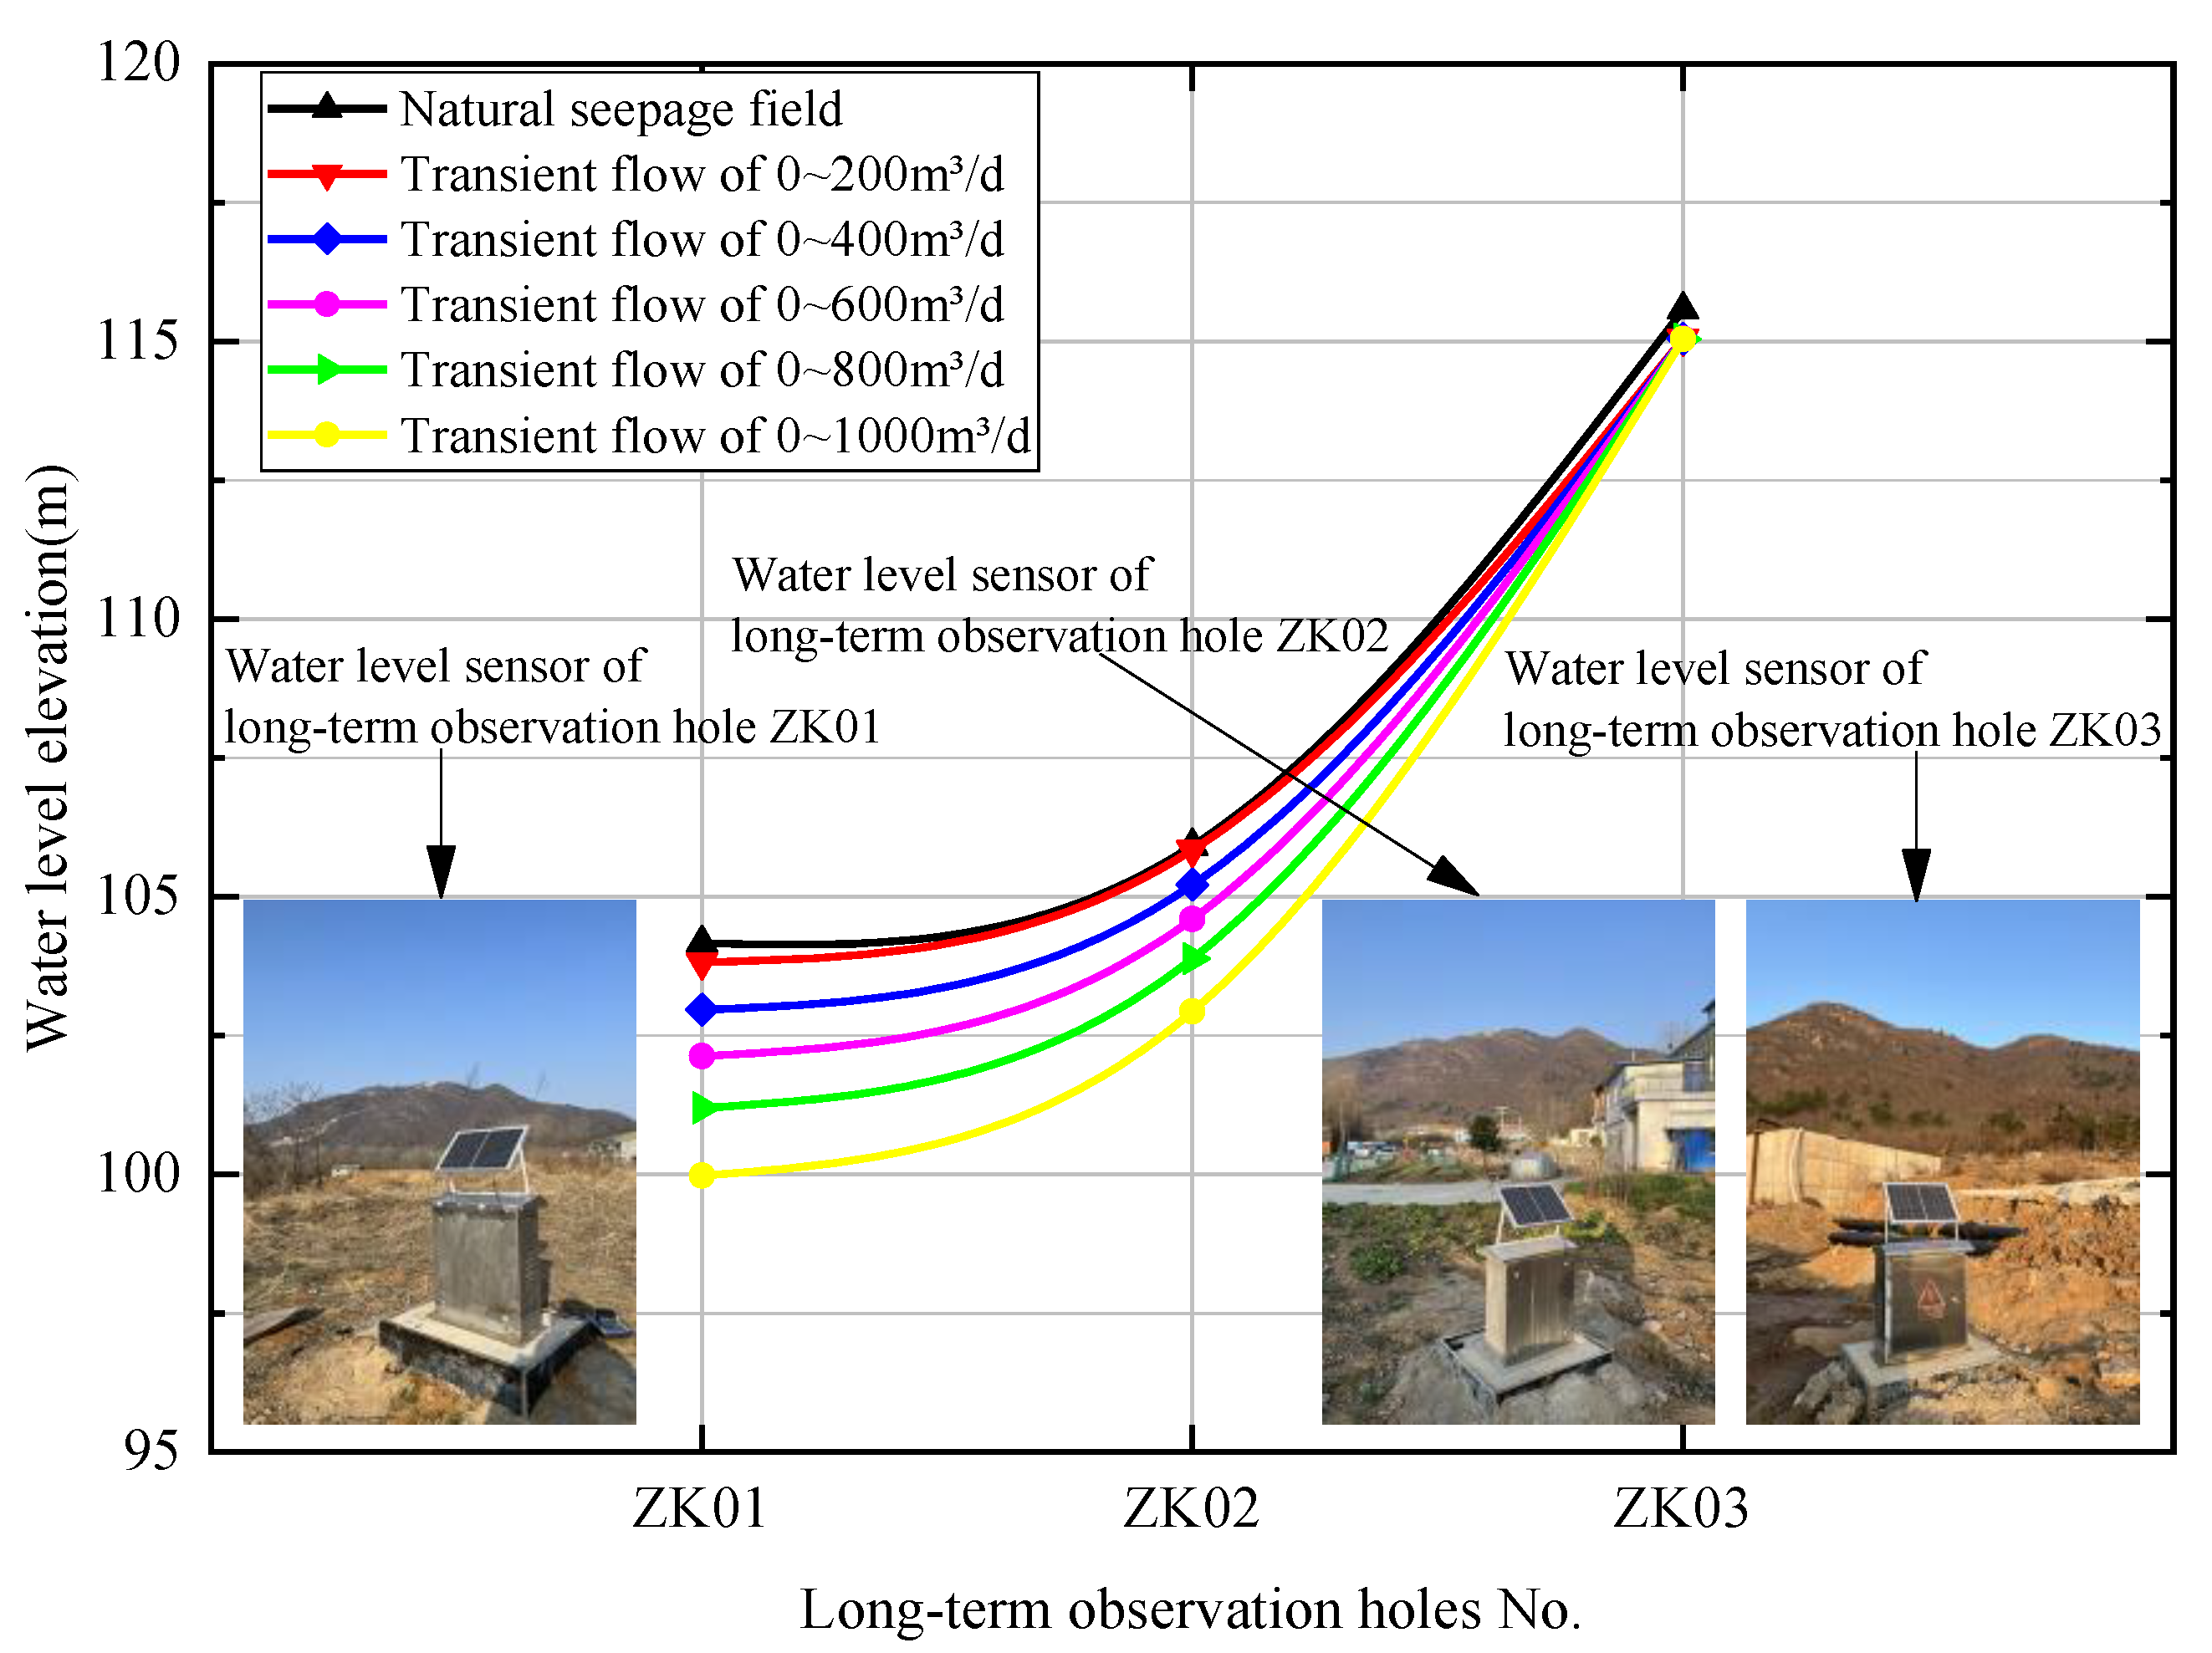
Three long observation holes, ZK01, ZK02, and ZK03, were set up on both sides of the tunnel axis in the project area to collect real-time, accurate information about the changes in the groundwater flow fields in the project area for a period of 2 years (
Figure 4). Water level sensors (
Figure 10) were installed to transmit the monitoring data in real-time and send out alarm information in time. The water levels of the natural flow fields of ZK01, ZK02, and ZK03 and the calculated water levels for the five seepage control design schemes are shown in
Figure 10. This graph shows that the water level changes in the long observation holes fitted closely with seepage control design scheme 1.
The variations in the water levels monitored in the long observation holes and calculated by the inversion model for seepage control design scheme 1 are shown in
Figure 9b–d. Borehole ZK01 had a water level of 103.94 m and a simulated water level of 104.33 m, meaning a difference of 0.39 m. Borehole ZK02 had a water level of 105.88 m and a simulated water level of 106.22 m, meaning a difference of 0.34 m. Borehole ZK03 had a water level of 115.43 m and a simulated water level of 115.44 m, meaning a difference of 0.01 m. The average error between the simulated water level values and the sensor data was 0.16%, which shows that the model was satisfactory. The seepage parameters given by the inverted model were reasonable, and the values calculated for the three-dimensional seepage field model were reliable and suitable for use to simulate and predict the groundwater flow field in the engineering area. The numerical simulations can be used to quantify the variations in the seepage field and predict the water levels for a future phase of the tailwater tunnel construction.
4.3. Transient Seepage Analysis
Assuming that the inverted model produced results that were practical for the engineering, the hydrogeological model was used to predict the influence of normal seepage conditions on the changes in the groundwater seepage field during the excavation of the tailwater tunnel using a three-dimensional transient numerical simulation. The range of the influence of the tunnel excavation on groundwater was analyzed qualitatively, and the distance over which there were changes in the pore water pressure head because of the tunnel excavation was quantified and analyzed.
The depleted well points where the villagers were experiencing drinking water shortages were added to the model and simulated. Well points SJ96, SJ141, SJ146, and SJ202 were included in this analysis. Information on the distance between the well points and the axis of the tailwater tunnel is given in
Table 3. For each of these wells, the patterns and changes in the water levels for the five seepage control schemes were analyzed.
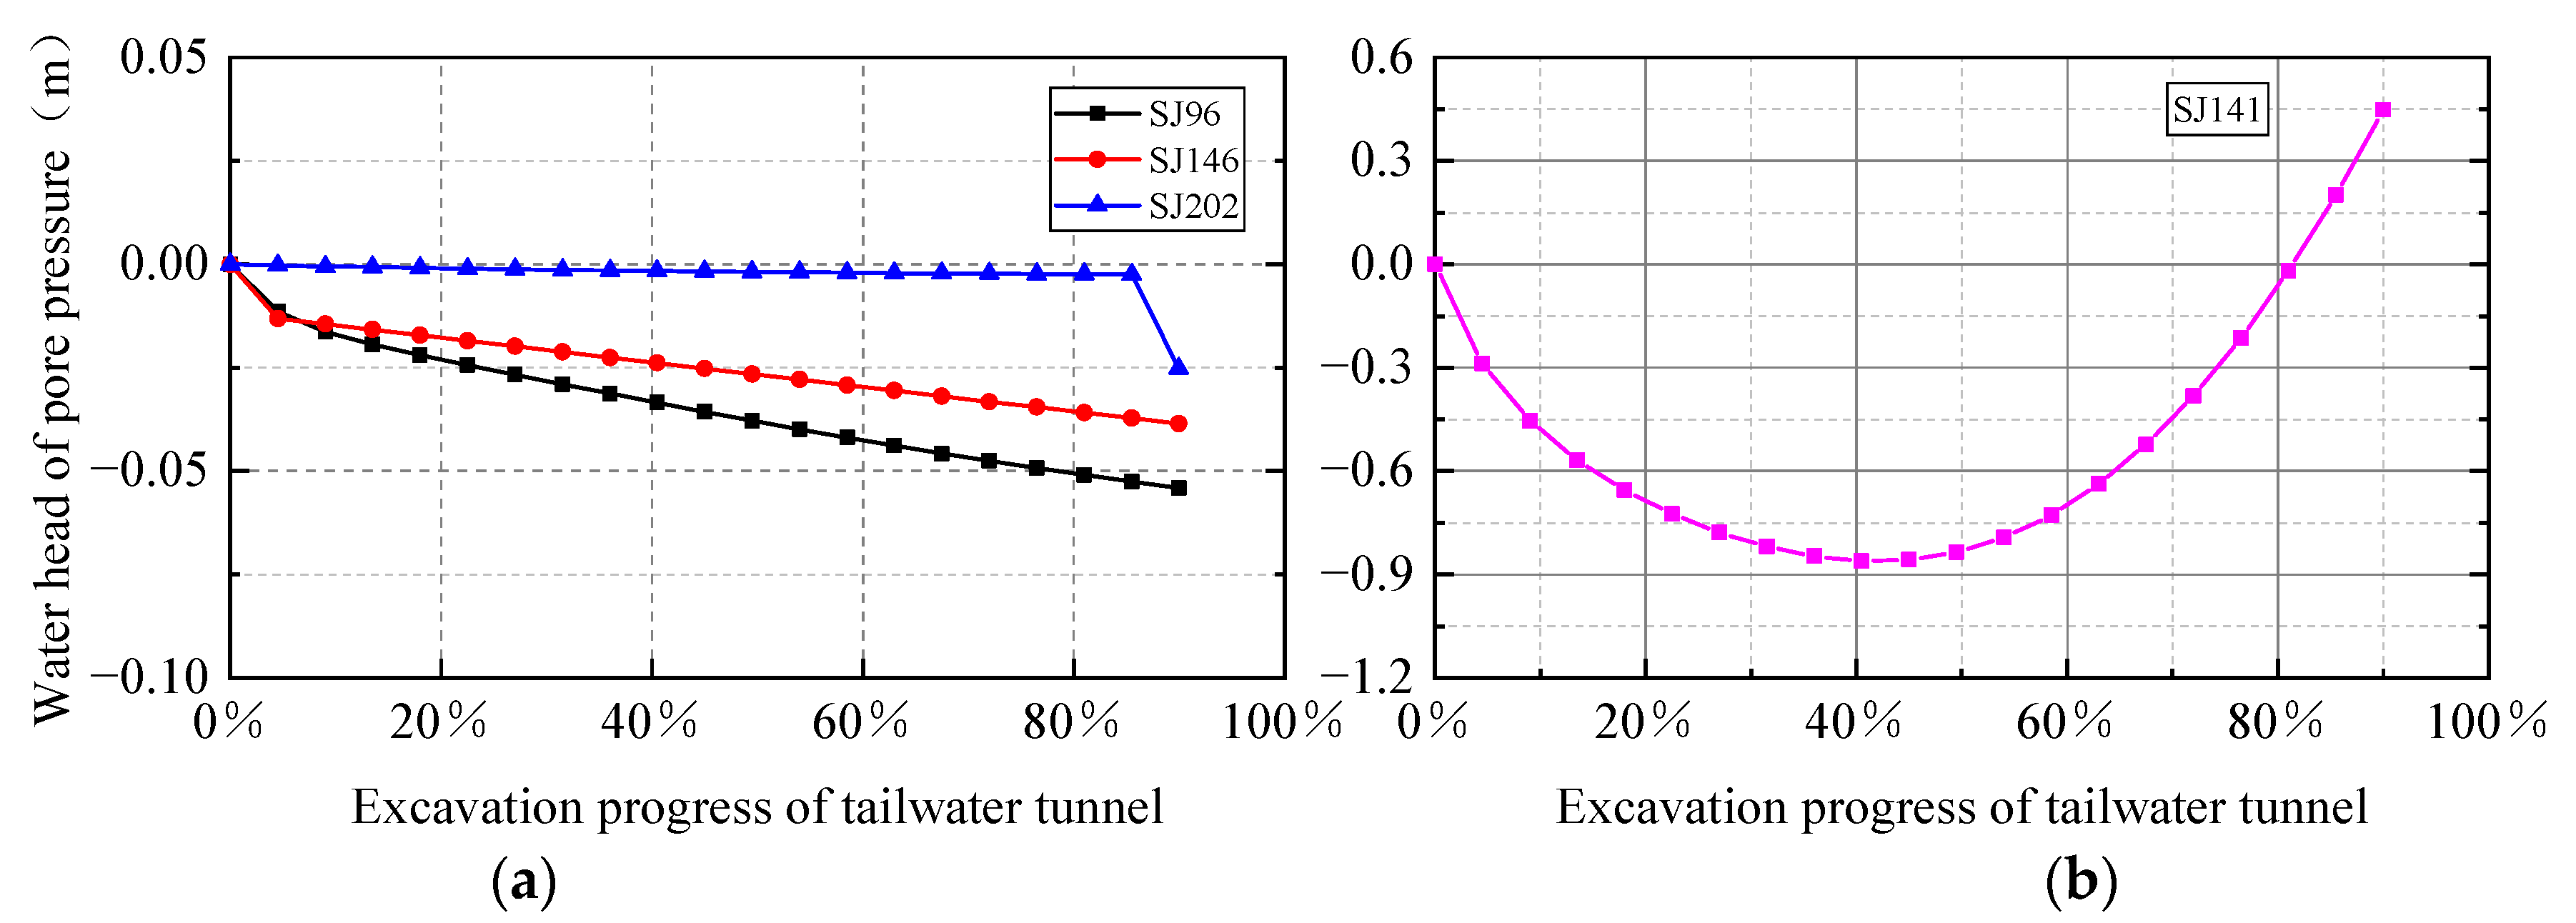
The variations in the water level at well points SJ96, SJ141, SJ146, and SJ202 for the five seepage control schemes are shown in
Figure 11. As shown in
Figure 11a, the groundwater levels in well points SJ96, SJ146, and SJ202 were 0.054, 0.039, and 0.025 m, respectively.
Figure 11 also shows that the groundwater levels were affected by the excavation of the tunnel, and the levels decreased as the distance from the tunnel site increased, and the rate of the decrease in the water level slowed as the distance from the tunnel increased.
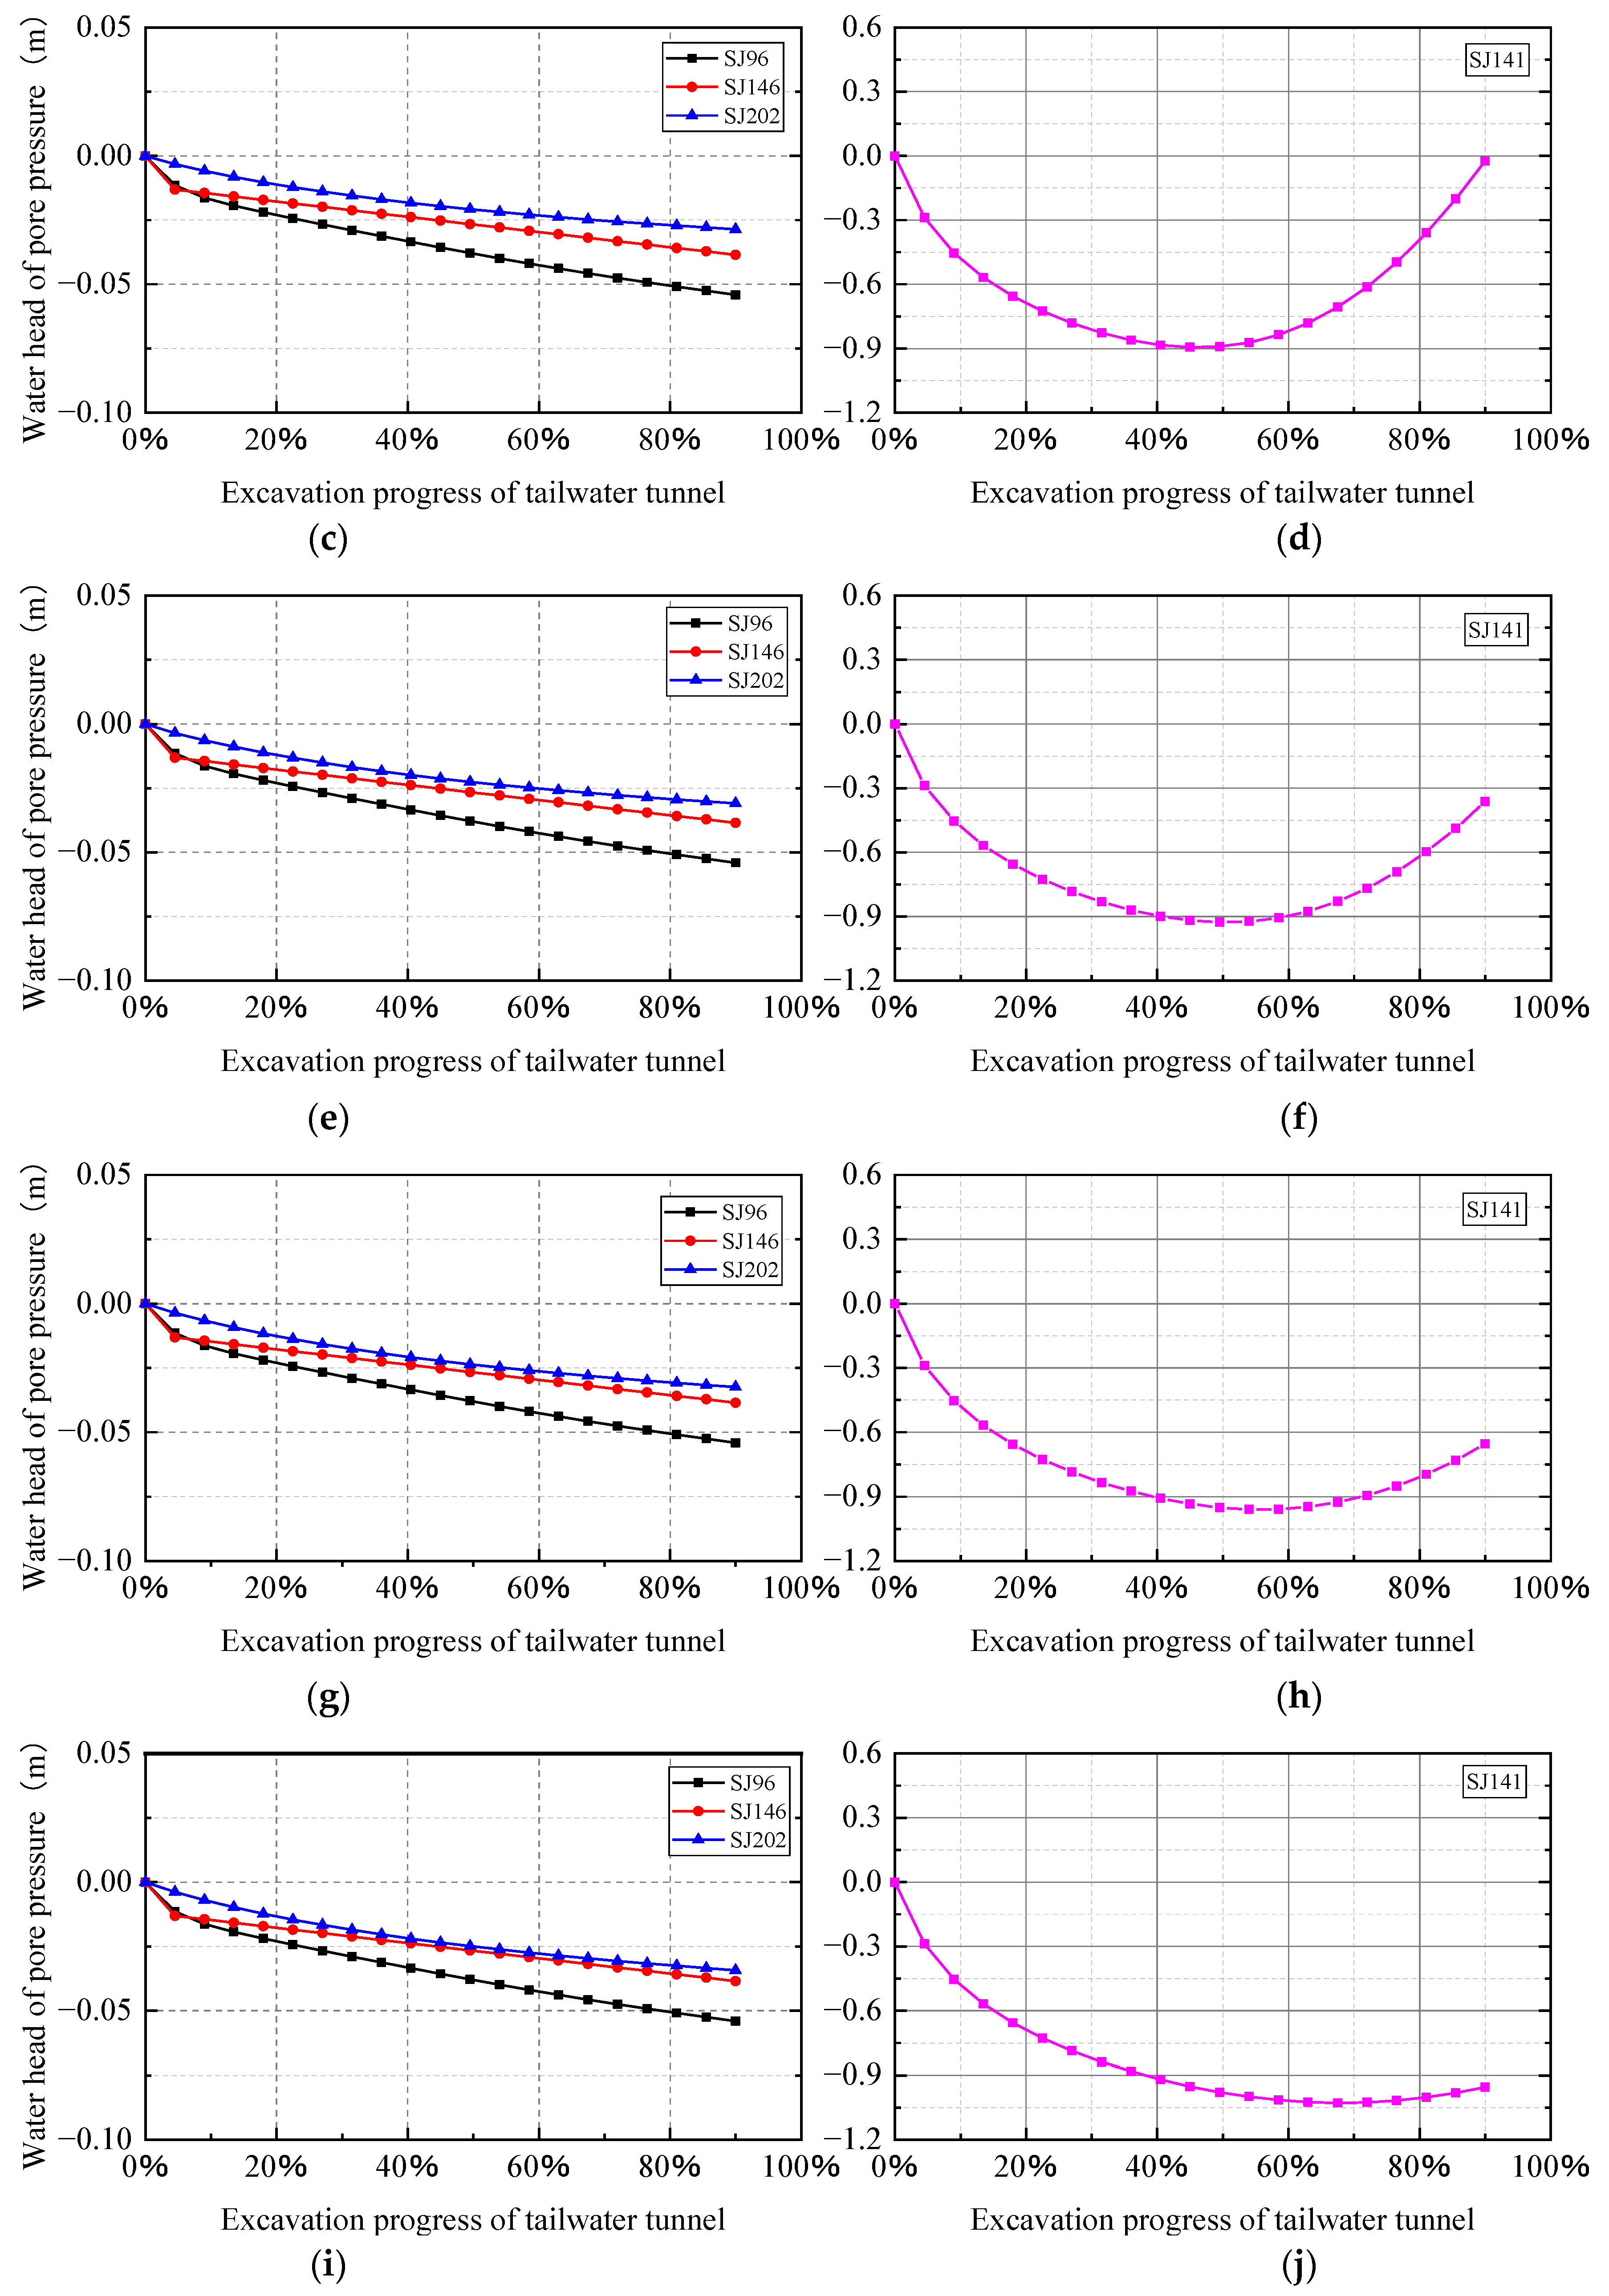
Figure 11a,c,e,g,i show that the water level decreased as the maximum transient flow increased. The water levels in well point SJ202 decreased by 0.025, 0.029, 0.031, 0.032, and 0.034 m for the five seepage control schemes.
The water level in well point SJ141 first decreased and then increased as the tunnel excavation progressed, as shown in
Figure 11b. Because of the excavation of the tunnel, a water inrush channel formed, the groundwater circulation system was disrupted, the groundwater seepage to the tunnel accumulated at a certain distance from the tunnel excavation, and the water level of the well point SJ141 decreased. As the distance from the tunnel excavation increased, the water inflow also increased, and the area of groundwater affected also increased. There was a large range in the distance of the groundwater seepage flows at places close to the tunnel (such as well point SJ141), resulting in temporary increases in the water level at well point SJ141. Across the whole process, the water level at well point SJ141 dropped by a maximum of 0.861 m.
As shown in
Figure 11b,d,f,h,j, when the maximum water inflow of the tunnel increased from 200 m
3/d to 400, 600, 800, and 1000 m
3/d in turn, the water level in well point SJ141 first decreased and then gradually started to increase (
Figure 11b) and then decreased slowly (
Figure 11j). When the tunnel water inflow increased to a certain level, there was not enough groundwater in the immediate area to quickly supplement the head loss at well point SJ141, which then caused the water level of well point SJ141 to decrease slowly. The maximum water level decreases at well point SJ141 were 0.861, 0.894, 0.927, 0.959, and 1.028 m (
Figure 11b,d,f,h,j).
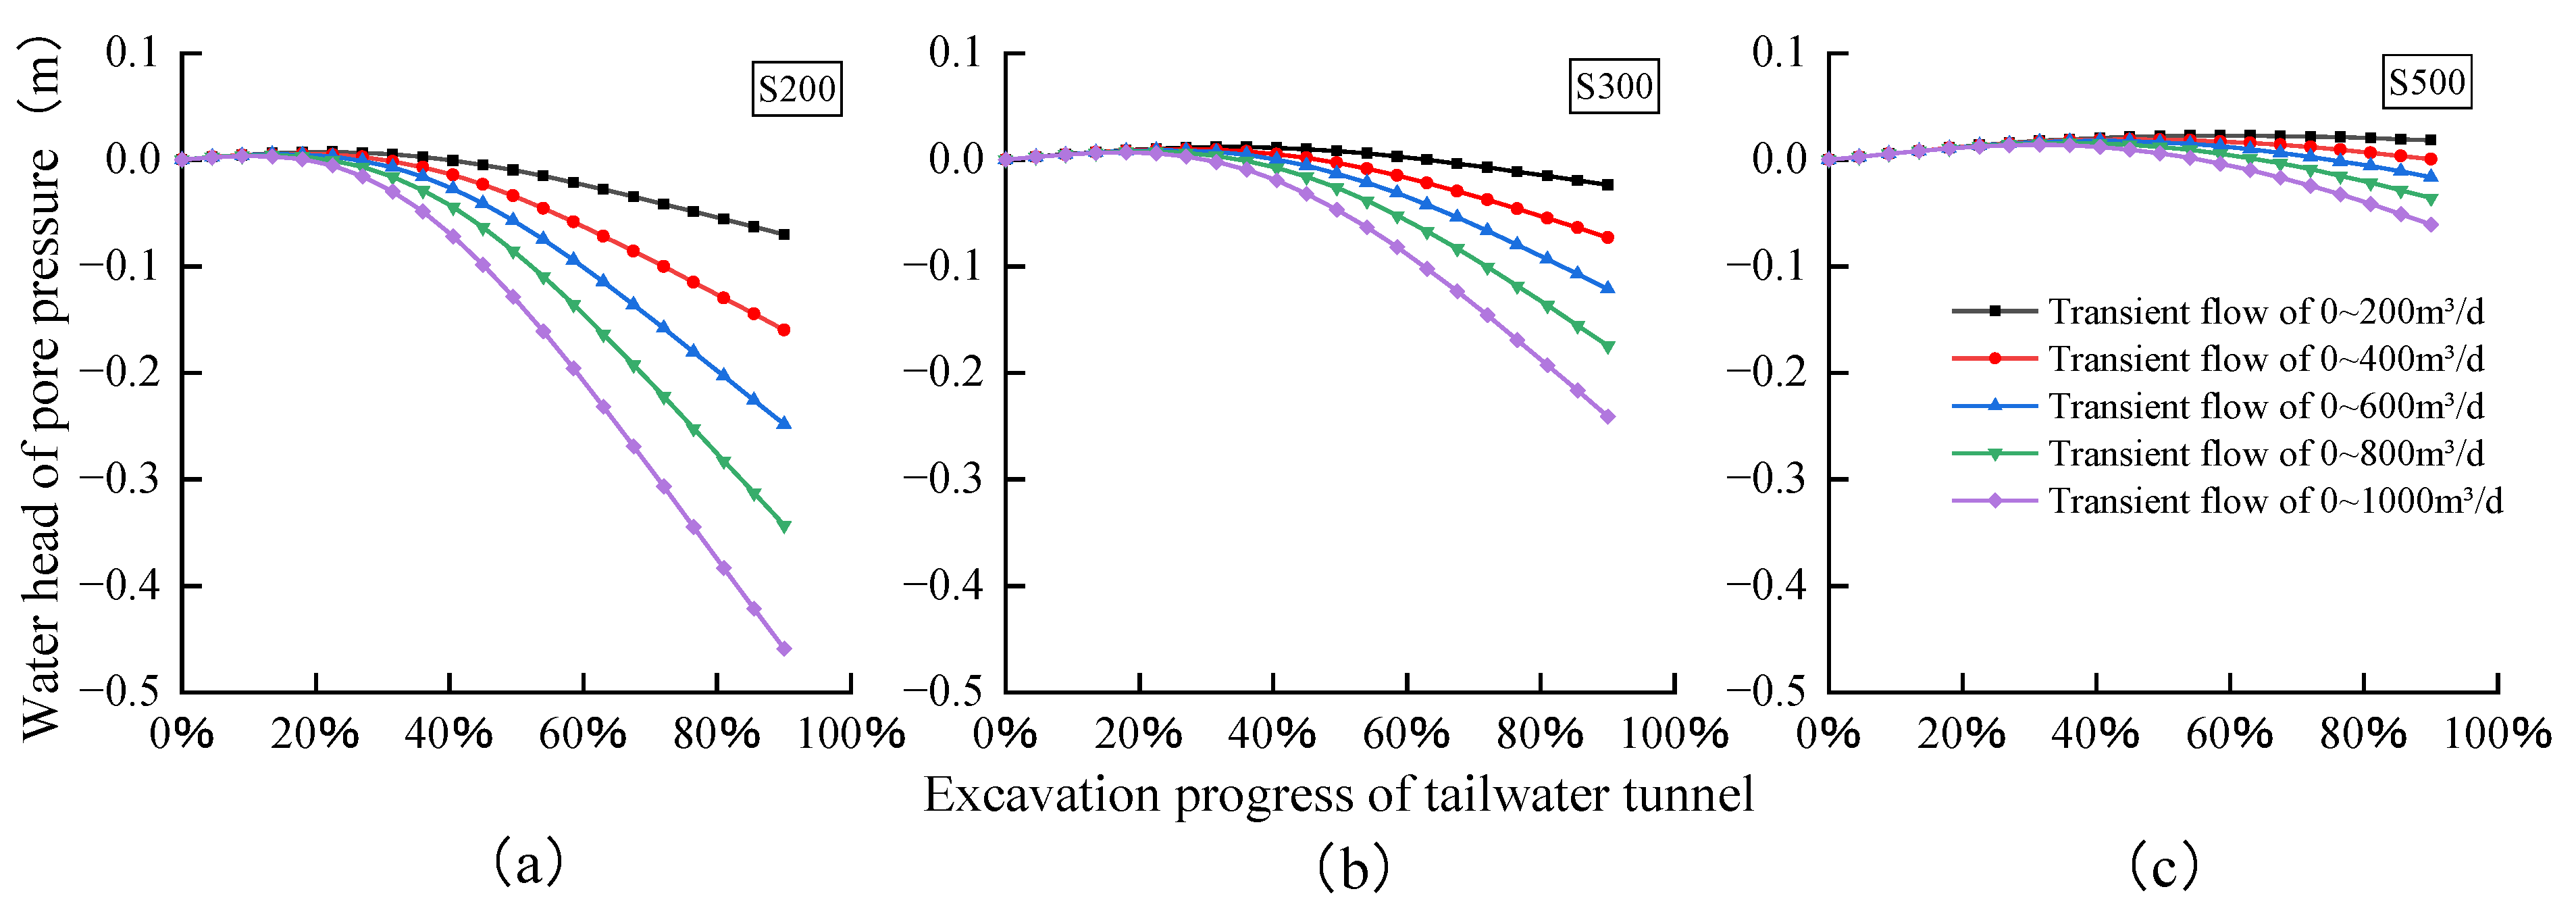
The variations in the groundwater seepage field within 200 (S200), 300 (S300), and 400 m (S400) from the tunnel axis for the five seepage control schemes were simulated to provide qualitative information on how groundwater was impacted at different distances from the tunnel excavation. As shown in
Figure 12, the excavation of the tunnel strongly influenced the groundwater seepage field at S200 and S300. When the maximum water inflow was 200 m
3/d, the water levels at S200 and S300 decreased by 0.070 and 0.024 m, respectively. As the water inflow increased, the decreases in the water levels were greater. When the water inflow reached 1000 m
3/d, the water levels at S200 and S300 decreased by 0.459 and 0.241 m, respectively. The groundwater level at S500 was only slightly affected by the excavation of the tunnel, as it was far from the tunnel axis. When the water inflow reached 1000 m
3/d, the water level only decreased by 0.061 m.
4.4. The Extent of the Influence on the Seepage Field
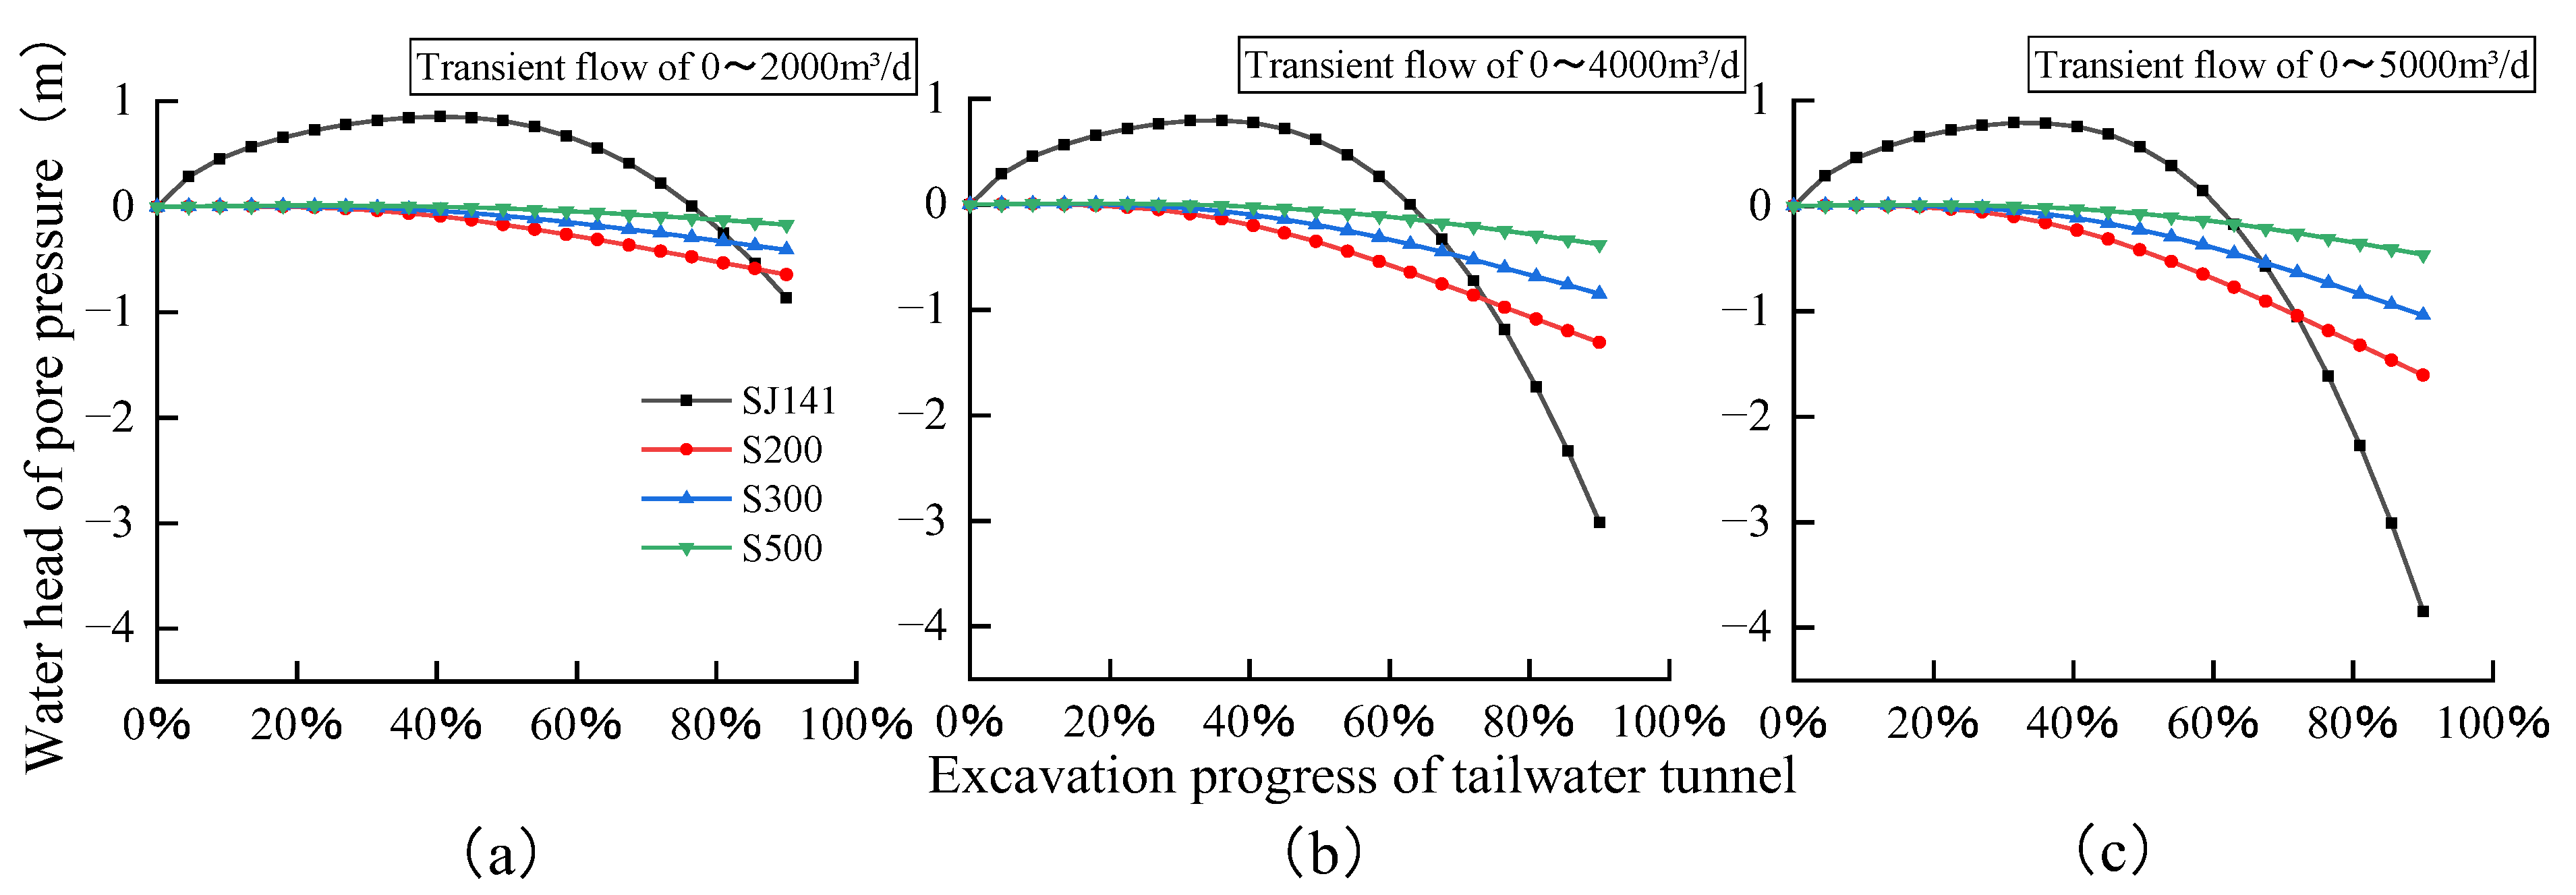
As the tunnel excavation progressed, the water inflow to the tunnel gradually increased. The maximum water inflow in the simulations was increased to 2000, 4000, and 5000 m3/d, respectively, to gain information that could be used to help prevent accidents and avoid any risks from water inflow accidents during the tunnel construction. The distance to which the tunnel excavation affected the groundwater was qualitatively analyzed, the changes in the pore water pressure head caused by the tunnel excavation by distance were quantitatively assessed, and a formula was derived to quantify the distance of the influence.
The variations in the groundwater seepage field were simulated at 101 (SJ141), 200 (S200), 300 (S300), and 400 m (S400) from the tunnel axis under limiting seepage conditions. As shown in
Figure 13, it can be seen that, for the three transient inflows, the water level at SJ141 fluctuated most and first increased and then decreased sharply. Because of the large water inflow, the groundwater flows to the tunnel affected a large area. As the water inflow channel continued to increase, the water inflow also continued to increase, thereby causing the water level at SJ141 to decrease sharply. For a maximum water inflow of 5000 m
3/d, the maximum water level at SJ141 was 3.842 m. There is a chance that engineering accidents may occur when a seepage channel forms and the water inflow increases; for example, the rock surrounding the tunnel could decrease, or the top of the tunnel could collapse. To account for these possible scenarios, scenarios for water inflows of more than 800 m
3/d were simulated and quantified.
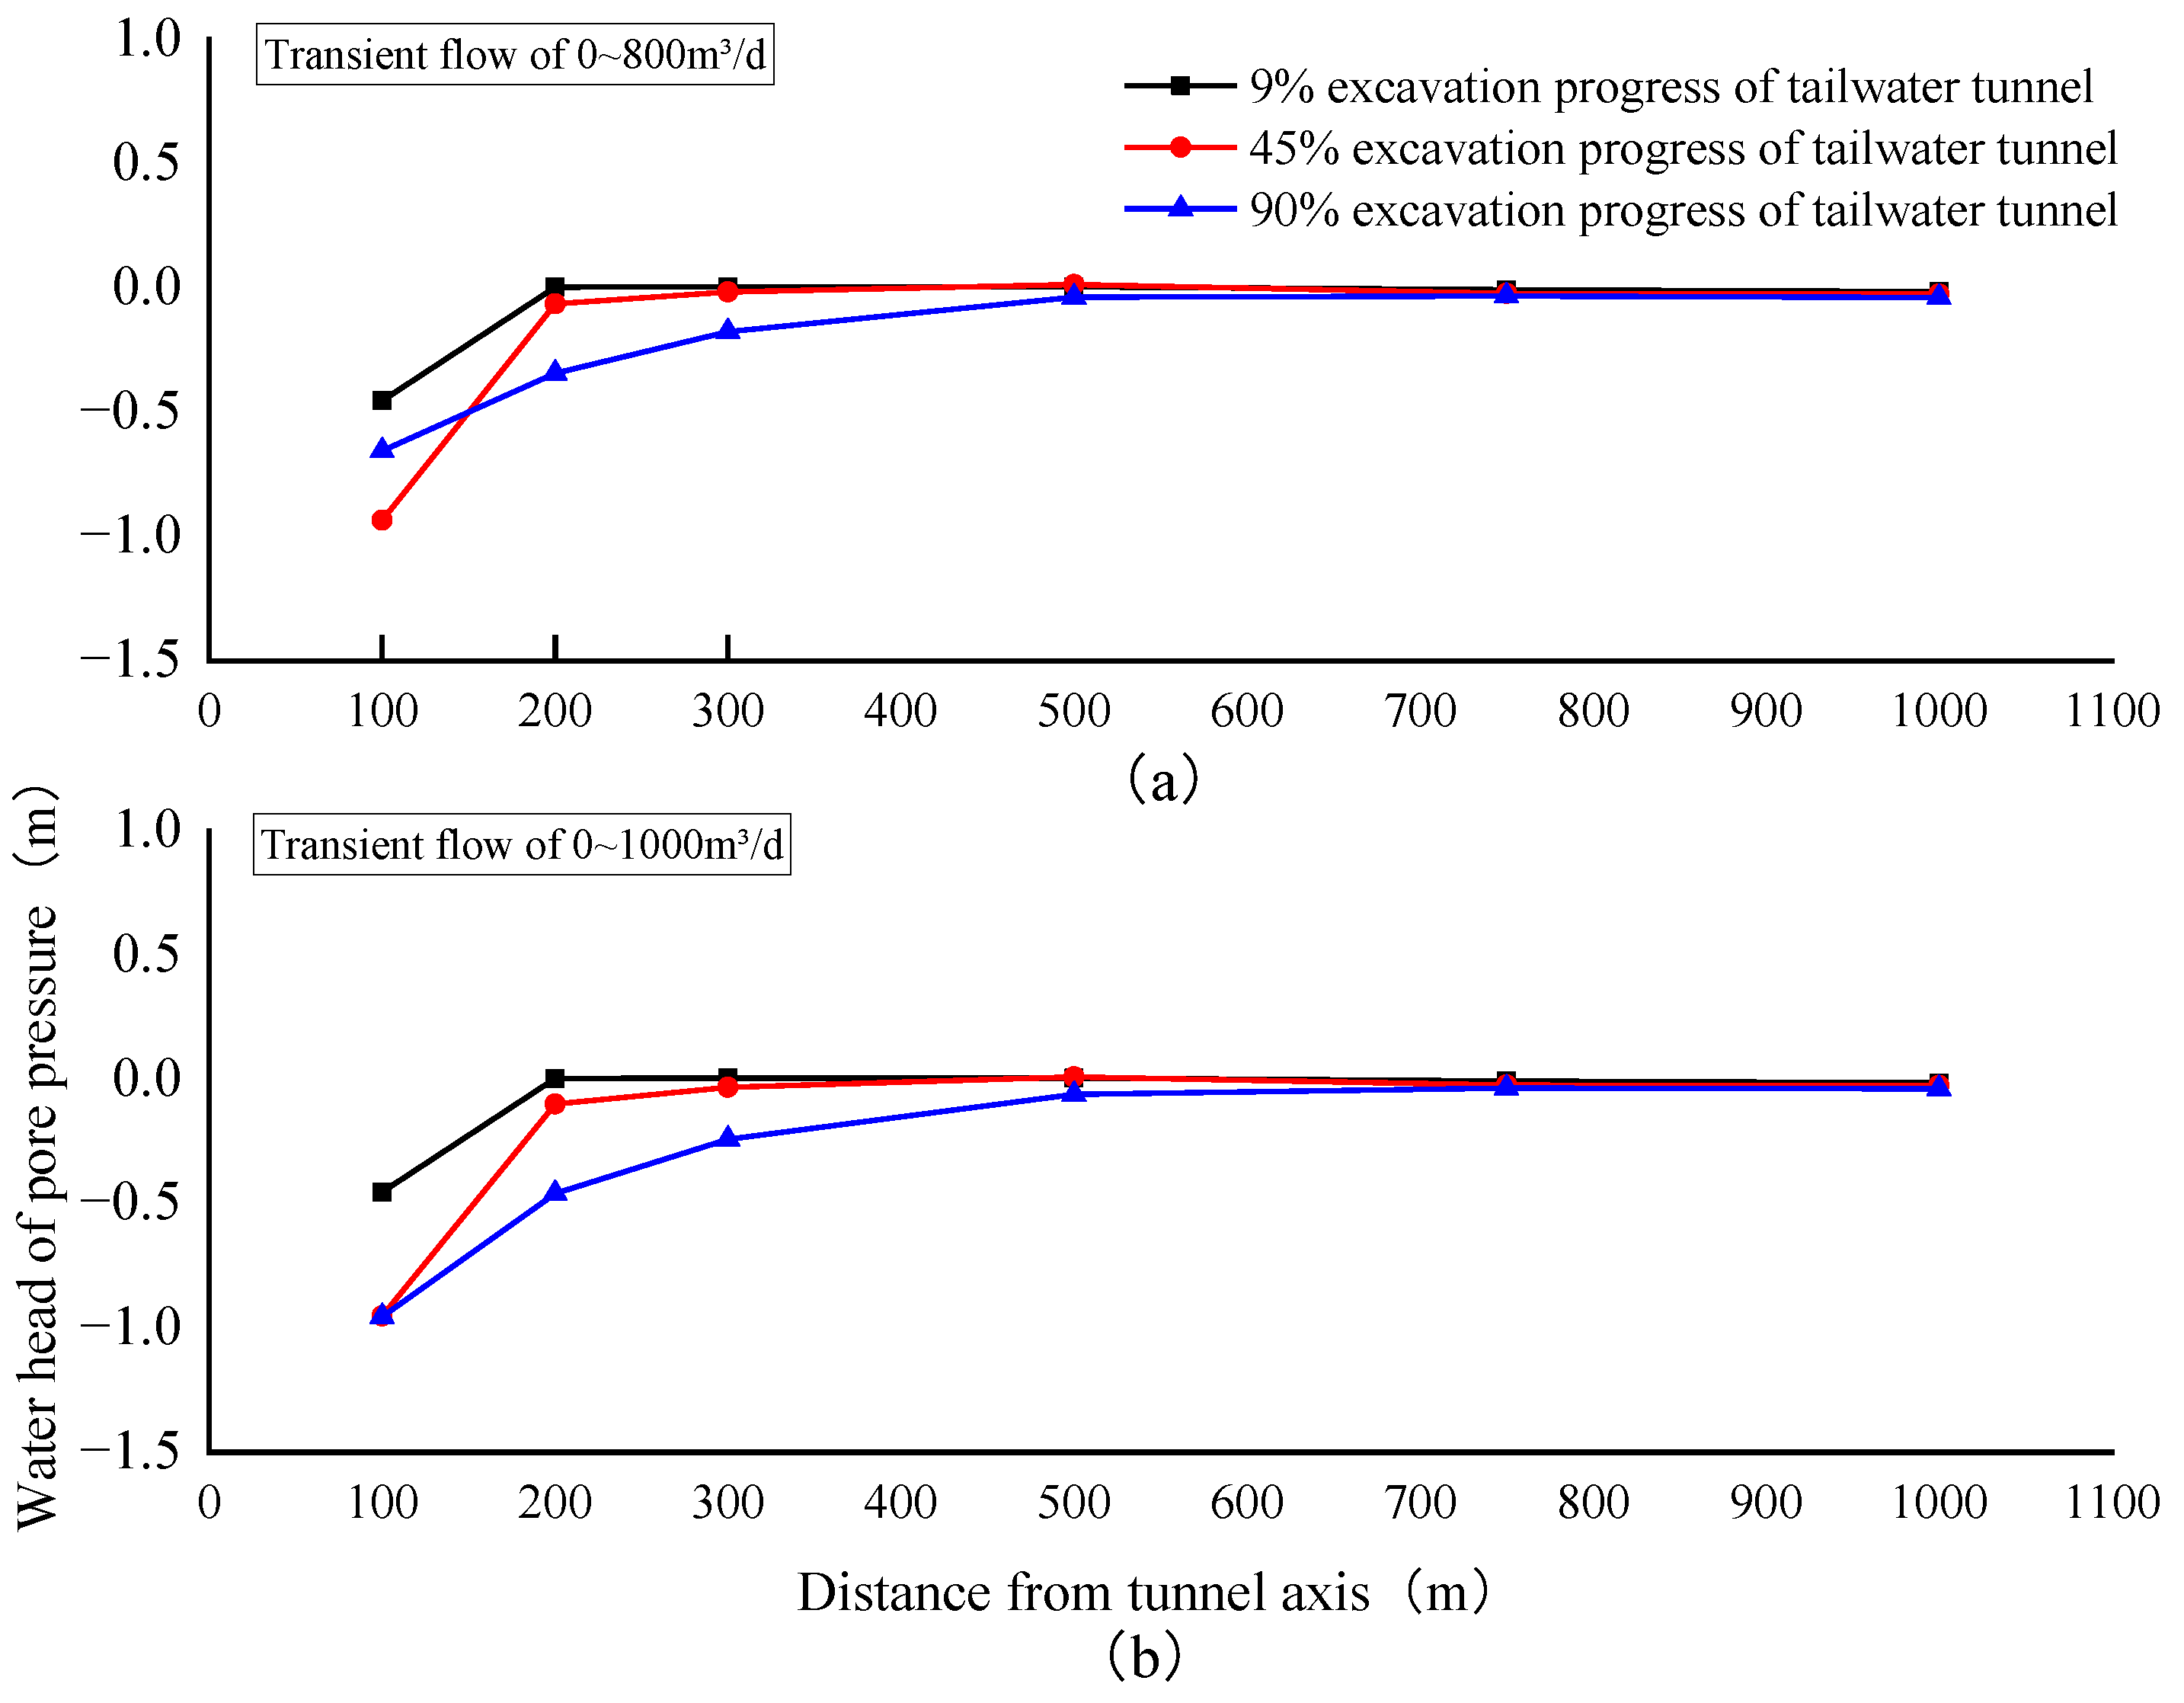
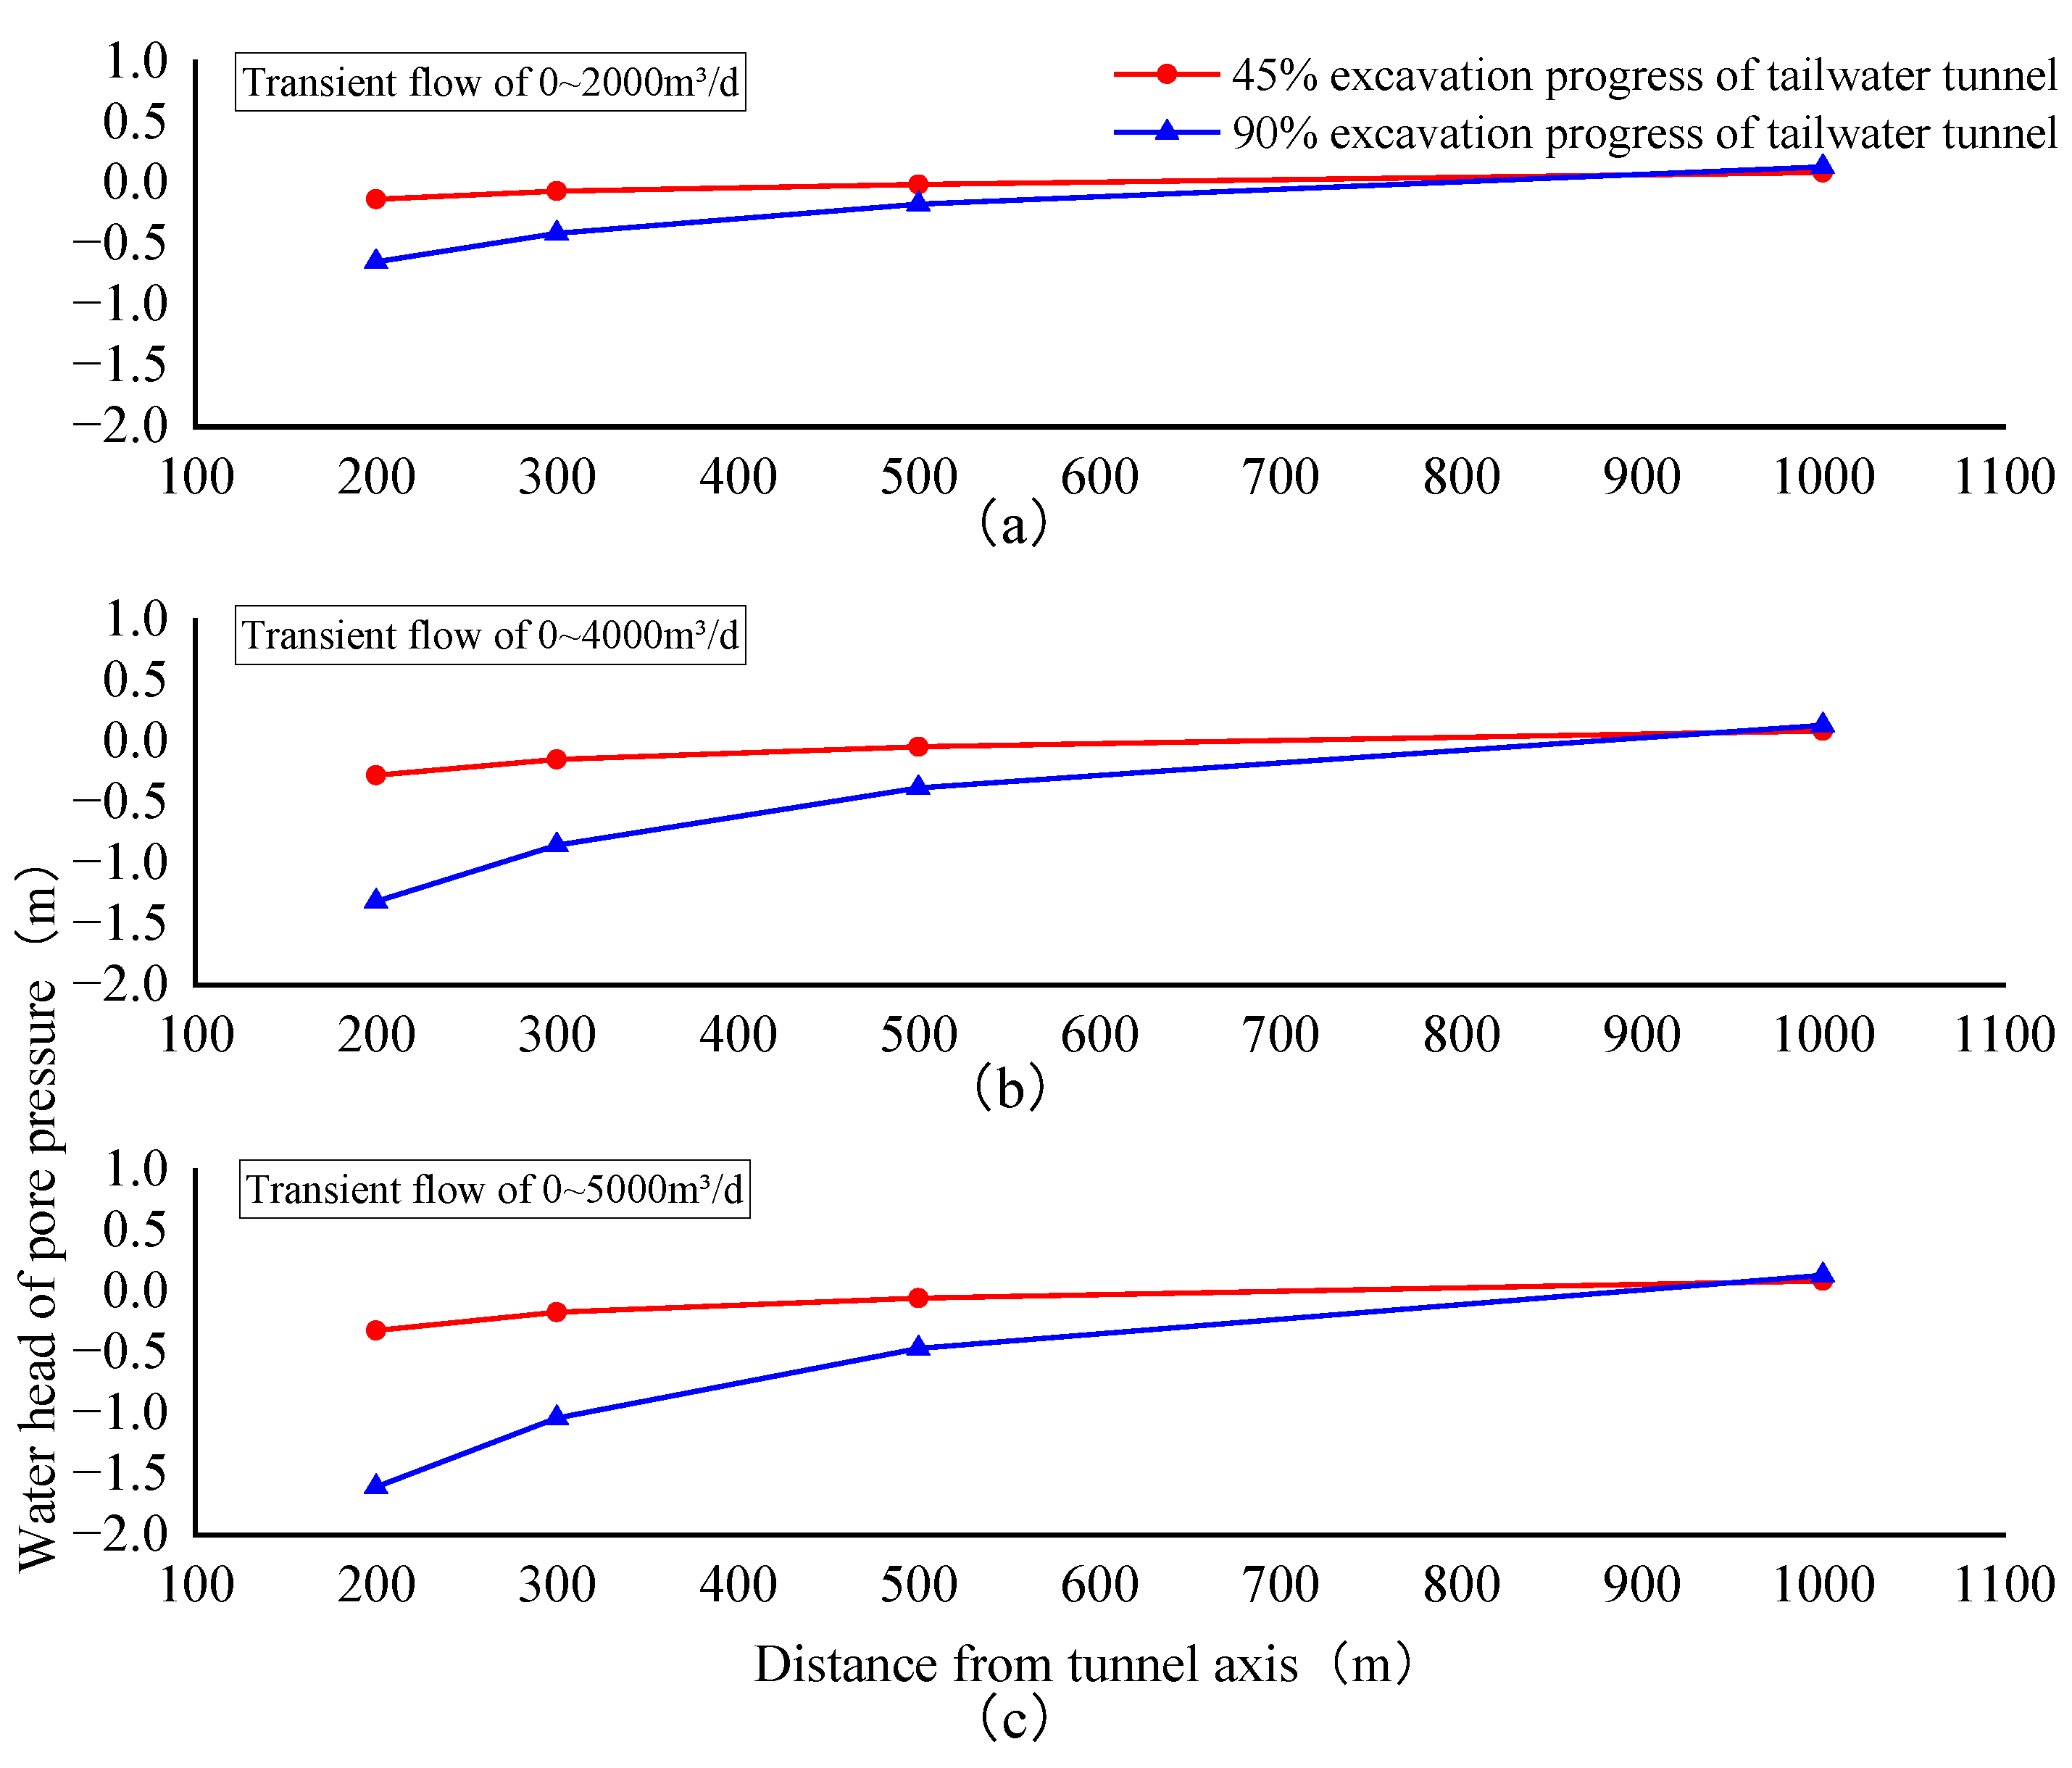
Given the potential influence of water inflows greater than 800 m
3/d on the project, the range of the influence of the tunnel excavation on groundwater was determined from the data from the inversion model, and a formula for calculating the range of the influence under different water inflows was derived. As shown in
Figure 14 and
Figure 15, as the tunnel excavation progressed, the groundwater gradually decreased. When the maximum water inflow was 1000 m
3/d, the water level at a distance of 100 m from the tunnel axis decreased by 0.956 m. For a maximum water inflow of 5000 m
3/d, the water level at 200 m from the tunnel axis decreased by 1.604 m.
Figure 14 and
Figure 15 also show that the pore pressure head gradually decreased until it stabilized as the distance from the axis of the tunnel increased, meaning that it was not affected by the tunnel excavation.
The formula for calculating the range of the influence of the tunnel excavation on the groundwater can be uniformly expressed as:
where
is the distance from hole axis, m, and h is the pore pressure head, m. When h is 0, the pore pressure water is not affected by the tunnel excavation, and
is the linear distance to which the pore pressure water is affected by the tunnel excavation.
Regression analysis based on the least squares method was applied to the calculated data from the inverted model, and a formula was derived to show the range of the influence of the tunnel excavation on the groundwater, as shown in
Table 4.
5. Discussion
This study was initially designed to explore why drinking water had become depleted close to a construction site. The research area was defined by the extent of the initial hydrogeological survey. Field and laboratory experiments were carried out, and the results were combined to produce parameters such as the elastic modulus, Poisson’s ratio, cohesion, the friction angle, and the permeability coefficient. A three-dimensional hydrogeological model was established from coordinates measured in three dimensions. A three-dimensional inversion method was used to verify the reliability of the model with natural seepage fields and high values for pore water. The distance to which groundwater was affected by increases in the water inflow in the tailwater tunnel was then predicted. Based on the patterns of change in the simulated water level, the least squares method was used for data fitting, and a formula was proposed for calculating the distance and extent to which groundwater was influenced for a range of water inflow scenarios.
Groundwater flow field: the average error of simulated water level is 1.98%; Long-term monitoring of water level: the average error of simulated water level is 0.16%. In this study, the impact of the tailwater tunnel excavation on groundwater was quantified. This represents the first step of the research. Further studies will explore the feasibility of using different methods for excavating the tunnel, and results from time–frequency domain analysis of the vibration effects and vibration energy will be combined to improve the accuracy of current knowledge about the degree and distance to which tunnel excavation might impact human settlements. These studies should contribute to achieving the goal of cleaner production, thereby achieving the goal of peak carbon and carbon neutrality.
6. Conclusions
In this study, a regional hydrogeological model was established by inverting the parameters of the natural flow field of a region. The model was then used to numerically simulate the distribution and variations in seepage fields that formed during the tunnel excavation under normal seepage conditions and limiting seepage conditions. The model was validated, and error analysis showed that the approach was suitable. The results for the two seepage conditions were compared to understand the range of the influence on the groundwater flow, and a formula was proposed to calculate the distance and degree to which groundwater was affected by the tunnel excavation.
The main conclusions of this study are as follows.
(1) The project is located in a mountainous area with complex topography, so it is impossible to analyze or assess the geology and hydrogeology of the whole study area. Here, from a field investigation, in situ tests, laboratory tests, and numerical simulations, an inverted model was established and verified, and simulations were produced to facilitate a study of how the tunnel excavation influenced groundwater in the area. This novel approach could be used for further studies of seepage fields in hydraulic tunnels.
(2) To understand the depletion of domestic wells and to determine what caused the seepage in the regional flow field, the changes in the water level at different well points were quantified. The results showed that after the tailwater tunnel was excavated, the groundwater levels in well points SJ96, SJ146, and SJ202 dropped to 0.054, 0.039, and 0.025 m, respectively.
(3) The distance to which the tunnel construction affected the groundwater was then quantified. From these results, the variations in the groundwater flow field in the engineering area for different water inflow scenarios were simulated. The results showed that, for water inflows of 200, 400, 600, 800, and 1000 m3/d, the water level of SJ141 dropped by 0.861, 0.894, 0.927, 0.959, and 1.028 m, respectively, and the water level of well point SJ202 decreased by 0.025, 0.029, 0.031, 0.032, and 0.034 m, respectively.
(4) The influence of limiting seepage conditions on the seepage field at different distances in the engineering area was then analyzed, and a formula was derived for calculating the distance to which groundwater was affected for a range of different water inflows. A ‘smart site’ was established using the simulation outputs and real-time water level data from the three observation holes, ZK01, ZK02, and ZK03, to provide visual information and support the project management.
(5) In following studies, data for the vibration effects of tunnel drilling and blasting will be combined with time–frequency domain analysis to obtain improved information about the degree and distance to which the tunnel excavation affects human settlements. Further studies will also contribute to achieving a goal of cleaner production, which will then help to realize the goal of peak carbon and carbon neutrality.
Author Contributions
Conceptualization, T.J.; Data curation, X.P.; Funding acquisition, T.J.; Investigation, X.P., W.W., L.L., and S.G.; Methodology, T.J. and X.P.; Project administration, T.J.; Software, X.P.; Supervision, T.J.; Validation, X.P.; Writing—original draft, X.P.; Writing—review and editing, X.P. All authors have read and agreed to the published version of the manuscript. All authors have read and agreed to the published version of the manuscript.
Funding
This research was funded by the National Natural Science Foundation of China (Grant number 42090052) and the Henan Institution of Higher Education Key Scientific Research Project (22A170013). And The APC was funded by the National Natural Science Foundation of China.
Institutional Review Board Statement
Not applicable.
Informed Consent Statement
Not applicable.
Data Availability Statement
The data used to support the findings of this study are included within the article.
Acknowledgments
In the field investigation, Xiangjing Lu provided much assistance in the fieldwork, which positively influenced the safety and physical and mental health of the investigators. We would like to express our heartfelt thanks to Xiangjing Lu for his assistance in this work.
Conflicts of Interest
The authors declare that they have no conflict of interest.
References
- Tang, Y.G.; Zhang, Q.; Qi, J.H.; Xu, M.; Li, X.; Qu, C.H.; Yi, L.; Wang, D. Change Analysis of Karst Landforms, Hydrogeological Conditions and Effects of Tunnel Excavation on Groundwater Environment in Three Topography Grades in China. Water 2023, 15, 207. [Google Scholar] [CrossRef]
- Liu, J.Q.; Sun, Y.K.; Li, C.J.; Yuan, H.L.; Chen, W.Z.; Liu, X.Y.; Zhou, X.S. Field monitoring and numerical analysis of tunnel water inrush and the environmental changes. Tunn. Undergr. Space Technol. 2022, 122, 104360. [Google Scholar] [CrossRef]
- Zheng, Z.; Liu, R.; Li, S.; Zhang, Q. Tunnel face failure mechanism with sand layer partial collapse. Arab. J. Geosci. 2020, 13, 1077. [Google Scholar] [CrossRef]
- Yu, J.; Ge, S.; Hou, L.; Zhang, Y.; Liu, Y. Limit Drainage of Separated Tunnel Based on Ecological Groundwater Table: A Case Study. Adv. Civ. Eng. 2021, 2021, 2669924. [Google Scholar] [CrossRef]
- Liu, W.; Zhu, J.; Zhang, H.; Ma, X.; Xie, J. Geological conditions of saturated soft loess stratum and influence of tunnel excavation and dewatering system on its groundwater environment. Bull. Eng. Geol. Environ. 2022, 81, 128. [Google Scholar] [CrossRef]
- Wu, J.; Lu, Y.; Wu, L.; Han, Y.; Sun, M. Numerical Investigation of Water Inflow Characteristics in a Deep-Buried Tunnel Crossing Two Overlapped Intersecting Faults. Water 2023, 15, 479. [Google Scholar] [CrossRef]
- Fang, H.; Zhu, J.T.; Qiu, J.R.; Su, Y.M.; Xia, D. Laminar and turbulent groundwater flows in confined two- and three-dimensional discrete fracture networks. Eng. Geol. 2022, 308, 106824. [Google Scholar] [CrossRef]
- Zhang, Z.; Zhang, M.; Li, Z.; Zhao, Q.; Pan, Y.; Wang, J. Distribution for hydraulic head on tunnel structures in water-rich mountainous region considering influences of fault geology using virtual image technique. Environ. Earth Sci. 2021, 80, 528. [Google Scholar] [CrossRef]
- Huang, D.; Huang, W.-B.; Ke, C.-Y.; Song, Y.-X. Experimental investigation on seepage erosion of the soil–rock interface. Bull. Eng. Geol. Environ. 2021, 80, 3115–3137. [Google Scholar] [CrossRef]
- Wang, Y.; Li, Z.; Jing, H.; Li, Y.; Wang, M. Study on the seepage characteristics of deep buried tunnels under variable high-pressure water heads. Bull. Eng. Geol. Environ. 2020, 80, 1477–1487. [Google Scholar] [CrossRef]
- Liu, J.; Liu, D.; Song, K. Evaluation of the Influence Caused by Tunnel Construction on Groundwater Environment: A Case Study of Tongluoshan Tunnel, China. Adv. Mater. Sci. Eng. 2015, 2015, 149265. [Google Scholar] [CrossRef]
- Chen, L.; Wang, Z.-F.; Wang, Y.; Bai, X.; Lai, J. Characteristics and failure analysis of a railway tunnel collapse influenced by cavity in phyllite strata. Eng. Fail. Anal. 2022, 142, 106794. [Google Scholar] [CrossRef]
- Intui, S.; Inazumi, S.; Soralump, S. Evaluation of Land Subsidence during Groundwater Recovery. Appl. Sci. 2022, 12, 7904. [Google Scholar] [CrossRef]
- Chen, N.-C.; Wen, H.-Y.; Li, F.-M.; Hsu, S.-M.; Ke, C.-C.; Lin, Y.-T.; Huang, C.-C. Investigation and Estimation of Ground-water Level Fluctuation Potential: A Case Study in the Pei-Kang River Basin and Chou-Shui River Basin of the Taiwan Mountainous Region. Appl. Sci. 2022, 12, 7060. [Google Scholar] [CrossRef]
- Liu, J.-Q.; Liu, C.; Liu, X.-Y.; Wang, S.; Yuan, H.-L.; Li, C.-J.; Dong, J.-L. Prediction of water–mud inrush hazard from weathered granite tunnel by an improved seepage erosion model. Bull. Eng. Geol. Environ. 2021, 80, 9249–9266. [Google Scholar] [CrossRef]
- Wang, S.; Zhang, Q.; Zhao, L.; Jin, Y.; Qian, J. Seepage Characteristics Study of Single Rough Fracture Based on Numerical Simulation. Appl. Sci. 2022, 12, 7328. [Google Scholar] [CrossRef]
- Preisig, G.; Dematteis, A.; Torri, R.; Monin, N.; Milnes, E.; Perrochet, P. Modelling Discharge Rates and Ground Settlement Induced by Tunnel Excavation. Rock Mech. Rock Eng. 2014, 47, 869–884. [Google Scholar] [CrossRef]
- Heuer, R.E. Estimating rock tunnel water inflow. Rapid Excav. Tunn. Conf. 1995, 41–60, 10459065. [Google Scholar]
- Raymer, J. Groundwater inflow into hard rock tunnels. Tunn. Tunn. Int. 2001, 33, 50–53. [Google Scholar]
- Wu, Z.; Fang, F.; Li, X.; Xiao, H.; Liu, X.; Rao, Y.; Li, Y.; Wang, J.; Luo, Y.; Li, Z. Division Method and Seepage Law of Seepage Channels in a Tight Reservoir. Geofluids 2015, 2021, 4804513. [Google Scholar] [CrossRef]
- Dong, T.; Cao, P.; Gui, R.; Lin, Q.; Liu, Z. Experimental Study on Permeability Coefficient in Layered Fine Tailings under Seepage Condition. Geofluids 2021, 2021, 8850138. [Google Scholar] [CrossRef]
- Wang, W.; Xue, J.; Qingyang, H.; Jiang, T.; Dong, J. Dynamic and Static Reserve Recharge Characteristics of a Dewatering Well Seepage from an Aquifer Bottom by Sand Tank Seepage Experiment. Geofluids 2022, 2022, 3971570. [Google Scholar] [CrossRef]
- Qiu, J.; Zheng, D.; Zhu, K. Seepage Monitoring Models Study of Earth-Rock Dams Influenced by Rainstorms. Math. Probl. Eng. 2016, 2016, 1656738. [Google Scholar] [CrossRef]
- Ma, H.F.; Yao, F.F.; Niu, X.G.; Guo, J. Experimental Study on Seepage Characteristics of Fractured Rock Mass under Different Stress Conditions. Geofluids 2021, 2021, 6381549. [Google Scholar]
- Chae, G.-T.; Yun, S.-T.; Choi, B.-Y.; Yu, S.-Y.; Jo, H.-Y.; Mayer, B.; Kim, Y.-J.; Lee, J.-Y. Hydrochemistry of urban groundwater, Seoul, Korea: The impact of subway tunnels on groundwater quality. J. Contam. Hydrol. 2008, 101, 42–52. [Google Scholar] [CrossRef] [PubMed]
- Gisbert, J.; Vallejos, A.; González, A.; Bosch, A.P. Environmental and hydrogeological problems in karstic terrains crossed by tunnels: A case study. Environ. Geol. 2009, 58, 347–357. [Google Scholar] [CrossRef]
- Vincenzi, V.; Gargini, A.; Goldscheider, N. Using tracer tests and hydrological observations to evaluate effects of tunnel drainage on groundwater and surface waters in the Northern Apennines (Italy). Hydrogeol. J. 2009, 17, 135–150. [Google Scholar] [CrossRef]
- Li, H.; Kagami, H. Groundwater level and chemistry changes resulting from tunnel construction near Matsumoto City, Japan. Environ. Geol. 1997, 31, 76–84. [Google Scholar]
- Bai, Y.; Wu, Z.; Huang, T.; Peng, D. A Dynamic Modeling Approach to Predict Water Inflow during Karst Tunnel Excavation. Water 2022, 14, 2380. [Google Scholar] [CrossRef]
- Zheng, X.; Yang, Z.; Wang, S.; Chen, Y.-F.; Hu, R.; Zhao, X.-J.; Wu, X.-L.; Yang, X.-L. Evaluation of hydrogeological impact of tunnel engineering in a karst aquifer by coupled discrete-continuum numerical simulations. J. Hydrol. 2021, 597, 125765. [Google Scholar] [CrossRef]
- Huang, Z.; Zhao, K.; Li, X.Z.; Zhong, W.; Wu, Y. Numerical characterization of groundwater flow and frac-ture-induced water inrush in tunnels. Tunn. Undergr. Space Technol. 2021, 116, 104119. [Google Scholar] [CrossRef]
- Dou, H.-Q.; Han, T.-C.; Gong, X.-N.; Qiu, Z.-Y.; Li, Z.-N. Effects of the spatial variability of permeability on rainfall-induced landslides. Eng. Geol. 2015, 192, 92–100. [Google Scholar] [CrossRef]
- Yang, T.; Liu, H.; Tang, C. Scale effect in macroscopic permeability of jointed rock mass using a coupled stress–damage–flow method. Eng. Geol. 2017, 228, 121–136. [Google Scholar] [CrossRef]
- Tang, M.; Xu, Q.; Yang, H.; Li, S.; Iqbal, J.; Fu, X.; Huang, X.; Cheng, W. Activity law and hydraulics mechanism of landslides with different sliding surface and permeability in the Three Gorges Reservoir Area, China. Eng. Geol. 2019, 260, 105212. [Google Scholar] [CrossRef]
Figure 1.
Regional geological structure of the area close to the Wuyue power station.
Figure 1.
Regional geological structure of the area close to the Wuyue power station.
Figure 2.
A three-dimensional digital elevation model of the engineering area.
Figure 2.
A three-dimensional digital elevation model of the engineering area.
Figure 3.
Geological structure and drilling layout of engineering area.
Figure 3.
Geological structure and drilling layout of engineering area.
Figure 4.
The scope of the hydrogeological survey and the water level isoline.
Figure 4.
The scope of the hydrogeological survey and the water level isoline.
Figure 5.
Groundwater occurrence along the A–A’ transect.
Figure 5.
Groundwater occurrence along the A–A’ transect.
Figure 6.
Three-dimensional hydrogeological model.
Figure 6.
Three-dimensional hydrogeological model.
Figure 7.
Hydrogeological model subdivision.
Figure 7.
Hydrogeological model subdivision.
Figure 8.
Comparison of (a) the natural seepage field and (b) the simulated seepage field.
Figure 8.
Comparison of (a) the natural seepage field and (b) the simulated seepage field.
Figure 9.
Comparison of the measured water level and the calculated water level. ((a) is comparison of measured and calculated groundwater flow field values, (b) is comparison of measured and calculated water level in long-term observation hole). (c) is comparison of measured and calculated water level in long—term observation hole ZK02, (d) is comparison of measured and calculated water level in long—term observation hole ZK03).
Figure 10.
Water level changes in the long observation holes under different transient flows.
Figure 10.
Water level changes in the long observation holes under different transient flows.
Figure 11.
Changes in the water level for the different water inflow conditions. ((a) and (b) are changes in water level of the maximum water inflow of 200 m3/d, (c) and (d) are the variation of water level for the maximum water inflow of 400 m3/d, (e) and (f) are the changes in water level when the maximum inflow is 600 m3/d, (g) and (h) are the changes of water level when the maximum water inflow is 800 m3/d, (i) and (j) are the changes of water level when the maximum water inflow is 1000 m3/d).
Figure 12.
Variations in the water level at different distances under normal seepage conditions. ((a) is change of water level at 200m from the axis of the tunnel, (b) is change of water level at 300m from the axis of the tunnel, (c) is change of water level at 500m from the axis of the tunnel).
Figure 12.
Variations in the water level at different distances under normal seepage conditions. ((a) is change of water level at 200m from the axis of the tunnel, (b) is change of water level at 300m from the axis of the tunnel, (c) is change of water level at 500m from the axis of the tunnel).
Figure 13.
Variations in the water level at different distances under limiting seepage conditions. ((a) is change in water level of the maximum water inflow of 2000 m3/d, (b) is change in water level of the maximum water inflow of 4000 m3/d, (c) is change in water level of the maximum water inflow of 5000 m3/d).
Figure 14.
Variations in the water level under normal seepage conditions. ((a) is change in water level of the maximum water inflow of 800 m3/d, (b) is change in water level of the maximum water inflow of 1000 m3/d).
Figure 14.
Variations in the water level under normal seepage conditions. ((a) is change in water level of the maximum water inflow of 800 m3/d, (b) is change in water level of the maximum water inflow of 1000 m3/d).
Figure 15.
Variations in the water level under limiting seepage conditions. ((a) is change in water level of the maximum water inflow of 2000 m3/d, (b) is change in water level of the maximum water inflow of 4000 m3/d, (c) is change in water level of the maximum water inflow of 5000 m3/d).
Figure 15.
Variations in the water level under limiting seepage conditions. ((a) is change in water level of the maximum water inflow of 2000 m3/d, (b) is change in water level of the maximum water inflow of 4000 m3/d, (c) is change in water level of the maximum water inflow of 5000 m3/d).
Table 1.
Summary statistics of the weathered depths of the drilled holes in the tailwater tunnel.
Table 1.
Summary statistics of the weathered depths of the drilled holes in the tailwater tunnel.
| Engineering Position | Boring Number | Orifice Height
(m) | Deep Hole
(m) | Coating Thickness
(m) | The Burial Depth of Lower Limit of Each Weathering Zone (m) | Note |
|---|
| Complete Weathering | Strong Weathering | Medium Weathering |
|---|
| Tailwater tunnel | ZK43 | 147.75 | 140.1 | 0 | 122.3 | 140.1 | — | Alteration zone |
| ZK49 | 131.6 | 90.15 | 9.6 | 90.15 | — | — | Alteration zone |
| ZK50 | 114.31 | 100.3 | 7.2 | 11.6 | 24.2 | — | Complete weathering and weak weathering alternate |
| ZK51 | 104.82 | 80.15 | 0.8 | 5.6 | 7.65 | 66.1 | The hole depth of 48.6–59.9 m shows strong weathering |
| ZK52 | 114.63 | 70.5 | 7 | 30.3 | 43.6 | 70.5 | — |
| ZK53 | 104.84 | 55.6 | 3.5 | 9.2 | 24.4 | 33.4 | — |
| Tailwater tunnel inlet/outlet | ZK54 | 96.48 | 45.4 | 6.3 | 21.4 | 28.1 | 45.4 | — |
| ZK55 | 91.9 | 45.4 | 3.3 | 13.5 | 14.8 | 40.2 | — |
| ZK56 | 102.22 | 35.5 | 7.5 | 16.8 | 21.9 | 32.5 | — |
| ZK57 | 93.93 | 45.7 | 3.8 | 8.1 | 12.6 | 35.5 | The hole depth of 35.5–45.2m shows strong weathering |
| ZK58 | 89.78 | 35.4 | 4.7 | 10.3 | 17.4 | 35.4 | — |
Table 2.
Permeability coefficient of each layer.
Table 2.
Permeability coefficient of each layer.
| Partition Number | The Permeability Coefficient of Principal Axis Direction (m/d) |
|---|
| | |
|---|
| 1 | 0.0232 | 0.0232 | 0.0232 |
| 2 | 2.592 × 10⁻⁷ | 2.592 × 10⁻⁷ | 2.592 × 10⁻⁷ |
| 3 | 72.0576 | 72.0576 | 72.0576 |
| 4 | 8.64 × 10⁻⁶ | 8.64 × 10⁻⁶ | 8.64 × 10⁻⁶ |
| 5 | 8.64 × 10⁻⁶ | 8.64 × 10⁻⁶ | 8.64 × 10⁻⁶ |
| 6 | 0.0415 | 0.0415 | 0.0415 |
Table 3.
Drained civilian Wells.
Table 3.
Drained civilian Wells.
| Well Number | Location | Distance from Tunnel Axis (m) | Wellhead Elevation (m) | Depth of Well (m) |
|---|
| SJ96 | Yangshuwan Village, south of the tunnel | 750 | 113.0937 | 6.9 |
| SJ97 | Yangshuwan Village, south of the tunnel | 790 | 110.3317 | 7.9 |
| SJ141 | Qiandawan village, south of the tunnel | 101 | 114.6467 | 15 |
| SJ142 | Qiandawan village, south of the tunnel | 105 | 115.8357 | 11 |
| SJ146 | Tulou Village, south of the tunnel | 1150 | 111.4187 | 8.8 |
| SJ202 | Yangmingao village, north of the tunnel | 1000 | 125.3427 | 7 |
Table 4.
Fitting formula of the range to which groundwater was influenced.
Table 4.
Fitting formula of the range to which groundwater was influenced.
| Maximum Inflow (m3/d) | Fitting Formula of Groundwater Influence Area | R2 |
|---|
| 800 | | 0.9338 |
| 1000 | | 0.9193 |
| 2000 | | 0.9948 |
| 4000 | | 0.9945 |
| 5000 | | 0.9943 |
| Disclaimer/Publisher’s Note: The statements, opinions and data contained in all publications are solely those of the individual author(s) and contributor(s) and not of MDPI and/or the editor(s). MDPI and/or the editor(s) disclaim responsibility for any injury to people or property resulting from any ideas, methods, instructions or products referred to in the content. |
© 2023 by the authors. Licensee MDPI, Basel, Switzerland. This article is an open access article distributed under the terms and conditions of the Creative Commons Attribution (CC BY) license (https://creativecommons.org/licenses/by/4.0/).


