Article

Assessment of Photosynthetic Carbon Capture versus Carbon Footprint of an Industrial Microalgal Process

by
Arthur Oliver
1,
Cristobal Camarena-Bernard
1,2,
Jules Lagirarde
1 and
Victor Pozzobon
1,*
1
Centre Européen de Biotechnologie et de Bioéconomie (CEBB), CentraleSupélec, Laboratoire de Génie des Procédés et Matériaux, Université Paris-Saclay, 51110 Pomacle, France
2
Instituto Tecnológico y de Estudios Superiores de Occidente (ITESO), Tlaquepaque 45604, Mexico
*
Author to whom correspondence should be addressed.
Appl. Sci. 2023, 13(8), 5193; https://doi.org/10.3390/app13085193
Submission received: 20 March 2023 / Revised: 13 April 2023 / Accepted: 20 April 2023 / Published: 21 April 2023
(This article belongs to the Special Issue CCUS: Paving the Way to Net Zero Emissions Technologies)

Abstract

:
It is often read that industrial microalgal biotechnology could contribute to carbon capture through photosynthesis. While technically accurate, this claim is rarely supported by sound figures nor put in regard to the carbon emissions associated with said processes. In this view, this work provides a quantitative assessment of the extent microalgal processes compensation for their carbon dioxide emissions. To do so, microalgae were cultivated under photolimited conditions. Their growth dynamic and photosynthetic apparatus status were monitored by daily cell density measurement and fluorescence assays. Ultimate analyses were used to determine microalgal carbon content. Simultaneously, the power consumption of the process was recorded, and the associated carbon dioxide emissions were computed using European electrical production carbon intensity. All in all, the recorded values confirmed microalgae growth under good physiological conditions and allowed computing the carbon capture rate, the energy storing rate, and the carbon dioxide emissions of the process. The process captured 0.72 ± 0.19 gCO2/day while emitting 182 gCO2/day, on average (over 15 days). The photoconversion efficiency was 4.34 ± 0.68%. Even if it were highly optimized (red/blue LED instead of white, for example), the process could only capture 1.02 ± 0.40% of its emissions. From these figures, the claim stating that a biotechnological microalgal production process could partly compensate for its emission seems rather bold. Authors should, therefore, emphasize other ecosystemic benefits of microalgal cultivation, such as phosphorous intake. Finally, we were also able to evaluate Chlorella vulgaris light and dark respiration (0.0377 ± 0.042 day−1 and 7.42 × 10⁻³ ± 3.33 × 10⁻³ day−1), which could help to assess carbon emission by biomass respiratory activity.

1. Introduction

Over the past century, mankind’s activities have continuously induced carbon release into the atmosphere. This massive carbon discharge has induced global warming and climate change. Having not taken early measures to reduce carbon dioxide emissions, humanity has now turned to negative emission technologies to try to attenuate the most dire consequences of climate change. With this goal in mind, two actions have to be led simultaneously: carbon capture and carbon emission reduction. In this view, biotechnological approaches seem relevant. First, they contribute to shifting oil-based productions toward bio-based productions. Second, they can contribute to carbon capture through photosynthesis.
In this domain, the most evident approach is afforestation, which may be the easiest solution to deploy from a technical point of view. Yet, several drawbacks hinder its practical applicability: large area requirement, slow capture mechanism, likely reduction in local biodiversity, and possible competition with food crops. Consequently, microalgae may appear as an alternative, as they grow faster than higher plants (generation time spanning from several hours to days), show a higher photosynthetic efficiency (4.6% for C3 plants, 6% for C4 plants [1], and up to an optimistic 15% for microalgae [2]), and can be grown on non-arable lands, or even oceans. The two main ways of leading microalgal carbon capture are biotechnological cultivation of microalgae and ocean fertilization. This work applies to the first category, as the second may appear as a last-resort measure belonging to the geoengineering approaches. Indeed, ocean fertilization raises concern from an ecological standpoint, while its carbon sequestration potential is questionable. Among other issues, ocean fertilization could disturb local biodiversity by promoting algal bloom, which would hinder the oceanic carbon pump and foster ocean acidification [2].
Microalgal biotechnology has drawn considerable attention from scholars and engineers for decades thanks to its numerous qualities. Among them, one can cite high protein content for food and feed application [3]; lipids for biofuels [4]; and advanced molecules for cosmetic and pharmaceutical use [5]. In addition to producing natural molecules, microalgae also deliver ecosystemic services, such as wastewater remediation [6] and, of course, carbon capture [7,8]. Considering both these aspects, it seems that microalgal bioprocesses naturally have a low impact on the environment and could potentially reach carbon neutrality with proper optimization. Aiming toward the development of large-scale microalgal bioprocesses, the concept of biorefinery has been thought out to improve the valorization of microalgal biomass, which is otherwise far from economically viable [6,9]. As a side benefit of these bioprocesses, many authors investigate the carbon capture potential of a culture through the lens of a green biofuel production process [10,11,12] or highly CO2-tolerant species growing on industrial fumes [13,14]. However, if the potential of carbon capture in this context is rightfully emphasized, the question of the carbon footprint of such a process is rarely evaluated. While potentially relevant if led naturally [15,16], the often-made claim on carbon capture associated with microalgal bioprocesses should be discussed [17]. Previous works have focused on maximizing the carbon sequestration capacity of industrial algal processes, such as the production of pigments [18], without calculating the carbon emission of the process.
While it stands to reason that photosynthetic processes involving artificial light cannot lead to net negative emission, the actual extent of compensation attained by an industrial process has to be assessed with more care. Previous works have focused on supplying an adequate amount of carbon dioxide to foster cultures. In this work, we propose quantifying the net carbon balance of such a process by considering microalgae carbon capture and process carbon footprint. In addition, when a large part of the literature work on the subject relies mostly on theoretical consideration [19,20], we provide original experiments to compare with said classical approaches.
To deliver a high microalgal capture rate, a biotechnological process has to ensure both a high carbon supply and a high photosynthetic efficiency (defined as the ability of microalgae to turn light energy into chemical energy in the form of carbonaceous molecules built from CO2). Inorganic carbon can be supplied directly as dissolved carbon dioxide (classically bubbled into the culture medium) or via a solid chemical species (such as sodium carbonate) [21,22]. Regarding this aspect, the photobioreactor design also has to be considered. Indeed, as open ponds are prone to stripping, one might prefer closed photobioreactors. High photosynthetic efficiency can be achieved by setting the microalgae in a growth-promoting environment (adequate pH, temperature, nutrient supply, CO2, nitrogen, phosphorous, etc.) and limited light conditions. Light limitation ensures that cells will thrive on collecting light and will not trigger non-photochemical quenching mechanisms that divert light from carbon fixation metabolism.
In this view, the present work investigated the extent of carbon capture in an industrial microalgal production process. Chlorella vulgaris was grown in an industrial setup kindly lent by Bioteos company. This strain was chosen for ubiquity in both academic and industrial communities owing respect to its ease of manipulation, robustness, and wide range of applications. The setup included all the required utilities to grow the cells. Hence, it was possible to assess not only cell photosynthetic efficiency, which is of poor relevance from an industrial point of view, but also the whole process of carbon capture and carbon consumption. To do so, microalgae growth and their carbon content were monitored. Simultaneously, the electrical power consumptions of the different modules were recorded to compute carbon emissions using European carbon intensity. Several precautionary measures were taken to ensure the robustness of the study: daily monitoring of the cell photosynthetic apparatus status to validate maximal biological well-being and efficiency, reduction in the supplied light power (from 4 to 1 lighting module) to ensure photolimitation, and carbon dioxide concentration measurement in the exhaust gas to confirm its constant availability for the cells.

2. Materials and Methods

2.1. Strain and Culture Medium

The strain used in the study was Chlorella vulgaris (species SAG 211-11b, purchased from the Culture Collection of Algae at Göttingen University, Göttingen, Germany). The cells were maintained, amplified, and cultivated in suspension. The medium used for this study was a Bold Basal Medium with three times the nitrogen load (referred to as B3N medium [23]). This medium was chosen as it is chemically defined and particularly rich in nitrogen while not inducing substrate inhibition. The culture was constantly sparged with air, ensuring CO2 supply and O2 removal while ensuring mixing. The light was supplied using a cool white LED. Finally, experiments were conducted in an environment thermoregulated at around 20 ± 2 °C.

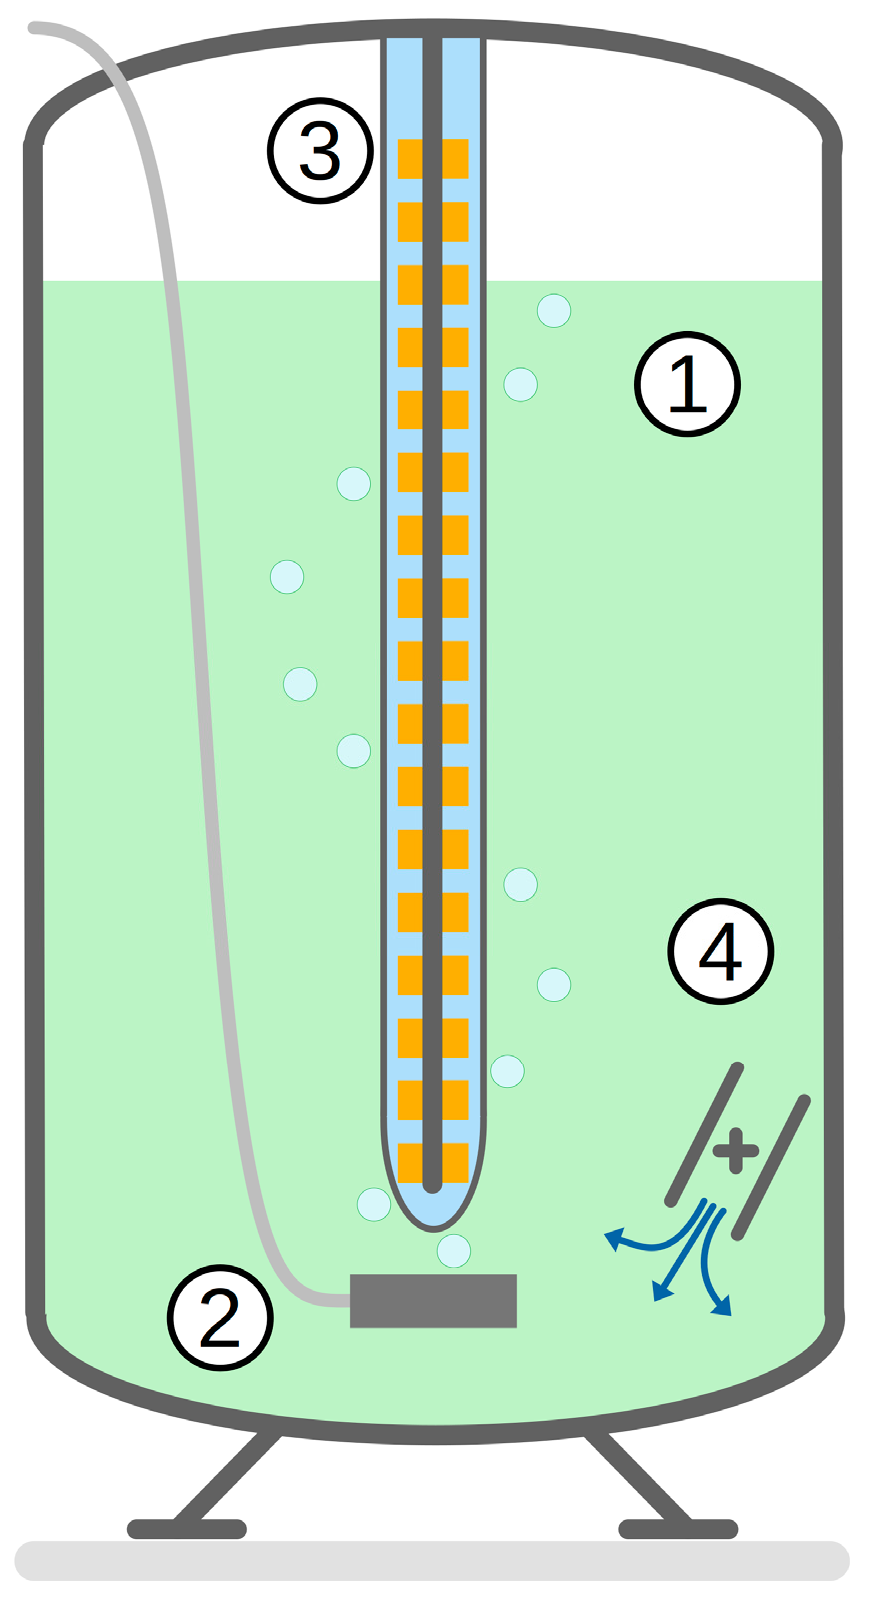
2.2. Photobioreactor Design and Operation

The photobioreactor used in this study was an industrial model from the Bioteos company. Figure 1 presents a simplified scheme of the vessel. Its main features are a 60 L tank (circa 52-liter working volume; tank diameter, 40 cm), an LED light source (100 µmolPhotonPAR/m2/s, continuous light), a sparger, and a pump preventing settling as well as biofilm formation.
Microalgae were amplified up to 2 L before being inoculated to the photobioreactor, which was pre-filled with 50 L of fresh B3N medium. Air aeration was set at 20 Nl/min. The circulating pump was turned on continuously. The culture was monitored daily by sampling (circa 50 mL). In order to ensure the robustness of the calculations, the culture medium volume was maintained constant (52 ± 0.5 L) over the 110 days of experiments.

2.3. Microalgae Growth Monitoring

Two samples were withdrawn from the bioreactor on a daily basis. The first ones (circa 3 mL) were used to lead transient chlorophyll fluorescence signal (OJIP) assays (AquaPen 110-C) after 15 min of dark adaptation. These tests were conducted daily to verify the proper functioning of the cells’ photosynthetic system. The three main outcomes of these assays were the absorbed energy per reaction center (ABS/RC, which indicates the ability of the chlorophyll aggregates to capture light), the trapped energy per reaction center (TR0/RC, which evaluates the transfer from the chlorophyll aggregates to the complexes using light energy to release electrons), and the transferred energy per reaction center (ET0/RC, which indicates how efficiently the recovered electrons are transported further). Together, they assess light energy capture and transfer toward biosynthesis by using a PhotoSystem II (PSII). One should note that these indicators are intended to detect problems or evolution in the photosynthetic apparatus status. They do not relate directly to carbon capture but ensure that the cells are performing optimally from a photosynthetic point of view.
The second samples (50 mL) were used to obtain microalgal cell density. To do so, the samples were passed through pre-dried and pre-weighted filters (0.45 µm pore diameter). Loaded filters were then extensively washed before being dried at 105 °C overnight. Finally, filters were weighted once again to measure the retained cell mass and compute the cell density.
Homogeneity of the culture within the PBR was assessed during the run. Three samples were withdrawn from the top, middle, and bottom of the bioreactor and analyzed with a spectrophotometer. Comparable values of absorbance at 680 nm were found: 0.021 ± 0.02. This was consistent with our visual observations of the culture inside the photobioreactor, the absence of flock in suspension, and fast dissipation of biofilm taken from the edges. For the sake of pragmatism in operation, the samples used for the analysis were withdrawn from the top region of the bioreactor (between 0 and 10 cm deep). Results might be marginally underestimated due to residual concentration heterogeneity.

2.4. Microalgae Higher Heating Value and Power Monitoring

Two samples (at day 0 and day 12) were taken to determine cell carbon content. Cells were washed twice before being freeze-dried and presented to a CHNS analyzer (1 mg dry matter sample). CHNS analysis was triplicated for each sample. Microalgae higher heating value was determined using an equation developed by Magalhães et al. specifically for microalgae, Equation (1) [24]:
HHV (MJ/kg) = 2.79 + 0.2989 C + 0.401 N
Cultivation system electrical power consumption was monitored continuously using powermeters. Readings were logged daily. Two powermeters were used: one monitoring the whole system (light, sparger, circulating pump), the other focusing on the lighting system. Actual light power was obtained by multiplying light power by AC/DC converter efficiency (80%, manufacturer data), LED electricity to light efficiency (30% [25]), and optics efficiency (90% [26]).
Finally, the constant availability of carbon dioxide was checked by monitoring its concentration in the gas flow escaping the photobioreactor (ExplorIR®-M-20 CO2 Sensor, Gas Sensing Solutions, Glasgow, UK).

2.5. Modeling Cell Growth and Carbon Storage Efficiency

Depending on the growth phase (linear growth, stagnation in the light, decline in the dark), it is possible to model cell proliferation or decline differently and access various quantities of interest. In the case of light-limited linear growth (our first phase), cell growth can be modeled as:
V d X d t = P L i g h t H H V ε
The light stationary phase can be modeled as:
V d X d t = 0 = P L i g h t H H V ε r L i g h t X V
Additionally, the decline phase in the dark as:
V d X d t = r D a r k X V
where V is the photobioreactor volume (m3), X is the biomass concentration (kgDW/m3), PLight is the input light power (W), HHV is the biomass higher heating value (J/kgDW), ε is the photoconversion efficiency (-), rLight is the light respiration rate (s−1), and rDark is the dark respiration rate (s−1).
Using the methodology introduced in Section 2.2 and Section 2.4, it is possible to access experimentally (dX/dt, i.e., the slope of the cell density curve, PLight and HHV). Hence, using Equation (2) in combination with these data, one can derive photosynthetic efficiency:
ε = V d X d t H H V P L i g h t
Carbon capture (CC) can then be linked to input light power by:
C C = V d X d t Y C M C O 2 M C = P L i g h t H H V ε Y C M C O 2 M C
Additionally, carbon emissions:
C E = P I n p u t C I
where YC is the fraction of carbon in the biomass (from CHNS analyses), MCO2 and MC are the molar masses of carbon dioxide and carbon, respectively, PInput is the total electrical input power (for utilities and light), and CI is the carbon intensity of electricity production.

3. Results

The culture and the tests were conducted with success. From a qualitative perspective, the biomass color at the culture level and microscopic cell observations pointed toward a healthy culture with no signs of bacterial contamination. Furthermore, no technical incidents (power cut, leak, etc.) were encountered.

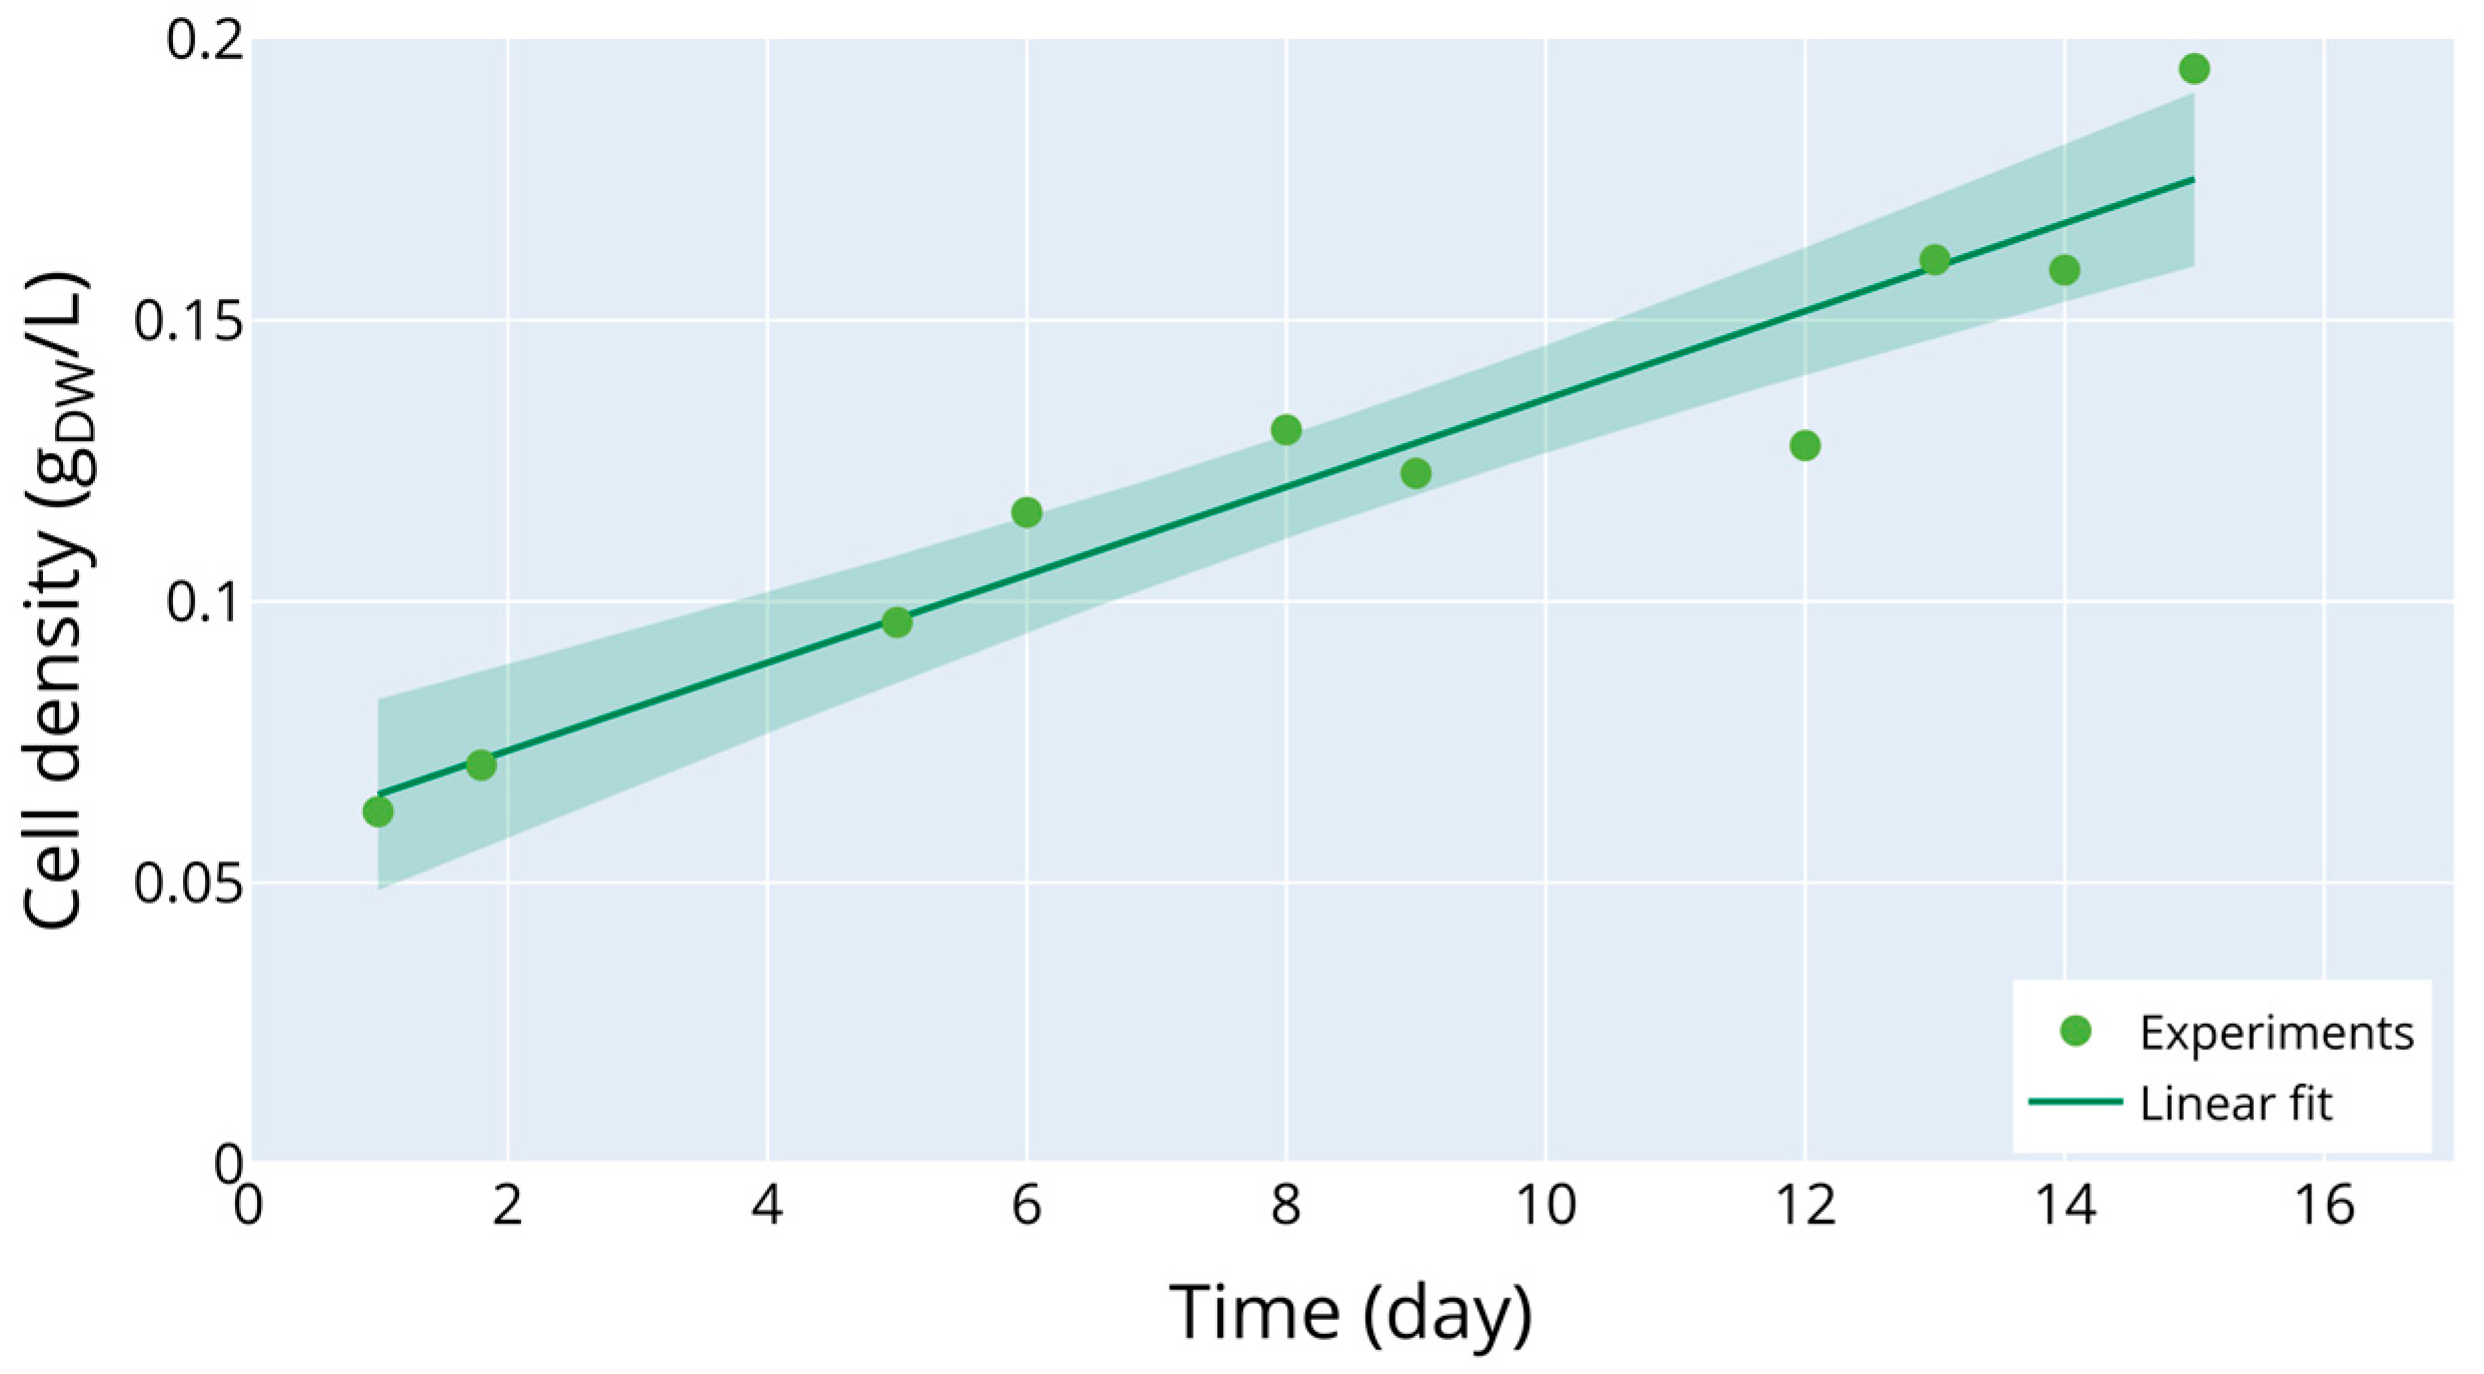
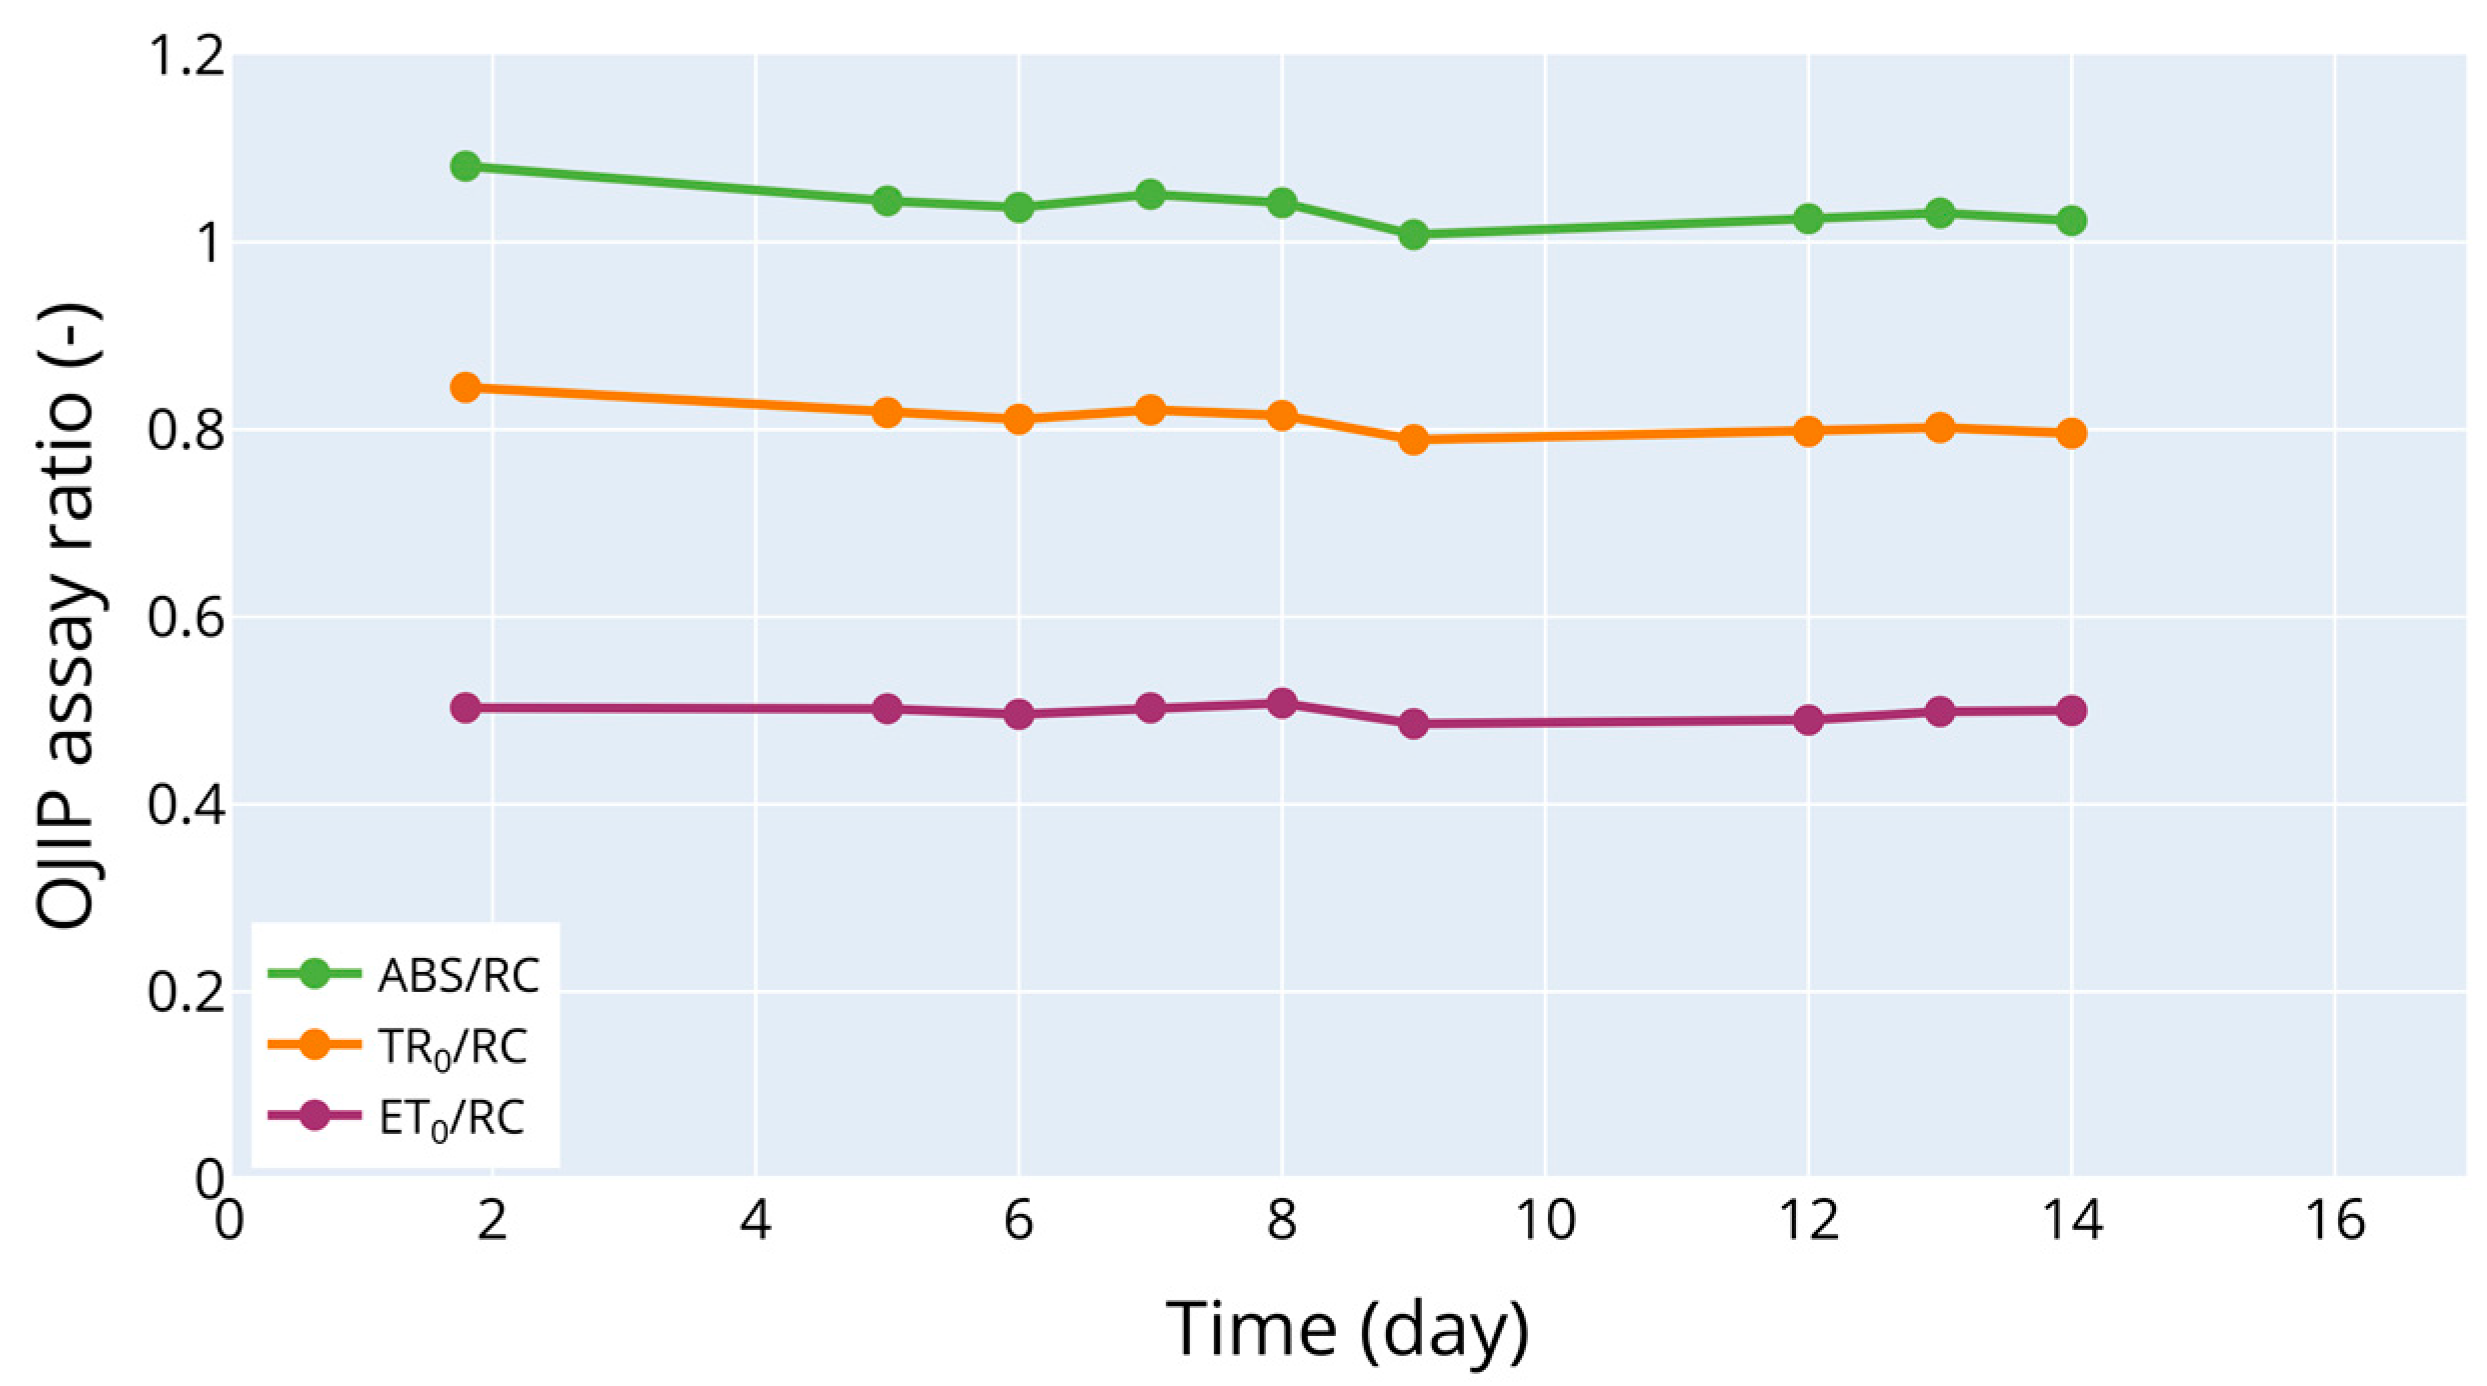
3.1. Biomass Growth and Photosynthetic Status Apparatus

Figure 2 presents the biomass density over the light-limited linear growth part of the run. These measurements have to be multiplied by the culture medium volume to compute the total culture mass before accessing the stored energy Equations (2) and (5). The volume was checked daily and adjusted to compensate for evaporation and loss due to sampling. Over the run, the volume was successfully maintained within 52 ± 0.5 L and can therefore be assumed to be constant (52 L). Biomass daily productivity was obtained by computing daily concentration increase using the linear regression of the cell concentration over time and multiplying it by the culture volume. The average daily production of the culture was 0.406 ± 0.037 gDW/day (uncertainty: standard deviation based on the 95% confidence of the linear fit slope estimate).
Figure 3 reports the different indicators characterizing the functioning of the PSII. Data from the first day were lost because of file mismanagement. Nevertheless, all the tests were conducted satisfactorily, and individual signals were checked to verify the absence of detector saturation.

3.2. Biomass Carbon Content and HHV

Table 1 presents biomass ultimate analysis at several times over the cultivation period. These measurements calculated a grand average composition, allowing the computation of a biomass higher heating value of 20.51 ± 0.30 MJ/kg. Finally, carbon dioxide concentration measurement in the outflow confirmed that the concentration did not fall below 404 ppm (surface atmospheric CO2 level in October 2022: 418 ppm [27]). Thanks to these data, two important quantities can be derived: daily carbon capture (0.724 ± 0.187 gCO2/day) and daily energy storage (2.29 ± 0.36 Wh/day).

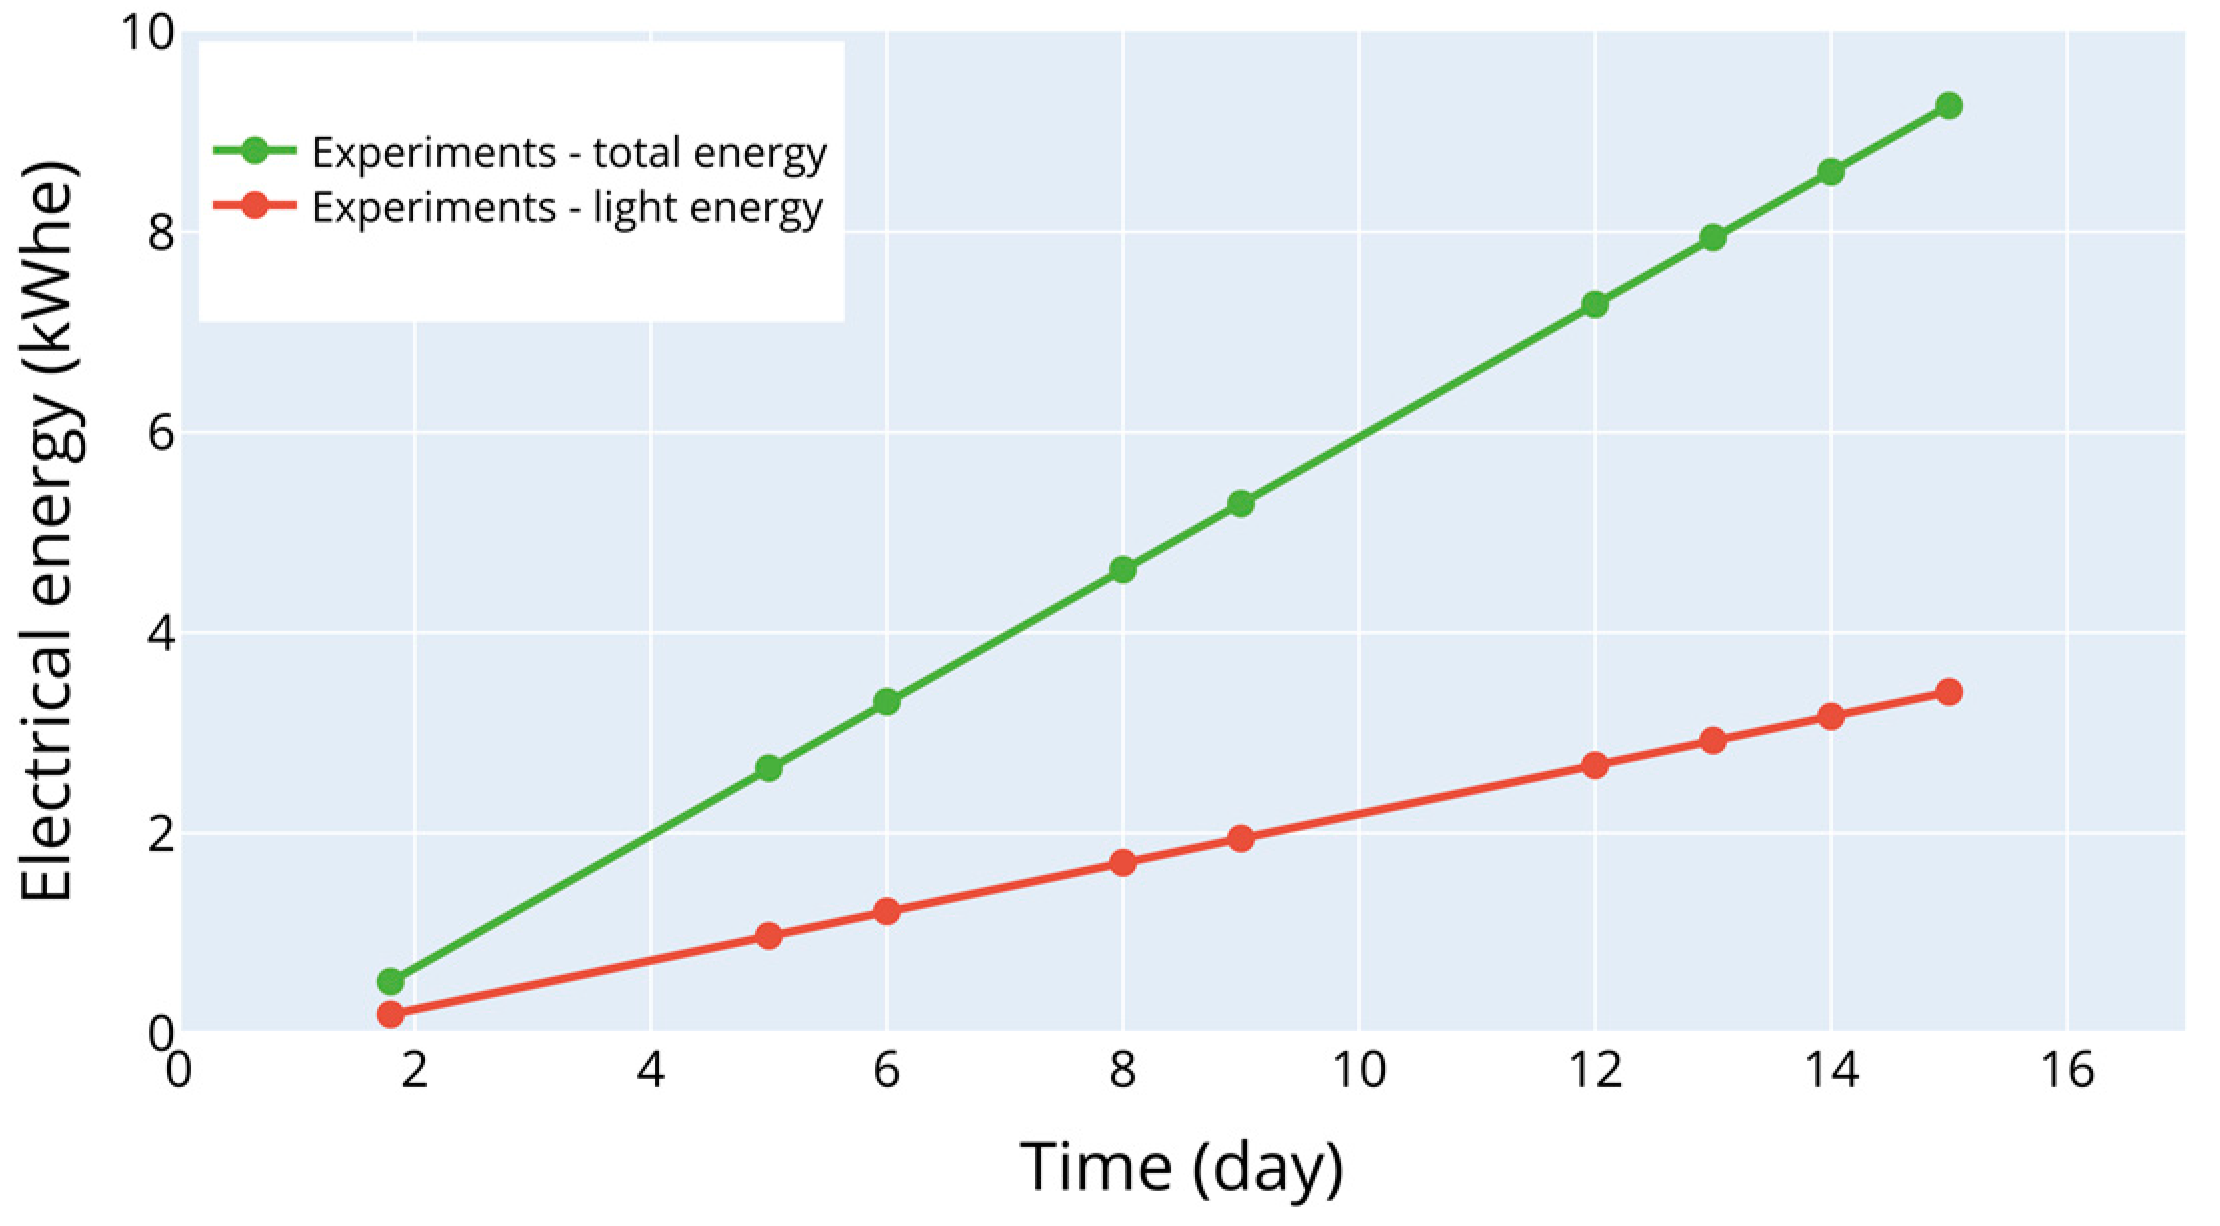
3.3. Power Consumption and Carbon Emissions

Figure 4 displays the energy consumed by the whole cultivation setup as well as the one consumed only by the lighting system. The two curves exhibit a linear trend, allowing for extracting the daily energy consumption. Each day, the cultivation setup consumed 0.662 kWh of electricity, of which 0.244 were dedicated to powering the LED. Using this last value and the estimated power to photon efficiency of the light source (21.6%), it was possible to compute the microalgae photosynthetic efficiency, Equation (5). For this process, it was established at 4.34 ± 0.68%.
Using electrical power consumption, it is possible to compute the carbon emissions associated with the process. To do so, the European carbon intensity of electricity production was used. As of 2021, it reached 275 gCO2/kWhe [28]. Thereof, the total carbon dioxide emissions can be evaluated at 182 gCO2/day Equation (7), while the ones associated with the lighting system are around 67.1 gCO2/day.

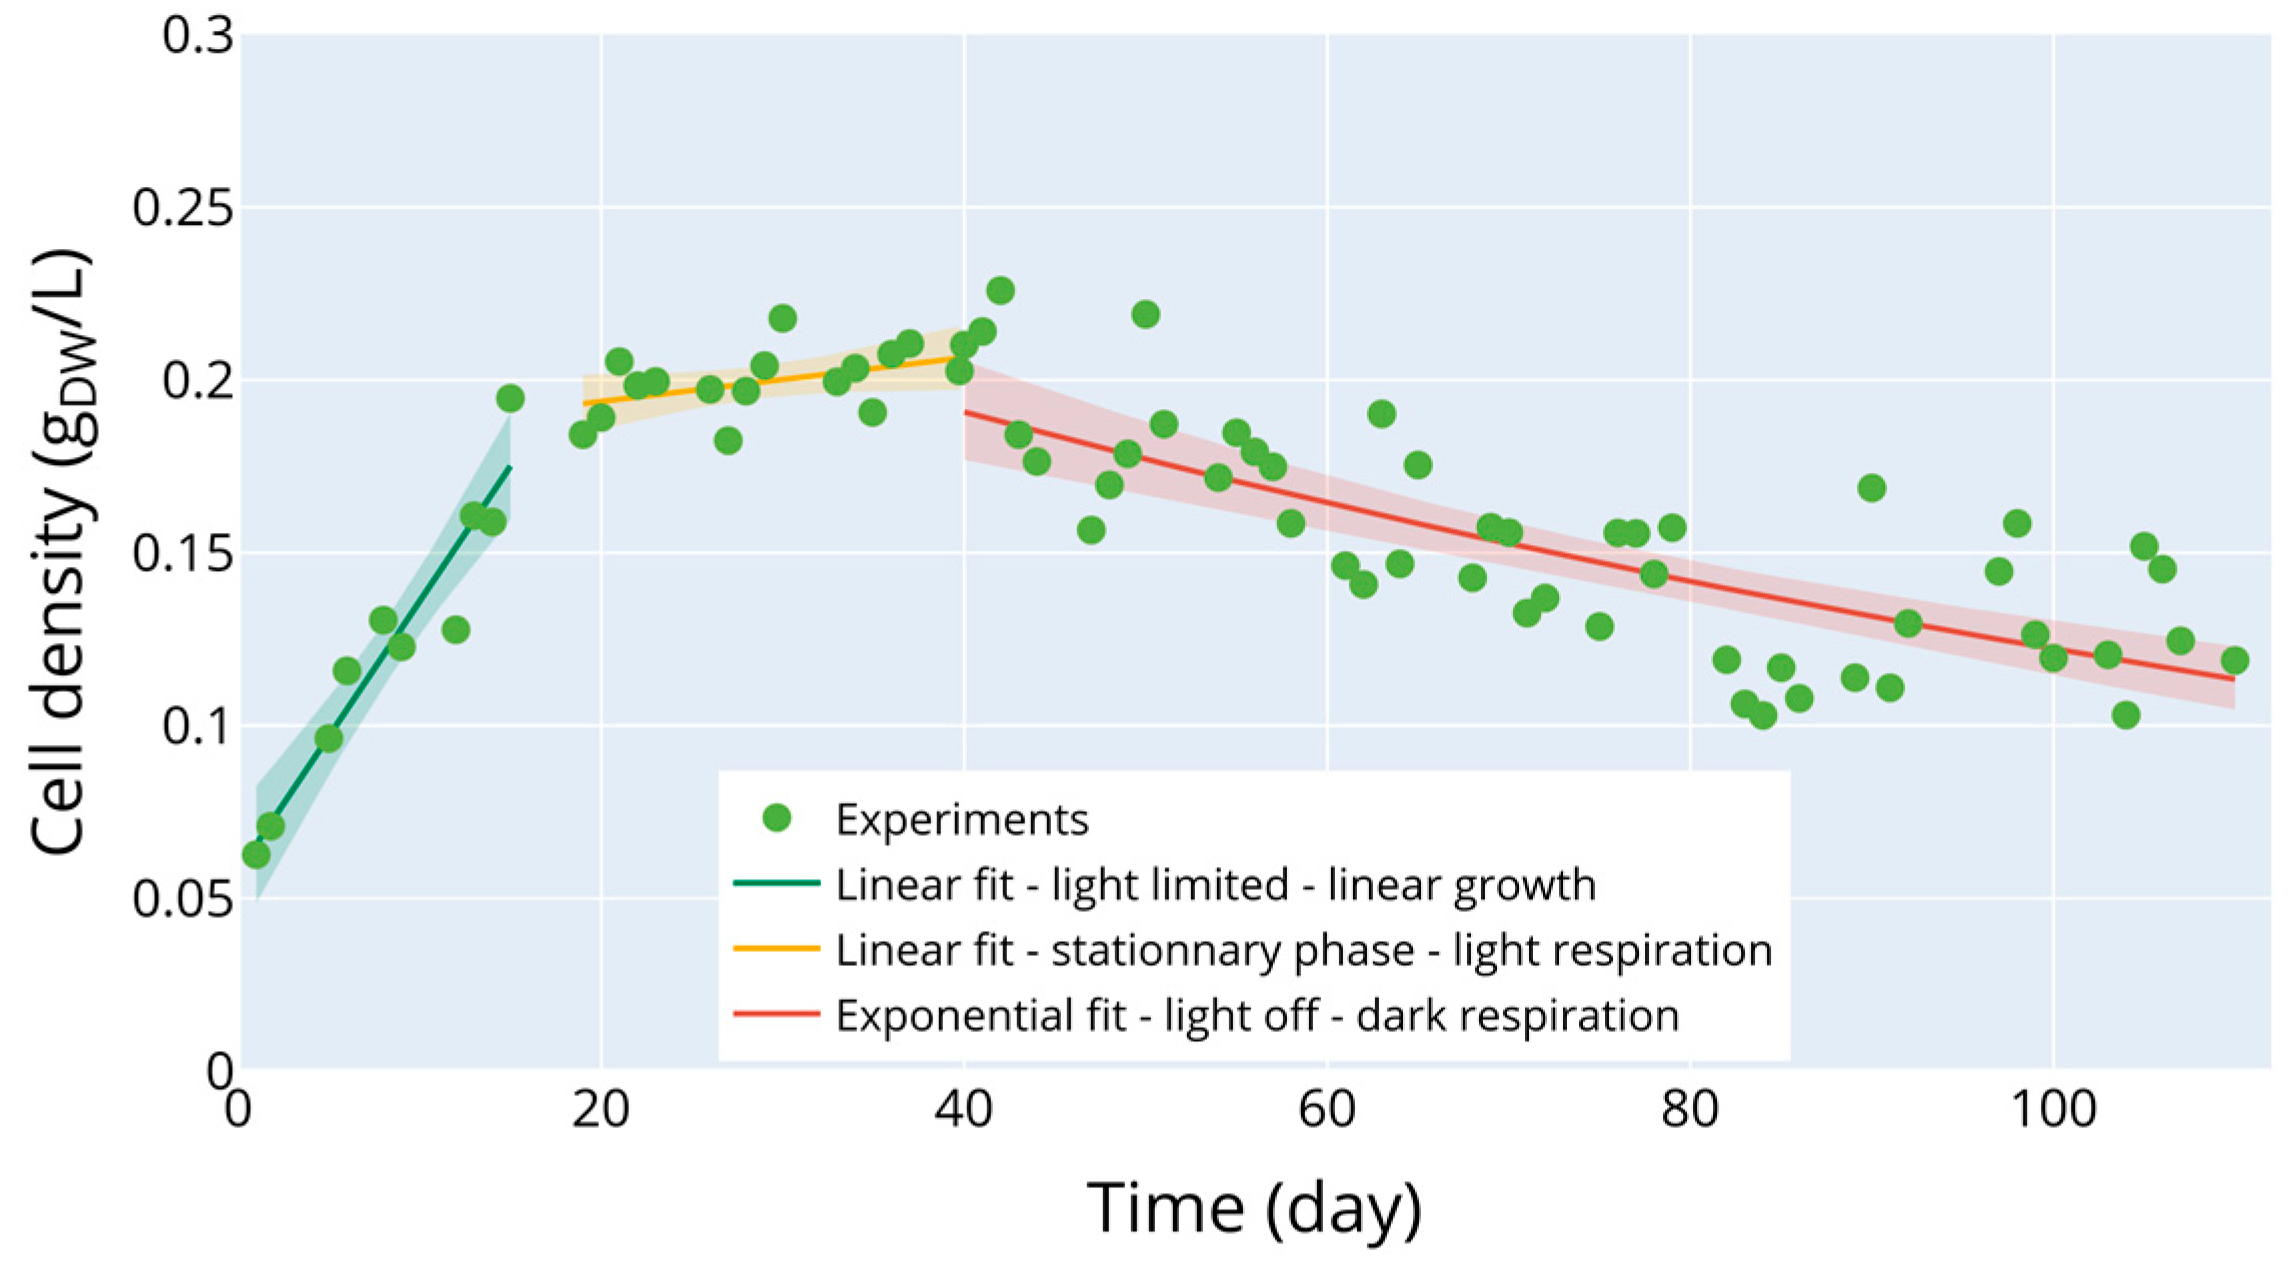
3.4. Stagnation in Light and Decline in the Dark

The culture was continuously monitored even after it existed in the light-limited linear growth phase (around day 15). It then entered a stationary phase (days 18 to 40) until the light was intentionally switched off to access dark respiration. Figure 5 presents the cell concentration monitoring over the whole experiment and the trends fitted by the models, Equations (2)–(4). Fitting procedures allowed for computing the values of rLight as 0.0377 ± 0.042 day−1 and rDark as 7.42 × 10⁻³ ± 3.33 × 10⁻³ day−1 (R2 = 0.563).

4. Discussion

The first point to be discussed is the biological behavior of the culture. Indeed, to obtain a reliable estimate of carbon capture, microalgae growth must be optimal. The first comment is that the protocol aimed at obtaining light-limited linear growth of properly functioning cells. As shown in Figure 2, the culture proliferation can reasonably be deemed linear. This observation is also supported by the quality of the linear regression over the curve. The second comment is on the functioning of the photosynthetic apparatus. The three indicators of PSII functioning are stable over the culture. This is a token of the fact that the cells were put in an adequate environment as they did not undergo acclimation. Furthermore, the absolute values of these indicators are relatively close to the ones observed for the same strain under optimal nutrient, pH, temperature, and light conditions [17]: 1.31 ± 0.04 for ABS/RC, 0.97 ± 0.02 for TR0/RC, and 0.53 ± 0.02 for ET0/RC. The only minor difference is the value of the ABS/RC indicator (circa 0.3 lower in this work). This may point to higher light availability in our case. It can nevertheless be concluded that the culture growth unfolded under conditions perfectly valid for the study.
Therefore, it was possible to obtain the culture photosynthetic efficiency from these data by combining the biomass production rate with the input light energy. The photoconversion efficiency value (4.34 ± 0.68%) correlates well with values reported by other scholars (e.g., 5.01% for Chlamydomonas reinhardtii under white light [29] and 5.65% at maximum for Phaeodactylum tricornutum [30]). However, it lies below the theoretical maximum of 23.8% [31] as well as the highly engineered laboratory value (e.g., 15% under extremely low light—25 µmolPhotonPAR/m2/s—of low industrial relevance [29]). Nevertheless, these figures must be manipulated cautiously as they are not derived from identical setups. In this work, white LEDs were used. In this configuration, the microalgae do not capture part of the light energy (mainly within the green range of the spectrum). Therefore, it can considerably lower the photosynthetic efficiency. The theoretical maximum was derived, assuming only red photons were supplied to the culture. As a rule of thumb, one can state that using the proper combination of red/blue light doubles the culture photosynthetic efficiency with respect to white light [32]. Furthermore, increasing the CO2/O2 ratio in the sparged gas could lower the extent of photorespiration and further increase the effective photosynthetic yield [1].
Our results show that, as expected, the carbon fixation through the growth of our biomass is far from reaching the equivalent carbon produced for the energy used in the process. If ever some process would reach carbon neutrality to produce biomass, it is important to keep in mind that the use of this biomass itself will then tip the scale in the opposite direction. First of all, both the upstream and downstream processes should be taken into account in the total assessment. In particular, harvesting the algae is one of the most energy-demanding steps [33]. The actual use of biomass is also to be considered. In the case of biofuel, firing the accumulated biomass will unavoidably release into the atmosphere all the carbon that has been captured. While obvious, this fact is to be remembered when considering the impact of the process as a whole. On the contrary, the carbon actually captured by the algae still participates in purifying the local air or water [34].
In addition, reaching a carbon-neutral process of biomass accumulation, energetically speaking, would not mean a totally green solution, as land, water, and nutrients would still need to be provided to the culture [20].

5. Scalability

Finally, the extent of carbon capture associated with a large-scale process is to be discussed. The reported data were obtained with a lab-scale module featuring only one lighting module. Considering the industrial device (four lighting modules), one can anticipate a multiplication by 4 of the produced biomass, as well as a multiplication by 4 of the emissions associated with lighting. Nevertheless, carbon dioxide emissions linked to utilities (gas sparging and mixing) would be unchanged. Therefore, the CO2 captured per day would be around 2.89 ± 0.75 gCO2/day, while the emissions induced by the process would be 383 gCO2/day. The process would only capture 0.51 ± 0.20% of its emissions. Increasing further the size of the photobioreactor would not change this value. Indeed, the need for utilities would start to increase in a volumetric manner, like the lighting module number (because of geometrical constraints).
Finally, optimizing the setup using red/blue lighting and only accounting for the electrical power directed toward the lighting system, the fraction of absorbed CO2 could reach 1.02 ± 0.40% of the process emission. Taking into account the potential gain of photosynthetic efficiency if reaching the theoretical maximum, the carbon capture could reach 2.80% of its emission. However, as stated before, such a leap is quite audacious since the theoretical maximum is far from reachable in any industrial process [31]. Leads exist to increase even beyond this value of carbon fixation [10], notably in the field of genetics enhancement, but a lot of work is still needed before maturity. The same comment can be made for the development of less energy-intensive processes [35]. More generally, microalgal carbon uptake is limited by the same scale-up difficulties that any photosynthetic bioprocess faces [36].

6. Conclusions

This work aimed at providing a quantitative assessment of the validity of the claim stating that a biotechnological microalgal production process could partly compensate for its carbon dioxide emissions. To do so, microalgae were cultivated under optimal photosynthetic conditions. Their growth dynamic and carbon content were monitored and used to compute both the carbon capture and the energy storing rates. Simultaneously, the power consumption of the process was recorded, and the associated carbon dioxide emissions were computed using European electrical production carbon intensity. All in all, the process produced 2.89 ± 0.75 gCO2/day while emitting 383 gCO2/day. Even if it were highly optimized, the process could only capture 1.02 ± 0.40% of its emissions. From these figures, the claim stating that a biotechnological microalgal production process could partly compensate for its emission seems rather bold. By extension, it cannot be considered a carbon-negative process. Authors should, therefore, emphasize other ecosystemic benefits of microalgal cultivation, such as nitrogen and phosphorous intakes.

Author Contributions

Conceptualization, V.P.; methodology, C.C.-B., J.L. and V.P.; validation, A.O., C.C.-B. and V.P.; investigation, J.L.; writing—original draft preparation, V.P.; writing—review and editing, A.O., C.C.-B., J.L. and V.P. All authors have read and agreed to the published version of the manuscript.

Funding

This research received no external funding.

Institutional Review Board Statement

Not applicable.

Informed Consent Statement

Not applicable.

Data Availability Statement

Data are available upon request.

Acknowledgments

Communauté urbaine du Grand Reims, Département de la Marne, Région GrandEst, and European Union (FEDER Champagne-Ardenne 2014–2020) are acknowledged for their financial support to the Biotechnology of CentraleSupélec and the Centre Européen de Biotechnologie et de Bioéconomie (CEBB).

Conflicts of Interest

The authors declare no conflict of interest.

Abbreviations

B3N: Bold Basal Medium with three times regular nitrogen content; CHNS: ultimate analysis yielding carbon, hydrogen, nitrogen, and sulfur atomic contents of the biomass; HHV: higher heating value, and OJIP: transient chlorophyll fluorometric assay.

References

  1. Zhu, X.-G.; Long, S.P.; Ort, D.R. What is the maximum efficiency with which photosynthesis can convert solar energy into biomass? Curr. Opin. Biotechnol. 2008, 19, 153–159. [Google Scholar] [CrossRef]
  2. Allsopp, M.; Santillo, D.; Johnston, P. A scientific critique of oceanic iron fertilization as a climate change mitigation strategy. In Symposium on Ocean Iron Fertilization; Wood Hole Oceanographic Institution: Wood Hole, MA, USA, 2007. [Google Scholar]
  3. Janssen, M.; Wijffels, R.H.; Barbosa, M.J. Microalgae based production of single-cell protein. Curr. Opin. Biotechnol. 2022, 75, 102705. [Google Scholar] [CrossRef]
  4. Pancha, I.; Chokshi, K.; George, B.; Ghosh, T.; Paliwal, C.; Maurya, R.; Mishra, S. Nitrogen stress triggered biochemical and morphological changes in the microalgae Scenedesmus sp. CCNM 1077. Bioresour. Technol. 2014, 156, 146–154. [Google Scholar] [CrossRef] [PubMed]
  5. Levasseur, W.; Perré, P.; Pozzobon, V. A review of high value-added molecules production by microalgae in light of the classification. Biotechnol. Adv. 2020, 41, 107545. [Google Scholar] [CrossRef] [PubMed]
  6. Pozzobon, V.; Cui, N.; Moreaud, A.; Michiels, E.; Levasseur, W. Nitrate and nitrite as mixed source of nitrogen for Chlorella vulgaris: Growth, nitrogen uptake and pigment contents. Bioresour. Technol. 2021, 330, 124995. [Google Scholar] [CrossRef]
  7. Farrelly, D.J.; Everard, C.D.; Fagan, C.C.; McDonnell, K.P. Carbon sequestration and the role of biological carbon mitigation: A review. Renew. Sustain. Energy Rev. 2013, 21, 712–727. [Google Scholar] [CrossRef]
  8. Daneshvar, E.; Wicker, R.J.; Show, P.-L.; Bhatnagar, A. Biologically-mediated carbon capture and utilization by microalgae towards sustainable CO2 biofixation and biomass valorization—A review. Chem. Eng. J. 2021, 427, 130884. [Google Scholar] [CrossRef]
  9. Chew, K.W.; Yap, J.Y.; Show, P.L.; Suan, N.H.; Juan, J.C.; Ling, T.C.; Lee, D.-J.; Chang, J.-S. Microalgae biorefinery: High value products perspectives. Bioresour. Technol. 2017, 229, 53–62. [Google Scholar] [CrossRef]
  10. Li, G.; Xiao, W.; Yang, T.; Lyu, T. Optimization and Process Effect for Microalgae Carbon Dioxide Fixation Technology Applications Based on Carbon Capture: A Comprehensive Review. C 2023, 9, 35. [Google Scholar] [CrossRef]
  11. Li, S.; Li, X.; Ho, S.-H. Microalgae as a solution of third world energy crisis for biofuels production from wastewater toward carbon neutrality: An updated review. Chemosphere 2021, 291, 132863. [Google Scholar] [CrossRef]
  12. Maghzian, A.; Aslani, A.; Zahedi, R. Review on the direct air CO2 capture by microalgae: Bibliographic mapping. Energy Rep. 2022, 8, 3337–3349. [Google Scholar] [CrossRef]
  13. Li, J.; Pan, K.; Tang, X.; Li, Y.; Zhu, B.; Zhao, Y. The molecular mechanisms of Chlorella sp. responding to high CO2: A study based on comparative transcriptome analysis between strains with high- and low-CO2 tolerance. Sci. Total. Environ. 2021, 763, 144185. [Google Scholar] [CrossRef] [PubMed]
  14. Li, J.; Zhao, X.; Chang, J.-S.; Miao, X. A Two-Stage Culture Strategy for Scenedesmus sp. FSP3 for CO2 Fixation and the Simultaneous Production of Lutein under Light and Salt Stress. Molecules 2022, 27, 7497. [Google Scholar] [CrossRef] [PubMed]
  15. Moreira, D.; Pires, J.C. Atmospheric CO2 capture by algae: Negative carbon dioxide emission path. Bioresour. Technol. 2016, 215, 371–379. [Google Scholar] [CrossRef]
  16. Onyeaka, H.; Miri, T.; Obileke, K.; Hart, A.; Anumudu, C.; Al-Sharify, Z.T. Minimizing carbon footprint via microalgae as a biological capture. Carbon Capture Sci. Technol. 2021, 1, 100007. [Google Scholar] [CrossRef]
  17. Xu, X.; Gu, X.; Wang, Z.; Shatner, W.; Wang, Z. Progress, challenges and solutions of research on photosynthetic carbon sequestration efficiency of microalgae. Renew. Sustain. Energy Rev. 2019, 110, 65–82. [Google Scholar] [CrossRef]
  18. Do, C.V.T.; Dinh, C.T.; Dang, M.T.; Tran, T.D.; Le, T.G. A novel flat-panel photobioreactor for simultaneous production of lutein and carbon sequestration by Chlorella sorokiniana TH01. Bioresour. Technol. 2021, 345, 126552. [Google Scholar] [CrossRef]
  19. Xu, P.; Li, J.; Qian, J.; Wang, B.; Liu, J.; Xu, R.; Chen, P.; Zhou, W. Recent advances in CO2 fixation by microalgae and its potential contribution to carbon neutrality. Chemosphere 2023, 319, 137987. [Google Scholar] [CrossRef]
  20. Even, C.; Hadroug, D.; Boumlaik, Y.; Simon, G. Microalgae-based Bioenergy with Carbon Capture and Storage quantified as a Negative Emissions Technology. Energy Nexus 2022, 7, 100117. [Google Scholar] [CrossRef]
  21. Cordoba-Perez, M.; de Lasa, H. CO2-derived carbon capture and photon absorption efficiency by microalgae in novel PhotoBioCREC. Ind. Eng. Chem. Res. 2020, 59, 14710–14716. [Google Scholar] [CrossRef]
  22. Xie, Y.; Zhao, X.; Chen, J.; Yang, X.; Ho, S.-H.; Wang, B.; Chang, J.-S.; Shen, Y. Enhancing cell growth and lutein productivity of Desmodesmus sp. F51 by optimal utilization of inorganic carbon sources and ammonium salt. Bioresour. Technol. 2017, 244, 664–671. [Google Scholar] [CrossRef] [PubMed]
  23. Andersen, R.A. Algal Culturing Techniques; Academic Press: Cambridge, MA, USA, 2005. [Google Scholar]
  24. Magalhães, I.B.; Pereira, A.S.A.D.P.; Silva, T.A.; Renato, N.D.S. Predicting the higher heating value of microalgae biomass based on proximate and ultimate analysis. Algal Res. 2022, 64, 102677. [Google Scholar] [CrossRef]
  25. Ben Halima, A.; Araoud, Z.; Canale, L.; Charrada, K.; Zissis, G. Energy efficiency of a LED lighting system using a Peltier module thermal converter. Case Stud. Therm. Eng. 2022, 34, 101989. [Google Scholar] [CrossRef]
  26. Pozzobon, V. 10% Loss of Incident Power through Solar Reactor Window: Myth or Good Rule of Thumb? Appl. Sol. Energy 2018, 54, 131–133. [Google Scholar] [CrossRef]
  27. Lan, X.; Tans, P.; Thoning, K.W. Trends in Globally-Averaged CO2 Determined from NOAA Global Monitoring Laboratory Measurements. NOAA/GML, November 2022. Available online: https://gml.noaa.gov/ccgg/trends/gl_data.html (accessed on 28 November 2022).
  28. Greenhouse Gas Emission Intensity of Electricity Generation. 2022. Available online: https://www.eea.europa.eu/data-and-maps/daviz/co2-emission-intensity-12#tab-googlechartid_chart_11 (accessed on 10 December 2022).
  29. Wagner, I.; Steinweg, C.; Posten, C. Mono- and dichromatic LED illumination leads to enhanced growth and energy conversion for high-efficiency cultivation of microalgae for application in space. Biotechnol. J. 2016, 11, 1060–1071. [Google Scholar] [CrossRef]
  30. Dillschneider, R.; Steinweg, C.; Rosello-Sastre, R.; Posten, C. Biofuels from microalgae: Photoconversion efficiency during lipid accumulation. Bioresour. Technol. 2013, 142, 647–654. [Google Scholar] [CrossRef]
  31. Walker, D.A. Biofuels, facts, fantasy, and feasibility. J. Appl. Phycol. 2009, 21, 509–517. [Google Scholar] [CrossRef]
  32. Loganathan, B.G.; Orsat, V.; Lefsrud, M.; Wu, B.S. A comprehensive study on the effect of light quality imparted by light-emitting diodes (LEDs) on the physiological and biochemical properties of the microalgal consortia of Chlorella variabilis and Scenedesmus obliquus cultivated in dairy wastewater. Bioprocess Biosyst. Eng. 2020, 43, 1445–1455. [Google Scholar] [CrossRef]
  33. Fasaei, F.; Bitter, J.; Slegers, P.; van Boxtel, A. Techno-economic evaluation of microalgae harvesting and dewatering systems. Algal Res. 2018, 31, 347–362. [Google Scholar] [CrossRef]
  34. Levasseur, W.; Pozzobon, V. Photosynthesis in bioremediation. In Microbes and Microbial Biotechnology for Green Remediation; Elsevier: Amsterdam, The Netherlands, 2022; pp. 247–263. [Google Scholar]
  35. Schulze, P.S.; Barreira, L.A.; Pereira, H.G.; Perales, J.A.; Varela, J.C. Light emitting diodes (LEDs) applied to microalgal production. Trends Biotechnol. 2014, 32, 422–430. [Google Scholar] [CrossRef] [PubMed]
  36. Zieliński, M.; Dębowski, M.; Kazimierowicz, J.; Świca, I. Microalgal Carbon Dioxide (CO2) Capture and Utilization from the European Union Perspective. Energies 2023, 16, 1446. [Google Scholar] [CrossRef]
Figure 1. Schematic of the photobioreactor used for the study. 1—culture medium, 2—air sparger, 3—LED light source, 4—circulating pump.
Applsci 13 05193 g001
Figure 2. Biomass density over the first part of the run (from 50 mL samples) and its linear fit. Culture medium volume: 52 L. Fitted values: density (gDW/L) = 7.81 × 10⁻³  × time (day) ± 57.8 × 10⁻³. R2 = 0.914.
Applsci 13 05193 g002
Figure 3. PhotoSystem II key parameter from OJIP assay. ABS/RC—light absorption per reaction center. TR0/RC—trapping per reaction center. ET0/RC—transfer per reaction center. Tests conducted on fresh samples after 15 min of dark adaptation.
Applsci 13 05193 g003
Figure 4. Total process consumed electrical energy and light consumed electrical energy over time. Measurements started after 24 h. Fitted values: total energy (kWhe) = 0.662 × time (day) ± 0.000. R2 = 1. Lighting energy (kWhe) = 0.244 × time (day) ± 0.000. R2 = 1.
Applsci 13 05193 g004
Figure 5. Biomass density over the run (from 50 mL samples). Culture medium volume: 52 L for the first and second phases. Evaporation is accounted for in the calculations for the last phase.
Applsci 13 05193 g005
Table 1. Biomass ultimate analysis. Sample dry mass: 1 mg.
CHNS
Day 049.006.857.660.10
Day 1248.186.827.220.00
Average48.59 ± 0.586.84 ± 0.027.44 ± 0.310.05 ± 0.07
Disclaimer/Publisher’s Note: The statements, opinions and data contained in all publications are solely those of the individual author(s) and contributor(s) and not of MDPI and/or the editor(s). MDPI and/or the editor(s) disclaim responsibility for any injury to people or property resulting from any ideas, methods, instructions or products referred to in the content.

