1. Introduction
Image classification has a long list of successful applications in medical sciences. The proposed solutions have assisted medical practitioners in the diagnosis of various diseases. The literature is extensive, and it includes the recent problem of the classification of COVID-19 and pneumonia from chest CT and X-ray images [
1,
2,
3,
4], the classification of lung cancer from CT images [
5], as well as the classification of breast cancer from histopathological images [
6]. The challenges in medical image processing have been well described [
7,
8,
9]. The first obstacle that the researchers face is the existence of an accessible, detailed, well-structured, annotated, and rich dataset. The collection of a quality dataset is often cumbersome—it may depend on expensive medical equipment and detailed domain knowledge expertise, and its usage may be constrained by privacy, ethical, and proprietary restrictions. To some extent, this procedure may be simplified in dermatology due to the easy, fast, safe and non-invasive possibility to collect data.
Access to publicly available dermatological datasets opens the possibility for the application of machine learning methods, facilitates the analysis of different skin manifestations and supports reproducible research. Many known results are based on publicly available datasets. For example, the authors of [
10] used both public domain images and clinical images. They discussed deep learning models for the detection of the characteristic skin rash from Lyme disease compared to other clinically relevant skin lesions. Different machine learning methods have been proposed for the classification of a range of skin diseases, such as cancers, autoimmune diseases, infections, rushes, etc. (see [
11,
12,
13,
14,
15,
16] and references therein). However, to the best of our knowledge, there are limited results in the literature referring to the classification of arthropod bites, specifically bites and stings from insects and arachnids. The goal of this paper is to fill in this gap.
Most bug bites may result only in localized reactions and present only minor symptoms, such as redness, swelling, rashes, or itching. An allergic reaction may be triggered by mosquitoes, bed bugs, fire ants, bees, wasps, and kissing bugs. A prolonged allergic or inflammatory reaction may need pharmacological treatment, and a severe allergic response warrants immediate medical attention. Allergic symptoms may also appear after spider bites, and in some parts of the world there is a possibility of venomous exposure. Spider bites increase the risk for contracting tetanus, and in some cases, tetanus boosters may be recommended. Infected insects may transmit vector-borne diseases, many of which can be life threatening. Ticks are responsible for the transmission of Lyme disease, which, if not treated early, can lead to serious long-term complications. A study based on pooled data analysis has reported that more than 14% of the world’s population has at some point been infected with the Lyme disease [
17]. Mosquitoes are considered to be the deadliest animals in the world since they can pass many life-threatening diseases, such as malaria, yellow fever, Zika, West Nile virus, etc. According to the WHO, in 2021 alone, there were an estimated 247 million cases of malaria with 619,000 deaths. There is a cure for some of the vector-borne diseases, but in some cases, only a symptomatic and intensive supportive therapy is available. In both cases, the treatment should start as soon as possible. For more details, we refer to [
18,
19,
20] and references therein.
When the bug that causes a bite is unknown, it may be identified from the bug bite or sting. This may be especially important for people with a history of allergic reactions, young children, and the elderly, as well as people with cardiovascular diseases and diabetes. Identification is certainly difficult for the affected person who may need reliable information about the possible risks and sometimes should be advised to promptly visit a doctor. Moreover, this may be challenging even for medical professionals, who, in some cases, may need to use a differential diagnosis and perhaps extract valuable knowledge from a larger database of images. This challenge could be overcome with the existence of a computer-aided system based on automated bug bite classification, which should provide: (1) quick and reliable information to people affected by a bite and a (2) second opinion to doctors that is beneficial in their decision-making.
To the best of our knowledge, there are no published papers that discuss bug bite classification. We refer only to a few online sources on this topic. In the Kaggle project [
21], the authors used the ResNet50 neural network with transfer learning on a two-class dataset with 61 images of mosquitoes and tick bites. In [
22], there is a discussion on the application of a pre-trained VGG16 model on the same dataset. The authors of [
23] used a dataset of 191 images of bites and stings of seven insects and arachnids (ants, bed bugs, bees, mosquitoes, ticks, scorpions, and spiders). They compare the performance of three pre-trained models, ResNet50, VGG16, and Inception-v3, and an ensemble model, which is constructed using probability averaging, but the authors gave no detailed discussion on the data augmentation and the characteristics and implementation of the models. The single neural networks show poor accuracy (below 60%) as opposed to the ensemble model, which is significantly improved and achieves an accuracy of 88%. In the Github repository [
24], the authors documented the work on a Flask web application which classifies bug bites. The dataset consists of 1300 web-scraped images divided into 8 classes—images of uninfected skin and images of bites and stings coming from ants, bed bugs, fleas, chiggers, mosquitoes, spiders, and ticks. The authors analyzed the performance of logistic regression, simple CNN, and Inception-v3 transfer learning models with three different choices of freezing layers. The best performing model, with an accuracy of 81%, was the Inception-v3 model, where the last 1/3 of layers are unfrozen after tuning. This model is used for the web application.
In [
10], the authors discussed a skin classification problem in which some images of bug bites were used. More precisely, the authors discussed deep learning methods for the detection of erythema migrans (EM), a characteristic rash of acute Lyme disease, which is transmitted by ticks, against other skin lesions. The study was carried out on a dataset that consists of publicly available images as well as clinical images of EM. Apart from the EM class, the following 7 classes were also included: normal skin, herpes zoster (a manifestation known as shingles), tinea corporis (known as ringworm), insect bites (general), tick bites, cellulitis, and erythema multiforme. The study considers a few binary and multiclass classification problems with an accent on classifying EM vs. all other classes, as well as the classification problem with all classes included. The authors considered the following convolutional neural network models with transfer learning: MobileNet-v2, ResNet50 and ResNet152, Inception-v3, InceptionResNet-v2, and DenseNet121, and reported their results in the different scenarios. In the binary classification problem of EM vs. all, the highest accuracy of 84% was achieved by DenseNet121, while in the 8-class classification problem, ResNet50 showed the best results with an accuracy of 72%. Though this study is not directly connected with our analysis, it is interesting to see the model performances on a similar dataset that includes insect bites. For more details, we refer the reader to the
Section 4.
The aforementioned sources on bug bite classification have four major limitations. First, they are not peer-reviewed research on bug bite classification, and their content is not a detailed and comprehensive work on this topic. Second, their analysis is based on smaller datasets for evaluation—the smallest has only 61 images, and the largest has 1300 images. Additionally, they are poorer since they have fewer classes—they discuss bites caused by 2 to up to 7 types of insects. Third, they report limited or no details about the strategies they used, which should be the basis for the future improvement of the models. Fourth, they do not provide a detailed end-to-end system architecture that can be adapted for real-time use.
Motivated by this, we propose a computer-aided system for the classification of images of bug bites, which we believe will be helpful for affected people but will also be of assistance to medical practitioners. The main goal is to fill in the gap in the literature and discuss the classification of bug bite images evaluated on a larger dataset. In this regard, we analyzed four convolutional neural networks (CNN), MobileNet-v2, VGG16, Inception-v3 and DenseNet169, which were pre-trained on an ImageNet dataset. Moreover, we built a stacking ensemble model based on these four models as base estimators to further improve the classification accuracy. Additionally, we developed a mobile application using the Flutter framework, which utilizes a two-step classification model. In the first step of the model, MobileNet-v2 with transfer learning is used in order to classify the user-submitted images as skin or non-skin images. In the next step, the stacking model guesses whether there is a bite and identifies the type of the bite. We applied the proposed strategy for the classification of bug bites to a dataset of 1426 images of bites of eight types of insects and arachnids (further referred to as bugs)—ants, bed bugs, bees, chiggers, fleas, mosquitoes, ticks, and spiders. The dataset also includes images of unaffected skin by bugs. In fact, for our study, we created a dataset which combines the images from [
21,
24] and additionally, we added web-scraped images of bee stings. This led to a total of nine classes in the dataset. Augmentation techniques were used to enrich the dataset, which is a common approach in similar deep learning tasks. This dataset is greater than the existing datasets and has the largest number of categories.
We have identified four main objectives of our research. (1) Firstly, we aim to investigate whether deep convolutional neural networks and transfer learning can be successfully applied for the bug bite classification problem and to identify the most appropriate state-of-the-art pre-trained model. For this purpose, we examined some of the most frequently used pre-trained models based on the most popular and powerful deep learning architectures, such as MobileNet-v2, VGG16, Inception-v3, and DenseNet169. We also identified the possibilities for improvement. Compared to the existing work on this topic, we provide a more comprehensive analysis and discussion on these models. (2) Secondly, we aim to test the hypothesis that an appropriate combination of different classification abilities of the examined models will improve the classification results compared to the individual models. In this regard, we proposed a stacked deep learning architecture that relies on the four convolutional models. (3) Thirdly, we aim to build and discuss in detail a mobile architecture for bug bite classification that can be easily adapted for everyday use and transferred to other application domains. Moreover, using the application, we provide a way to enrich the dataset by adding 106 new, user-created images to the database. (4) Finally, we aim to increase the modularity of the application and to improve its efficiency. To this end, we proposed a two-tier architecture, which is another novelty in our work. By filtering the non-skin images on the mobile phone at the first level, we simplify the whole process; we protect it from the unnecessary transfer of images to the server and make it more efficient.
We believe that our research brings novelty in the field—we have laid the groundwork and have set a baseline against which the future results will be compared. We also believe that our thorough analysis will contribute to the future research on the identification of skin conditions. The valuable knowledge extracted from a larger database of images of bug bites may assist the doctors and provide more insight into the domain for both physicians and researchers. This knowledge will also serve as a teaching guide to medical students, especially to those enrolled in the fields of dermatology and epidemiology. Finally, the application may be a reliable automatic personal assistant that will quickly give information about the bite and perhaps advise a visit to a doctor.
The rest of the paper is organized as follows.
Section 2 covers the materials and methods. Here, we describe the data used in our study. We give details on the methods, the proposed approach, and the mobile application for bug bite classification.
Section 3 presents the classification results. The discussion is given in
Section 4.
Section 5 contains the concluding remarks and possible directions for future work.
2. Materials and Methods
Our research is focused on an image classification problem aiming to determine the bug that caused the bite on the basis of a provided image of the bug bite taken with a mobile phone. In this paper, we used various classification methods to address the bug bite classification task. The traditional methods that we tried, which were based on extracted SIFT descriptors, feature bagging, a support-vector classifier, a random forest classifier, and a grid search with 5-fold cross-validation, showed poor results. Thus, in this paper, we do not report and discuss these traditional approaches and their results.
Recent studies have shown that deep learning techniques have taken the leading role in various directions of computer vision, such as segmentation, detection, classification, etc. [
25]. This motivated us to apply CNN architectures to the bug bite classification task and to compare the results from their evaluation. In this paper, we report results regarding the models based on the following CNNs: (1) the lightweight MobileNet-v2 because it is particularly designed to fit the limited performances of mobile devices; (2) the very powerful but extensive VGG16 due to its simplicity and fast convergence in addition to its power; (3) Inception-v3 because of its computational efficiency, which does not compromise the performance; and (4) DenseNet169 due to its ability to increase the accuracy without reducing the performance while avoiding the risk of overfitting. We have also tried several other state-of-the-art strategies, including those provided by Google’s service AutoML Vision [
26], as well as different variants of Xception [
27], but we do not report the results based on these architectures since they performed significantly poorly.
Additionally, we propose a two-level approach, in which skin vs. non-skin images are filtered at the first level, while the bug that caused the bite is identified at the second level. At the second level, the pre-trained, transfer learning CNN models tuned for this specific task, including MobileNet-v2, VGG16, Inception-v3, and DenseNet169, are used and compared. Additionally, with an expectation for the improvement of the model performances, we propose an ensemble model built with model stacking. An end-to-end system that relies on this two-level approach is described in this section as well.
For each of the applied methods, we use the training set for the training and optimization of the models. The test set is used out-of-sample for the evaluation of the models’ performance.
2.1. Dataset Description
There are limited sources of publicly available datasets with images of bug bites. The dataset discussed in [
21] contains 61 images in total, divided into two classes—mosquitoes and ticks. It was collected for the purpose of differentiating between a mosquito bite and a tick bite, and the same purpose was also used in [
22]. Another dataset consists of a total of 1300 web-scraped Google images [
24] collected with the Selenium Python library [
28]. The images in this dataset are divided into 8 categories: ants, bed bugs, chiggers, fleas, mosquitoes, spiders, ticks, and skin without any bites. For our research, we merged these two datasets, aiming to provide a greater number of images and a variety of bug bite types. Additionally, we enriched the dataset with images of bee stings collected with the aforementioned method used in [
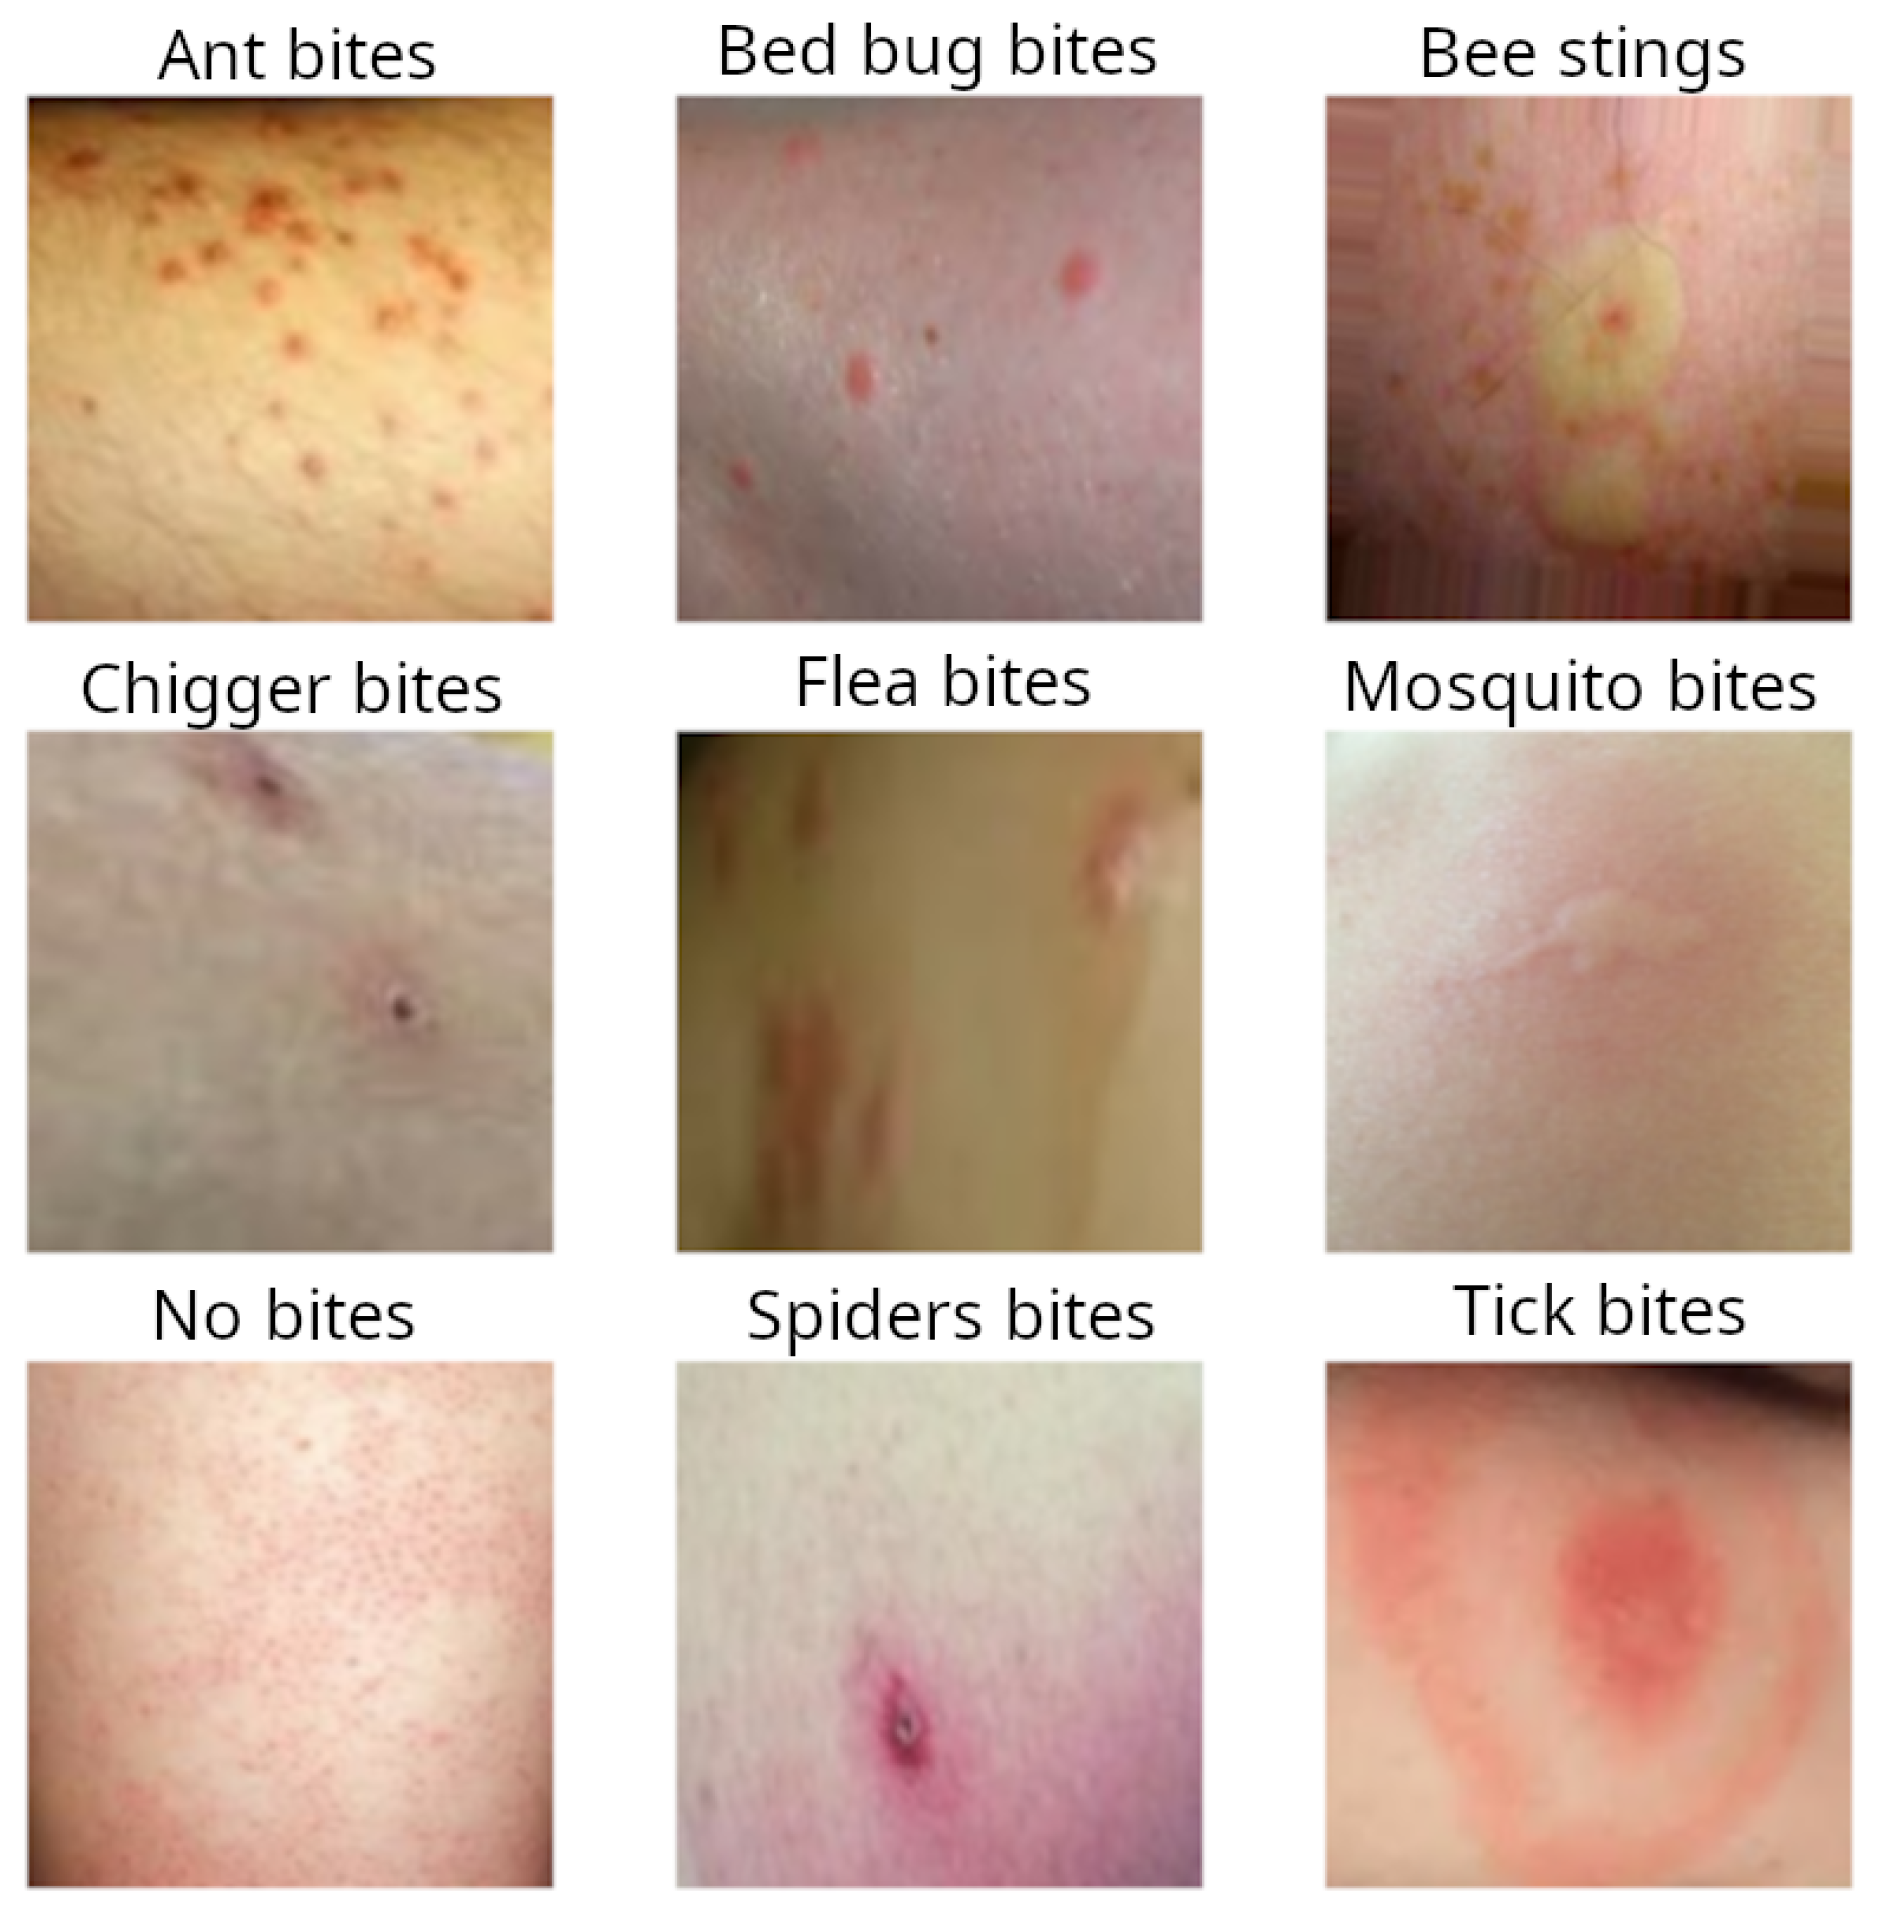
24]. The final dataset includes images of bites from eight different bugs: ants, bed bugs, chiggers, fleas, mosquitoes, spiders, bees, and ticks, each representing a separate class, and an additional ninth class, representing unaffected skin.
Although the aim was to collect only images containing skin with bites or rashes, there were also images showing parts of the human body, such as a legs, arms or fingers, containing the bites. This could contribute to the weaker performance of the classification models because they might try to additionally learn the representation of the body part. Since our objective is to perform classification based on the bite itself, the images were manually cropped to show only the affected skin area.
Considering the final dataset, there were 1168 images in the training set and 258 images in the test set. The images in each class were split between the training and test set with a train-test ratio of 18%.
Table 1 summarizes the total number of images per class and the number of images in both the training and test sets per class. The ratio between these sets for each class is depicted in
Figure 1.
Figure 2 shows a sample image from each class in the final dataset for bug bite classification.
Regarding the skin classification task, all the images from the bug bite dataset (with and without bites) were used as skin-labeled images. On the other hand, randomly collected images from various categories such as nature, objects, etc. from ImageNet were used as non-skin images. The training set contains 1168 images with skin and 1200 without, while the test set consists of 258 images with skin and 400 without (
Table 2).
2.2. Data Pre-Processing
The aim of image pre-processing is to improve the image data by eliminating unwanted distortions or enhancing specific image features that are relevant and essential for the problem to be solved. It helps to reduce the impact of lighting variation, hardware component variation, and shadow effects by normalizing, de-noising, and converting images into different colour spaces [
29]. During the preprocessing part in this research, different variations were tried, including per-channel global normalization and clipping, channel-wise normalization (x-mean_ch255+0.5), and different image sizes.
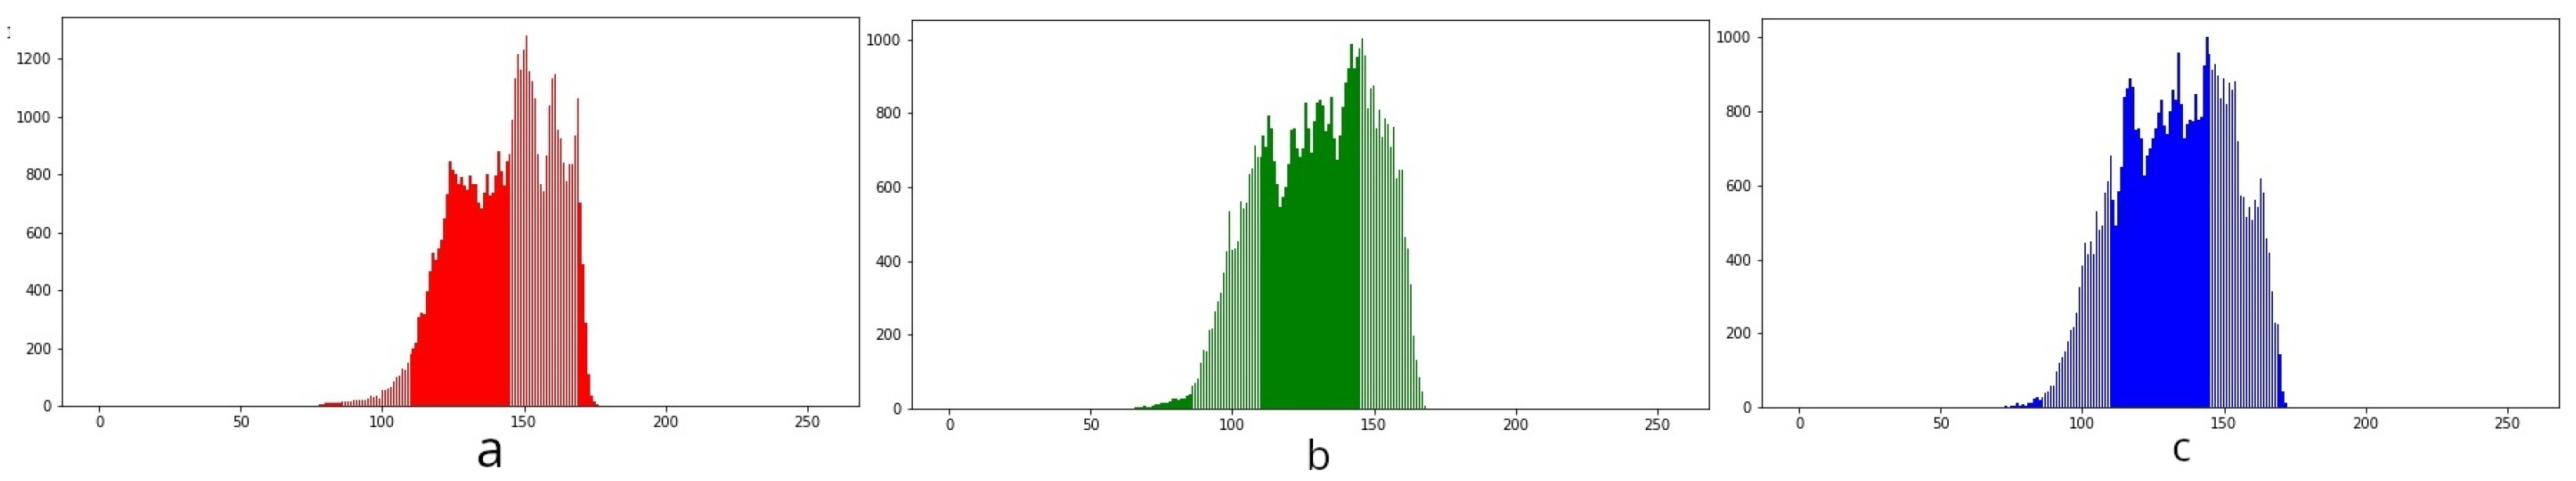
In order to obtain more insight into the visual image features, we analyzed the color histogram of all three channels of training (
Figure 3) and test (
Figure 4) datasets. We concluded that there are significant differences in the color histograms of both datasets. To provide adequate pre-processing, we calculated the mean for each channel of the training set. These mean values were later subtracted from the true channel values of both sets, respectively.
All the images were resized to conform to VGG16 input size, i.e., 224 × 224. This input size is also suitable for the other models, except for Inception-v3. Even though the default input image size of Inception-v3 is 299 × 299, we did not resize the images to 299 × 299 specifically for this model.
2.3. Data Augmentation
In order to increase the size of the dataset and its diversity, without actually collecting new images, we also used data augmentation on the training set. This technique means adding slightly modified versions of the existing images or artificially creating synthetic images from existing ones. This step is very important for training a well-performing model, especially in the case of a small-size dataset [
30].
In this research, we applied conventional data augmentation techniques via the Keras ImageDataGenerator class, which include image rotation by an angle from the interval [−10,10], zoom with a range of 0.2, width and height shifts by 10%, as well as horizontal and vertical flipping of the image.
2.4. Transfer Learning
Although CNNs have attracted significant attention recently, there are still substantial factors that may limit the utilization of the powerful advantages that they offer. The computational burden is the first possible challenge regarding deep learning models. The availability of a large-scale, labeled training set is the other possible challenge [
31]. One method that overcomes these challenges, allowing robust model training on the basis of a small dataset, is transfer learning. Transfer learning provides a way to pre-train deep learning models using large, general purpose datasets such as ImageNet [
32] (also used in our research for pre-training) and to use the pre-trained weights to initialize the custom model parameters. These weights are “frozen” (not trained) in the new model, which reduces the number of parameters that must be estimated. To be able to fine-tune the model to fit the task of interest, the unfrozen layers are trained with the new images. In this way, it is possible to train accurate models with a smaller number of images (hundreds to thousands) rather than with large-scale databases (containing millions of images) and to help the model to quickly converge [
29,
33,
34].
It should be noted that the dataset used in this research is not of a large scale, and it has low similarity to the dataset in which the pre-trained model was trained. Considering this, we resort to freezing the initial layers of the pre-trained CNN and thus compensate for the small dataset size. Then, we train only the remaining layers and customize them to the current dataset.
2.5. Hyper-Parameters
Identifying the most appropriate structure and parameters of the deep-learning models used for a particular machine learning task and underlying data is one of the crucial challenges. This can make a huge difference in the obtained results and the drawn conclusions. For example, the following parameters can be analyzed and tuned: the number of layers and nodes, the learning rates, the dropout rates, etc. There are no exact values of the hyper-parameters that fit all the algorithms and their applications. They can be chosen based on heuristic rules or can be manually fine-tuned. One can also apply more advanced strategies for an automatic and effective parameter space search [
35,
36].
During the process of building models in this research, in order to obtain the most accurate models possible, several experiments were carried out towards hyper-parameter optimization. For each of the models, we experimented with different batch sizes of 16 and 32, as well as different numbers of epochs needed to obtain satisfactory results, from 5 to more than 124, with and without early stopping with different patience. We also tried different learning rate values from 10−7 to 10−3, as well as different optimizers, such as SGD, Adam, Adamax, etc. For all the experiments, the accuracy metrics on the training and test sets were observed, as well as the time required for training and for one epoch, virtual memory usage, etc. Four models were selected based on the overall efficiency, and their results are reported and described in more detail in the following subsections.
2.6. CNN Variants Used for Bug Bite Classification
This subsection describes the methods that were used to address the bug bite image classification task, namely the state-of-the-art deep learning methods customized to address this task. Additionally, we explain in detail the proposed ensemble stacked architecture.
2.6.1. Convolutional Neural Network Architectures
MobileNet-v2. One of the chosen base models in this research is MobileNet-v2 [
37]. We selected this model since it is lightweight, less complex, and, at the same time, has high execution speed. It is specifically tailored to fit the exceptionally limited performances of mobile devices and other constrained-resource environments. The model consists of 3,538,984 parameters in total and has a depth of 88 layers. For this research, we used the implementation of the initial model from the Python library Keras [
38], on top of which we built the custom layers. Transfer learning was performed using the ImageNet dataset, and the weights learned on this dataset were used to initialize the MobileNet-v2 model. Then, we added custom layers over the pre-trained Mobilenet-v2 to be able to fine-tune the existing network for our specific task of bug bite image classification. In fact, the output of the last layer of the MobileNet-v2 model, consisting of 1280 feature maps that were 7 units in width and height, was fed into a two-dimensional convolutional layer with 256 kernels of size 3 × 3 with ReLU [
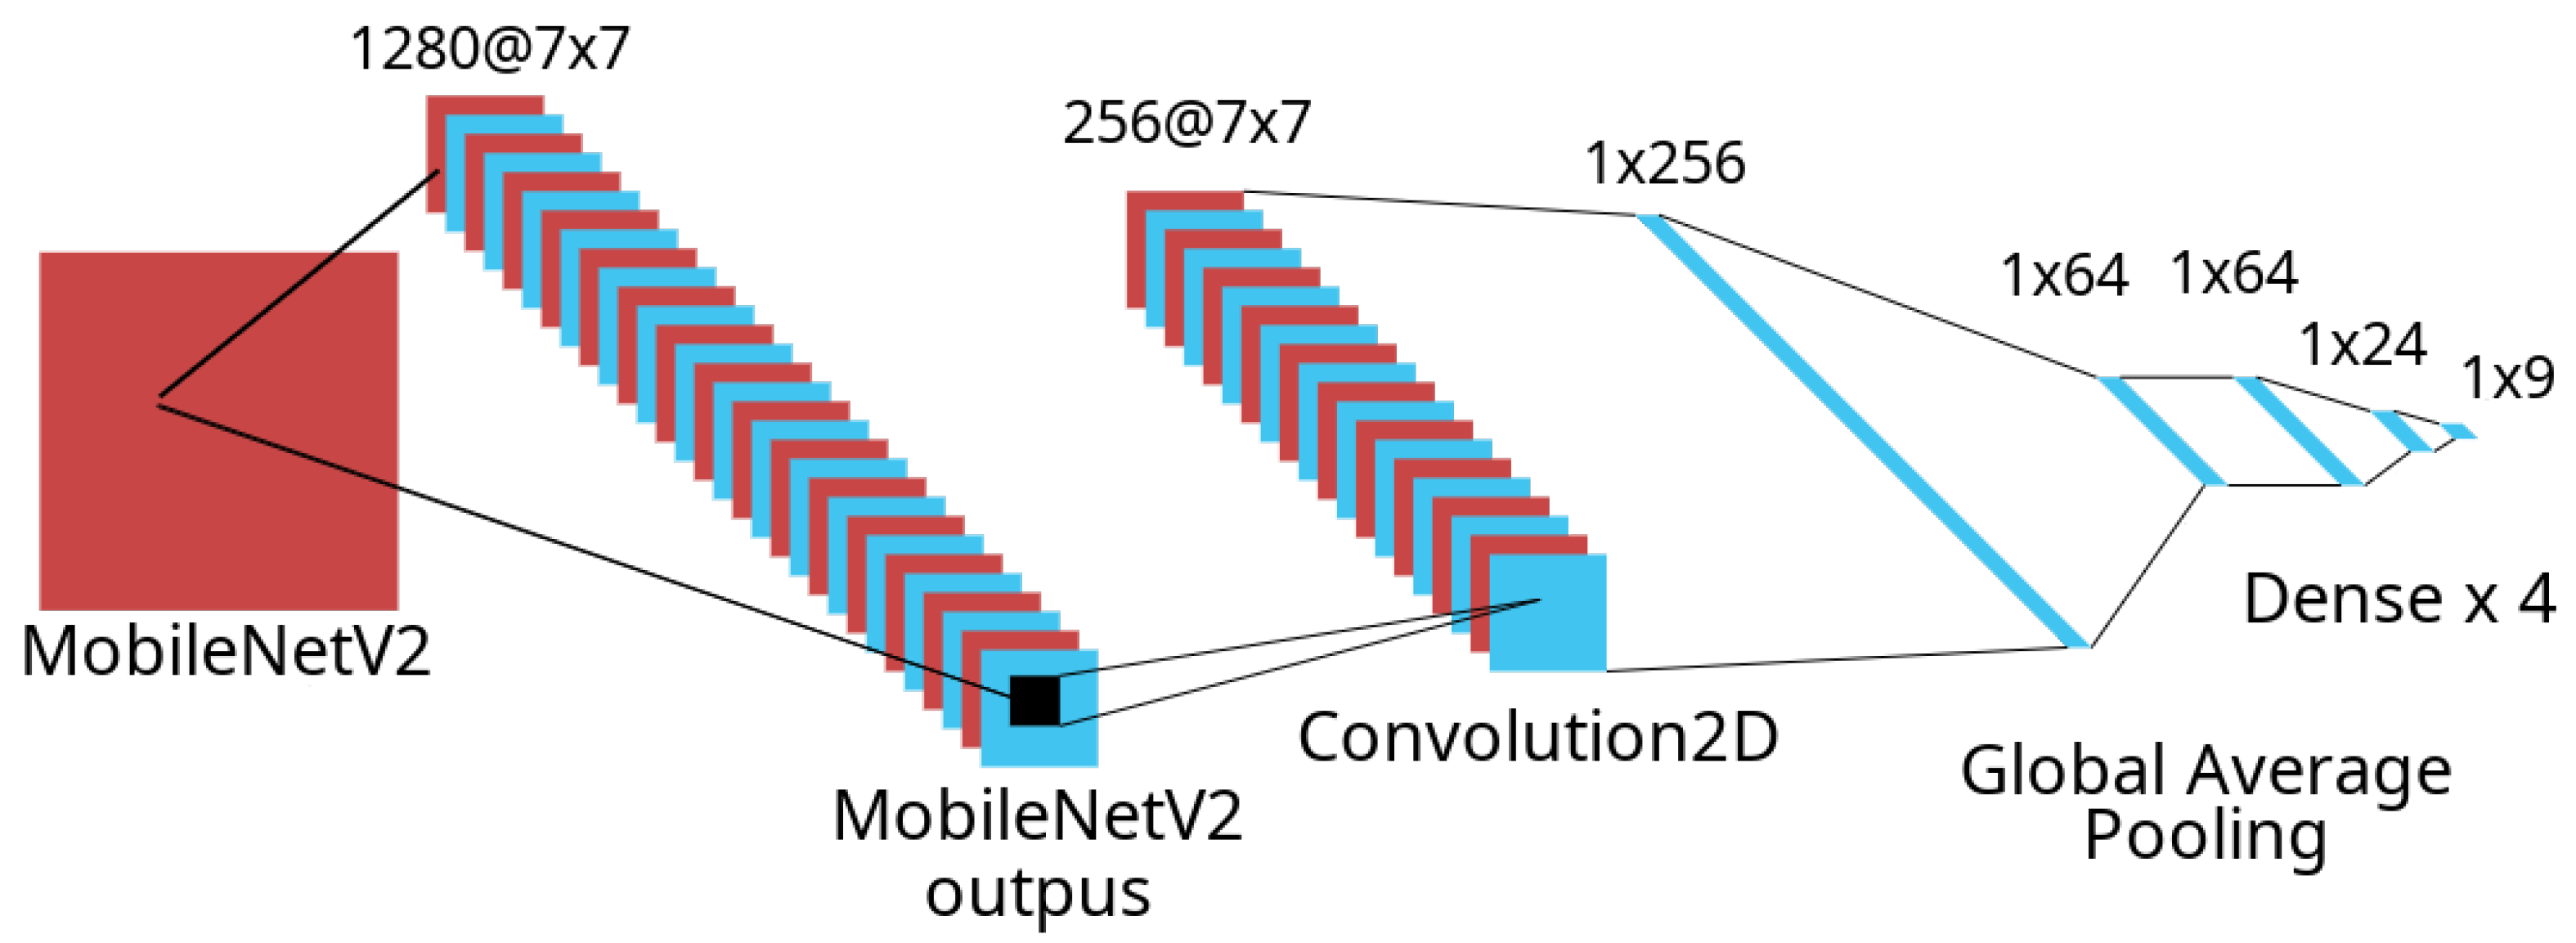
39] as an activation function. Then, global average pooling was performed, which resulted in a feature vector with 256 features, each generated from one of the feature maps produced in the previous convolutional step. In the next step, a dense layer with 64 neurons and ReLU as an activation function, along with a connection dropout rate of 10%, was used. Another dense layer with 32 neurons and a ReLU activation function was then added, the result of which was finally fed into a softmax layer (usually used for multi-label classification) with 9 neurons, representing a normalized probability of each of the 9 classes. The complete model architecture, including the custom layers, is depicted in
Figure 5.
The training process was executed by freezing all of the parameters of the pre-trained MobileNet-v2 model and updating only the weights of the additionally stacked layers. The resulting model has a total of 2,968,168 trainable and 2,257,984 non-trainable parameters. The loss function that was optimized was categorical cross-entropy loss, calculated as:
, where
is the true label,
is the softmax probability for the
ith class,
n is the number of classes, and log is calculated to base 2. The Adam optimizer was used for the gradient descent algorithm [
40] and initialized with a learning rate of 3 ×
. The model was fit to the training dataset using 150 epochs. A model summary based on MobileNet-v2 with custom layers is given in
Table 3.
VGG16. One of the most popular and widely used CNN models, also considered to be one of the best computer vision models, is VGG16 [
41,
42]. This model achieved 92.7% test accuracy on the ImageNet dataset. Although it is a very extensive network, containing 138 million parameters and 21 layers, VGG16 is characterized by simplicity and fast convergence, in addition to its power. This is the reason why we also chose this architecture for our research.
Regarding the VGG16 architecture, it contained thirteen convolutional layers, five max pooling layers, and three dense layers, of which sixteen were weight layers (with trainable parameters). The base model layers were divided in five blocks. Tje first two blocks consisted of two convolutional layers and one max pooling (MaxPooling2D) layer, and the next three blocks contained three convolutional layers and one MaxPooling2D layer each.
To customize and fine-tune the pre-trained model, we unfroze the top layers of the frozen model base, and then, we jointly trained both the newly-added custom layers and the last layers of the base model. In fact, we dropped-out the 3 fully connected layers and the last layer that makes a prediction at the top of the base model. The parameters of the first 10 layers were frozen, and the other layers were retrained. The output of the last layer, which was MaxPooling2D, was flattened and was fed into a dense layer with 512 neurons along with the ReLU activation function. To reduce over-fitting, dropout with a probability of 20% was used. Another dense layer with 256 neurons and the ReLU activation function was then added. The last layer was a dense layer with 9 neurons and a softmax activation function. The final model had 25,958,409 trainable parameters and 1,735,488 non-trainable parameters (
Table 4).
During the training process, the Adam optimizer with a categorical cross-entropy loss function and a learning rate of were used. The best model weights were saved using the callback function based on the max validation accuracy over 50 epochs.
Inception-v3. Inception-v3 is an image recognition model widely used in computer vision. Compared to its predecessors, it is a deeper network with uncompromised speed characterized by higher efficiency. It has achieved accuracy greater than 78% on the ImageNet dataset, while having fewer parameters and lower memory and resource consumption [
43]. This architecture has proven to be more computationally efficient in comparison to VGGNet, both in terms of the number of parameters and resource costs [
44]. In fact, generally speaking, it was created to reduce the computational burden of deep neural networks and to maintain the state-of-art performance at the same time. This is the reason why we chose this architecture for the bug bite classification task.
Inception-v3 contains symmetric and asymmetric building blocks that include convolutions, average pooling, max pooling, dropouts, concatenations, and fully connected layers, along with the usage of batch normalisation and the softmax loss function.
The Inception-v3 implementation used in this study was taken from the Keras Python library [
38]. It has a total of 21,802,782 parameters across 311 layers. Weights learned on the ImageNet dataset were used for transfer learning. We concatenated four additional layers to the model’s output. Namely, we added a flatten layer to the output, a dense layer with 1024 neurons and the ReLU activation function, a dropout layer with a 0.2 dropout rate, and finally, a dense layer with 9 neurons and a softmax activation function that represents a probability for each class. Additionally, we tried using only certain layers of the Inception-v3 model instead of using all 48. Two cases were tested: one using all the layers from the beginning of the model until the layer named ‘mixed4’ and the other, similarly, until the layer annotated with ‘mixed7’. The same additional layers mentioned before were added in all three cases (mixed4, mixed7 and the case when all the layers were considered) and are summarized in
Table 5. The resulting model using all Inception-v3 layers has 52,439,049 trainable and 21,802,784 non-trainable parameters, the model using all layers until the ’mixed4’ layer has 113,256,457 trainable and 3,445,920 non-trainable parameters, and finally, the model using all layers until the ’mixed7’ layer has 113,256,457 trainable and 8,975,264 non-trainable parameters (
Table 6).
The training of the model was carried out by freezing all the parameters of the layers taken from the Inception-v3 model and updating the weights of the aforementioned added layers. Categorical cross-entropy was used as a loss function during training, as well as the Adam optimizer with a learning rate. The training was carried out using 50 epochs for all three models.
DenseNet169. DenseNets have the advantage of increasing the accuracy by increasing the number of parameters without reducing the performance and without the risk of overfitting in the case of training with smaller datasets [
45]. In fact, they demonstrate the ability to learn deeper and more discriminative features from images [
46]. Because of these properties, we include this CNN in our research. DenseNet-169 has a depth of 169 layers and a relatively low number of parameters. In fact, it shows similar or higher performance on the ImageNet dataset achieved with half the number of parameters compared to other architectures [
45].
The DenseNet169 architecture was adjusted for the current problem by modifying and adding new layers. More precisely, we used the DenseNet169 model from the Keras library, modified with a custom input layer together with pooling, batch normalization, dropout and fully connected layers on top of the pre-trained network. The batch normalization was incorporated in order to constrain the output of a layer in a specific range, with a mean of zero and a standard deviation of one, which works as regularization. With that, the stability of the neural network was increased, and the training was faster [
47]. The dropout was also used as a way of regularization, achieved by inhibiting neurons.
In order to experiment with the architecture and improve it, a custom model was made on which several different variants of layers and techniques were applied. This includes an input layer with a custom shape, global average pooling, batch normalization, a dropout of 20%, a dense layer with 2048 neurons, ReLU, a dropout of 20%, a dense layer with 512 neurons, ReLU, a dropout of 20%, a dense layer with 128 neurons, ReLU, a dense layer with 9 neurons, fully connected layer(s) with dropout, ReLU activation, a fully connected output layer, and softmax activation. A learning rate of 10
−5 and 70 epochs were used for training. The architecture of the best-performing variant is given in
Table 7.
2.6.2. Classifier Fusion
Classifier fusion [
48] represents a methodology for combining the inference capabilities of multiple classifiers with the goal of achieving an improved accuracy by using one of many possible fusion methods. This subsection presents the fusion algorithm used in this study. To implement the fusion, we have used four different types of deep neural networks as base models: MobileNet-v2, VGG16, Inception-v3, and DenseNet169, customized for the specific problem of bug bite classification. Multiple classifiers were generated from each of the four base types, with subtly different model architectures, and the best performing model from each type was chosen for the classifier fusion. As will be described in more detail in the
Section 3, each of these models has the power to perform better in the classification of bug bites of different classes. We expected that with the fusion of the different models, we will take advantage of the powerful capabilities for correct classification that each model exhibits for certain classes, which would lead to an improved fused model.
The implementation of the classifier fusion is given in
Figure 6. The fusion was implemented as a variant of ensemble learning [
49] called model stacking. In the ensemble architecture, we used each of the chosen models and concatenated their outputs in one output vector, which was then fed to a fully connected layer with 128 neurons with a ReLU activation function.
The purpose of the fully connected layer is to learn the impact each model should have when predicting each of the 9 target labels. Some models will be given greater weights for predicting a value for some of the labels, and other models will have a greater influence for other labels. Finally, a softmax layer with 9 neurons was added to the output of the fully connected layer in order to produce a probability distribution over each of the target labels (
Table 8).
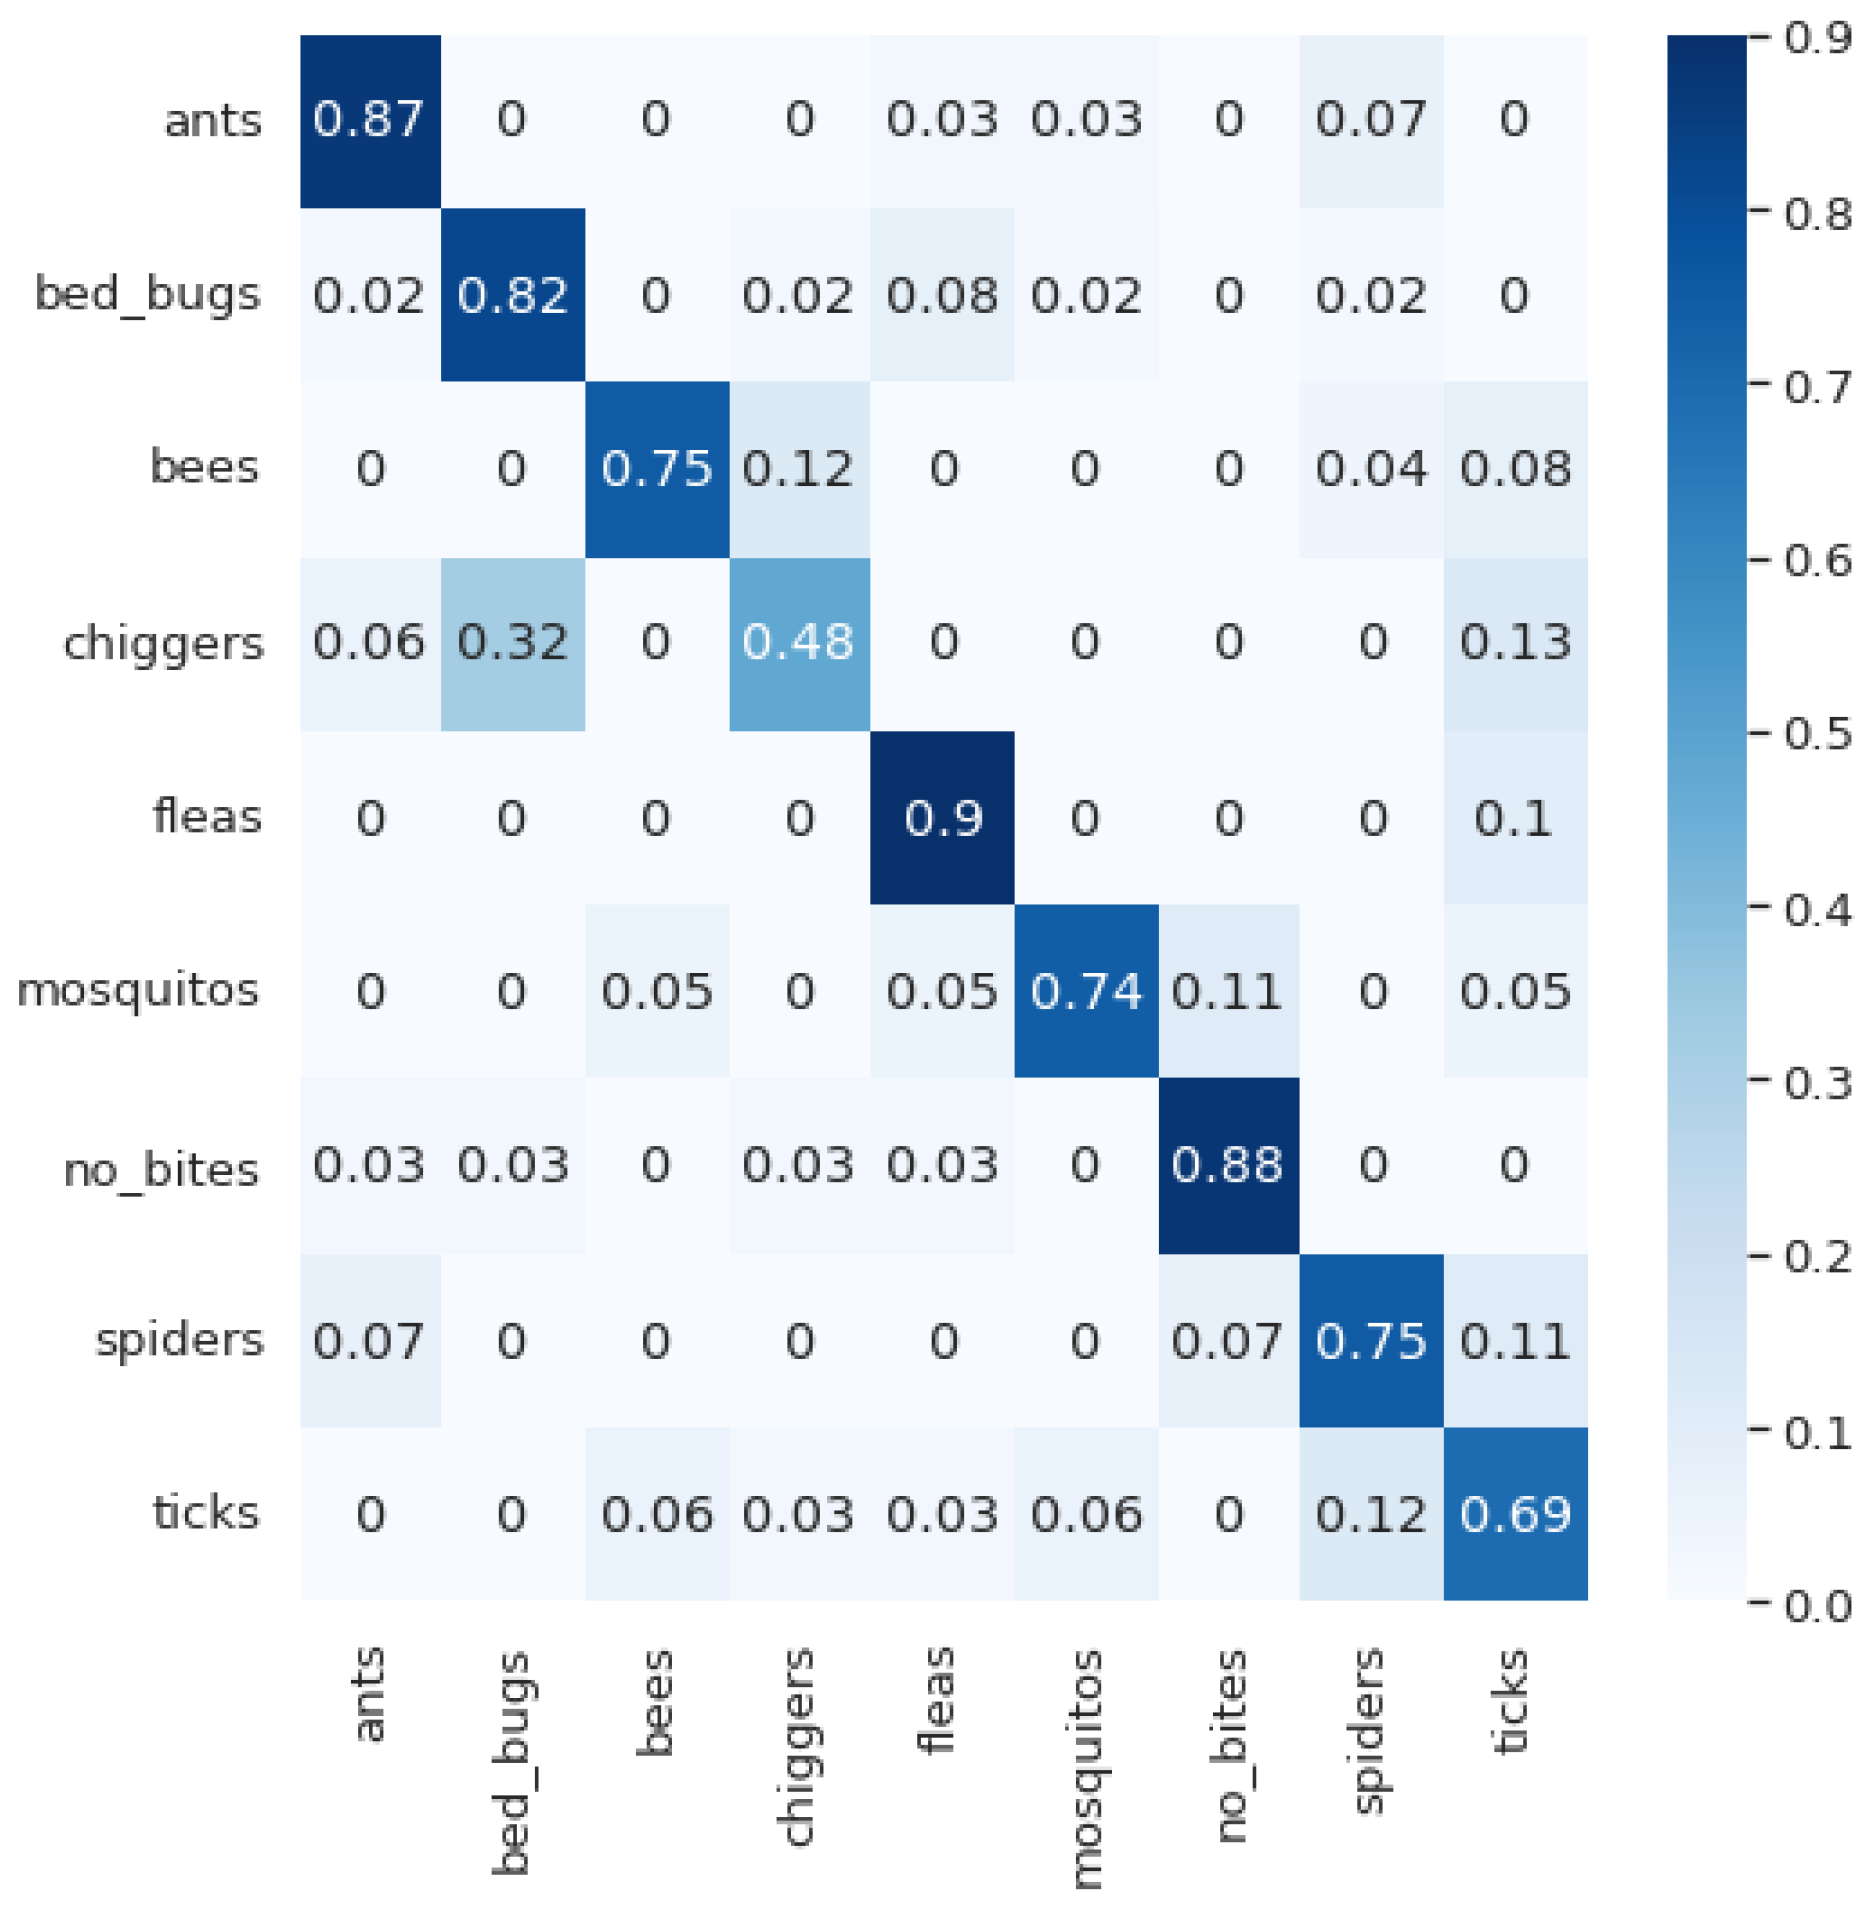
The experimental results have shown a substantial improvement in the accuracy of the stacked neural network ensemble model compared to each of the individual models. The confusion matrices and evaluation metrics are outlined in
Section 3.
2.7. Skin Classification
In order to improve the user experience and reduce the number of user errors, prior to bug bite classification, a skin recognition model was introduced as the first step in the whole process. This may reduce the load on the server where the bite recognition is performed by allowing only skin images to be sent for further bite classification. To perform the classification, we used MobileNet-v2 as a model, pre-trained on the ImageNet dataset.
Table 9 summarizes the custom layers added on the top of the pre-trained MobileNet-v2 model. One of the main features of this network is that it shows high performance on mobile devices, which was the main reason why this model was chosen for the first step of the classification. TensorFlowLite was used to implement this model.
2.8. System Architecture and Proposed Strategy Workflow
Mobile Client Architecture. In the next step of our research, we developed a mobile application for bug bite classification based on the strategy described in this paper. This makes our results practical and useful, gives more insight into the real time usability, and also provides a way to enrich the database. The architecture of the mobile client was built upon the Flutter framework, which was created by Google in 2017. The main components of the architecture are depicted in
Figure 7. The figure consists of 3 types of components: (1) the material app, represented as a light-blue rectangle, (2) the pages, represented as blue tilted rectangles, and (3) the services, represented as rounded red rectangles.
The main component is the material app, consisting of two separate pages: (1) the image capture page and (2) the image stream page. The pages communicate with several services, as shown in
Figure 7.
The image capture page presents the home screen, with functionalities for uploading a bite image from the gallery or starting an image stream from the device’s camera as visible in
Figure 8. The skin image classifier component evaluates the validity of the uploaded images and allows only valid skin close-up images to be accepted. When an image is accepted, the user can crop or zoom the image and then send it to the server with the goal of receiving an accurate prediction of the type of the bug bite.
The image stream page presents a camera view with a bounding box to the user. Images are streamed from the device’s camera in real-time, using Flutter’s camera plugin, and skin prediction is performed on consecutive frames. If a frame is found to represent a skin image, it is accepted by the application, and the user is allowed to crop and zoom it before sending it to the server.
The server communications service component is responsible for maintaining the communication between the mobile client and the cloud server. The chosen communication protocol is HTTP. Upon the start of the application, the server communications service retrieves the global application settings used for pre-processing the user images before uploading them to the server. These settings are also used to define the number and values of the class labels.
The local data storage service component stores a unique user identifier each time the application is installed on a device. This identifier is used for calculating per-user statistics by the back-end server. Moreover, the global settings retrieved from the server are stored in the device’s local storage, with the purpose of easier access by multiple components. It also prevents failure in case of a lost connection with the cloud server.
The chart data service is used solely by the image capture page as a utility component for processing the data returned upon the prediction of a bite image. The data consists of a normalized probability distribution over all of the class labels and is presented to the user in bar chart format.
The image processor service implements functionality for cropping, scaling, resizing, and uploading images from the gallery. With the goal of allowing the users to have more control over the images they upload, we have used the image picker and image cropper plugins, which provide the user with an interactive interface for uploading images from the gallery and their manipulation.
The skin image classifier component represents a custom deep learning image classification model in TensorFlow Lite [
50] format for efficient on-device inference. The model uses MobileNet-v2 as the base estimator with transfer learning. The component is used for real-time image classification from the image stream data coming from the device’s camera and additionally for classifying uploaded images from the user’s gallery.
Back-end Architecture. For the back-end, we used a server-less architecture based on AWS Fargate, and we used Flask as a lightweight back-end framework. For handling HTTP requests and Application Programming Interface (API) definitions, we used ConneXtion and SageMaker for model hosting (
Figure 9).
The API interface is very simple, with just two endpoints. The first one aims to receive an image that is propagated to a module responsible for pre-processing. i.e., to bring it to a format suitable to be sent to the classification model. The pre-processed image is then sent to an inference endpoint hosted on SageMaker where the model is running. This endpoint returns a response in JavaScript Object Notation (JSON) format with the predictions for the image. This information is propagated to a module responsible for saving the image together with the prediction in the database. An SQLite database is used as a database. The prediction is then passed back in JSON format with the prediction probabilities for each of the classes in response to the initial prediction endpoint request. The second endpoint is used to generally retrieve some global settings such as class labels, image sizes, etc.
For model deployment, we used Amazon SageMaker. Data and model artifacts were stored on S3 bucket. Additionally, there was a SageMaker endpoint deployed on a C5 instance, which was accessed by the Flask application (
Figure 10).
4. Discussion
This research is focused on bug bite classification. In this regard, we investigated various state-of-the-art deep learning methods, including MobileNet-v2, VGG16, Inception-v3, and DenseNet169. Transfer learning was performed using the large-scale ImageNet dataset, and the pre-trained models were fine-tuned for the specific task of bug bite image classification. In fact, we applied and analyzed multiple classifiers (in terms of subtle differences in the model architecture) that were generated from each of these four CNN types. From this analysis, the best-performing models were chosen. As it was described in the
Section 3, they exhibit different performance on different bite classes. This motivated us to go a step further and propose a stacked model that uses the aforementioned four types of pre-trained state-of-the-art architectures as base classifiers.
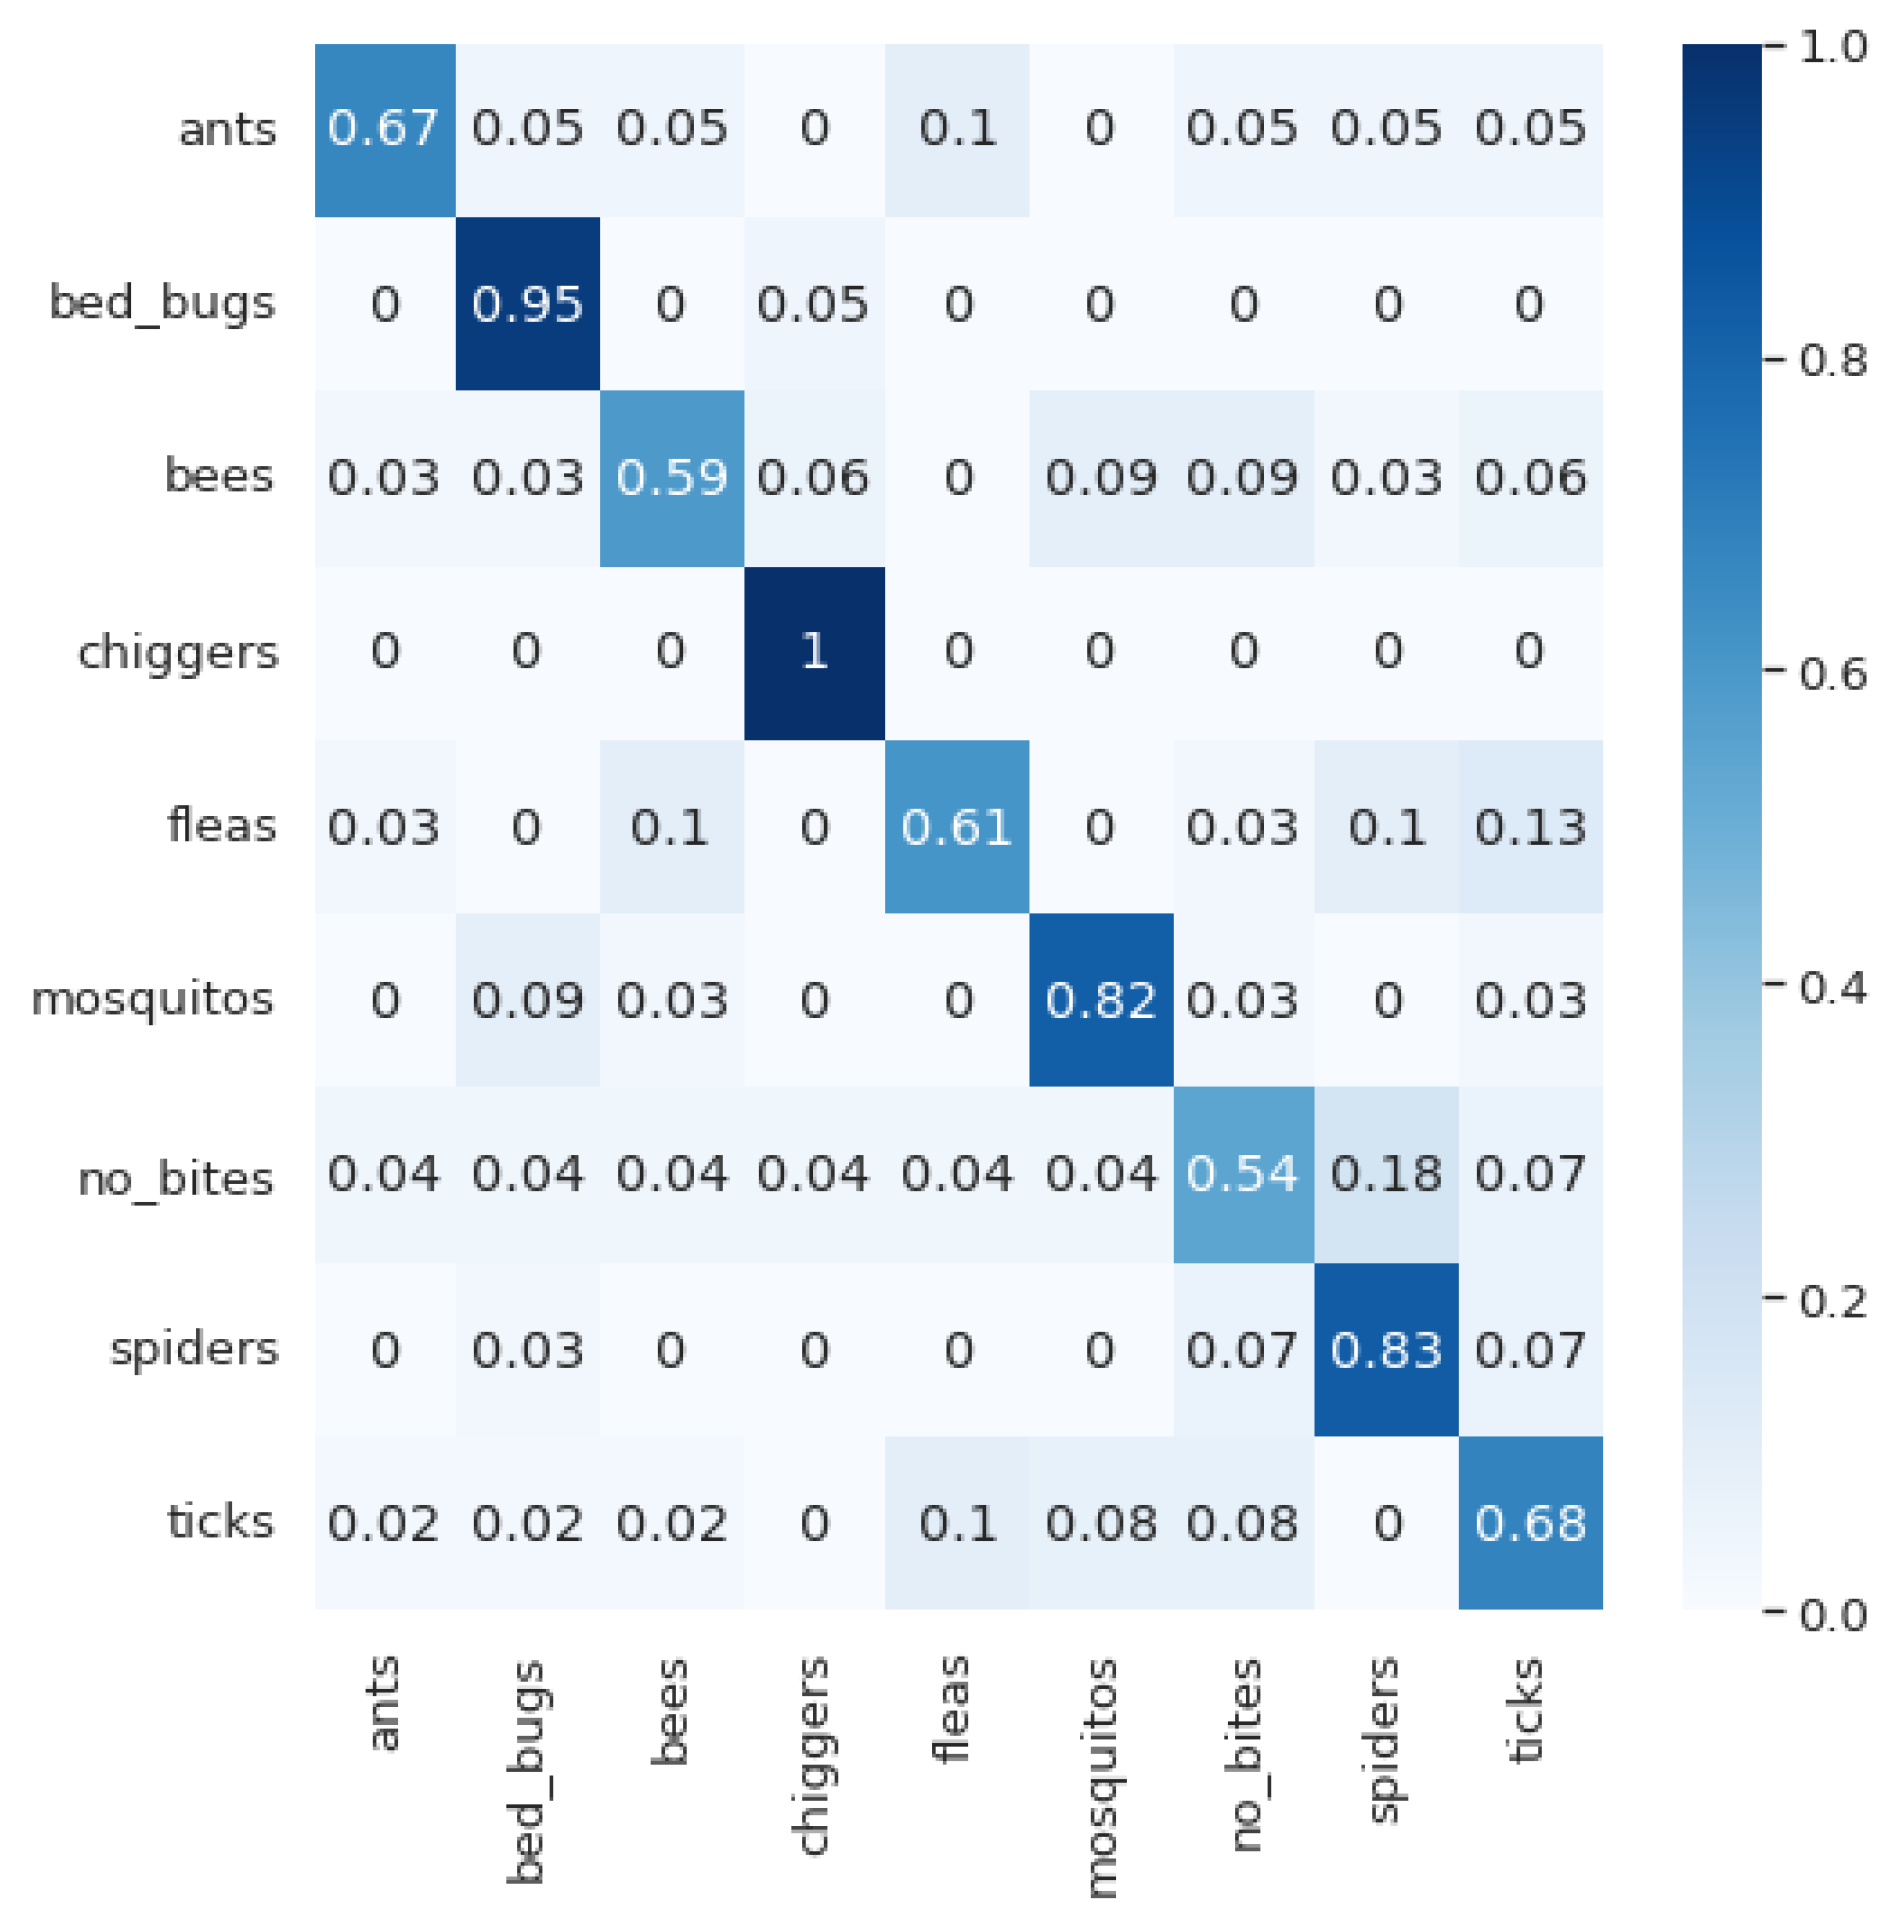
If we look at the confusion matrices, we can see several phenomena that are interesting for discussion. The first thing is that different models perform well for different classes. MobileNet-v2 gives excellent results for bed bug and chigger bites; this is also true of VGG16 for flea bites and Inception-v3 for ant and mosquito bites. Furthermore, DenseNet169 and VGG16 show excellent results for skin classification without bites. It is probably this ability of different models to classify different classes with high accuracy that makes the ensemble model so effective. Another phenomenon that is interesting to observe is the results in the confusion matrix from the ensemble method. Here, we have the weakest results in the classification of the flea class, where a large part of the classified instances are classified as ant bites, bed bug bites, mosquito bites, and bee stings. This is an interesting phenomenon considering that the VGG16 model works best for the classification of the flea bites. We have a similar situation with the classification of bee stings. In the final model, we have a lower percentage of correctly classified instances of this class compared with the DenseNet169 model alone. In this case, a large number of samples are misclassified as spider bites. Additionally, in the classification of spider bites, a large percentage are wrongly classified as ant bites, but it is interesting to notice that the reverse does not happen. The same trend is seen with bee stings classified as spider bites, but the opposite does not apply. These errors may be due to the similarity between the bites but could also be due to the nature of the problem—different bites cause different reactions in different people, so confusion can often occur. People’s race, age, skin type, allergic reactions, etc. also play a role here. The differences may also come from some characteristics of the networks. Additional and deeper analysis in this regard will be part of our future work.
In order to be able to draw more general conclusions about how each of the individual models and the stacked model behave in the classification of bug bite images, we summarize the results of all models in terms of general evaluation metrics in
Figure 17 and individually for each class in
Figure 18. Considering the global evaluation metrics (
Figure 17), the DenseNet169-based model provides the best results among the individual models. Inception-v3 showed comparable results. Slightly worse results were obtained by the customized VGG16 architecture, whereas the worst-performing model tested on the dataset considered in this research was MobileNet-v2. As we expected, the proposed stacked model combines and exploits the classification properties of separate models in a way that leads to significantly better results in general.
In most models and classes, there is a significant amount of variation in the precision and recall measures (
Figure 18). To analyze the performance of the examined models more comprehensively, it is more suitable to observe the F1-score, which is a combination of these two measures and summarizes the model’s performance in a more balanced way. Using the F1-score, it can be noted that the best results are generally achieved by the stacked model, which is to be expected. However, if we exclude that model, it can be seen that different models are the best performers in different classes. The VGG16 model stands out in the ant bites, bee stings, and no bites classes. MobileNet-v2 performs better than other models in the bed bugs and chigger bites classes, Inception-v3 shows excellent results for no bites and tick bites, and DenseNet169 shows the best results in the chigger, mosquito, spider, and tick bites classes. Another thing that is interesting to note here is the big difference in precision and recall in some of the models for some of the classes, such as VGG16 and Inception-v3 in chigger bites or MobileNet-v2 in bed bug bites. This means that these models correctly guess the instances for the target class, but they classify a large part of the instances of other classes as that class. Additionally, there are instances that should be classified in that class but they are miss-classified.
We are unable to make a valid and fair comparison of the results primarily due to the lack of published research on the classification of images of bug bites. In the few web sources that address some aspects of this problem, the datasets used to evaluate their strategies are different, both in structure and size. However, in
Table 16, we summarized the achievements of the other authors together with the results gained in this research in order to be able to provide a rough comparison.
As we can see in
Table 16, the dataset on which we performed the analysis is the largest regarding the number of bug bite images and the most comprehensive regarding the types of bug bites (number of classes). Since our mobile application enables entering the newly captured images into the database, significant enrichment of the dataset is additionally expected. A reduced number of bug bites images but still of comparable size is considered in [
10,
24]. The limitation of the study in [
10] regarding the dataset is that they only considered two classes of bug bites, thick bites, and general insect bites. On the other hand, Ref. [
24] lacks consideration of a bee bites class, and, furthermore, does not include non-bug bite images. In the sources [
21,
22,
23], the examination was performed on a significantly smaller data set.
Regarding the performance metrics, [
21,
22] provide an example of the application of the ResNet50 and VGG16 architectures for bug bite classification on a very small dataset (61 images in total), consider only mosquito and tick bites, and test their performance with only four test images. They obtain 100% and 75% accuracy, but we can not draw any reliable conclusions based on these sources. In [
23], in comparison to our research, the authors obtained significantly lower accuracy based on the same individual models, VGG16 and Inception-v3, evaluated on a dataset of only 171 images. We believe that the reasons for this are the more appropriate customization and implementation of the fine-tuning strategy for the examined models in our study. On the other hand, the reported accuracy in the same research on the basis of an ensemble model is slightly higher (88%) than the one we obtain with the proposed ensemble stacking model (86%). However, they do not support this obtained value of the accuracy with any other performance metric and they do not give any discussion and details about the model. Therefore, we are not able to conduct a deeper analysis in this direction. The simple 3-layer CNN architecture used in [
24] provided the worst results (accuracy of 58.5%). On the other hand, experiments based on the Inception-v3 model provided comparable results to the ones in our study based on the same model and even better in the case when the last 1/3 of the layers were unfrozen after tuning. If we analyze the results more deeply, we can note that the lowest percentage of correctly classified images in [
24] is related to the chigger and bed bug bite classes. The model in [
24] is most likely to misclassify chiggers (as bed bugs) or bed bugs (as chiggers). When analyzing our results obtained from the Inception-v3 model, the situation is very similar. Additionally, the second-worst percentage of correctly classified images in our research based on the Inception-v3 model is related to the bee sting class, which was not included in [
24]. We believe that this has a significant influence and may explain the slightly worse results provided by our customized Inception-v3 model compared to the best-case scenario of the same model in [
24]. We hope to obtain more insight on this in our future work.
Our proposed ensemble stacking model outperforms all the individual models not only in our study but also in [
10,
24]. However, several interesting conclusions can be drawn when we compare our results with those from [
10]. In fact, if we make a model-wise comparison, we can note that our pre-trained fine-tuned individual models show higher accuracy and average F1-score in comparison to all the individual models used in [
10]. The same applies regarding the comparison of the corresponding models. It is interesting to note that in both studies, ours and [
10], the MobileNet-v2 model provided lower values of the performance metrics (more significant in [
10] and less significant in our research). We believe that this is due to the shallowness of the network. Similarly, the DenseNet architecture (together with ResNet50 in [
10]) outperformed the other individual models in both studies. We believe that the possible explanation for this lies in the fact that DenseNet has a higher capacity for multi-layer feature concatenation and better feature use efficiency [
51].
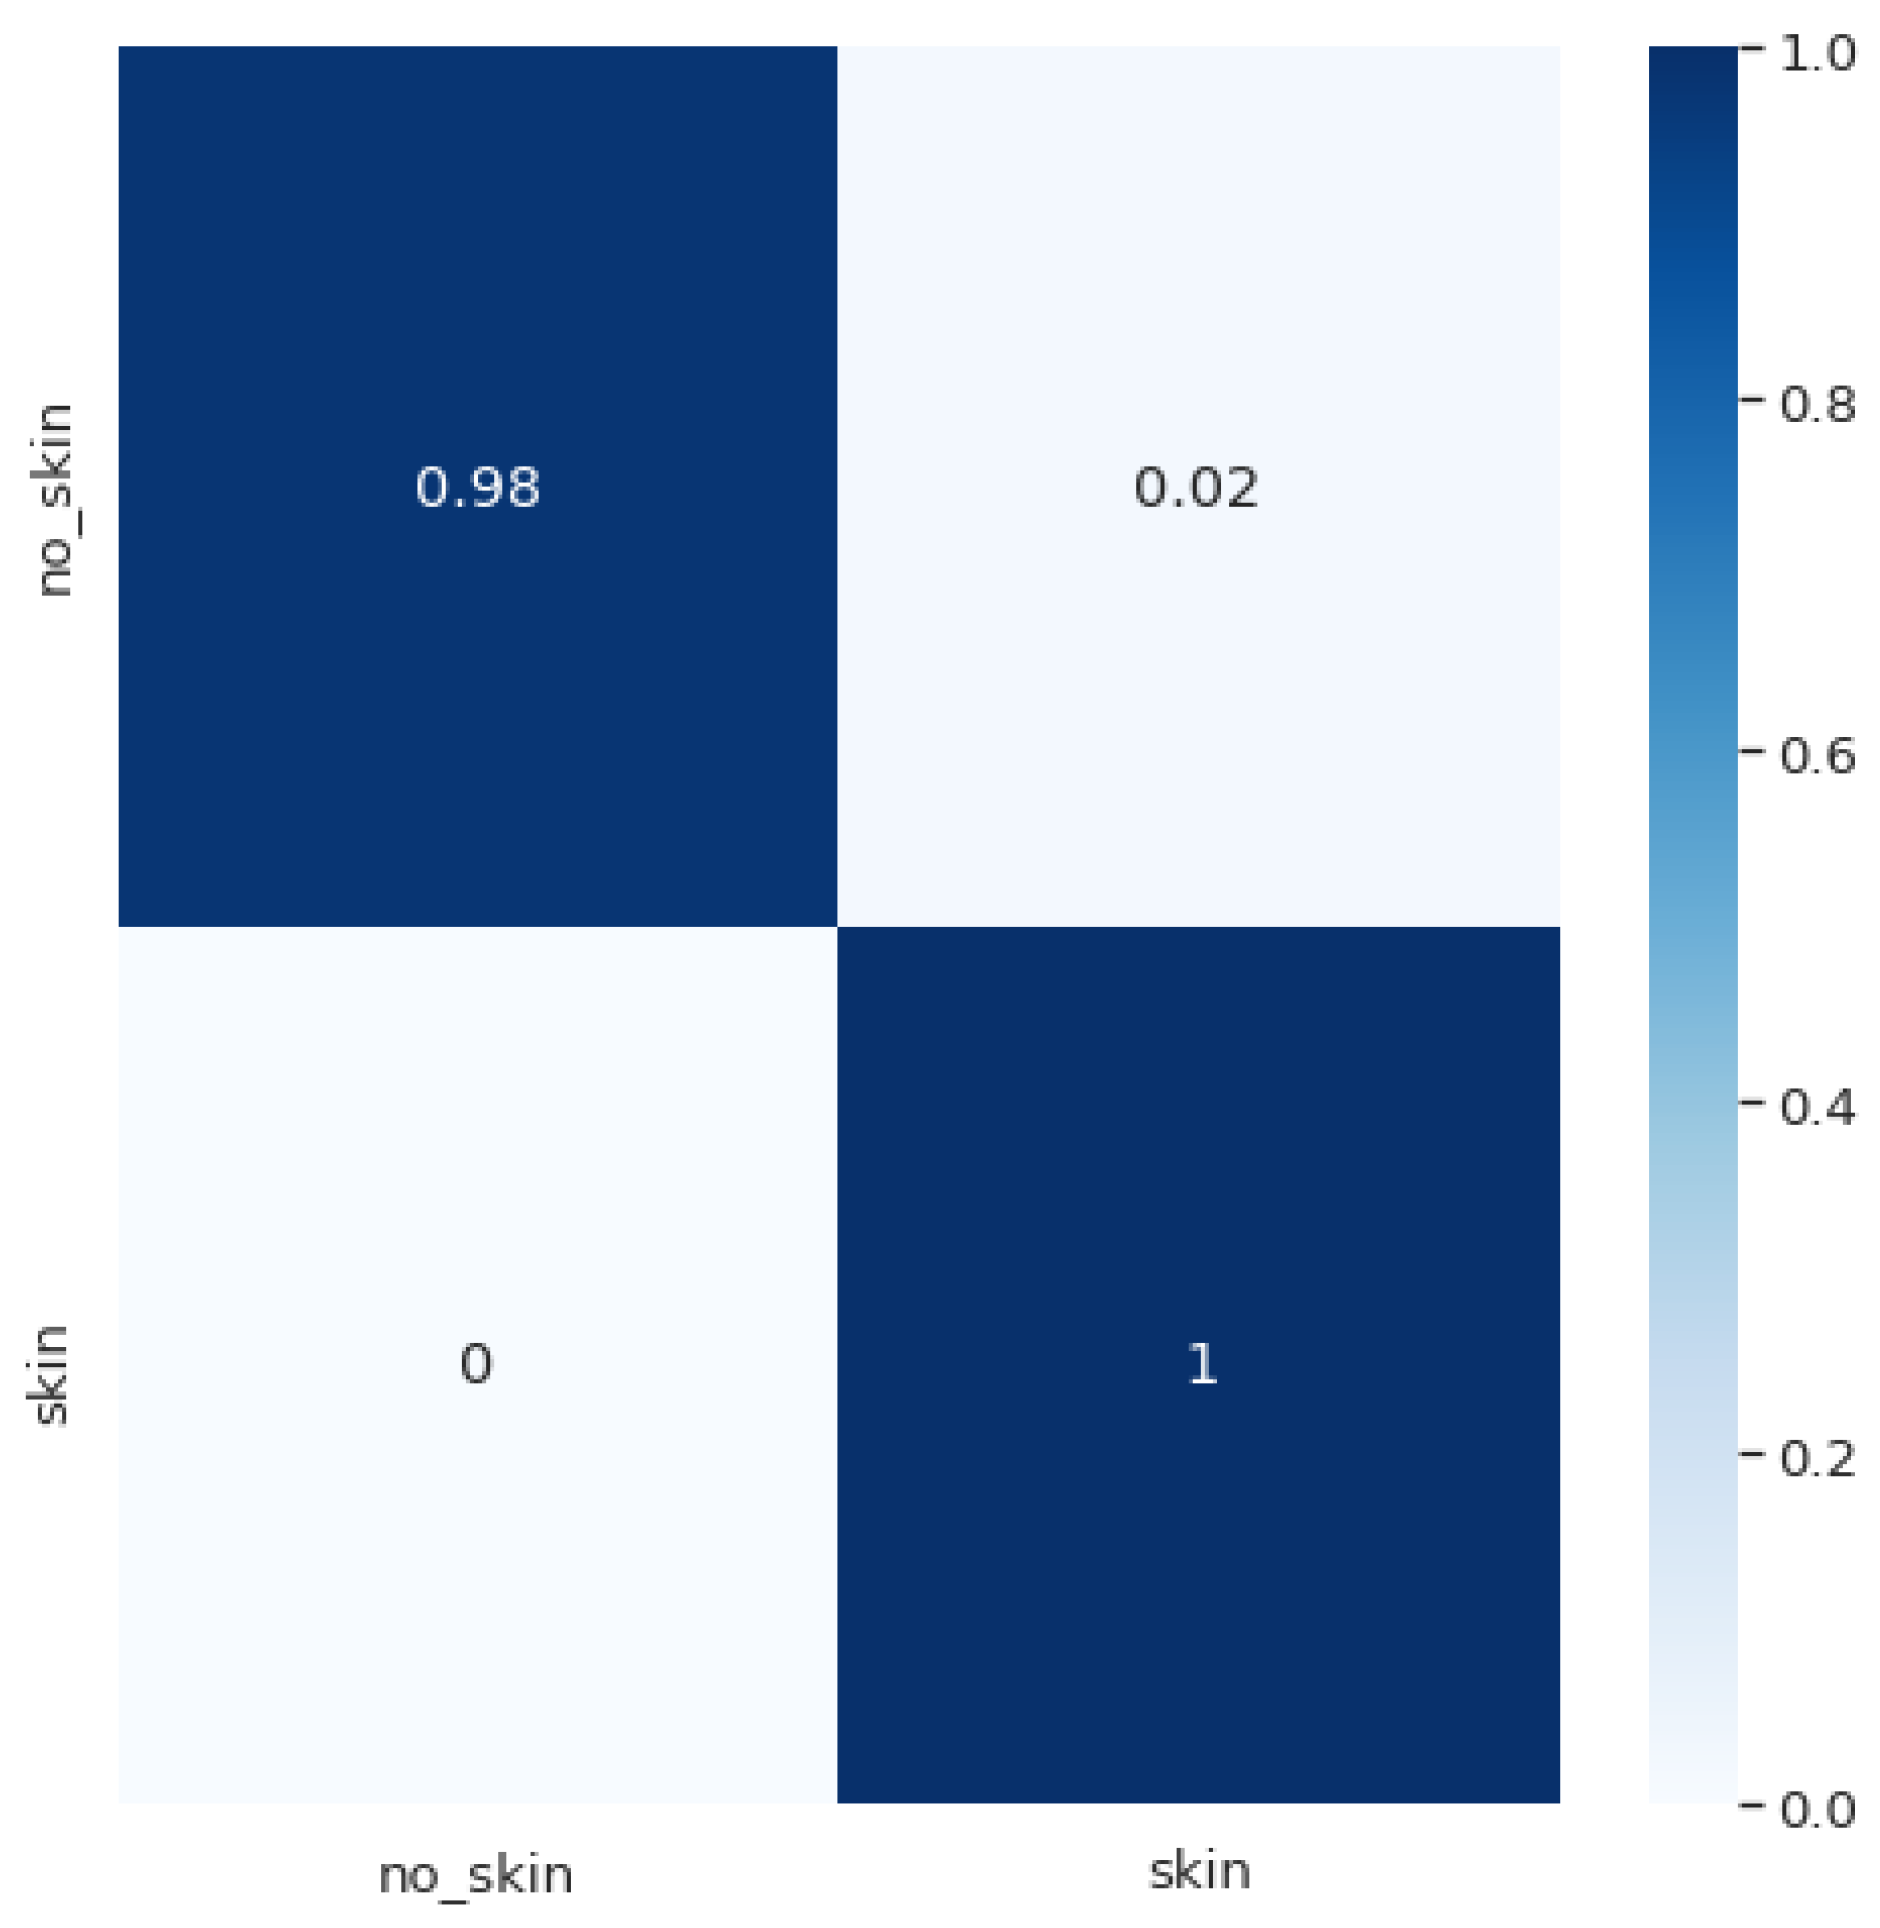
In general, it can be said that our results are better or comparable, and they are obtained on an enriched dataset with greater number of classes. In addition, we treat the problem in a two-level manner; that is, we first deal with the identification of whether the image refers to skin or not, and only then, if it is skin, we classify it as a specific type of a bite or non-affected skin by a bug. Additionally, we developed an efficient end-to-end mobile application based on the models that have proven to be the most appropriate in bug bite classification. Within the application, the discrimination of skin or non-skin images is performed on the mobile device with a high accuracy of 99%, precision of 97%, sensitivity of 100%, and F1-score of 98%, and then the bug bite classification is performed. Moreover, the application offers the possibility to enrich the dataset so that the newly taken images for which bites must be identified can be entered into the dataset for further use. This can be executed after previous verification and approval by an authorized person (admin) for image content and label validity.
There are multiple benefits of this research. First, to the best of our knowledge, the evaluation was performed on the most comprehensive and the greatest dataset of this type. Second, the results showed that this kind of setup is very promising to serve as a second opinion to doctors, a teaching guide for students and researchers, as well as a personal assistant that can provide quick advice about the bite and the possible need to see a doctor. Third, the application and the whole setup provide a good basis for further adaptation, which may aid healthcare practitioners or public health officials in identifying conditions caused by disease-spreading insects and arachnids in particular areas. It may signal the need to take preventive measures in certain areas to control risky situations related to insect bites. Additionally, this kind of automated strategy and system might support the epidemiologists and related authorities to observe the current condition and assess possible risky situations. These adaptations and possible improvements are part of our future work.
5. Conclusions
A bug bite can cause serious, sometimes life-threatening conditions. This may require immediate medical attention, which is directly related to the type of bug that is causing the bite. The different manifestations of bug bites and their similarity to other skin diseases make the identification of the bugs a serious challenge even for a medical expert. Hence, the necessity for a computer-aided automated system that can allow the fast and efficient identification of a given bug bite based on a dataset of images of other people’s bug bites is evident. This kind of system will certainly help both the affected individuals and medical practitioners. Providing such an important and unique solution was the main goal of our paper.
Even though the automatic detection of various skin conditions is an active field of research, to the best of our knowledge, there are limited related results on the topic of bug bite classifications. The known work on this topic covers one or a few simple models applied on smaller datasets with fewer classes and gives no detailed discussion or analysis. Thus, the aim of our paper was to overcome this limitation and provide a comprehensive approach to addressing the problem of the automatic classification of bed bug bites. In this regard, we created a dataset for the evaluation of the proposed strategies, which is the largest in comparison to the other related sources and contains the largest number of bug bite classes. Additionally, we performed a thorough comparison and discussion of the state-of-the-art deep learning architectures, such as MobileNet-v2, VGG16, Inception-v3, and DenseNet169, used with transfer learning and tuned to solve the problem of bug bite classification. We utilized the knowledge gained with this analysis to propose a new ensemble model and significantly improve the classification results. Finally, we developed a unique system for bug bite classification based on images taken with mobile phone cameras, which relies on a two-tier approach. At the first level, skin vs. non-skin images are differentiated on the mobile phone with a very high accuracy of 99%. Bug bite classification is addressed at the second level and is performed only on skin images.
According to the obtained results regarding the bug bite classification task, this study showed that a CNN-based approach with transfer learning is applicable to the bug bite classification problem. As can be seen in the results, the examined CNN models performed differently against different classes of bites. Namely, DenseNet169 outperformed the other classifiers regarding the chigger bite, mosquito bite, spider bite, and tick bite classes, Inception-v3 showed the best results for no bites and tick bites, the VGG16 model performed better than other models in the ant bite, bee stings and no bites classes, and MobileNet-v2 stood out in the cases of the bed bug bite and chigger bite classes.
In terms of the general evaluation metrics, it should be stressed that among the individual models, DenseNet169 provided the best results, reaching an accuracy of 78%. It should also be emphasized that the best results were generally achieved by the proposed stacked model, proving that we can benefit from the different classification properties of the separate models. These results are based on the general evaluation metrics such as accuracy (86%), macro-average calculated for precision (86%), recall (87%), and F1-score (86%), as well as the weighted average calculated for precision (86%), recall (86%), and F1-score (85%).
Considering the fact that we can only refer to a few sources in which the problem of bug bite classification is investigated, we cannot make a fair comparison. However, we can still note that the results gained in this research are better than or comparable to those mentioned in the related sources. Here, we should highlight that the results were achieved on a greater dataset with more bug bite classes.
The novelty and significance of this research is evident since we provided not only a system for bug bite classification but an entire architecture. It is very easy to replace and/or fine-tune the classification model for other applications and use the same front-end architecture (mobile application) and back-end architecture (the API with the endpoints) in solving some other machine learning problems. We believe this adds an additional value to our work.
We need to be aware that each bite can manifest as a different reaction in different people. Therefore, it is difficult to build an efficient classifier for this purpose. However, our results make the whole strategy and the proposed system very promising for practical use. The application may provide automated help to doctors at the right moment and the right place, and it may serve as a second opinion. It may also provide educational guidance to medical students and may be a personal automated assistant to anyone for everyday use. Still, there is room for improvement, and we aim to cover some aspects of this topic in future work. First, it is necessary to enrich the data set even more, and it is very important to add multiple skin colors and address this specific problem. Second, it would be very beneficial if we could incorporate expert knowledge and consider the characteristic manifestation of bites. Third, we plan to add geographical localization, which is important not only for the improvement of the results but also for applications in epidemiology. Fourth, as for the models’ performance, which were not extensively investigated in our current study, more advanced and automated approaches in terms of pre-processing, data augmentation, and hyper-parameter tuning will be considered in our future work.

 ,
, 


