Article

Mathematical Modeling of Battery Degradation Based on Direct Measurements and Signal Processing Methods

by
Joaquín de la Vega
1,
Jordi-Roger Riba
2,* and
Juan Antonio Ortega-Redondo
1
1
Electronics Engineering Department, Universitat Politècnica de Catalunya, 08034 Barcelona, Spain
2
Electrical Engineering Department, Universitat Politècnica de Catalunya, 08034 Barcelona, Spain
*
Author to whom correspondence should be addressed.
Appl. Sci. 2023, 13(8), 4938; https://doi.org/10.3390/app13084938
Submission received: 30 March 2023 / Revised: 6 April 2023 / Accepted: 12 April 2023 / Published: 14 April 2023
(This article belongs to the Special Issue Signal and Image Processing: From Theory to Applications)

Abstract

:
This paper proposes and evaluates the behavior of a new health indicator to estimate the capacity fade of lithium-ion batteries and their state of health (SOH). This health indicator is advantageous because it does not require the acquisition of data from full charge–discharge cycles, since it is calculated within a narrow SOC interval where the voltage vs. SOC relationship is very linear and that is within the usual transit range for most practical charge and discharge cycles. As a result, only a small fraction of the data points of a full charge–discharge cycle are required, reducing storage and computational resources while providing accurate results. Finally, by using the battery model defined by the Nernst equation, the behavior of future charge–discharge cycles can be accurately predicted, as shown by the results presented in this paper. The proposed approach requires the application of appropriate signal processing techniques, from discrete wavelet filtering to prediction methods based on linear fitting and autoregressive integrated moving average algorithms.

1. Introduction

The use of lithium-ion (Li-ion) batteries in energy storage systems (ESS) and electric mobility applications is increasing due to their attractive characteristics such as high specific energy and power density, high charge and discharge efficiency, long life, and low cost. [1]. However, the impedance rise and capacity fade over the cycle life are still the focus of concern. By comparing the impedance or the capacity of the pristine cell with that of the aged or degraded cell, it is possible to quantify the degradation mechanisms since the capacity fades due to the change of some identified kinetic parameters [2]. Today, there is a growing interest in reusing electric mobility batteries for second-life applications such as ESS. Although they have reached the end of their life, second-life batteries from electric vehicle applications still have a residual capacity of about 70–80% [3,4]. However, the performance and efficiency of the reused battery system is highly dependent on the use of these batteries, which require a similar state of health (SOH), capacity, and remaining useful life (RUL). Therefore, it is of utmost importance to establish battery grading techniques, making it necessary to develop fast methods to evaluate the degradation of the batteries in terms of capacity, SOH, and RUL. Such techniques play a key role in the application of battery management strategies, while allowing to extend the battery lifetime and increase the reliability of the battery system. For example, an accurate estimation of the state of charge (SOC) allows avoiding overcharging and over-discharging of the battery, thus prolonging its lifetime [5]. However, electrochemical batteries exhibit a highly nonlinear behavior [5], making accurate estimation of SOC, SOH, and RUL a complex task.
Due to the importance of the battery in electric mobility and energy storage applications, the analysis of the SOH is a priority for researchers. Therefore, numerous methods have been developed over the years to evaluate and estimate the SOH. They can be broadly classified into model-based, data-driven, direct [6], and indirect measurement methods. Model-based methods typically use the battery equivalent circuit or mathematical models such as Nernst or Shepherd to calculate the SOC. However, these models generally do not allow the capacity fade within cycles to be described. Data-driven methods handle large databases and usually predict the SOC using various mathematical techniques such as fuzzy logic [7,8] or neural networks [9]. Data-driven methods treat the battery system as a black box and still provide an accurate response but at the cost of high computational requirements that hinder on-line predictions. Direct methods are typically based on electrochemical impedance spectroscopy (EIS) since the impedance of the cell typically increases gradually with the number of charge–discharge cycles [10]. Due to the wide range of frequencies analyzed in EIS measurements, this technique can characterize internal reaction mechanisms associated with battery aging processes, such as ion concentrations, particle size, dendrite growth, or electrolyte and electrode aging [11,12]. As a result, EIS is more accurate than the conventional method based on temperature, current, and voltage readings from the battery management system (BMS) [10]. EIS provides detailed information about the SOH, and requires long rest periods to reduce the impact of the battery relaxation effect on EIS measurement [13]. Therefore, EIS is difficult to implement in real-world applications due to the lack of practical access to the battery chemistry [14] and the need for a variable frequency generator, making it more suitable for laboratory testing than for direct use in practical applications [6,15,16]. Finally, Coulomb counting is a very common and simple method to determine the capacity of the battery but its accuracy is highly dependent on the precision of the measurements, while presenting a cumulative error [17].
It is very attractive to develop battery degradation models based on the evolution of health indicators to determine the battery SOH and RUL. Common indicators of SOH are battery capacity and internal impedance [18]. Therefore, techniques based on the battery capacity and electrochemical impedance spectroscopy (EIS) are commonly used for this purpose [19]. However, capacity is difficult to measure in on-line processes [18], while impedance spectroscopy is a complex and costly technique [18] that usually requires disconnecting the battery from the load, and interrupting the normal operation of the system, with the associated downtime implications and costs. Therefore, indirect methods for an on-line evaluation of the capacity fade, SOH, and RUL without the need to disconnect the battery from the load require further research efforts.
Since the open-circuit voltage (OCV) at the battery terminal is directly related to the SOC, it can be used to determine the beginning/end of charge/discharge when using the ampere-hour integration method. However, the battery must be allowed to rest for some time before the OCV is measured to ensure voltage stability. This makes it difficult for real-time applications [5]. In addition, the OCV–SOC curve has a certain hysteresis, i.e., for the same OCV, different SOC values are possible when charging and discharging, which affects the accuracy of the SOC calculation [20].
Researchers often use easily measured variables such as temperature, current, and voltage during charge–discharge cycles to determine health indicators (HIs) [18]. The choice of an appropriate HI greatly affects the accuracy of the predictive battery aging model and, thus, the accuracy of RUL and SOH estimation. Battery HIs are typically calculated by processing the battery charge–discharge data using signal processing and/or artificial intelligence algorithms. Battery health indicators can be broadly classified into book-keeping, direct, and indirect HIs. The decrease in the usable capacity of the battery and the increase in its internal resistance are key characteristics of battery aging; so, capacity and internal resistance are the most commonly used HIs to characterize the aging process. While the capacity fade is a book-keeping HI, the internal resistance is a direct HI. Indirect HIs are related to the extraction of indirect parameters from battery charge–discharge data that are strongly correlated with battery aging [21]. Indirect HIs found in the literature include average discharge voltage, maximum discharge current, constant current charge time, charge terminal voltage change, or charge temperature change rate [21].
For an accurate real-time evaluation, depending on the estimation method used, the system will need to store a large amount of data, requiring high storage and processing capabilities. In addition, a complete discharge of the charge stored in the battery or an expensive device capable of measuring other parameters such as internal resistance may also be required. Signal processing plays a leading role in the calculation of HIs for battery diagnosis and prognosis. Raw acquired battery data are usually denoised and filtered; subsequently, linear interpolation, extrapolation, look-up tables, or other processing methods are typically applied to determine the electromotive force. For example, time-domain and frequency-domain signal processing methods are used in EIS approaches because EIS is based on wide frequency-band measurements [15]. In [22], empirical mode decomposition and particle filtering methods are applied to predict the end-of-life of Li-ion batteries, while other authors [23,24] have applied neural networks for this purpose. In this paper, signal processing methods such as discrete wavelet filtering and prediction methods based on linear fitting and autoregressive integrated moving average algorithms are applied.
This paper proposes a voltage-based battery health indicator. It is an indirect HI that, as shown in the paper, is highly correlated with the degradation of battery capacity, since for the analyzed batteries the Pearson correlation coefficient R is around 0.99. The main advantage of calculating the proposed HI is that it is not necessary to collect data of the full cycle, i.e., from a fully charged state to a fully discharged state or vice versa, since it is calculated within a narrow SOC interval where the voltage–SOC relationship is very linear. This interval is found within the usual range of most practical charge and discharge cycles, despite their profiles. Many approaches found in the technical literature require the information of the complete charge–discharge cycles [25,26,27,28]; however, these approaches are not realistic for practical applications, thus this paper contributes in this area. Since the method proposed in this paper requires only the information of a narrow SOC interval, only a small fraction of the data points of a complete charge–discharge cycle are required, thus reducing the storage and computational resources while also providing similar results to other methods. Finally, by using the battery model defined by the Nernst equation, the behavior of future charge–discharge cycles can be accurately predicted using experimental data, as shown by the results presented in this paper.
The rest of the paper is organized as follows. Section 2 describes the methodology proposed in this paper to determine the HI. Section 3 describes the battery dataset used in this paper. Section 4 presents and discusses the experimental results. Finally, Section 5 concludes this paper.

2. Methodology

Several mechanisms are known to affect the lifetime of Li-ion cells. These include an increase in internal impedance, loss of active material due to mechanical stress caused by structural changes in the anode and cathode, or loss of cyclable lithium caused by the growth of solid electrolyte interphase at the anode due to lithium consumption and electrolyte decomposition [29]. According to [30], degradation mechanisms of Li-ion batteries can be divided into loss of active materials in the electrodes and loss of lithium inventory (LLI), although it is not easy to distinguish the aging mechanism. Therefore, it is necessary to quantify the degradation level of the battery in order to assess the health status of the battery.

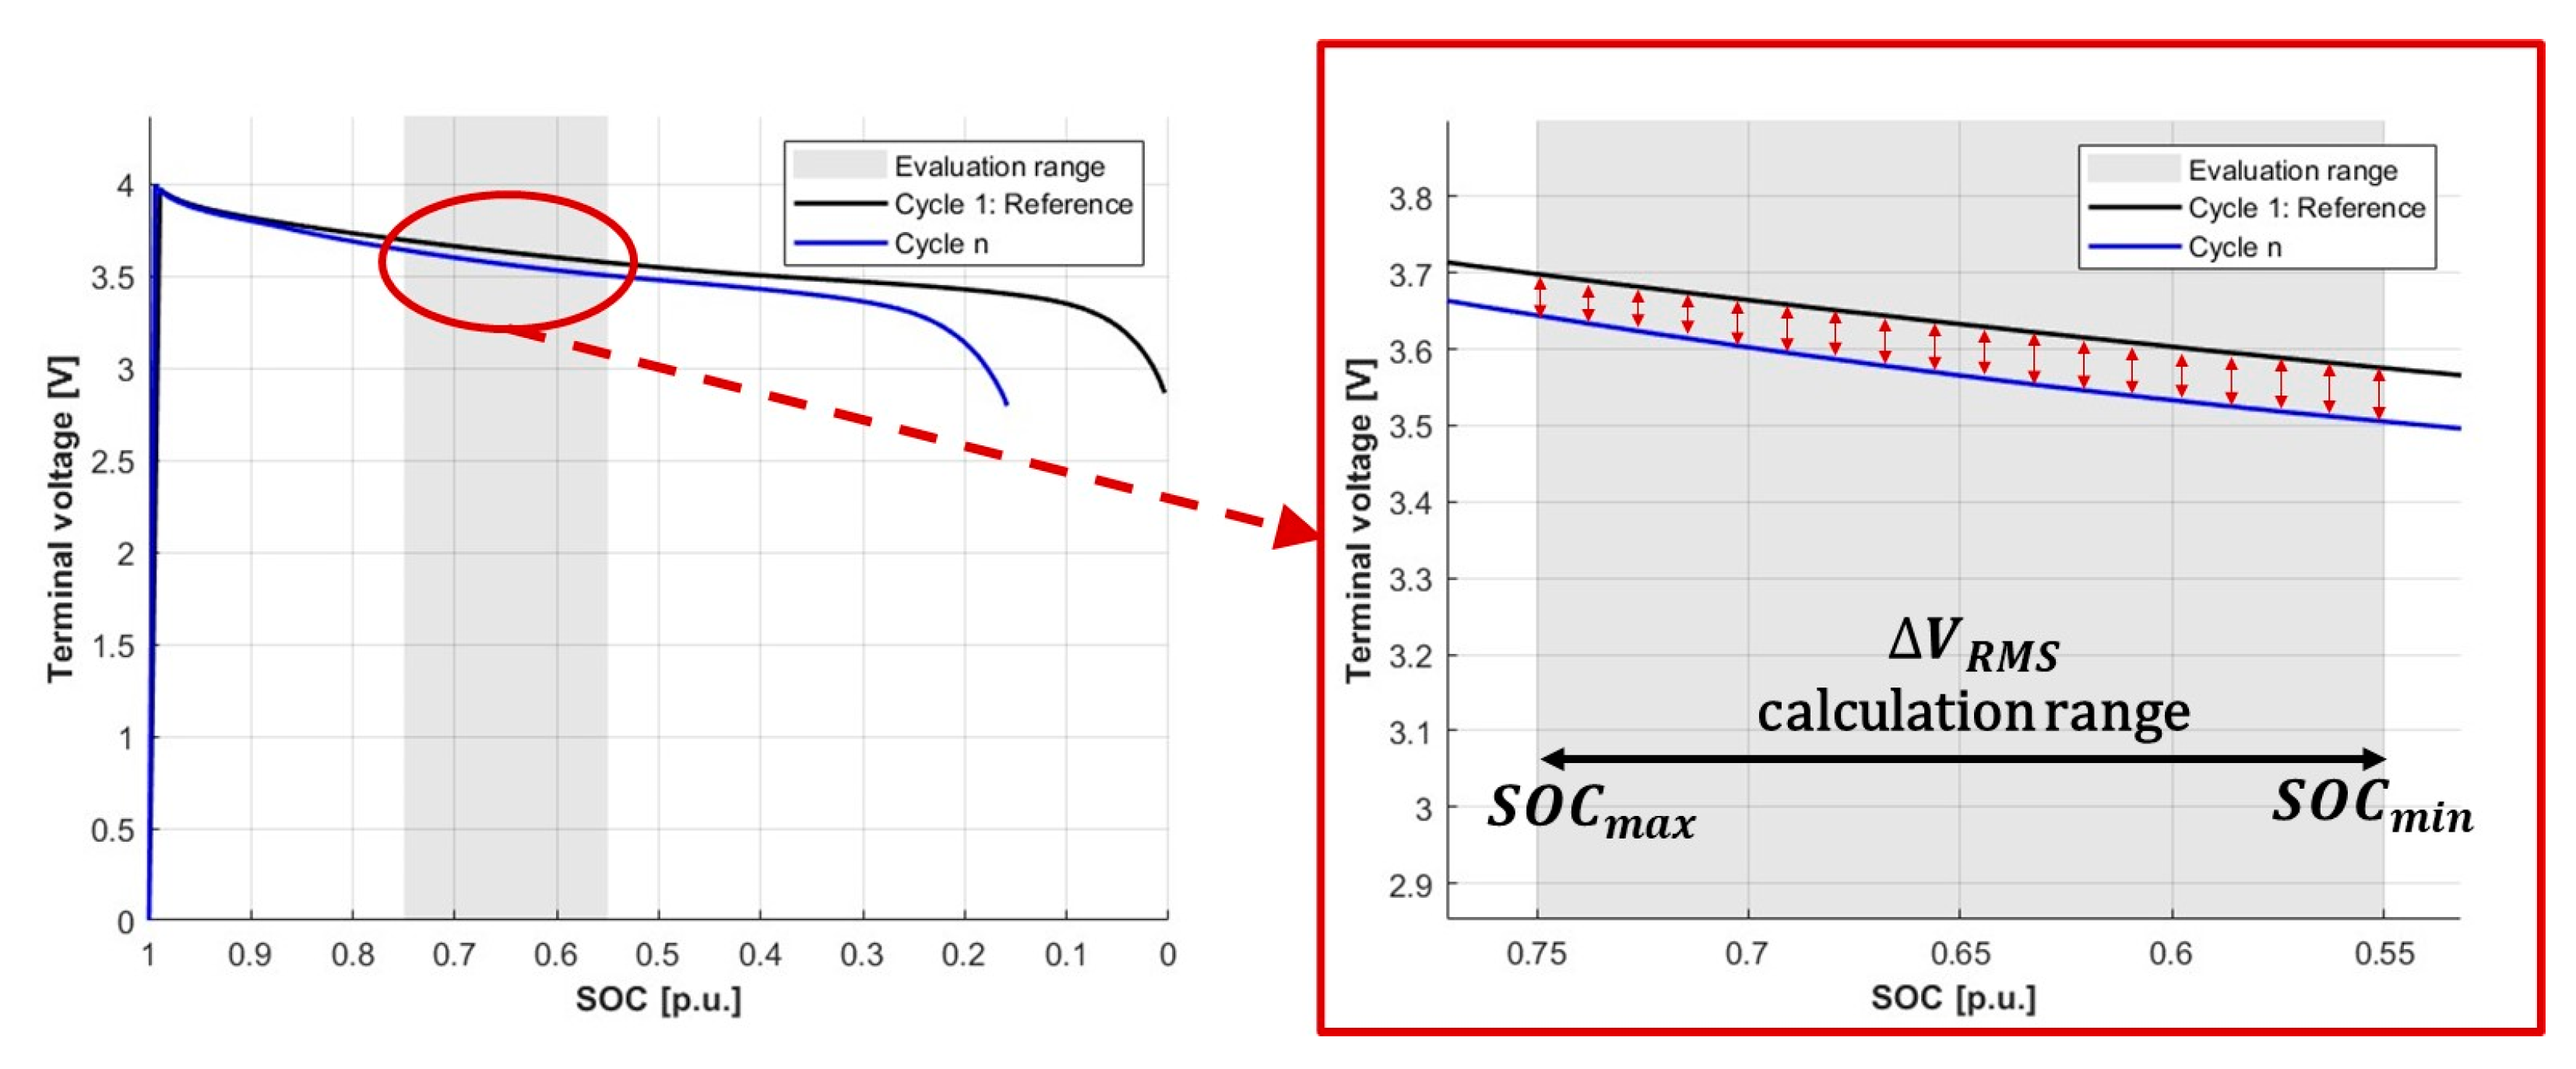
2.1. Battery Degradation Quantification

Probably the most common way to quantify the state of health of a cell is its capacity, expressed in Ah, which is directly related to the amount of charge it can hold. It is defined as
C = t 0 t f i ( t ) d t   [ Ah ]
Note that (1) corresponds to the Coulomb counting method, which integrates the current over time over one charge cycle, where the cell is completely discharged at t0 and fully charged at tf. The degradation or fading of the cell capacity in cycle n, ΔCn, can be calculated as
Δ C n = C r a t e d C n [ Ah ]
where n = 1, 2, 3, …, nmax is the number of cycles and n = 1 corresponds to the initial cycle of the battery where Cn = 1 = Crated.
The SOC of a battery is related to the remaining charge Qremaining [C] in the battery; so, it is often defined as the ratio of Qremaining to the rated charge Qrated as [5]
S O C ( t ) = Q r e m a i n i n g ( t ) Q r a t e d ( t )   [ ]
The SOC can be calculated using the Coulomb counting method, which integrates the cell current over time during the usage period. The SOC at any time t of the discharging phase can be calculated as
S O C ( t ) = S O C 0 1 C r a t e d t 0 t i ( t ) d t   [ ]
where SOC0 is the state of charge at the initial time of t0; Crated [Ah] is the rated capacity of the cell, which is obtained from the cell manufacturer; and i(t) is the instantaneous cell current. The current i(t) in (4) is positive when discharging and negative when charging.
Although the SOH has different definitions, it is related to the ratio of the effective cell capacity to the initial capacity. One possible definition is based on the ratio of the difference between the actual cell capacity Cactual and the end-of-life capacity CEOL (70% of Cinitial) [31] and the difference between the initial capacity Cinitial and the end-of-life capacity CEOL [10], which can be expressed as
S O H = C a c t u a l C E O L C i n i t i a l C E O L   [ ]
However, in practical applications, it is difficult to measure the actual capacity value of the cell because it is necessary to integrate (1) from a fully discharged state to a fully charged state. In this paper, it is proposed to use an indirect method to estimate the current capacity of the battery. This method is based on the calculation of the root mean square (RMS) of the difference ΔVRMS between the first discharge cycle of the cell, which is taken as the reference cycle, and the current cycle. Note that the ΔVRMS can be used as an indicator of the state of health of the cell. The ΔVRMS,n [V] indicator is calculated at a generic cycle n in the interval [SOCmin, SOCmax] as follows:
Δ V RMS , n = 1 S O C max S O C min S O C min S O C max V r e f ( S O C ) V n ( S O C ) 2 d S O C   [ V ]
where n = 1 corresponds to the initial or reference cycle and n is a generic cycle.
Figure 1 explains the ΔVRMS indicator. It shows the evolution of the cell terminal voltage versus the SOC value calculated from (4) during the first discharge cycle and during the n-th cycle.
In this paper, the SOC interval [SOCmin, SOCmax] = [0.55, 0.75] is chosen to calculate the ΔVRMS indicator. Since the proposed ΔVRMS indicator is calculated in a narrow SOC interval, this HI is quite flexible because it does not require the cell to be fully charged and discharged. As seen in Figure 1, the linear region of the voltage vs. SOC curve falls within this interval. This interval is typically within the normal transit area for most charge and discharge cycles, regardless of their profile.

2.2. Correlation between ΔVRMS and the Cell Capacity Fade ΔC

As explained, due to the impossibility of a direct measurement of the capacity fade ΔC in practical charge–discharge cycles, this paper proposes an indirect measurement based on the indicator ΔVRMS.
Since the values of ΔC and ΔVRMS are on different scales, they have to be normalized for a fair comparison. The min–max normalization is used for this purpose because it is one of the most commonly used methods to normalize data, which can be calculated as [32],
x n o r m = x x min x max x min
where x is ΔC or ΔVRMS, and xmin and xmax are the minimum and maximum values of x, respectively.
Δ C n o r m = Δ C n 0 0.3 C r a t e d 0
Δ V R M S , n o r m = Δ V R M S , n 0 ( Δ V R M S , n Δ V R M S , c u t o f f ) 0
In this paper, the cell is considered to reach its end of life when C = 0.7 Crated; so, ΔCend-of-life = 0.3 Crated [31]. ΔVRMS,cut-off is obtained from the manufacturer datasheet.
However, the behavior and accuracy of ΔVRMS in quantifying the capacity fade needs to be evaluated. The Pearson correlation R is a useful statistic for this purpose. Figure 2 compares the behavior of the two indicators ΔC and ΔVRMS for one of the cells analyzed, where a strong correlation is seen with R = 0.99. More details can be found in Section 4.

2.3. Forecasting Methods

As explained, to predict the future evolution of the cell capacity, it is necessary to apply suitable mathematical methods. In this section, it is proposed to apply two approaches, namely, linear fitting model (LF) and autoregressive integrated moving average (ARIMA).
As shown in Figure 3, the forecasting algorithm predicts the value of ΔC or ΔVRMS of the cell at the current cycle according to the degradation model built from the evolution of ΔC or ΔVRMS. Positioned at the current cycle, the forecasting algorithm takes the past values of ΔC or ΔVRMS in the training interval (see the gray area in Figure 3) and fits these measured values to a straight line in the case of the LF method or uses lagged values of ΔC or ΔVRMS and lagged errors in the case of ARIMA, as explained in the following paragraphs.
ARIMA was developed in the 1970s [33] and has since been widely used for forecasting and time series analysis [34,35]. ARIMA builds a time domain forecasting model based on the most recent measurements combined with the long-term historical trend [36]. ARIMA models have been used to forecast time series of economic variables [37], pandemic data [38], climate-related variables [26], the remaining useful life of fuel cells [39], and the behavior of electrochemical batteries, among other applications. Nonseasonal (p, d, q) ARIMA models are based on p autoregressive terms, d nonseasonal differences, and q lagged forecast errors. A (p, d, q) ARIMA model can be expressed as
y ^ j = α 1 Δ d y j 1 + + α p Δ d y j p + ε j + γ 1 ε j 1 + + γ q ε j q
where yj and y ^ j denote the measured and predicted values of ΔC and ΔVRMS, respectively, of the cell at the time instant jΔT, where ΔT is the sampling time; ε j = y j y ^ j is an error term; Δ d y j = ( 1 L ) d y j ; and L is the lag operator, i.e., Lyj = yj−1 and Ldyj = yjq. Thus, yj is obtained by applying d successive integrations to Δ d y j .

2.4. Nernst Equation

In this work, the Nernst model is used to predict the pattern of a future discharge cycle using data from the reference cycle and the estimated degradation data. If the SOC is known, the terminal cell voltage can be determined by applying the Nernst equation [40,41] as
v n ( t ) = E 0 R i n ( t ) + μ 1 ln [ S O C ( t ) ] + μ 2 ln [ 1 S O C ( t ) ]
where vn(t) and in(t) are the terminal cell voltage and current (which is positive during the discharge stage and negative during the charge stage) at the n-th cycle, E0 is the standard cell potential, R is the internal resistance of the cell, and μ1 and μ2 are constant parameters. For a set of m measurements at different times jΔT in the same cycle, where j = 1, 2, 3, …, m, the set of parameters in (11) can be determined as
E 0 R μ 1 μ 2 = 1 i n , 1 ln ( S O C n , 1 ) ln ( 1 S O C n , 1 ) 1 i n , 2 ln ( S O C n , 2 ) l n ( 1 S O C n , 2 ) 1 i n , m ln ( S O C n , m ) ln ( 1 S O C n , m ) 1 v n , 1 v n , 2 v n , m
where vi,j is the terminal cell voltage at cycle number i, with i = 1, 2, …, n, and at the j-th sample of the cycle, where j = 1, 2, …, m.
To predict the behavior of a future cycle (terminal voltage vs. SOC) at different stages of cell aging, the following steps are proposed:
Reference cycle. The instantaneous values of current and battery terminal voltage are measured during the full discharge cycle and the instantaneous values of the SOC are calculated. From these, the four parameters of the Nernst equation are determined.
Future cycle n. By applying the LF or ARIMA forecasting methods, the estimated values of the ΔVRMS,n and the capacity fade ΔCn of cycle n are determined. If the rated capacity Crated of the cell and the capacity fade at the n-th cycle ΔCn are known, the state of charge SOCn at the n-th cycle can be calculated as
S O C n ( t ) = 1 C r a t e d Δ C n 0 t i ( t ) d t
Finally, once the SOCn of the n-th cycle is known, the terminal cell voltage vn for this cycle is obtained from ΔVRMS,n and (11) so that the terminal voltage is predicted vs. the SOC characteristic curve of the n-th cycle.

3. Data Description

The data for the cells studied in this paper were obtained from the NASA Ames Prognostic Center of Excellence (PCoE) public database [42]. This database contains the terminal voltage v(t) and current i(t) measurements of the charge and discharge cycles and impedance of several commercial 18650 Li-ion cells under various conditions with a non-uniform sampling rate. Cell voltage, current, and temperature measurements were performed using a PXI-chassis-based DAQ. The measurements are grouped into six different datasets. NASA Ames researchers recommend dataset number 6 for predicting cell remaining charge and remaining useful life (RUL).
Table 1 summarizes the key parameters during the cell degradation tests performed at a constant discharge current.
The algorithms and methods used in this paper were programmed by the authors of this work in the Matlab® R2022b environment.

4. Results

This section details the tests performed in this paper, and explains and discusses the results obtained. As explained, the method proposed in this paper takes the first discharge cycle as the reference cycle. Based on the measured values of the terminal cell voltage and current, the capacity of the cell and the parameters of the Nernst model are determined in the first cycle. According to the process shown in Figure 1, the ΔVRMS,n health indicator is calculated in each cycle for all analyzed cells.

4.1. Cell Capacity Fade Measurement and Estimation
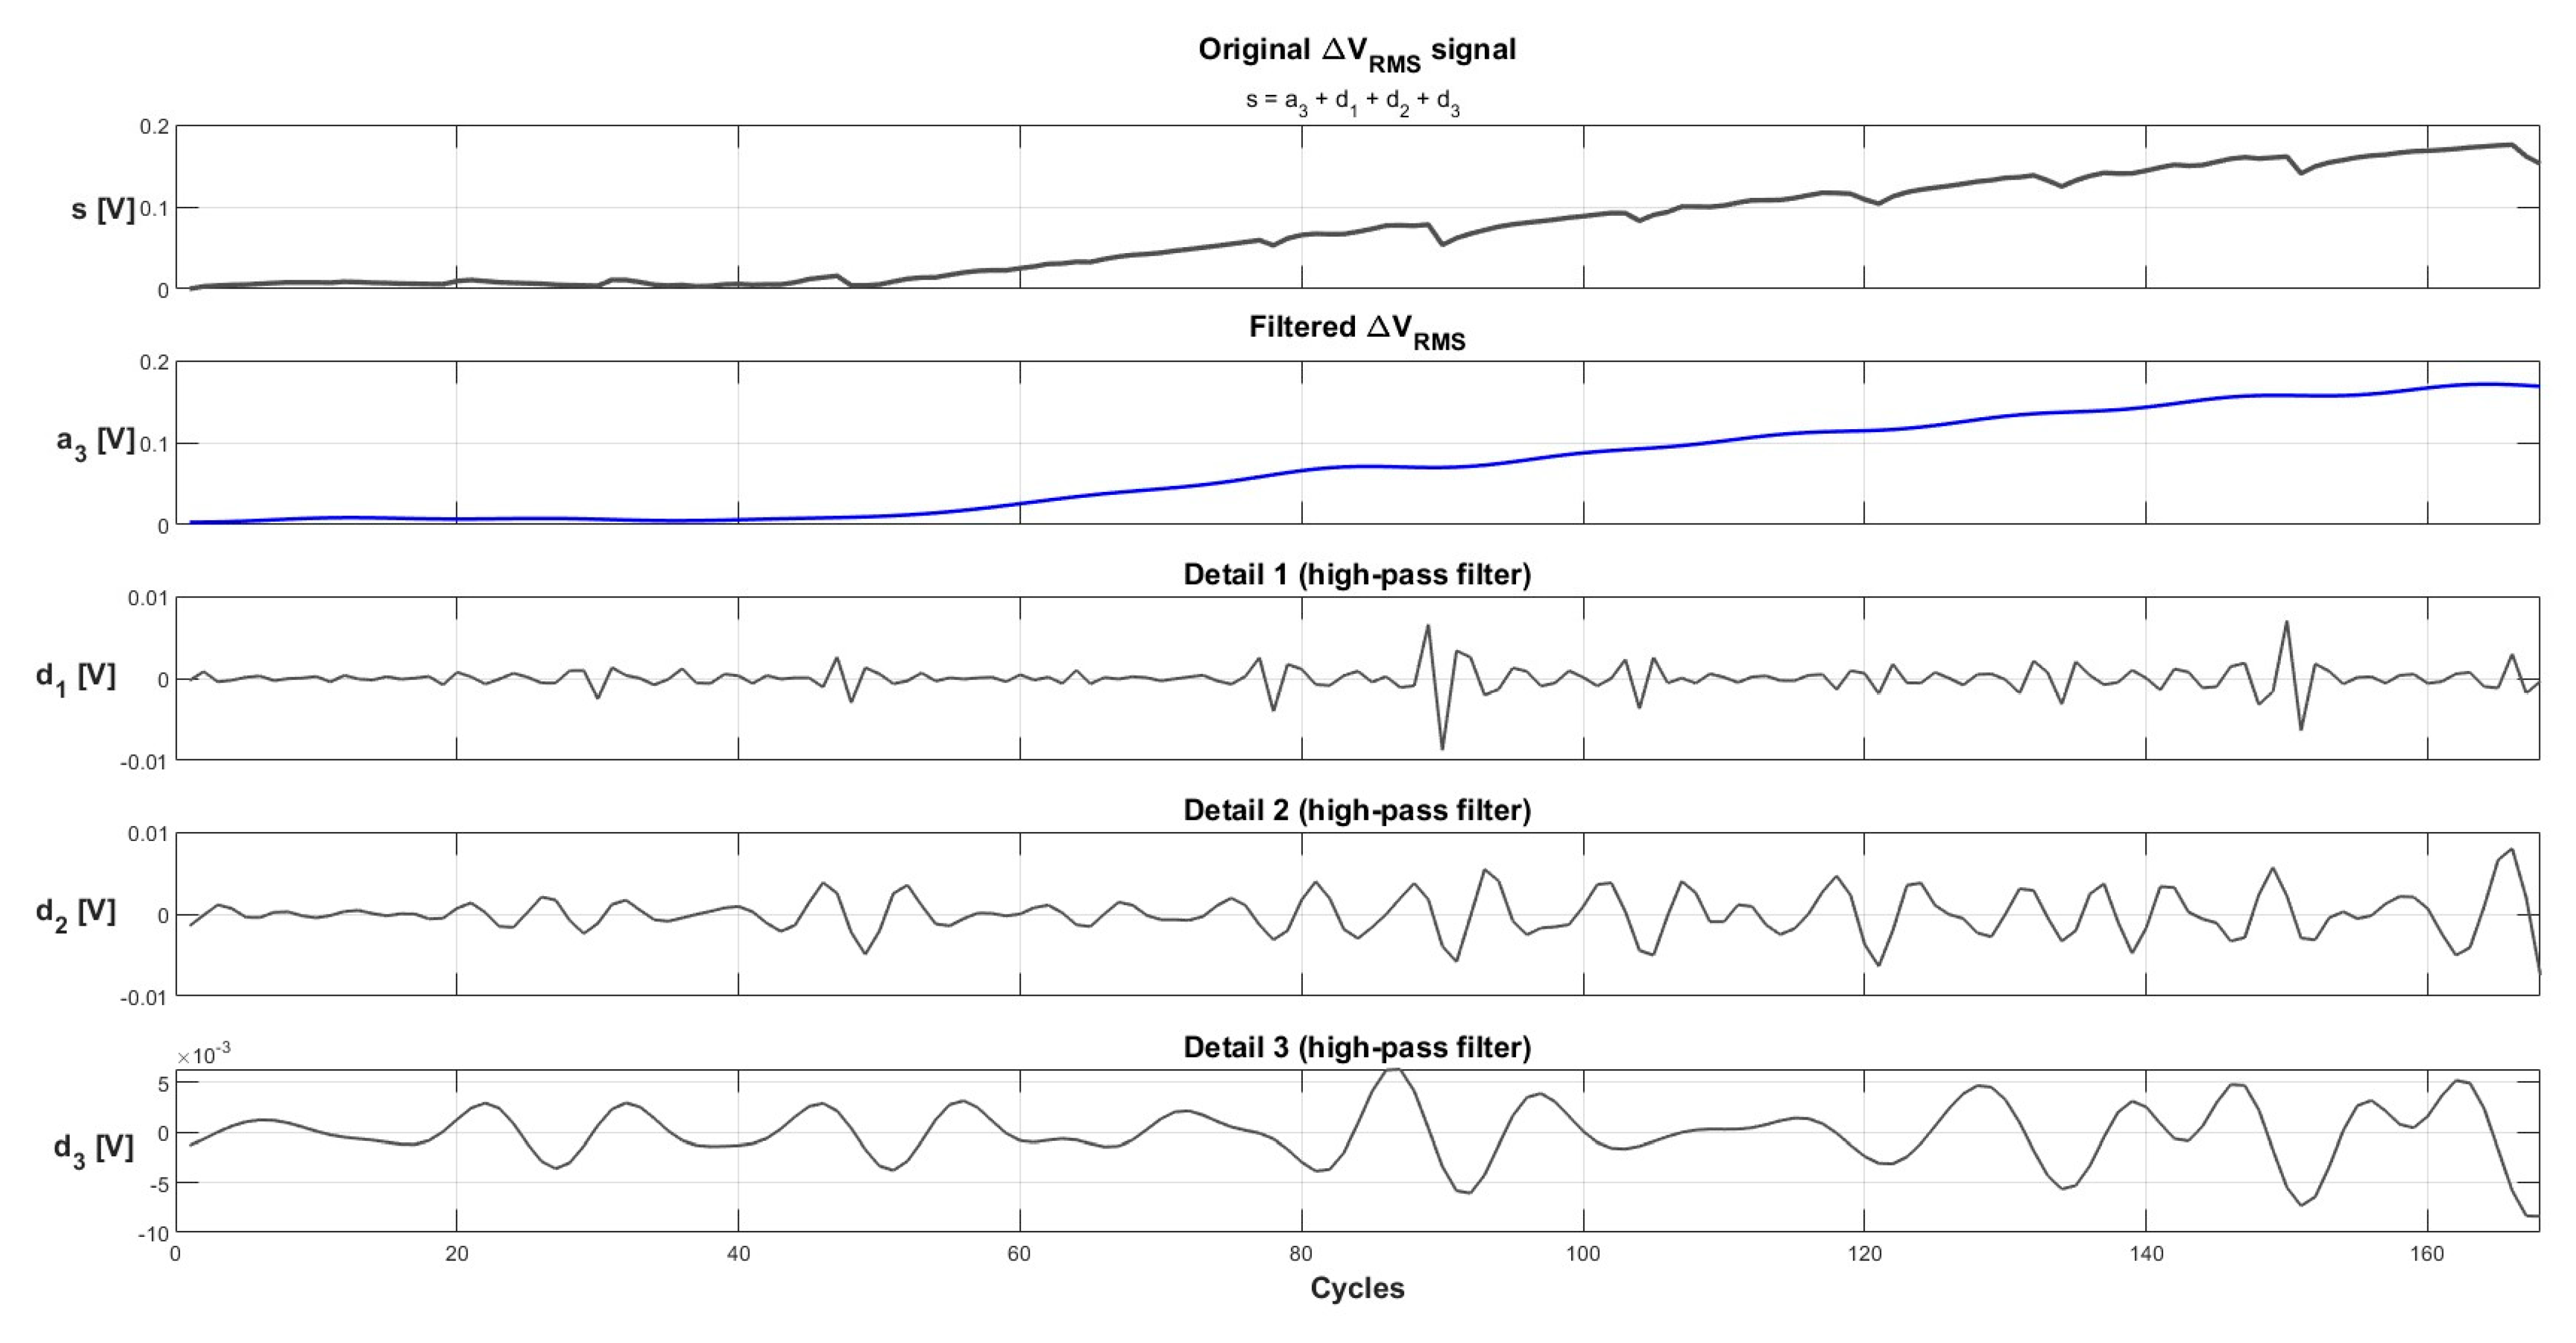
Figure 4 shows the evolution of the capacity degradation ΔC of cell B0005 vs. the number of cycles as well as the evolution of the predictor ΔVRMS. Note that ΔC is calculated directly from the experimental data by applying (2), whereas ΔVRMS is calculated by applying (6) from the RMS value of the difference between the cell terminal voltage of the initial or reference cycle until the last cycle.
The results presented in Figure 4 show a similar trend of ΔC and ΔVRMS. To quantify the degree of correlation, Table 2 shows the values of the Pearson correlation coefficient R between the capacity degradation ΔC and the proposed estimator ΔVRMS for the four analyzed Li-ion cells calculated over the whole lifetime of the cells.
The results presented in Table 2 show a high value of the correlation coefficient R for all analyzed cells throughout their entire lifetime, thus validating the usefulness and accuracy of the ΔVRMS capacity degradation estimator. Since it is demonstrated that ΔVRMS is a good estimator of the capacity fade, it is used to evaluate the SOH of the cell.

4.2. Data Filtering

As observed in the previous subsection (see Figure 4), raw ΔC values and calculated ΔVRMS values show a significant ripple due to internal chemical changes of the cell [43], mainly due to the recovery effect. The recovery effect is due to an overhang of the negative electrode over the positive electrode due to a design feature of the cells. This is a common effect found in aging tests, although it complicates the design of RUL forecasting tools [44,45]. In order to improve the modeling accuracy and to reduce the dependence of the results on the internal chemical changes, these data are filtered by discrete wavelet transform (DWT). Although other filtering approaches are possible [22], in this paper, a three-stage DWT was applied to the calculated ΔVRMS values because it offers several advantages, such as low computational complexity, a simultaneous localization in the time and frequency domains, and the ability to separate the fine details of the signal. The applied process is summarized in Figure 5, which shows the original ΔVRMS signal, the approximated or filtered signal, and the three details (high-pass filters) removed from the signal corresponding to the successive application of low-pass and high-pass filters made by the three-level DWT. It is noted that the discrete Meyer mother wavelet has been applied because it is commonly used in fault diagnosis approaches [46].
Figure 6 shows the results of the three-level DWT filter. It compares the original values of the ΔVRMS with the filtered ones vs. the number of charge and discharge cycles of the cells.
As can be seen in Figure 6, the DWT process applied to the ΔVRMS signal can significantly reduce the noise of the time series while preserving the overall trend, thus also increasing the quality of the data used during the subsequent forecasting stage.

4.3. Capacity Fade Forecasting Results

This section analyzes the evolution of the capacity fade of the four analyzed cells with the number of charge–discharge cycles.
Figure 7 shows three ARIMA predictions at different cycles for each analyzed cell. The training range varies between 30% (left), 50% (middle), and 80% (right) of the cell lifetime. Each plot shows the behavior of the measured capacity fade ΔC (black line, which corresponds to the objective time series) and the forecasting results using the proposed health indicator ΔVRMS to estimate ΔC (blue line) and the forecast directly using ΔC (red line). Note that the solid lines of ΔVRMS and ΔC refer to known values while the dashed lines refer to predicted values.
From Figure 7, it can be seen that both forecasting methods improve their accuracy as more data points are available. It can also be seen that both methods give similar results for the same initial conditions.
To measure the performance of the methods, Table 3 shows the root-mean-square error (RMSE) of the blue (ΔVRMS prediction) and red lines (ΔC prediction) of Figure 7, which is calculated against the black line (objective data series) at different cycles.
The results presented in Table 3 show a trend such that the prediction accuracy improves with the amount of data considered (number of cycles in the training set). The mean values of the RMSE for the ARIMA forecasting are 0.064 and 0.046 for ΔVRMS and ΔC, respectively. In the case of LF, the mean values are 0.112 and 0.069 for ΔVRMS and ΔC, respectively. Since the mean RMSE values of ΔVRMS and ΔC are similar, it can be concluded that ΔVRMS can be used as an estimator of the capacity fade ΔC, while requiring less data (see Figure 1). It is also shown that ARIMA generally provides better forecasting results than the LF method.
Figure 8 shows the experimental values of the cell terminal voltage vs. the SOC at the reference cycle (blue line, using the Nernst fitting from experimental data) and at different cycles (black dashed lines), and the predictions of future discharge cycles (solid magenta line) using the Nernst model described by (11) and ΔVRMS,n and ΔCn. The SOC is calculated by applying (13) once the estimated value of ΔCn is known, while the cell terminal voltage in Figure 8 is the voltage obtained from (11) minus ΔVRMS,n. The magenta line (predicted future discharge cycles) should be very close to the black dashed line corresponding to the objective data.
The results presented in Figure 8 show that the discharge behavior depends on the predicted values of ΔVRMS,n and ΔCn at cycle n. However, it accurately approximates the discharging behavior when the same discharge current is applied.
Table 4 shows the RMSE values between the measured data (dashed black lines) and predictions made by the proposed degradation model and the Nernst equation (solid magenta lines).
From the results presented in Figure 8 and Table 4, it can be concluded that at a given cycle n, if some known discharge conditions are expected, the discharge behavior of the system can be approximated using the proposed ΔVRMS health indicator.

4.4. Capacity Fade Forecasting at Different Discharge Conditions

This section analyzes the evolution of the capacity fade of a fifth cell that was discharged at a discharge C-rate of 2, i.e., at a discharge current of 4 A instead of 2 A, as was performed in the previous section.
Figure 9 shows three ARIMA predictions at different cycles for each analyzed cell. The training range varies between 30% (left), 50% (middle), and 80% (right) of the cell lifetime. Each plot shows the behavior of the measured capacity fade ΔC (black line, which corresponds to the objective time series) and the forecasting results using the proposed health indicator ΔVRMS to estimate ΔC (blue line) and the forecast directly using ΔC (red line). The solid lines of ΔVRMS and ΔC refer to known values, while the dashed lines refer to predicted values.
Table 5 shows the root-mean square error (RMSE) of the blue (ΔVRMS prediction) and red lines (ΔC prediction) of Figure 9, which is calculated against the black line (objective data series) at different cycles.
The trend in the results presented in Table 5 is that the prediction accuracy improves with the number of cycles in the training set. The mean values of the RMSE for the LF forecasting are 0.076 and 0.074 for ΔVRMS and ΔC, respectively. In the case of ARIMA the mean values are 0.080 and 0.043 for ΔVRMS and ΔC, respectively. Since the mean RMSE values of ΔVRMS and ΔC are similar, it can be concluded that ΔVRMS, can be used as an estimator of the capacity fade ΔC, even with a C-rate of 2.
Figure 10 shows the experimental values of the terminal voltage of cell B0034 vs. the SOC at the reference cycle (blue line, using the Nernst fitting from experimental data) and at different cycles (black dashed lines) and the predictions of future discharge cycles (solid magenta line) using the Nernst model described by (11) and ΔVRMS,n and ΔCn. The SOC is calculated by applying (13) once the estimated value of ΔCn is known, while the cell terminal voltage in Figure 8 is the voltage obtained from (11) minus ΔVRMS,n. The magenta line (predicted future discharge cycles) should be very close to the black dashed line corresponding to the objective data.
The results presented in Figure 10 show that the discharge behavior based on the predicted values of ΔVRMS,n and ΔCn at cycle n approximates the measured discharging behavior, thus validating the usefulness of the proposed approach.
Table 6 shows the RMSE values between the measured data (dashed black lines) and predictions made by the proposed degradation model and the Nernst equation (solid magenta lines).
The results presented in Figure 10 and Table 6 exhibit that, at a given cycle n, the discharge behavior of the system can be approximated using the proposed ΔVRMS health indicator at different discharge currents.

5. Conclusions

The efficiency and performance of a battery is highly dependent on its past and present use. To ensure optimal performance, it is of utmost importance to develop battery grading techniques based on fast methods to determine battery degradation in terms of capacity fade, health status, and remaining useful life. Signal processing plays a leading role in the development of predictive and prognostic methods to determine the state of health and degradation status. This paper has proposed and evaluated the behavior of a new health indicator to estimate the capacity fade of lithium-ion batteries, which is directly related to the state of health. It has been shown that the proposed estimator is highly correlated with the capacity fade since the Pearson correlation coefficient R between the two indicators is around 0.99 for the analyzed batteries. The proposed health indicator is calculated within a narrow SOC interval where the voltage–SOC has a very linear relationship. This narrow SOC interval is within the normal range of most practical charge–discharge cycles, so it is not necessary to collect data from full charge and discharge cycles. Thus, only a small fraction of the data points of a full charge–discharge cycle are required, minimizing computational and storage resources while providing accurate results. The results presented in this paper have shown that by using the Nernst battery model, the behavior of future charge–discharge cycles can be accurately predicted. The approach proposed in this paper could be applied in many applications where the batteries are not fully charged or discharged, such as in electric mobility or smartphone applications. Finally, the method proposed in this paper is based on various signal processing methods such as discrete wavelet filtering and prediction methods based on linear fitting and autoregressive integrated moving average algorithms.

Author Contributions

Conceptualization, J.d.l.V., J.-R.R., and J.A.O.-R.; methodology, J.A.O.-R.; software, J.d.l.V. and J.-R.R.; validation, J.d.l.V., J.-R.R., and J.A.O.-R.; formal analysis, J.-R.R. and J.A.O.-R.; investigation, J.d.l.V., J.-R.R., and J.A.O.-R.; resources, J.-R.R. and J.A.O.-R.; data curation, J.d.l.V.; writing—original draft preparation, J.d.l.V. and J.-R.R.; writing—review and editing, J.d.l.V., J.-R.R., and J.A.O.-R.; supervision, J.-R.R. and J.A.O.-R. All authors have read and agreed to the published version of the manuscript.

Funding

This research was funded by Ministerio de Ciencia e Innovación de España, grant number TED2021-130007B-I00, and by the Generalitat de Catalunya, grant number 2021 SGR 00392.

Institutional Review Board Statement

Not applicable.

Informed Consent Statement

Not applicable.

Conflicts of Interest

The authors declare no conflict of interest.

References

  1. Xiong, R.; Zhang, Y.; Wang, J.; He, H.; Peng, S.; Pecht, M. Lithium-Ion Battery Health Prognosis Based on a Real Battery Management System Used in Electric Vehicles. IEEE Trans. Veh. Technol. 2019, 68, 4110–4121. [Google Scholar] [CrossRef]
  2. Zhang, Y.Z.; Xiong, R.; He, H.W.; Pecht, M. Validation and verification of a hybrid method for remaining useful life prediction of lithium-ion batteries. J. Clean. Prod. 2019, 212, 240–249. [Google Scholar] [CrossRef]
  3. Stroe, A.I.; Knap, V.; Stroe, D.I. Comparison of lithium-ion battery performance at beginning-of-life and end-of-life. Microelectron. Reliab. 2018, 88–90, 1251–1255. [Google Scholar] [CrossRef]
  4. Saxena, S.; Le Floch, C.; Macdonald, J.; Moura, S. Quantifying EV battery end-of-life through analysis of travel needs with vehicle powertrain models. J. Power Sources 2015, 282, 265–276. [Google Scholar] [CrossRef] [Green Version]
  5. Zhao, J.; Zhu, Y.; Zhang, B.; Liu, M.; Wang, J.; Liu, C.; Hao, X.; Kowal, J.; Zhao, J.; Zhu, Y.; et al. Review of State Estimation and Remaining Useful Life Prediction Methods for Lithium– Ion Batteries. Sustainability 2023, 15, 5014. [Google Scholar]
  6. Baccouche, I.; Jemmali, S.; Mlayah, A.; Manai, B.; Amara, N.E. Ben Implementation of an improved Coulomb-counting algorithm based on a piecewise SOC-OCV relationship for SOC estimation of Li-ion battery. Int. J. Renew. Energy Res. 2018, 8, 178–187. [Google Scholar]
  7. Jiani, D.; Zhitao, L.; Youyi, W.; Changyun, W. A Fuzzy Logic-Based Model for Li-ion Battery with SOC and Temperature Effect. In Proceedings of the 11th IEEE International Conference on Control & Automation (ICCA), Taichung, Taiwan, 18–20 June 2014; pp. 1333–1338. [Google Scholar]
  8. Saji, D.; Babu, P.S.; Ilango, K. SoC Estimation of Lithium Ion Battery Using Combined Coulomb Counting and Fuzzy Logic Method. In Proceedings of the 4th International Conference on Recent Trends on Electronics, Information, Communication & Technology (RTEICT), Bangalore, India, 17–18 May 2019; pp. 948–952. [Google Scholar]
  9. Vidal, C.; Kollmeyer, P.; Chemali, E.; Emadi, A. Li-ion Battery State of Charge Estimation Using Long Short-Term Memory Recurrent Neural Network with Transfer Learning. In Proceedings of the IEEE Transportation Electrification Conference and Expo (ITEC), Detroit, MI, USA, 19–21 June 2019. [Google Scholar]
  10. Zhang, M.; Liu, Y.; Li, D.; Cui, X.; Wang, L.; Li, L.; Wang, K. Electrochemical Impedance Spectroscopy: A New Chapter in the Fast and Accurate Estimation of the State of Health for Lithium-Ion Batteries. Energies 2023, 16, 1599. [Google Scholar] [CrossRef]
  11. Yi, Z.; Zhao, K.; Sun, J.; Wang, L.; Wang, K.; Ma, Y. Prediction of the Remaining Useful Life of Supercapacitors. Math. Probl. Eng. 2022, 2022, 7620382. [Google Scholar] [CrossRef]
  12. Akkinepally, B.; Reddy, I.N.N.; Manjunath, V.; Reddy, M.V.V.; Mishra, Y.K.K.; Ko, T.J.J.; Zaghib, K.; Shim, J. Temperature effect and kinetics, LiZr2(PO4)3 and Li1.2Al0.2Zr1.8(PO4)3 and electrochemical properties for rechargeable ion batteries. Int. J. Energy Res. 2022, 46, 14116–14132. [Google Scholar] [CrossRef]
  13. Messing, M.; Shoa, T.; Habibi, S. Estimating battery state of health using electrochemical impedance spectroscopy and the relaxation effect. J. Energy Storage 2021, 43, 103210. [Google Scholar] [CrossRef]
  14. Moura, S.J.J.; Krstic, M.; Chaturvedi, N.A.A. Adaptive PDE Observer for Battery SOC/SOH Estimation. In Proceedings of the ASME 2012 5th Annual Dynamic Systems and Control Conference joint with the JSME 2012 11th Motion and Vibration Conference; American Society of Mechanical Engineers location: New York, NY, USA, 2012; Volume 1, pp. 101–110. [Google Scholar]
  15. Buchman, A.; Lung, C. State of Charge and State of Health Estimation of Lithium-Ion Batteries. In Proceedings of the IEEE 24th International Symposium for Design and Technology in Electronic Packaging (SIITME), Iasi, Romania, 25–28 October 2018; pp. 382–385. [Google Scholar]
  16. Kallel, A.Y.; Petrychenko, V.; Kanoun, O. State-of-Health of Li-Ion Battery Estimation Based on the Efficiency of the Charge Transfer Extracted from Impedance Spectra. Appl. Sci. 2022, 12, 885. [Google Scholar] [CrossRef]
  17. Cheng, K.W.E.W.E.; Divakar, B.P.P.; Wu, H.; Ding, K.; Ho, H.F.F. Battery-management system (BMS) and SOC development for electrical vehicles. IEEE Trans. Veh. Technol. 2011, 60, 76–88. [Google Scholar] [CrossRef]
  18. Ma, Q.; Wang, Y.; Yang, W.; Tao, B.; Zheng, Y. A novel health index for battery RUL degradation modeling and prognostics. In Proceedings of the IEEE 8th Data Driven Control and Learning Systems Conference (DDCLS), Dali, China, 24–27 May 2019; pp. 1077–1081. [Google Scholar]
  19. Sheraz, M.; Choi, W. A Novel Technique for Fast Ohmic Resistance Measurement to Evaluate the Aging of Lithium-Ion xEVs Batteries. Energies 2023, 16, 1416. [Google Scholar] [CrossRef]
  20. Wu, M.; Qin, L.; Wu, G. State of charge estimation of Power lithium-ion battery based on an Affine Iterative Adaptive Extended Kalman Filter. J. Energy Storage 2022, 51, 104472. [Google Scholar] [CrossRef]
  21. Zhou, W.W.; Lu, Q.; Zheng, Y. Review on the Selection of Health Indicator for Lithium Ion Batteries. Machines 2022, 10, 512. [Google Scholar] [CrossRef]
  22. Meng, J.; Azib, T.; Yue, M. Early-Stage end-of-Life prediction of lithium-Ion battery using empirical mode decomposition and particle filter. Proc. Inst. Mech. Eng. Part A J. Power Energy 2023, 2023, 09576509231153907. [Google Scholar] [CrossRef]
  23. Lu, J.; Xiong, R.; Tian, J.; Wang, C.; Hsu, C.W.; Tsou, N.T.; Sun, F.; Li, J. Battery degradation prediction against uncertain future conditions with recurrent neural network enabled deep learning. Energy Storage Mater. 2022, 50, 139–151. [Google Scholar] [CrossRef]
  24. Haris, M.; Hasan, M.N.; Qin, S. Degradation Curve Prediction of Lithium-Ion Batteries Based on Knee Point Detection Algorithm and Convolutional Neural Network. IEEE Trans. Instrum. Meas. 2022, 71, 1–10. [Google Scholar] [CrossRef]
  25. Thingvad, A.; Calearo, L.; Andersen, P.B.; Marinelli, M. Empirical Capacity Measurements of Electric Vehicles Subject to Battery Degradation from V2G Services. IEEE Trans. Veh. Technol. 2021, 70, 7547–7557. [Google Scholar] [CrossRef]
  26. Wu, T.H.; Moo, C.S. State-of-Charge Estimation with State-of-Health Calibration for Lithium-Ion Batteries. Energies 2017, 10, 987. [Google Scholar] [CrossRef] [Green Version]
  27. Movassagh, K.; Raihan, A.; Balasingam, B.; Pattipati, K. A Critical Look at Coulomb Counting Approach for State of Charge Estimation in Batteries. Energies 2021, 14, 4074. [Google Scholar] [CrossRef]
  28. Ravi Kumar, K.S.; Mohanta, D.K.; Sastry, V.V.; Rajesh, D.; Sekhar, O.C.; Varma, M.P.C. Design and fabrication of coulomb counter for estimation of SOC of battery. In Proceedings of the IEEE International Conference on Power Electronics, Drives and Energy Systems (PEDES), Trivandrum, India, 14–17 December 2016; pp. 1–6. [Google Scholar]
  29. Zhu, J.; Dewi Darma, M.S.; Knapp, M.; Sørensen, D.R.; Heere, M.; Fang, Q.; Wang, X.; Dai, H.; Mereacre, L.; Senyshyn, A.; et al. Investigation of lithium-ion battery degradation mechanisms by combining differential voltage analysis and alternating current impedance. J. Power Sources 2020, 448, 227575. [Google Scholar] [CrossRef]
  30. Peng, J.; Meng, J.; Chen, D.; Liu, H.; Hao, S.; Sui, X.; Du, X. A Review of Lithium-Ion Battery Capacity Estimation Methods for Onboard Battery Management Systems: Recent Progress and Perspectives. Batteries 2022, 8, 229. [Google Scholar] [CrossRef]
  31. Zhu, J.; Su, P.; Dewi Darma, M.S.; Hua, W.; Mereacre, L.; Liu-Théato, X.; Heere, M.; Sørensen, D.R.; Dai, H.; Wei, X.; et al. Multiscale investigation of discharge rate dependence of capacity fade for lithium-ion battery. J. Power Sources 2022, 536, 231516. [Google Scholar] [CrossRef]
  32. Pillareddy, V.R.; Karri, G.R. MONWS: Multi-Objective Normalization Workflow Scheduling for Cloud Computing. Appl. Sci. 2023, 13, 1101. [Google Scholar] [CrossRef]
  33. Box, G.; Jenkins, G. Time Series Analysis: Forecasting and Control, 1st ed.; Holden-Day, Ed.; Holden-Day: San Francisco, CA, USA, 1970. [Google Scholar]
  34. Kozitsin, V.; Katser, I.; Lakontsev, D. Online Forecasting and Anomaly Detection Based on the ARIMA Model. Appl. Sci. 2021, 11, 3194. [Google Scholar] [CrossRef]
  35. Gómez-Pau, Á.; Riba, J.-R.; Moreno-Eguilaz, M. Time Series RUL Estimation of Medium Voltage Connectors to Ease Predictive Maintenance Plans. Appl. Sci. 2020, 10, 9041. [Google Scholar] [CrossRef]
  36. Lai, Y.; Dzombak, D.A. Use of the autoregressive integrated moving average (Arima) model to forecast near-term regional temperature and precipitation. Weather Forecast. 2020, 35, 959–976. [Google Scholar] [CrossRef] [Green Version]
  37. Chen, J.M. Economic Forecasting With Autoregressive Methods and Neural Networks. SSRN Electron. J. 2020. Available online: https://papers.ssrn.com/sol3/papers.cfm?abstract_id=3521532 (accessed on 29 March 2023). [CrossRef]
  38. Singh, R.K.; Rani, M.; Bhagavathula, A.S.; Sah, R.; Rodriguez-Morales, A.J.; Kalita, H.; Nanda, C.; Patairiya, S.; Sharma, Y.D.; Rabaan, A.A.; et al. The Prediction of COVID-19 Pandemic for top-15 Affected Countries using advance ARIMA model. JMIR Public Health Surveill. 2020, 6, e19115. [Google Scholar] [CrossRef]
  39. Pan, M.; Hu, P.; Gao, R.; Liang, K. Multistep prediction of remaining useful life of proton exchange membrane fuel cell based on temporal convolutional network. Int. J. Green Energy 2022, 20, 408–422. [Google Scholar] [CrossRef]
  40. Plett, G.L. Extended Kalman filtering for battery management systems of LiPB-based HEV battery packs: Part Modeling and identification. J. Power Sources 2004, 134, 262–276. [Google Scholar] [CrossRef]
  41. Hussein, A.A.H.; Batarseh, I. An overview of generic battery models. In Proceedings of the 2011 IEEE Power and Energy Society General Meeting, Detroit, MI, USA, 24–28 July 2011. [Google Scholar]
  42. Saha, B.; Goebel, K. Battery Data Set; NASA Ames Research Centre: Mountain View, CA, USA, 2007. [Google Scholar]
  43. Lewerenz, M.; Dechent, P.; Sauer, D.U. Investigation of capacity recovery during rest period at different states-of-charge after cycle life test for prismatic Li(Ni1/3Mn1/3Co1/3)O2-graphite cells. J. Energy Storage 2019, 21, 680–690. [Google Scholar] [CrossRef]
  44. Wilhelm, J.; Seidlmayer, S.; Keil, P.; Schuster, J.; Kriele, A.; Gilles, R.; Jossen, A. Cycling capacity recovery effect: A coulombic efficiency and post-mortem study. J. Power Sources 2017, 365, 327–338. [Google Scholar] [CrossRef]
  45. Epding, B.; Rumberg, B.; Jahnke, H.; Stradtmann, I.; Kwade, A. Investigation of significant capacity recovery effects due to long rest periods during high current cyclic aging tests in automotive lithium ion cells and their influence on lifetime. J. Energy Storage 2019, 22, 249–256. [Google Scholar] [CrossRef]
  46. Xue, J.; Xu, H.; Liu, X.; Zhang, D.; Xu, Y. Application of enhanced empirical wavelet transform and correlation kurtosis in bearing fault diagnosis. Meas. Sci. Technol. 2022, 34, 035023. [Google Scholar] [CrossRef]
Figure 1. Instantaneous terminal cell voltage [V] vs. SOC [p.u.] during the first discharge cycle (reference cycle) and the n-th cycle. Calculation of the ΔVRMS indicator between the first discharge cycle and the n-th (generic) cycle.
Applsci 13 04938 g001
Figure 2. Evolution of the capacity fade ΔC and the proposed estimator ΔVRMS during the lifetime of cell B0005.
Applsci 13 04938 g002
Figure 3. Forecasting algorithm based on historical data—the training data.
Applsci 13 04938 g003
Figure 4. Capacity fade ΔC and evolution of the proposed estimator ΔVRMS for cell B0005 at a C-rate of 1.
Applsci 13 04938 g004aApplsci 13 04938 g004b
Figure 5. DWT filter applied to the computed values of ΔVRMS. The figure shows the original signal, its approximation or filtered signal, and the three details removed from the original signal, corresponding to successive high-pass filters.
Applsci 13 04938 g005
Figure 6. Raw and filtered values of the ΔVRMS health indicator for the analyzed cells when discharged at a C-rate of 1.
Applsci 13 04938 g006
Figure 7. ARIMA predictions at different cycles for each analyzed cell with a discharge current of 2 A (C-rate of 1). Behavior of the measured capacity fade ΔC (black line, which corresponds to the objective time series), the prediction results with the proposed ΔVRMS health indicator in the scale of ΔC (blue line), and the prediction of ΔC (red line).
Applsci 13 04938 g007aApplsci 13 04938 g007b
Figure 8. Prediction of future discharge cycles at different stages of cell aging. (a) Prediction of future cycle using 25% useful life data. (b) Prediction of future cycle using 50% useful life data. (c) Prediction of future cycle using 80% useful life data.
Applsci 13 04938 g008
Figure 9. ARIMA predictions at different cycles for cell B0034 with a discharge current of 4 A (C-rate of 2). Behavior of the measured capacity fade ΔC (black line, which corresponds to the objective time series), the prediction results with the proposed ΔVRMS health indicator in the scale of ΔC (blue line) and the prediction of ΔC (red line).
Applsci 13 04938 g009
Figure 10. Prediction of future discharge cycles at different stages of cell aging for cell B0034 with a discharge current of 4 A (C-rate of 2). (a) Prediction of future cycle using 25% useful life data. (b) Prediction of future cycle using 50% useful life data. (c) Prediction of future cycle using 80% useful life data.
Applsci 13 04938 g010
Table 1. Cell degradation test parameters.
Cell NameNumber of CyclesDischarged VoltageDischarge CurrentCharged VoltageCharge CurrentAmbient TemperatureEnd of Life Rated
Capacity
B00051682.7 V2.0 A4.2 V1.5 A24 °C30% fade in rated capacity(2–1.4 Ah)2 Ah
B00061682.5 V
B00071682.2 V
B00181322.5 V
Table 2. Parameters of the analyzed cells when discharged at a C-rate of 1.
DatasetCell NameCycles ConsideredCorrelation Coefficient R of ΔVRMS vs. ΔC
6B00051680.991
B00061680.990
B00071680.993
B00181320.982
Table 3. Comparative RMSE results between the proposed health indicator ΔVRMS and the capacity fade ΔC with respect to the measured capacity fade ΔC (objective time series) for each studied cell with a discharge current of 2 A (C-rate of 1).
CellB0005B0006B0007B0018
Forecast Start Point (% of Total Useful Life)MethodΔVRMS
[Ah]
ΔC
[Ah]
ΔVRMS
[Ah]
ΔC
[Ah]
ΔVRMS
[Ah]
ΔC
[Ah]
ΔVRMS
[Ah]
ΔC
[Ah]
30%LF0.3750.2200.2750.0670.2670.1560.2260.149
ARIMA0.2350.1640.2300.0540.1680.0670.1720.049
40%LF0.3030.1360.1340.1280.1810.0710.2190.050
ARIMA0.0680.0260.0830.1910.1610.1240.2630.056
50%LF0.2040.0520.0700.1820.0910.0240.1670.046
ARIMA0.0590.0240.0800.0890.0600.0260.0770.073
60%LF0.1540.0270.0650.1370.0660.0290.0890.064
ARIMA0.0540.0300.0330.0640.0360.0230.0440.056
70%LF0.1100.0290.0700.1130.0450.0360.0460.078
ARIMA0.0600.0250.0200.0330.0400.0150.0400.087
80%LF0.0750.0370.0640.0810.0300.0360.0560.092
ARIMA0.0380.0340.0240.0330.0210.0220.0230.037
Table 4. Comparative results between the experimental measurements of the cell terminal voltage vs. SOC and the Nernst equation adjusted with the proposed degradation model with a discharge current of 2 A (C-rate of 1).
CellB0005B0006B0007B0018
Forecast Start Point (% of Total Useful Life)RMSERMSERMSERMSE
25%0.2210.1720.1010.134
50%0.1250.1450.0750.077
80%0.1350.6160.0680.307
Table 5. Comparative RMSE results between the proposed health indicator ΔVRMS and the capacity fade ΔC with respect to the measured capacity fade ΔC (objective time series) for cell B0034 with a discharge current of 4 A (C-rate of 2).
Forecast Start Point (% of Total Useful Life)MethodΔVRMS [Ah]ΔC [Ah]
30%LF0.1490.052
ARIMA0.1610.034
40%LF0.1010.058
ARIMA0.0940.046
50%LF0.0720.095
ARIMA0.0700.043
60%LF0.0610.093
ARIMA0.0570.044
70%LF0.0470.083
ARIMA0.0500.032
80%LF0.0230.065
ARIMA0.0510.058
Table 6. Comparative RMSE results between the experimental measurements of the terminal voltage for cell B0034 vs. SOC and the Nernst equation adjusted with the proposed degradation model with a discharge current of 4 A (C-rate of 2).
CellB0034
Forecast Start Point (% of Total Useful Life)RMSE
25%0.105
50%0.072
80%0.070
Disclaimer/Publisher’s Note: The statements, opinions and data contained in all publications are solely those of the individual author(s) and contributor(s) and not of MDPI and/or the editor(s). MDPI and/or the editor(s) disclaim responsibility for any injury to people or property resulting from any ideas, methods, instructions or products referred to in the content.

