Article

GIS-Based Identification of Locations in Water Distribution Networks Vulnerable to Leakage

1
Dubai Electricity and Water Authority (DEWA), Dubai P.O. Box 564, United Arab Emirates
2
Department of Civil Engineering, American University of Sharjah, Sharjah P.O. Box 26666, United Arab Emirates
3
Department of Engineering, La Trobe University, Melbourne, VIC 3086, Australia
*
Author to whom correspondence should be addressed.
Appl. Sci. 2023, 13(8), 4692; https://doi.org/10.3390/app13084692
Submission received: 22 February 2023 / Revised: 2 April 2023 / Accepted: 4 April 2023 / Published: 7 April 2023
(This article belongs to the Special Issue Advances in Civil Infrastructures Engineering)

Abstract

:
The detection of leakages in Water Distribution Networks (WDNs) is usually challenging and identifying their locations may take a long time. Current water leak detection methods such as model-based and measurement-based approaches face significant limitations that impact response times, resource requirements, accuracy, and location identification. This paper presents a method for determining locations in the WDNs that are vulnerable to leakage by combining six leakage-conditioning factors using logistic regression and vulnerability analysis. The proposed model considered three fixed physical factors (pipe length per junction, number of fittings per length, and pipe friction factor) and three varying operational aspects (drop in pressure, decrease in flow, and variations in chlorine levels). The model performance was validated using 13 district metered areas (DMAs) of the Sharjah Electricity and Water Authority (SEWA) WDN using ArcGIS. Each of the six conditioning factors was assigned a weight that reflects its contribution to leakage in the WDNs based on the Analytic Hierarchy Process (AHP) method. The highest weight was set to 0.25 for both pressure and flow, while 0.2 and 0.14 were set for the chlorine and number of fittings per length, respectively. The minimum weight was set to 0.08 for both length per junction and friction factor. When the model runs, it produces vulnerability to leakage maps, which indicate the DMAs’ vulnerability classes ranging from very high to very low. Real-world data and different scenarios were used to validate the method, and the areas vulnerable to leakage were successfully identified based on fixed physical and varying operational factors. This vulnerability map will provide a comprehensive understanding of the risks facing a system and help stakeholders develop and implement strategies to mitigate the leakage. Therefore, water utility companies can employ this method for corrective maintenance activities and daily operations. The proposed approach can offer a valuable tool for reducing water production costs and increasing the efficiency of WDN.

1. Introduction

Water losses are inevitable in water distribution networks (WDNs) during water transmission from the source to end users. Water loss is the difference between the amount of water consumed (or billed) and the water supplied (or pumped) from the source. Non-revenue water (NRW), which is defined as the amount of water running through the WDN that does not result in revenue for the authority, can occur due to physical infrastructure damages, inaccurate metering and billing systems, and unbilled consumption. NWR consists of apparent losses and actual losses [1]. Apparent losses are the unauthorized consumption of water or inaccuracies in customer metering, and errors in handling the data [2]. A significant amount of actual (or real) losses in the WDN occur due to water leakage in pipelines, fittings, joints, service points, and connections [3]. These leakages are usually hard to detect because the WDN pipelines are buried in the ground; therefore, the water may take a long time to appear at the surface. Such leakages result in economic and environmental losses and damage to the surrounding infrastructure [4,5]; therefore, it is prudent to avoid them.
Detecting water leaks at an early stage will improve efficiency in the WDNs. The methods used to detect water leakages can help identify unusual or abnormal pipeline behavior locations. These methods fall into distinct categories: model-based, measurement-based, and emerging practices, such as remote sensing technology. All methods vary in time, accuracy, cost, and ease of implementation.
Model-based leakage detection methods rely on software systems, algorithms, statistical analysis tools, and optimization techniques to analyze parameters, including flow rate, pressure, and other measurements [6,7]. Model-based detection falls under three categories: (a) physical models, (b) statistical models, and (c) machine learning models [8]. The main advantage of physical models is that they do not require a lot of historical data to develop. Secondly, statistical models provide a mathematical model of potential pipe breaks and the likelihood of occurrence. These models are less expensive and time-consuming as they rely on existing data to determine trends [8]. However, model-based leakage detection methods are susceptible to data quality. Inaccurate data will lead to a biased model and erroneous leak detection. Model-based leakage detection methods also face portability challenges due to structural differences within WDNs. This characterization implies that it is often difficult to extrapolate model-based results from one water main to another [8]. Accurate models must consider static factors (such as pipe material and soil time) and time-dependent variables (such as pipe age, soil temperature, and water temperature). These considerations increase the complexity of the resulting model.
Measurement-based methods require live measurements acquired from field surveys and using instruments on-site to assess the presence and location of leakages, such as radioactive approach, acoustics logging approach, Ground-Penetrating Radar (GPR), and Infrared (IR) thermography [9,10]. Other measurement-based detection methods include acoustic monitoring, pressure analysis, volume balance measurements, and negative pressure evaluations [11]. The data requirements associated with measurement-based models create a significant limitation in practical applications, as such methods require extensive in-field inspections and surveys, which require time and vast resources [8]. The implementation of measurement-based approaches increases the cost of WDN management. Physical measurement-based methods also face limitations in providing continuous failure monitoring and rapid leak detection. Complex WDNs will require sophisticated measurement equipment. Acoustic measurements require many sensors, which increases labor requirements [11]. A study by [12] identified sensor placement as an essential factor influencing accurate leak detection. Labor-intensive leak detection methods result in extended detection and location times. This observation stems from infrequent leak inspections. Measurement-based methods reduce the likelihood of a quick response. The measurement of every network node and branch is not financially feasible.
Other leak detection methods include Geographical Information Systems (GIS) and remote sensing-based tools that can be adopted in large and complex WDNs. The remote sensing method involves investigating and studying the physical features in a particular area by evaluating its reflected wavelengths measured by terrestrial, airborne, or satellite sensors. In some cases, the Normalized Difference Vegetation Index (NDVI) is used to process remotely sensed data and images to detect water leakage locations. Sometimes, field spectroscopy reinforces remote-sensing-based outcomes because low spatial resolution images may not be sufficient to detect small leakages [5]. Detection systems can deploy three remote sensing methods: ground, arial, and satellite [13]. The advantages associated with ground-based remote sensing include continuous leak monitoring and high spatial resolution. However, this technology faces limitations resulting from low spatial coverage. This characteristic implies that complex WDNs will require a network of sensors, which increases detection costs. Ground-based remote sensing equipment is exposed to the environment and requires frequent maintenance [13]. The benefits of aerial remote sensing include rapid deployment and excellent ground coverage relatively quickly. However, environmental and weather factors influence aerial deployment. Aerial sensing does not offer continuous monitoring and is expensive to implement and maintain [13]. Finally, satellite remote sensing provides unmatched ground coverage on continental and global scales. However, low resolution can hamper leak source identification. The weather affects some satellite remote sensing capabilities, except RADAR [14]. Deploying satellite remote sensing for smaller networks is not economically feasible, since this system requires high capital investment.
GIS manages, stores, analyzes, and displays georeferenced information [15]. GIS algorithms aid in the modeling, visualization, analysis, and management of WDN [16]. It can, therefore, help in the decision-making process by presenting detailed and specific information regarding a location with a suspected leakage. GIS also reduces costs and increases operational efficiency, especially in managing infrastructures such as highways, roads, WDNs, and pipelines. However, a GIS-based approach requires high technical knowledge to ensure accurate data interpretation, consisting of multiple layers for a complex task such as leakage detection. GIS-based methods must adequately manage the data quality to develop advanced prediction queries on the status of the water pipeline. This solution requires adaptable and flexible data aligned with the unique characteristics of the WDN. A flexible GIS-based detection system enhances information interoperability from different sources. In addition to utilizing it to represent the WDN layers (refer to Figure 1), GIS was used in this study to determine locations in the WDNs that are vulnerable to leakage by combining six leakage-conditioning factors using the logistic regression and vulnerability analysis. It was also used for creating leakage vulnerability maps.
Logistic regression and vulnerability analysis is utilized to identify the parts of WDNs that are susceptible to leaks. Logistic regression is a form of predictive analysis that describes relationships between variables in different forms, such as nominal, ordinal, and ratio scales. The model coefficients relating to the dependent variable are estimated using the experience of the user or maximum likelihood estimation (MLE) [17,18]. Several studies have been conducted to compare the performance of various leak detection models and approaches, using different statistical and machine learning models for predicting pipeline failure in WDNs [19,20]. One study enhanced the understanding of leak detection prediction by evaluating the accuracy and performance of modeling approaches such as linear regression, Poisson regression, and polynomial regression [19]. Another study highlighted that accurate models must consider static factors and time-dependent variables [8]. Models that rely on static elements such as pipe material and soil type could potentially lead to biased predictions. Including fixed and varying factors should enhance the accuracy of leak detection predictions. For instance, considering time-dependent factors allows prediction models to classify pipes based on expected deterioration and other stress elements. The current state of the art highlights the importance of transient phenomena in managing WDNs. According to one study [21], transient flows form distribution systems during transient flow states. This phenomenon results from planned or unplanned events in the system, which change pipe flow parameters. It was noted that considering transient characteristics is essential for improving leak detection [21]. Two different studies stated that pipe anomalies are important to consider, since they result in flow capacity reductions and energy losses within the distribution network [21,22].
The novelty of this manuscript is to create a vulnerability map which is a graphical representation or visualization of areas or systems that are at risk of being compromised or exploited by potential threats or attacks. These maps can be used to identify areas of weakness in a system or network and prioritize efforts to strengthen security measures. Vulnerability analysis is therefore a systematic process of identifying, classifying, evaluating, and assessing susceptibility to hazards [23]. Vulnerability analysis is crucial for effective planning to mitigate the impact of risks. There are various approaches to identifying different types of vulnerability. The most common vulnerability assessment requires the calculation of Vulnerability Indices (VI) using other parameters that are considered indicators of vulnerability [24]. Calculations of vulnerability indices utilize parameters consisting of potentially influential variables that are given a score depending on their effect on decreasing or increasing vulnerability [24,25]. The results of the vulnerability indices are grouped into classes, and the variables are rated based on their contribution to vulnerability. For example, a low index score means intervention is unnecessary. A critical or high score may indicate the need for immediate intervention. In contrast, a medium score may indicate that a non-urgent intervention is required [23]. Such outcomes are critical in guiding data-driven decision making within water management authorities.

2. Problem Statement

Water authorities are responsible for providing a safe and reliable water supply to the end users. NRW is a significant challenge for water authorities in most countries, especially the developing ones where control mechanisms are often cost prohibitive. Recent statistics show that the worldwide NRW volume is about 126 billion cubic meters annually, which translates into 346 million cubic meters daily [26]. Studies have shown that 25–50% of treated water is considered NRW due to deteriorating water distribution infrastructure, leakages, faulty billing systems, illegal connections, inaccurate water pressure management, and errors in metering, among other factors. This surpasses the World Bank recommendation of 25% of the total water produced, with many countries recording NRWs exceeding 60% [27]. In developing countries, about 45 million m3 of water is lost daily, representing over USD 3B annually [28,29]. NRW values are the highest among low-income and lower-middle-income regions, and relatively lower among the upper-middle-income and high-income countries [30]. The high NRW level poses severe economic and environmental implications [31]. Therefore, measures should be taken to reduce water losses in WDNs, even in developing countries.
In Sharjah, UAE, Sharjah Electricity and Water Authority’s (SEWA) water leakage percentage is approximately 20%—slightly lower than worldwide values [32]. However, even a small percentage of loss is financially significant, as potable water supply poses a considerable challenge in this part of the world due to freshwater scarcity. Sharjah overcomes this challenge by relying on expensive seawater and brackish groundwater desalination to produce potable water to meet the increasing water demand and compensate for the water losses. Potable water production by desalination consumes enormous energy and has numerous negative environmental impacts on both air and water bodies, thereby increasing the carbon and water footprint [33]. Thus, water leakage must be managed to save energy, money, and the environment. Water leakage management can be categorized into leakage assessment, detection, and control. Leakage assessment quantifies the amount of water leaked, leakage detection locates the leaking parts of the WDN, and leakage control regulates current and possible future leakage percentages in the WDNs [9]. This study aims to develop a leakage detection method to help identify locations in the WDN that are vulnerable to leakage, considering major conditioning factors. The innovative aspects introduced in this work with respect to the known literature include the use of logistic regression and vulnerability analysis, which is utilized to identify the parts of WDN that are susceptible to leaks.

3. Materials and Methods

In this study, a methodology based on logistic regression and vulnerability analysis for identifying critical locations in the WDN is developed using real-time data collected by SEWA throughout the WDN of the City of Sharjah. The methodology adopted for this research is used to overcome the limitations of other leak detection methods. In this study, leakage is the dependent variable, and the independent variables are the conditioning factors, which include the network’s operational and physical parameters. The study enhanced current solutions by integrating vulnerability analysis into the prediction model. The proposed model overcomes the challenges of previous prediction models by considering fixed physical factors and varying operational factors. The proposed model also advances the current state of the art in leak detection by considering static and dynamic factors in leak detection modeling.
This study employs the Analytic Hierarchy Process (AHP), which is a decision-making technique that involves breaking down complex problems into smaller, more manageable parts [34,35]. AHP is widely used in fields such as business, engineering, and social sciences. The method allows decision makers to compare and evaluate the relative importance of different criteria or alternatives by assigning them numerical values. One of the main advantages of the AHP method is its ability to handle complex decision-making problems by breaking them down into smaller, more manageable components. It also allows for the consideration of multiple criteria and perspectives, providing a more comprehensive evaluation of alternatives. However, AHP does have limitations, including the potential for subjectivity and the need for extensive data collection and analysis. Overall, the AHP method is a powerful tool for decision making, particularly in situations where multiple criteria must be considered [34,35].

3.1. Data Set

Pipelines in the WDN of the City of Sharjah have an estimated total length of 3153 km, with pipe diameters ranging from 1200 mm to 19 mm and composed of different materials. In this study, only 13 District Metered Areas (DMAs) were considered; these are shown as colored polygons, as illustrated in Figure 1. A full detailed hydrodynamic model of the pipelines in Sharjah’s WDN was provided by SEWA, and all related data regarding pipes parameters were withdrawn from this model. Pipes in the WDN of the City of Sharjah are mostly asbestos cement (AC), then medium-density polyethylene (MDPE), high-density polyethylene (HDPE), and glass-reinforced pipes (GRP). Full details of other data sets are given in the next sections.

3.2. Parameters Used in Vulnerability Analysis of the WDN

The selection of the parameters (leakage conditioning factors) in this study was restricted due to the limited available data provided by SEWA. The parameters used in this study were divided into operational and fixed physical parameters. The method considers three fixed physical factors that do not change with time, such as pipe length per junction, the number of fittings per length and pipe friction factor, and three varying operational factors (drop in pressure, drop in flow and drop in chlorine). Operational parameters refer to the hydraulic and water quality components in the WDN that vary and fluctuate with time.
  • Drop in pressure: Pressure in the pipelines affects the performance of WDNs, as it increases leaks and the corresponding water losses. In addition, there is a direct relationship between drops in pressure and leakages in WDNs [36]. Pressure fluctuations also affect the performance of WDNs due to trapped air, pressure regulating valve issues, old or clogged pipes, or high usage in one line. A study by [37,38] connects pressure changes and leakages by evaluating various leak types in pipe materials. Pressure surges also impact the performance of WDNs due to flow velocity changes caused by multiple factors, such as entrapped air, the start or stoppage of pumps, or quick valve opening and closing. According to a study by [39], pressure surges directly contribute to leakages in WDNs—significantly so when the water pipe walls are damaged. Therefore, pressure drops, fluctuations, and surges are significant signs of leakages.
  • Drop in flow: Flow in the WDN is another operational parameter directly related to leakage. Flow drops and leakages are interrelated and can both have negative impacts on the performance of WDN. If there is a significant leak in the system, it can reduce the pressure and flow rate downstream of the leak. This can result in a loss of performance or efficiency in the system, as well as potential safety hazards. Flow is usually used to assess the amount of leakage using the mass balance [40].
  • Drops in chlorine were considered an indicator for reducing water quality in the WDN. When there is a significant water leak, it can cause a drop in water pressure in the system, which may allow outside contaminants to enter the water pipes. If the contaminants are microorganisms, the chlorine in the water may react with them, which can cause the chlorine levels in the water to decrease. Therefore, a decrease in chlorine levels in the water can be an indicator of a water leakage, as it suggests that the chlorine is reacting with contaminants that have entered the water supply through the leak. Water utilities monitor chlorine levels in the water to identify any changes that may indicate a potential water leakage or contamination issue.
The pressure (in bar) and flow data (in m3) provided by SEWA for the 13 DMAs were the daily average pressure and flow from January to October in 2019. To represent the drops in pressure and flow, the following calculation was carried out for the 13 DMAs for each month:
Pdrop = Pmontly-aver − Pdaily
Fdrop = Fmontly-aver − Fdaily-aver
Table 1 illustrates the drops in pressure and flow sample calculation for (DMA1) in January, and values higher than the monthly average are shown in bold. Figure 2 shows an example of the normalized daily fluctuations in the pressure and flow for DMA1 for January compared to the average pressure and flow.
Degradation or drops in chlorine concentration might be associated with water loss and leakage. Leakage in the WDN can adversely affect the flow and pressure in the pipelines and have a detrimental effect on water quality. The chlorine level is usually higher near the source (desalination plants) in the WDN because the chlorine dosage is injected at this phase and then reduces in the later distribution stages. Several studies have used changes in water quality parameters and chlorine concentrations to detect leakages in the WDN [41,42]; thus, drops in chlorine are used in this study. Table 2 summarizes the drops in chlorine for the 13 DMA.
Physical parameters refer to the pipe properties, such as pipe length, pipe material, pipe diameter, and the number of fittings in the WDN. These parameters are almost fixed and rarely change in the WDN. Generally, continuous (long) pipes perform better against hazards and are more durable than short pipes. Therefore, long pipes are less prone to leakage [23]. Pipe length can be used as a measure for representing water leakage, as recommended by the IWA. In this case, leakage can be expressed as the number of leaks per km per year [43]. In this study, pipe length (in m) per junction was used as a condition factor for leakage, as proposed in Equation (3) and Table 3.
Σ L p i p e Σ N J
The number of fittings is another important parameter, where the higher the number of joints and fittings, the greater the potential for leakages and losses in the WDNs. Usually, damage and leakage in WDNs occur in segments with fittings, such as tees, bends, and customer connections. Fitting locations are considered weak points in the WDN and are susceptible to leakage [23]. Table 4 presents information computed using Equation (4) in the 13 areas used in this study. This parameter represents the total number of fittings and customer connections per length, and these values, calculated by Equation (4), are shown in the last column of Table 4.
Σ N F + N c c Σ L p i p e
Pipelines in any WDN typically consist of different pipe diameters and corresponding pipe material. Pipe material usually varies, especially in old networks with segments in the network that have been upgraded or been through rehabilitation for different reasons. A study found that diverse pipe materials running under the same conditions perform differently regarding water leakage. For instance, a 50% increase in pressure in high-density polyethylene (HDPE) pipes had a 22.67% leakage rate compared to unplasticized polyvinyl chloride (uPVC) (34.23%) and galvanized steel at a 42.93% leakage rate [44]. Pipelines in Sharjah’s WDN mainly consist of asbestos cement (AC), then medium-density polyethylene (MDPE), high-density polyethylene (HDPE), and glass-reinforced polymer (GRP).
Pipe diameters are also not consistent in any WDN. Pipes with small diameters usually experience significantly more damage regardless of the pipe materials, due to variation in water pressure, compared to pipes with large diameters [23]. Diameter is therefore considered a crucial parameter in leakage vulnerability analysis. In the 13 studied DMAs in this project, pipe diameters vary from 1200 mm to 19 mm. Pipes with large diameters greater than 600 mm usually branch out from the transmission pipeline to supply WDN in the DMA. Medium pipe diameters between 400 mm to 100 mm are used to distribute and circulate water in the WDNs. Small pipe diameters of 63 mm and lower are usually used for customer connection and service points. To represent pipe diameter and material in this study, the Nikuradse friction factor equation was used, assuming all pipes in the WDN are rough pipes. The friction factor (f), as in Equation (5), was only affected by relative roughness. The analysis used the Nikuradse equation to compute the friction factor in all the pipe segments in the 13 DMAs.
1 f 2 l o g d ε = 1.14
where f is the friction factor (dimensionless), d is the pipe diameter (mm), ε is the roughness height (mm), and ε/d is the relative roughness. The analysis showed that the maximum f value for each area was around 0.016.
The weights in Table 5 were assigned to each of the six parameters (or leakage conditioning factors) based on their contribution to leakage using the Analytic Hierarchy Process (AHP) [45]. This method has proven to be successful in determining the weights of the conditioning factors of many processes that are known to have some risk, such as landslides, earthquakes, flooding, and coastal inundation [46,47,48,49]. The AHP method was chosen because it has many advantages, including its simplicity, consideration of objective or subjective, or either quantitative or qualitative information in the decision process, and it can be used with any level of detail when representing the problem at hand.
The logistic regression model, which combines the six parameters, can be represented as shown in Equation (6) below.
Z = a1Q + a2P + a3Chl + a4FL + a5 LJ + a6f
where Z is the dependent variable based on the independent parameters in Table 5, and a1, a2, …, an are the model coefficients depending on the weight values for the corresponding parameters.
Then, the logistic regression function, which helps to determine the probability of the occurrence of Z with values ranging from 0 to 1, can be written as follows [50]:
f ( Z ) = 1 1 + e Z

4. Results and Analysis

The data presented in the methodology were prepared as ArcGIS raster layer to perform vulnerability analysis with the model in Equation (6) using the Spatial Analyst Toolbox. The following color schemes (Table 6) are used for the representation of classes of vulnerability. Figures in this section represent the tabular data as maps:
This section may be divided by subheadings. It should provide a concise and precise description of the experimental results, their interpretation, as well as the experimental conclusions that can be drawn.

4.1. Physical Parameters (Unchanging Parameters)

Length per junction (Figure 3): the green areas are DMA 6 (Al Faya) and DMA 4 (Al Barashi). They are rural areas with less population density, and the WDN in these areas has more continuous pipelines with fewer junctions compared to the old dense areas that are highlighted in orange (DMA 10 (Al Ghafia)) and red (DMA 8 (Al Butina) and DMA 7 (Al Guwair)).
Fittings per length (Figure 4): the highlighted red area represents DMA 7 (Al Guwair), an old area with old souks with a high number of fittings and customer connections compared to the other areas in the WDN. The orange area represents DMA 1 (Al Rahmaniya 1), another old area with high fittings and customer connections. The yellow area represents DMA 4 (Al Barashi) and DMA 5 (Al Maysaloon), areas with average fittings and customer connections. The green area represents DMA 6 (Al Faya), DMA 9 (Al Sabkha), and DMA 10 (Al Ghafia), which are areas with low fittings and customer connections.
The friction factor (Figure 5) represents both pipe diameter and pipe material combined. DMA 8 (Al Butina) has the lowest minimum and maximum, implying that its pipes’ pressure experienced the lowest loss. DMA 7 (Al Guwair) had the highest minimum and maximum, implying that its pipes experienced increased pressure loss.

4.2. Operational Parameters (Varying Parameters)

Similarly, the three operational parameters (flow, pressure, and chlorine) were entered in the model in three scenarios representing highest, lowest, and average flow; pressure; and chlorine drops. Figure 6 shows the flow drop maps: highest (a); lowest (b), with the highest flow drop scenario representing the extreme drop in the three parameters and the lowest showing the influence of the lowest drop on the WDN. The average drops can represent a normal daily scenario, but maps for the average values are not shown for the brevity of the manuscript. Figure 7 also shows the pressure drop maps: highest pressure (a); lowest pressure (b), with the highest pressure showing the extreme drop in the three parameters and the lowest representing the lowest pressure on the WDN. Figure 8 shows the chlorine drop maps: highest chlorine drops (a); lowest chlorine drops (b), with the highest drop representing the extreme drop and the lowest drop showing the least drop in the WDN.

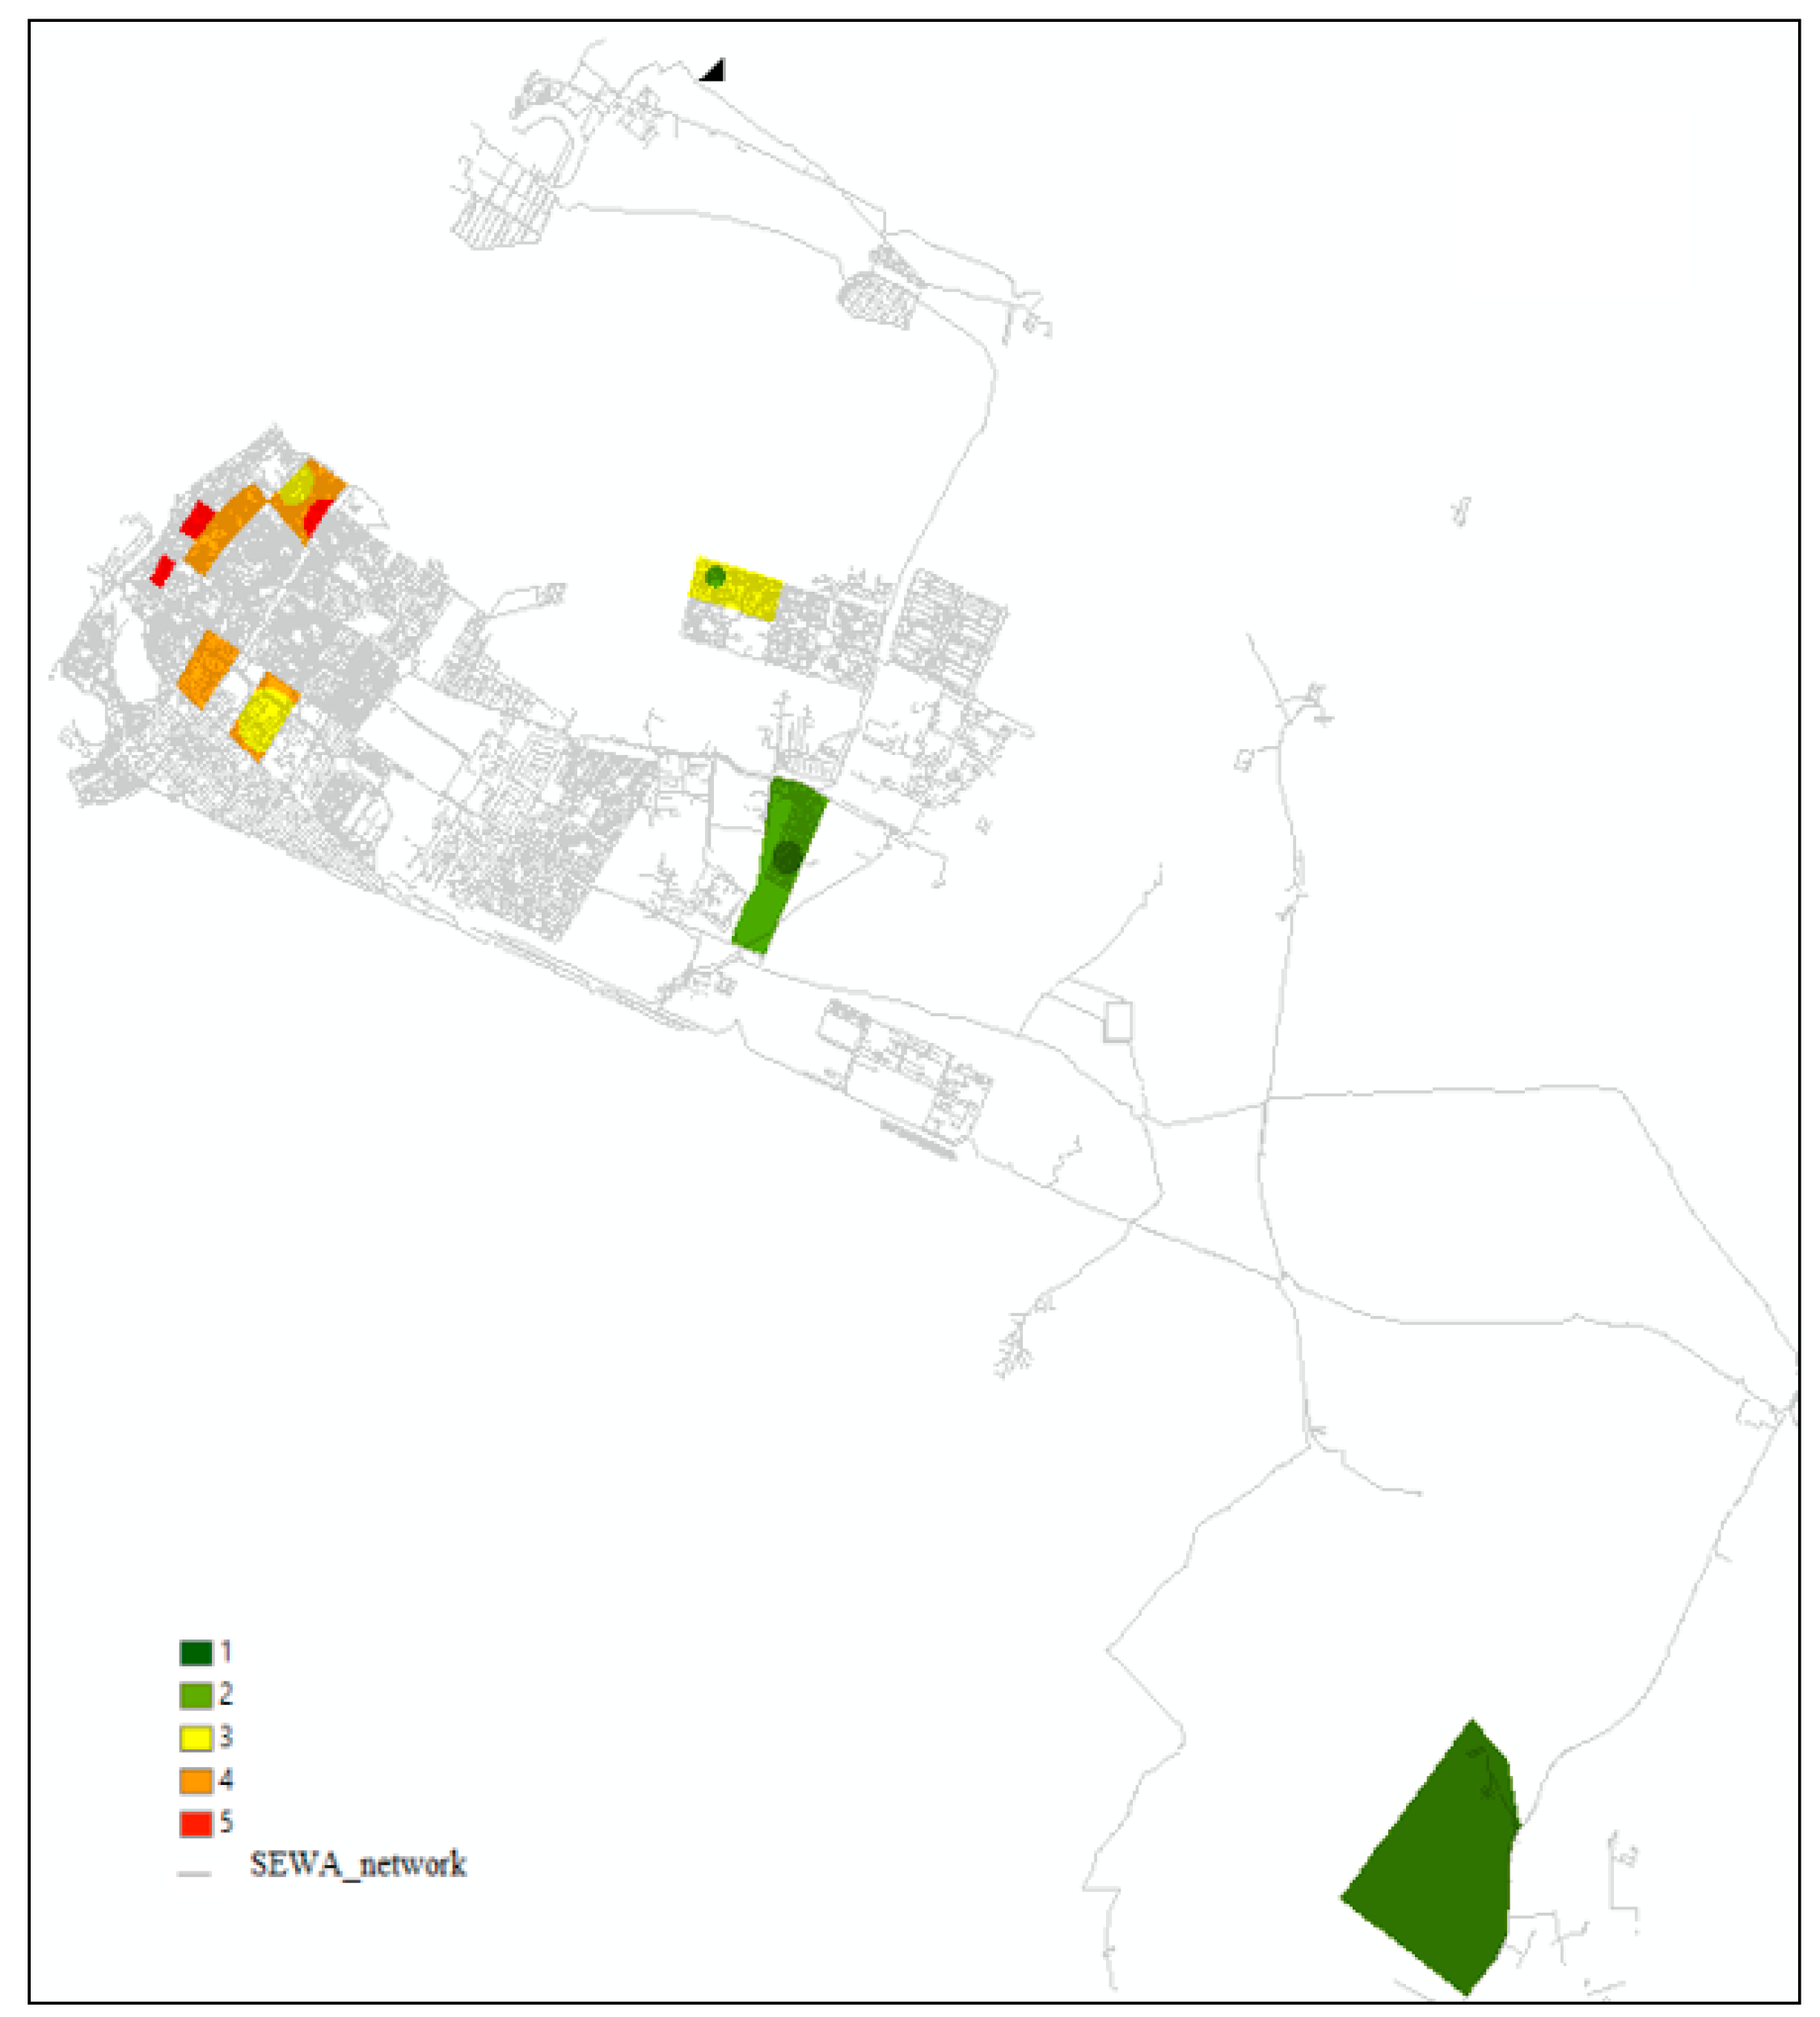
4.3. Vulnerability Map

The vulnerability maps represent the result of the model of Equation (6). The model was run on three different scenarios to allow for comparison and to prove that the method works. The five color scheme classifications are used as indicators to classify vulnerable areas, as shown in Figure 9.
Running the model using the highest drop values in all the parameters detects the weakest and most vulnerable areas, as illustrated in Figure 9a. DMA 4 (Al Barashi) and DMA 2 (Rahmaniya 3), highlighted in red, can be classified as highly vulnerable in extreme scenarios. This is followed by DMA 13 (Industrial Area 6) and DMA9 (Al Sabkha), highlighted in orange. As part of the model validation, the lowest drop values were entered in the model, resulting in a map that does not have vulnerable areas, as expected. All the DMAs are highlighted in green, as shown in Figure 9b, showing low vulnerable areas. Figure 8b validates the model since it shows low vulnerable DMA areas without any vulnerability. The average drop values used in this model represent the average regular drops and the daily expected areas in the WDN that are vulnerable to leakage. DMA 11 (Al Nasserya) and DMA 8 (Butina) exhibit a high degree of vulnerability on an average basis scenario.

4.4. Practical Implications

Water management authorities can apply the proposed logistic model and vulnerability assessment to identify areas of concern within the WDN. As illustrated in the previous sections, the model can aid in producing distribution network maps that identify the vulnerability of various WDNs based on multiple static and dynamic factors. Insights from the maps are critical in guiding decision making regarding the essential areas of concern, while helping to prevent risks. The model could support decision making concerning the vulnerable areas to upgrade the water distribution network considering the maximum, minimum, and average drops in the varying factors (flow, pressure, chlorine). The solution should also efficiently support resource allocation and distribution by ensuring preventive maintenance and response efforts focused on critical areas. The results illustrate that water management authorities can use the proposed model for early leak detection, vulnerability assessment, and leak likelihood evaluation. The maps are also critical in establishing the location of water leaks.

5. Conclusions

This paper presents a new leakage detection method. The method uses logistic regression and vulnerability analysis implemented in a GIS environment. The logistic regression model considered six parameters as conditioning factors for leakage, including three fixed and three dynamic variables. The six parameters include pipe length per junction, number of fittings per length, and pipe friction factor, as well as three variable operational factors including drop in pressure, decrease in flow, and variations in chlorine levels (as indicators of change in water quality). To validate the model, 13 DMAs of the SEWA WDN were used. The method successfully created vulnerability maps considering the maximum, minimum, and average drops in the varying factors (flow, pressure, chlorine). Knowing that flow, pressure, and chlorine values are measured by many utility companies on an hourly basis throughout the WDN daily, the vulnerability maps will be updated accordingly. These “dynamic” maps can help identify network parts that are vulnerable to leakage. A main advantage of this method is its simplicity and ease of implementation, especially for corrective maintenance activities.
A major limitation to the method developed in this research is the need to access the water flow, pressure, and chlorine throughout the WDN, which are measured on an hourly basis for many WDNs. Moreover, although access to such data can be challenging, in future studies it is recommended to include more parameters that influence leakages, such as the age of the WDN pipes and the type of soil where the pipes are buried. Future work can investigate the contribution of each of the parameters considered in this study to water leakage in the WDN, which will help to robustly determine the weights assigned for each parameter. Finally, water utility companies are encouraged to share their WDN data, which will help to support research activities in this area.
Future research efforts should focus on identifying the cause of potential failure. Subsequent categorization and classification of these sources of pipe failure could help enhance the detection model. It is crucial to note that pipe leakage stems from diverse causes. Accounting for failure models will also improve model sensitivity while enhancing applicability in different sectors. The detection model could include data on WDN isolation locations for valves. Incorporating these locations in the model will improve detection measures. For automated systems, mapped valve locations can help management teams respond swiftly by isolating leaking pipes in the WDN.

Author Contributions

Conceptualization, T.A. and S.A.; methodology, T.A. and E.A.; validation, A.G.Y.; formal analysis, E.A., S.A. and T.A.; investigation, resources, M.M.M. and K.P.F.; data curation, S.A. and T.A., writing—original draft preparation, E.A.; writing—review and editing, K.P.F., Z.K., T.A., S.A. and M.M.M.; visualization, S.A. and T.A.; supervision, S.A. and T.A. All authors have read and agreed to the published version of the manuscript.

Funding

This research received no external funding.

Institutional Review Board Statement

Not applicable.

Informed Consent Statement

Not applicable.

Data Availability Statement

No new data were created or analyzed in this study. Data sharing is not applicable to this article.

Acknowledgments

The work in this paper was supported, in part, by the Open Access Program from the American University of Sharjah. This paper represents the opinions of the authors and does not mean to represent the position or opinions of the American University of Sharjah. The authors would like to acknowledge partial support of this work provided by the American University of Sharjah with grant number FRG22-C-E15. Appreciative acknowledgement also goes to Sharjah Electricity and Water Authority (SEWA) for providing the data and information required for completing this study.

Conflicts of Interest

The authors declare no conflict of interest. The funders had no role in the design of the study; in the collection, analyses, or interpretation of data; in the writing of the manuscript; or in the decision to publish the results.

References

  1. Farok, G.G. Non-revenue water (NRW) is a challenge for global water supply system management: A case study of Dhaka water supply system management. J. Mech. Eng. 2016, 46, 28–35. [Google Scholar] [CrossRef] [Green Version]
  2. Ress, E.; Roberson, J.A. The Financial and Policy Implications of Water Loss. J. Am. Water Work. Assoc. 2016, 108, E77–E86. [Google Scholar] [CrossRef]
  3. Aslam, H.; Mortula, M.M.; Yahia, S.; Ali, T. Evaluation of the factors impacting the water pipe leak detection ability of GPR, infrared cameras, and spectrometers under controlled conditions. Appl. Sci. 2022, 12, 1683. [Google Scholar] [CrossRef]
  4. Kim, Y.; Lee, S.J.; Park, T.; Lee, G.; Suh, J.C.; Lee, J.M. Robust leak detection and its localization using interval estimation for water distribution network. Comput. Chem. Eng. 2016, 92, 1–17. [Google Scholar] [CrossRef]
  5. Agapiou, A.; Alexakis, D.D.; Themistocleous, K.; Hadjimitsis, D.G. Water leakage detection using remote sensing, field spectroscopy and GIS in semiarid areas of Cyprus. Urban Water J. 2016, 13, 221–231. [Google Scholar] [CrossRef]
  6. Kim, Y.; Lee, S.J.; Park, T.; Lee, G.; Suh, J.C.; Lee, J.M. Robust leakage detection and interval estimation of location in water distribution network. IFAC Pap. Line 2015, 48, 1264–1269. [Google Scholar] [CrossRef]
  7. Rajeswaran, A.; Narasimhan, S.; Narasimhan, S. A graph partitioning algorithm for leak detection in water distribution networks. Comput. Chem. Eng. 2018, 108, 11–23. [Google Scholar] [CrossRef] [Green Version]
  8. Aslani, B.; Mohebbi, S.; Axthelm, H. Predictive analytics for water main breaks using spatiotemporal data. Urban Water J. 2021, 18, 433–448. [Google Scholar] [CrossRef]
  9. Atef, A.; Zayed, T.; Hawari, A.; Khader, M.; Moselhi, O. Multi-tier method using infrared photography and GPR to detect and locate water leaks. Autom. Constr. 2016, 61, 162–170. [Google Scholar] [CrossRef]
  10. Sadeghioon, A.M.; Metje, N.; Chapman, D.N.; Anthony, C.J. SmartPipes: Smart wireless sensor networks for leak detection in water pipelines. J. Sens. Actuator Netw. 2014, 3, 64–78. [Google Scholar] [CrossRef]
  11. Misiūnas, D. Failure Monitoring and Asset Condition Assessment in Water Supply Systems; Vilniaus Gedimino Technikos Universitetas: Vilnius, Lithuania; Lund University: Lund, Sweden, 2008; 349p. [Google Scholar]
  12. Adedoja, O.S.; Hamam, Y.; Khalaf, B.; Sadiku, R. A state-of-the-art review of an optimal sensor placement for contaminant warning system in a water distribution network. Urban Water J. 2018, 15, 985–1000. [Google Scholar] [CrossRef]
  13. Verkerke, J.L.; Williams, D.J.; Thoma, E. Remote sensing of CO2 leakage from geologic sequestration projects. Int. J. Appl. Earth Obs. Geoinf. 2014, 31, 67–77. [Google Scholar] [CrossRef] [Green Version]
  14. Rowland, A. GIS-Based Prediction of Pipeline Third-Party Interference Using Hybrid Multivariate Statistical Analysis. Ph.D. Thesis, University of Newcastle, Upon Tyne, UK, 2011. [Google Scholar]
  15. Information on Maps/Mapping Geographic Information Systems (GIS). Research Guides University of Wisconsin-Madison Libraries. Available online: https://researchguides.library.wisc.edu/GIS (accessed on 12 November 2022).
  16. Mortula, M.M.; Ali, T.A.; Sadiq, R.; Idris, A. Al Mulla, A. Impacts of water quality on the spatiotemporal susceptibility of water distribution systems. Clean Soil Air Water 2019, 47, 1800247. [Google Scholar] [CrossRef]
  17. Badi, N.H.S. Properties of the Maximum Likelihood Estimates and Bias Reduction for Logistic Regression Model. Ph.D. Thesis, University of Benghazi, Benghazi, Libya, 2017. [Google Scholar] [CrossRef]
  18. Magnus, J.R. Maximum likelihood estimation. In Matrix Differential Calculus with Applications in Statistics and Econometrics, 3rd ed.; John Wiley Sons Ltd.: New York, NY, USA, 2019; pp. 346–366. [Google Scholar]
  19. Giraldo-González, M.M.; Rodríguez, J.P. Comparison of statistical and machine learning models for pipe failure modeling in water distribution networks. Water 2020, 12, 1153. [Google Scholar] [CrossRef] [Green Version]
  20. Cantos, W.P.; Juran, I.; Tinelli, S. Machine-learning–based risk assessment method for leak detection and geolocation in a water distribution system. J. Infrastruct. Syst. 2020, 26, 04019039. [Google Scholar] [CrossRef]
  21. Duan, H.F.; Pan, B.; Wang, M.; Chen, L.; Zheng, F.; Zhang, Y. State-of-the-art review on the transient flow modeling and utilization for urban water supply system (UWSS) management. J. Water Supply Res. Technol. Aqua 2020, 69, 858–893. [Google Scholar] [CrossRef]
  22. Che, T.C.; Duan, H.F.; Lee, P.J. Transient wave-based methods for anomaly detection in fluid pipes: A review. Mech. Syst. Signal Process. 2021, 160, 107874. [Google Scholar] [CrossRef]
  23. Halfaya, F.; Bensaibi, M.; Davenne, L. Vulnerability assessment of water supply network. Energy Procedia 2012, 18, 772–783. [Google Scholar] [CrossRef]
  24. Drejza, S.; Bernatchez, P.; Marie, G.; Friesinger, S. Quantifying road vulnerability to coastal hazards: Development of a synthetic index. Ocean. Coast. Manag. 2019, 181, 104894. [Google Scholar] [CrossRef]
  25. Rocha, C.; Antunes, C.; Catita, C. Coastal vulnerability assessment due to sea level rise: The case study of the Atlantic coast of mainland Portugal. Water 2020, 12, 360. [Google Scholar] [CrossRef] [Green Version]
  26. Liemberger, R.; Wyatt, A. Quantifying the global non-revenue water problem. Water Supply 2019, 19, 831–837. [Google Scholar] [CrossRef]
  27. Soppe, G.; Janson, N.; Piantini, S. Water Utility Turnaround Framework; World Bank Group: Washington, DC, USA, 2018. [Google Scholar]
  28. Jang, D.; Choi, G. Estimation of non-revenue water ratio for sustainable management using artificial neural network and Z-score in Incheon, Republic of Korea. Sustainability 2017, 9, 1933. [Google Scholar] [CrossRef] [Green Version]
  29. The World Bank and the International Water Association to Establish a Partnership to Reduce Water Losses. 2016. Available online: https://www.worldbank.org/en/news/press-release/2016/09/01/the-world-bank-and-the-international-water-association-to-establish-a-partnership-to-reduce-water-losses (accessed on 19 October 2020).
  30. Van den Berg, C. The Drivers of Non-Revenue Water: How Effective Are Non-Revenue Water Reduction Programs? World Bank Policy Research Working Paper; World Bank Group: Washington, DC, USA, 2014; p. 6997. [Google Scholar] [CrossRef]
  31. Ahopelto, S.; Vahala, R. Cost–benefit analysis of leakage reduction methods in water supply networks. Water 2020, 12, 195. [Google Scholar] [CrossRef] [Green Version]
  32. Chowdhury, R.K.; Rajput, M.A. Leakage and failures of water distribution mains in the city of Al Ain, UAE. Water Pract. Technol. 2016, 11, 806–814. [Google Scholar] [CrossRef]
  33. Sousa, J.; Ribeiro, L.; Muranho, J.; Marques, A.S. Locating leaks in water distribution networks with simulated annealing and graph theory. Procedia Eng. 2015, 119, 63–71. [Google Scholar] [CrossRef] [Green Version]
  34. Saaty, T.L. Decision Making with the Analytic Hierarchy Process. Int. J. Serv. Sci. 2008, 1, 83–98. [Google Scholar] [CrossRef] [Green Version]
  35. Diakoulaki, D.; Mavrotas, G.; Papayannakis, L. Determining Objective Weights in Multiple Criteria Problems: The SMART Approach. Comput. Oper. Res. 1995, 22, 763–769. [Google Scholar] [CrossRef]
  36. Van Zyl, J.E.; Nsanzubuhoro, R. Pressure-based leakage characterisation of water pipes. In Proceedings of the No-Dig down Under, Melbourne, Australia, 11–13 September 2019. [Google Scholar]
  37. Van Zyl, J.E.; Malde, R. Evaluating the pressure-leakage behavior of leaks in water pipes. J. Water Supply 2017, 66, 287–299. [Google Scholar] [CrossRef]
  38. Nsanzubuhoro, R. Pressure-Based Leakage Characterization of Bulk Pipelines. Ph.D. Thesis, University of Cape Town, South Africa, 2019. [Google Scholar]
  39. Ha, H.P.; Thi Minh, L.P.; Van, L.T.; Bulgakov, B.; Bazhenova, S. Assessment of water pipes durability under pressure surge. Earth Environ. Sci. 2017, 90, 012223. [Google Scholar] [CrossRef] [Green Version]
  40. Jiménez-Cabas, J.; Romero-Fandiño, E.; Torres, L.; Sanjuan, M.; López-Estrada, F.R. Localization of leaks in water distribution networks using flow readings. IFAC Pap. 2018, 51, 922–928. [Google Scholar] [CrossRef]
  41. Kumar, J.; Sreepathi, S.; Brill, E.D.; Ranjithan, R.; Mahinthakumar, G. Detection of leaks in water distribution system using routine water quality measurements. In World Environmental and Water Resources Congress 2010: Challenges of Change; American Society of Civil Engineers: Reston, VA, USA, 2010; pp. 4185–4192. [Google Scholar]
  42. Alsaydalani, M.O.A. Simulation of pressure head and chlorine decay in a water distribution network: A case study. Open Civ. Eng. J. 2019, 13, 58–68. [Google Scholar] [CrossRef]
  43. Jang, D. A parameter classification system for nonrevenue water management in water distribution networks. Adv. Civ. Eng. 2018, 2018, 3841979. [Google Scholar] [CrossRef]
  44. Latchoomun, L.; King, R.A.; Busawon, K.; Mawooa, D.; Kaully, R.G. Laboratory investigation of the leakage characteristics of unburied HDPE pipes. Procedia Eng. 2015, 119, 91–100. [Google Scholar] [CrossRef] [Green Version]
  45. Saaty, R.W. The Analytic Hierarchy Process—What it is and how it is used. Math. Model. 1987, 9, 161–176. [Google Scholar] [CrossRef] [Green Version]
  46. Ayalew, L.; Yamagishi, H.; Marui, H.; Kanno, T. Landslides in Sado Island of Japan: Part II. GIS-based susceptibility mapping with comparisons of results from two methods and verifications. Eng. Geol. 2005, 81, 432–445. [Google Scholar] [CrossRef]
  47. Gorsevski, P.; Gessler, P.; Boll, J.; Elliot, W.; Foltz, R. Spatially and temporally distributed modeling for landslide susceptibility. Geomorphology 2006, 80, 178–198. [Google Scholar] [CrossRef]
  48. Dang, N.; Babel, M.; Luong, H. Evaluation of flood risk parameters in the Day River Flood Diversion Area, Red River Delta, Vietnam. Nat. Hazards 2011, 56, 169–194. [Google Scholar] [CrossRef]
  49. Sekovski, I.; Río, L.; Armaroli, C. Development of a coastal vulnerability index using analytical hierarchy process and application to Ravenna province (Italy). Ocean. Coast. Manag. 2020, 183, 104982. [Google Scholar] [CrossRef]
  50. Ali, T.; Mortula, M.; Atabay, S.; Navadeh, E. A GIS-based spatiotemporal study of the variability of water quality in the Dubai Creek, UAE. Water Qual. Res. J. Can. 2016, 51, 219–232. [Google Scholar] [CrossRef] [Green Version]
Figure 1. Studied DMAs.
Applsci 13 04692 g001
Figure 2. Flows (m3) and pressures (bar) per day in DMA 1, the straight line represents the average.
Applsci 13 04692 g002
Figure 3. Physical parameters; length per junction map.
Applsci 13 04692 g003
Figure 4. Physical parameters; fittings per length map.
Applsci 13 04692 g004
Figure 5. Physical parameters; friction factor map.
Applsci 13 04692 g005
Figure 6. Flow drops maps. (a) Highest flow drop; (b) lowest flow drop.
Applsci 13 04692 g006
Figure 7. Pressure drops maps. (a) Highest pressure drop; (b) lowest pressure drop.
Applsci 13 04692 g007
Figure 8. Chlorine drops maps. (a) Highest chlorine drop; (b) lowest chlorine drop.
Applsci 13 04692 g008
Figure 9. Vulnerability maps. (a) Highest drop values; (b) lowest drop values.
Applsci 13 04692 g009
Table 1. Pressure and flow drop calculation.
JanuaryPressure (bar)Inflow (m3)|Avg Pressure|
(bar)
|Avg Inflow|
(m3)
14.077400.5563.6
23.877600.3583.6
32.566600.9616.5
44.26800.683.6
53.967100.4433.6
63.767700.2393.6
747100.4833.6
83.436700.096.5
92.336001.1976.5
103.127900.4113.6
113.135800.496.5
123.237400.2963.6
132.845000.68176.5
141.996001.5376.5
153.657600.1383.6
163.816500.2926.5
173.856600.3316.5
183.727800.2103.6
192.616000.9176.5
203.977300.4553.6
213.977200.4543.6
223.936600.4116.5
233.786600.2616.5
243.636700.16.5
253.736000.2176.5
263.596800.073.6
273.696400.1736.5
283.827100.2933.6
293.916700.386.5
302.945600.58116.5
314.17100.5733.6
Averages3.52676.450.4654.4
Min= 0.073.55
Max 1.53176.5
Table 2. Drops in chlorine (CL) in ppm.
DMAArea NameAverage CLMax CLMin CL
1Rahmaniya 10.2580.2630.247
2Rahmaniya 30.2490.2600.246
3Ind. Area 40.2230.2550.153
4Barashi0.2560.2790.242
5Maysaloon0.2590.2960.226
6Al Faya0.2280.2280.227
7Al Guwair0.2830.3540.264
8Butina0.2790.3240.246
9Al Sabkha0.150.1760.079
10Al Ghafia0.1870.2270.150
11Al Nasserya0.2110.2550.162
12Al Qadisiya0.1720.1960.141
13Ind. Area 60.2380.3560.118
Table 3. Pipe length and junctions.
DMAArea NameLength (m)JunctionsL/Junction
1Rahmaniya 122,49224791.061
2Rahmaniya 323,50127784.842
3Ind. Area 430,70151859.268
4Barashi57,819515112.27
5Maysaloon13,65123358.586
6Al Faya16,80095176.84
7Al Guwair11,00241126.768
8Butina17,58564627.221
9Al Sabkha33,46739983.876
10Al Ghafia35,66799435.882
11Al Nasserya17,78627863.979
12Al Qadisiya25,04147652.607
13Ind. Area 629,72039874.674
Table 4. Number of fittings.
DMAArea NameLength (m)FittingCCFitting/L
1Rahmaniya 122,492381320.008
2Rahmaniya 323,501231510.007
3Ind. Area 430,701841300.007
4Barashi57,819721530.004
5Maysaloon13,65127360.005
6Al Faya16,8009300.002
7Al Guwair11,00256440.009
8Butina17,58586450.007
9Al Sabkha33,46720420.002
10Al Ghafia35,66746420.002
11Al Nasserya17,78629710.006
12Al Qadisiya25,04141290.003
13Ind. Area 629,720841200.007
Table 5. Parameters assigned weights.
ParametersWeight
Flow drops (Q in m3)0.25
Pressure drops (P in bar)0.25
Chlorine drops (Chl in ppm)0.20
No of fittings per length (FL)0.14
Length per junction (LJ in m)0.08
Friction factor (f)0.08
Table 6. Vulnerability maps color scheme.
Score12345
CategoryV. LowLowMedHighV. High
Color
Disclaimer/Publisher’s Note: The statements, opinions and data contained in all publications are solely those of the individual author(s) and contributor(s) and not of MDPI and/or the editor(s). MDPI and/or the editor(s) disclaim responsibility for any injury to people or property resulting from any ideas, methods, instructions or products referred to in the content.

