Article

Towards a Digital Twin Warehouse through the Optimization of Internal Transport

by
Joaquín S. Félix-Cigalat
1 and
Rosario Domingo
2,*
1
Engineering Service, Subdirectorate of Infrastructures of La Fe Hospital, Department of Health and Public Health of Valencia, 46026 Valencia, Spain
2
Department of Construction and Manufacturing Engineering, Universidad Nacional de Educación a Distancia (UNED), 28040 Madrid, Spain
*
Author to whom correspondence should be addressed.
Appl. Sci. 2023, 13(8), 4652; https://doi.org/10.3390/app13084652
Submission received: 1 February 2023 / Revised: 22 March 2023 / Accepted: 3 April 2023 / Published: 7 April 2023

Abstract

:

Featured Application

Digital twin applied to non-stacking warehouse management by a combination of RFID technology and spatial-operational multivariate simulation.

Abstract

Through the construction of parametric simulation models in which possible storage space distributions and positioning logics are also considered as variables, it is possible to build scenarios that allow analyzing the changing reality of storage needs in order to minimize material movements in each case, optimize internal transportation, and increase the efficiency of production processes. This article shows a particular analysis of a restricted storage space in height, typical to when it comes to logistics associated with raw material in a “big bag” format made of recycled and easily deteriorated material. In conjunction, a location management solution based on passive RFID (radio-frequency identification) tags has been chosen. The process is carried out through simulations with object-oriented discrete event software, where the optimization of the internal transport associated with the layout is carried out considering network theory to define the shortest path between warehouse nodes. The combination of both approaches allows, on the one hand, the evaluation of alternatives in terms of distribution and positioning logics, while the implemented system enables the possibility of making agile changes in the physical configuration of this type of storage space.

1. Introduction

Digital twins are an innovative solution that, with low investment, allows determining the behavior of a product, equipment, or facility in a realistic environment. Their transversality means that they can be used in numerous applications, in particular, in the Industry 4.0 context [1]. Studies focused on production environments point out how these tools could be implemented on cyber-physical systems, as clearly identified by Cimino et al. [2] in their literature review or in plants with a demand for a high variety of products [3]; in production lines, efficiency and manufacturing improvements are achieved after the construction and analysis of digital twins [4].
Storage, as one of the production support systems, received special attention because of its high asset investment [5]. A current trend is to provide companies with structured warehousing solutions, in which the layout of the locations will remain constant throughout the life cycle of the warehouse. This approach is also transferred to the choice of one or more positioning logics that optimize internal transport based on fixed working conditions, obtained, at the best of times, by historical analysis of storage needs and different approaches as to improve the space through warehouse management [6]; to determine the best alternative for warehouse storage location assignment through a multi-criteria evaluation [7]; to define a systematic methodology of storage selecting assignments and a picking order system [8]; to analyze order picking strategies finding their relationship with productivity [9]; and to analyze the alternatives of storage location assignment through a Pareto-optimal method considering the efficiency of a warehouse, the required space, and the picking order distance [10]. All these approaches provide solutions to particular problems. However, these static methods and their solutions applied to storage problems restrict the ability to adapt to environments where conditions are or may be changing. Sadowski et al. [11] have already expressed the need to provide warehouses with flexibility as a way to face environmental changes.
There is currently a growing demand for recycled and by-products, among other reasons, due to a higher concern for environmental issues [12]. These types of resources, and also the raw materials produced by other production methods, are and probably will be increasingly scarce. The difficulties in terms of regularity of supply and the homogeneity of the formats in which this material is supplied make it necessary for certain types of companies to propose storage and logistics solutions that are adaptable to these new conditions. All this is accentuated when the stored material deteriorates easily, which requires particular inventory management [13] and a definition of the strategy during storage [14], including when these materials are used as packaging. Unlike raw materials, recycled materials are not always presented in a stackable or even homogeneous form.
The use of digital twins as a management tool, both when assessing the operational variables of the process or redefining strategies according to the evolution of reality, makes it necessary to use increasingly complex simulation models, which consider not only variations in the operating conditions of the scenarios but also the possibility of physical redistribution of the locations and/or their storage logics.
In the business world, especially within small and medium-sized companies, this ability to adapt to the environment will be essential for their survival, with alternatives in logistics such as green packaging [15] or internal transport and warehouse management with RFID (Radio Frequency Identification) tags and optimization of picking activities [16]. The choice of technologies associated with Industry 4.0, combined with other types of established and affordable technologies, form the proposed path to cover the storage needs of a small polyethylene wax production company that uses low molecular weight polyethylene that has been obtained as a by-product of ethylene manufacturing.
The academic literature associated with block stacking in warehouses is mainly focused on the design of optimal layouts and generally takes into consideration shared storage policies, avoiding the relocation of pallets [17] either due to a drive-in-pallet racking type storage system [18] or due to other planning-dependent factors [19]. This type of analysis is associated with storage spaces in which pallets located in the same lane belong to the same typology. Under these premises, it is possible to determine the number of aisles that maximize space utilization while minimizing handling costs [20]. These particular cases can be seen in Derhami et al. [21] or Öztürkoğlu and Hoser [22]. Some later approaches have considered that the inflow of products does not follow a perfect staggering, finding a reduction in waiting times and space costs [23].
The use of block stacking, and therefore the required pallet relocations needed for picking, has not been deeply studied in warehouses handling pallets that have unique characteristics. For certain types of “stock keeping units” (SKUs), as in this case, it is one of the few existing storage options. It requires low investment and, above all, allows a high degree of layout flexibility and correct and reliable localization inside warehouses, for example, using RFID-equipped forklifts capable of recognizing loaded pallets and self-locating [24] or advanced methods of monitoring forklifts [25]. In this sense, internal transport becomes a possibility to improve warehouse management.
The real possibilities of implementing machine learning in industries that use recycled raw materials, in which each of the SKUs involved is unique, forces the study of the behavior of this type of warehouse under another perspective and individualized management. In this context, mature technologies such as RFID, capable of facilitating logistics time savings, can still extend their capabilities and be useful in big data environments [26], among other reasons, because the capabilities of the tags associated with them are also expanding [27] and the signal acquisition systems skills [28]. This option is compatible with the technological advances in indoor assets location [29] and allows the initiation of practical steps towards a digital warehouse in an immediate operation way.
Simulations aimed at aspects such as product flow [30], the efficiency of robotized operations [31], the efficiency of flexible manufacturing systems [32], or sustainability [33] have already shown their results and can be transferred to the industry later. Moreover, a system or platform that allows extension and personalization of the behavior of objects would allow the creation of a data library with possibilities of previous analysis in less time [34]. These aspects are important because the tools developed in different modeling elements are separated from each other and without connection between them [35], and this could hinder decision-making at all levels of the company [36]. For these reasons, software that facilitates its use on several platforms facilitates its subsequent integration with the physical system. A mathematical support for simulations can be the network flow that allows defining nodes and arcs and finding optimal flows of products and vehicles, among others [37]. This versatile method has been used in warehouse design considering the routing of order pickers and certain peculiarities in the storage facility or product; for example, it is used to find the shortest order picking tour in a warehouse with a middle aisle [38].
As is seen, the digital twins are a tool that still has a wide study scope and where an appropriate simulation offers possibilities of linking a virtual system with a physical one. On the other hand, warehouses still have options for improvement in their management due to new products and new existing technologies.
In this research, simulation, as a previous step in the implementation of digital twins, can be considered one of the most promising tools for process improvement. The proposed analysis shows how it is possible to jointly treat the spatial parameters (layouts) and operational parameters to adapt a floor stocking type storage space to the opportunities offered by Industry 4.0. The main objective is to find a system that contains the warehouse layout based on the optimization of internal transport routes using a network of nodes and arcs as a first step toward a digital twin.
The remainder of the paper is organized as follows: Section 2 explains the methodology used, including warehouse features, logics implemented, the definition of nodes and paths, RFID used, relocation criteria, and simulation model. Section 3 shows the results obtained and their analysis. Finally, the conclusions are provided in Section 4.

2. Materials and Methods

The analysis has been developed within the action research approach established by Lewin [39], where the researcher is present and participates in the company and implementation of process modifications and improvements [40]. A combination of RFID technology and spatial-operational multivariate simulation applied to a non-stacking warehouse is used as methodology; both are part of intelligent production management based on digital twins [41]. The SKU is a big bag made of natural fiber containing recycled material used to manufacture polyethylene waxes based on low molecular weight polyethylene obtained from ethylene production. SKUs are changed every year due to their easy deterioration. The warehouse consists of a single open-plant, rectangular warehouse measuring 60 × 40 m and with a useful height of 3.5 m. It has two entrances that communicate with the raw material unloading area and the manufacturing area, respectively.
The simulation model used was built with FlexSim software [42,43], version 21.1.4. This simulation tool allows the study of complex situations, and it is software with object-oriented discrete events. The modules used were Engine, Content, Astar, AGV, Conveyor, Process Flow, Emulation, and People. C++ codes were used to define simulations; with the aim of enabling their use in possible real-time data communications in the future. This software allows the creation of a system capable of studying operations in different fields by simulations and reflecting actual situations [44]. Additionally, it is capable of extending and customizing the behavior of objects; thus, it has been used in many fields, including warehouse management, showing its reliability.

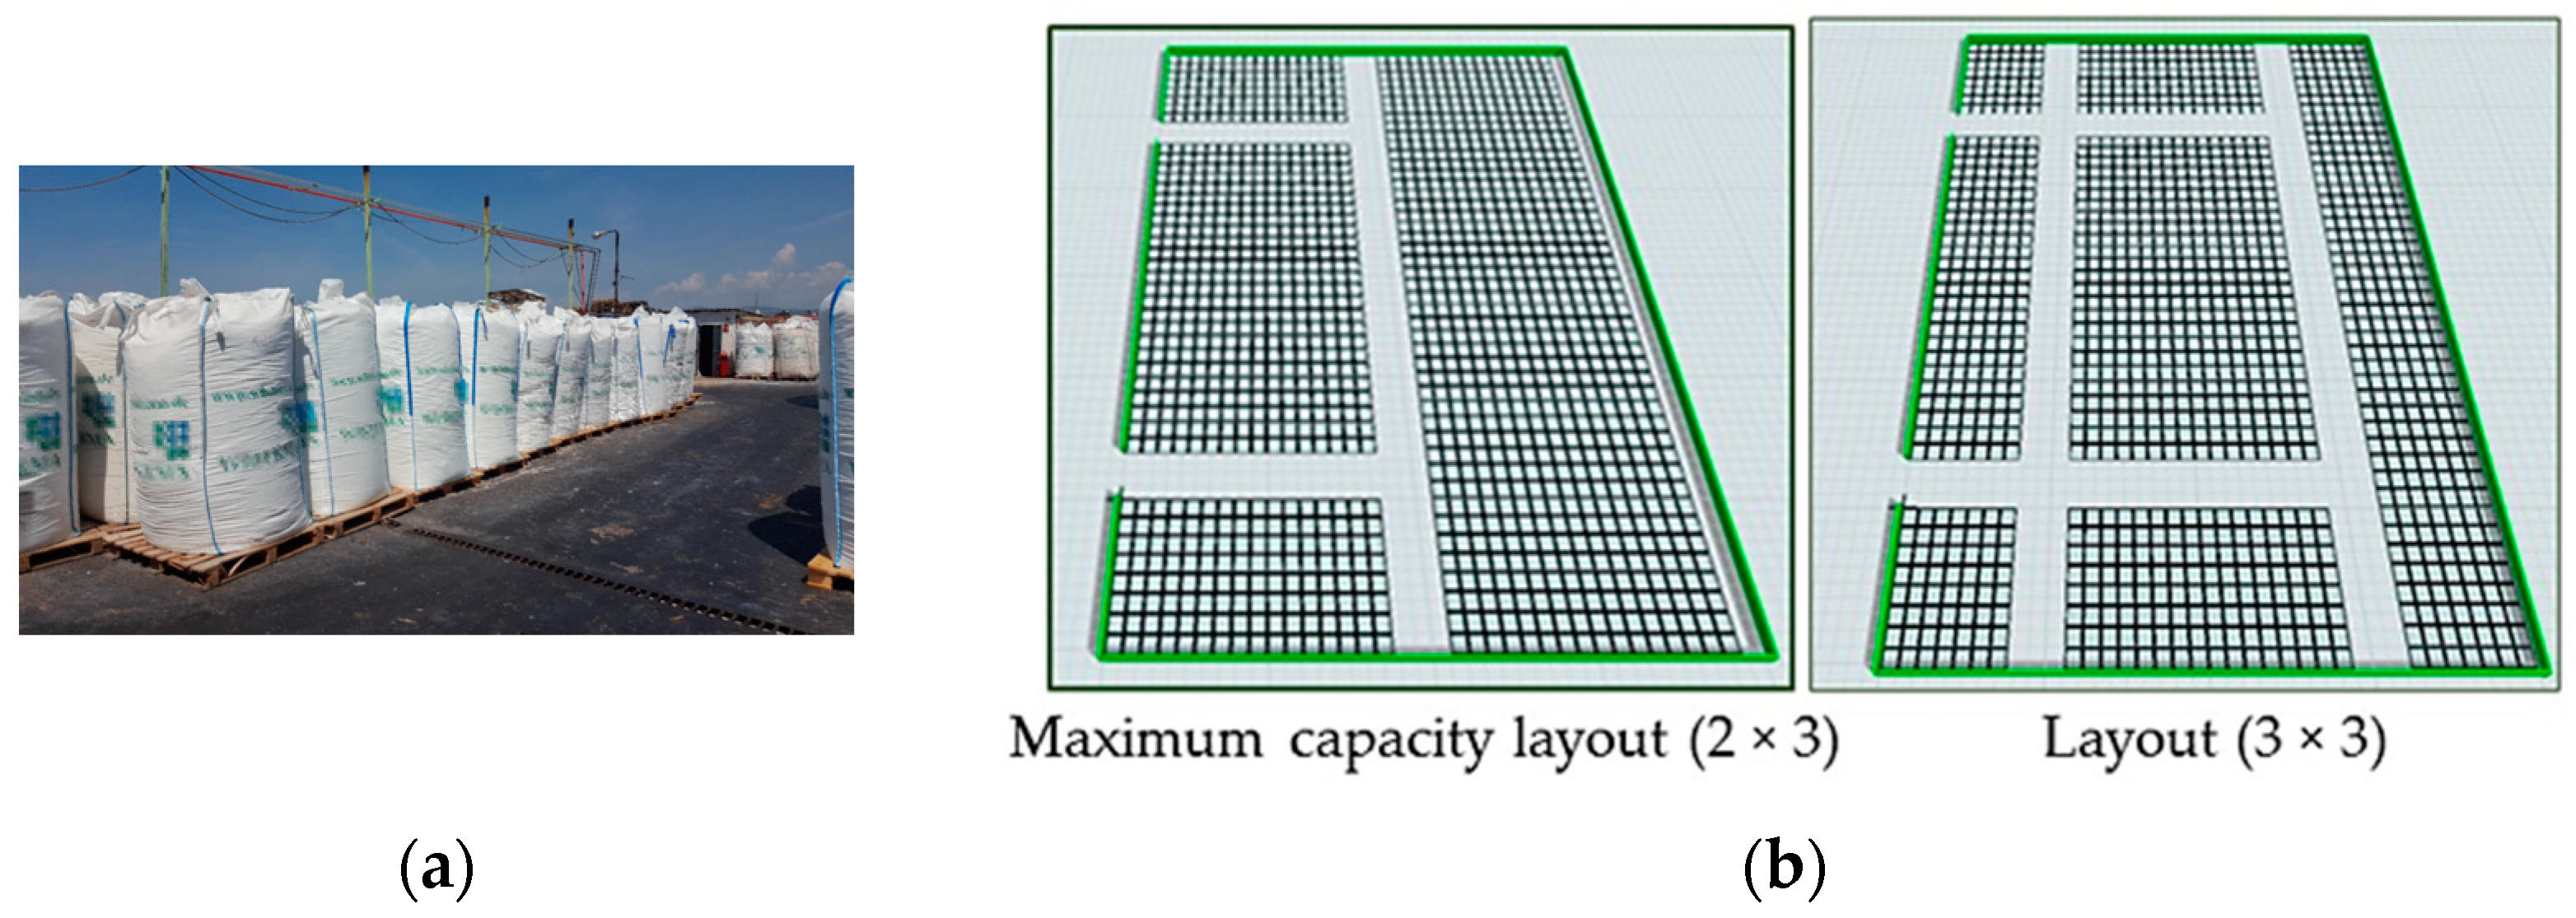
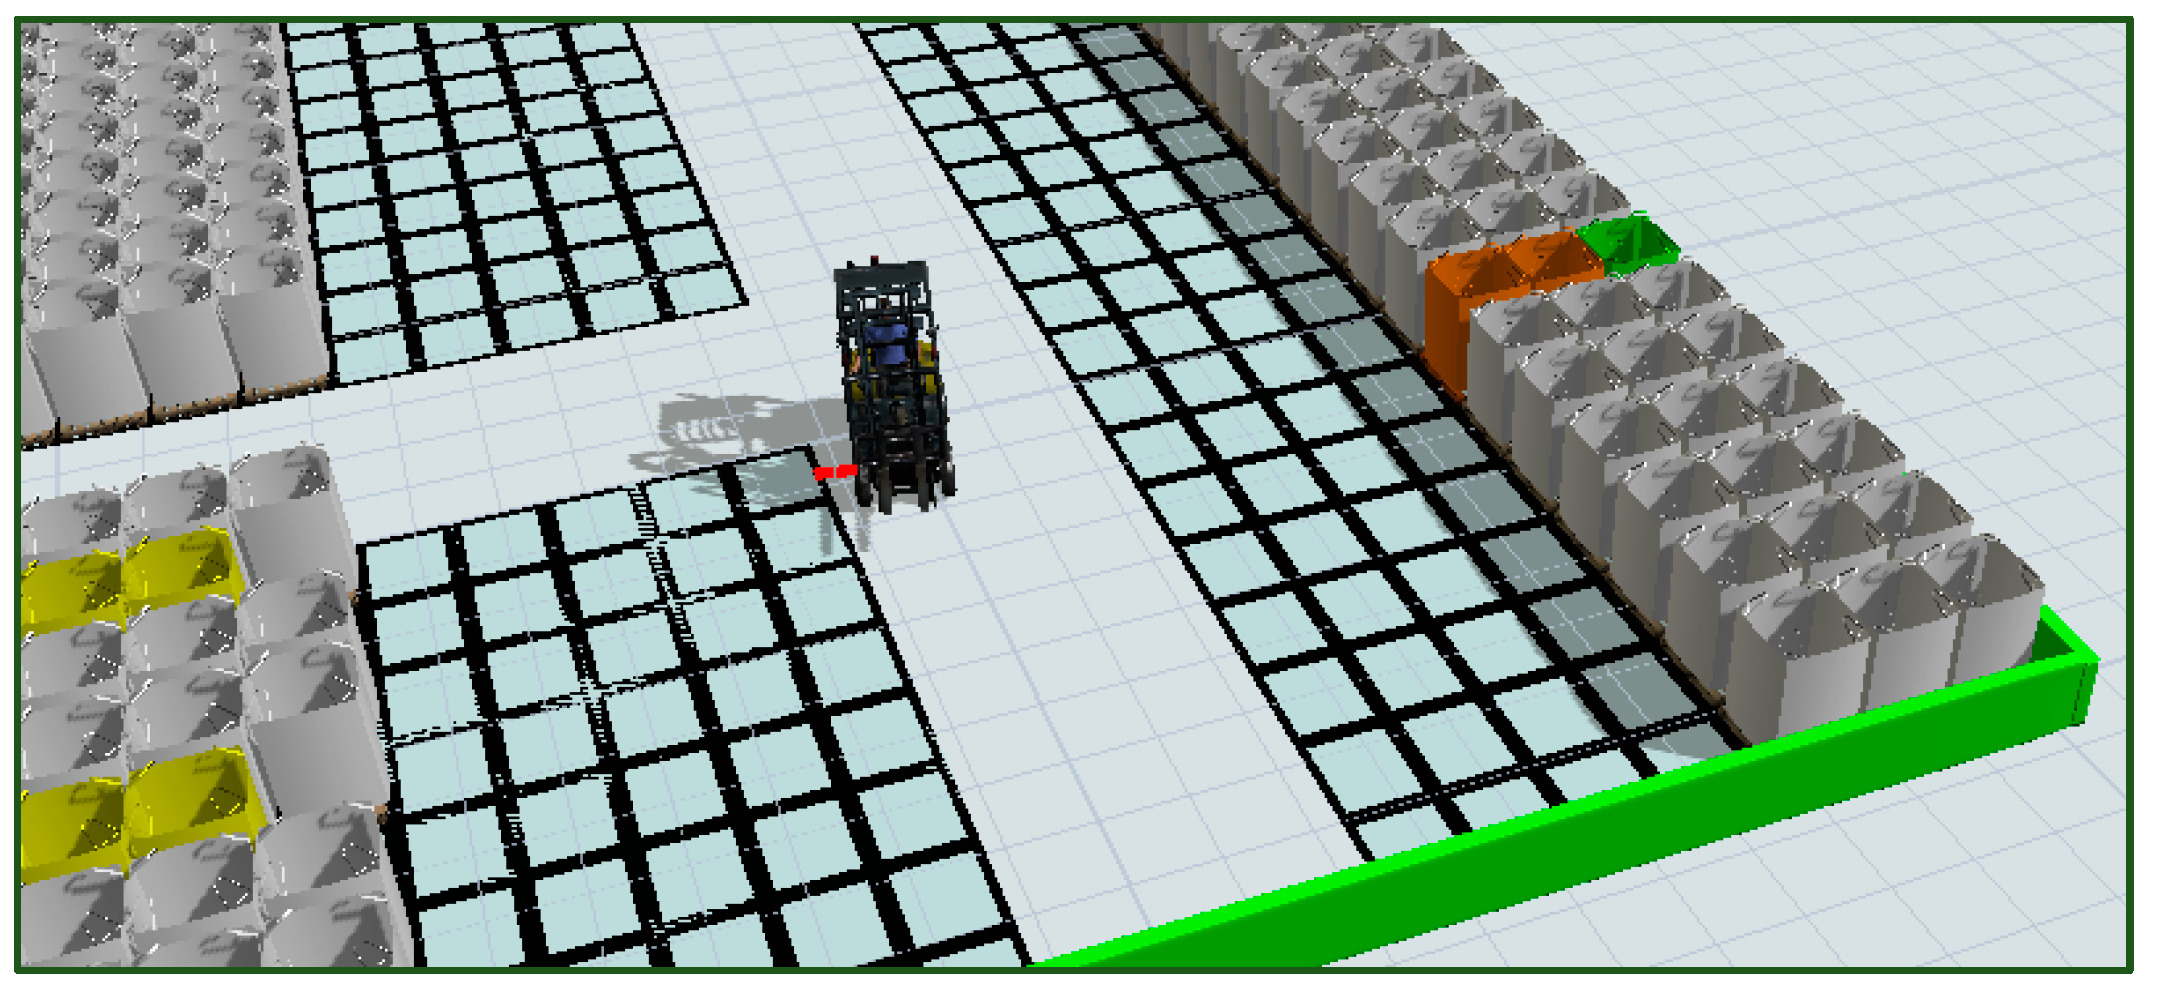
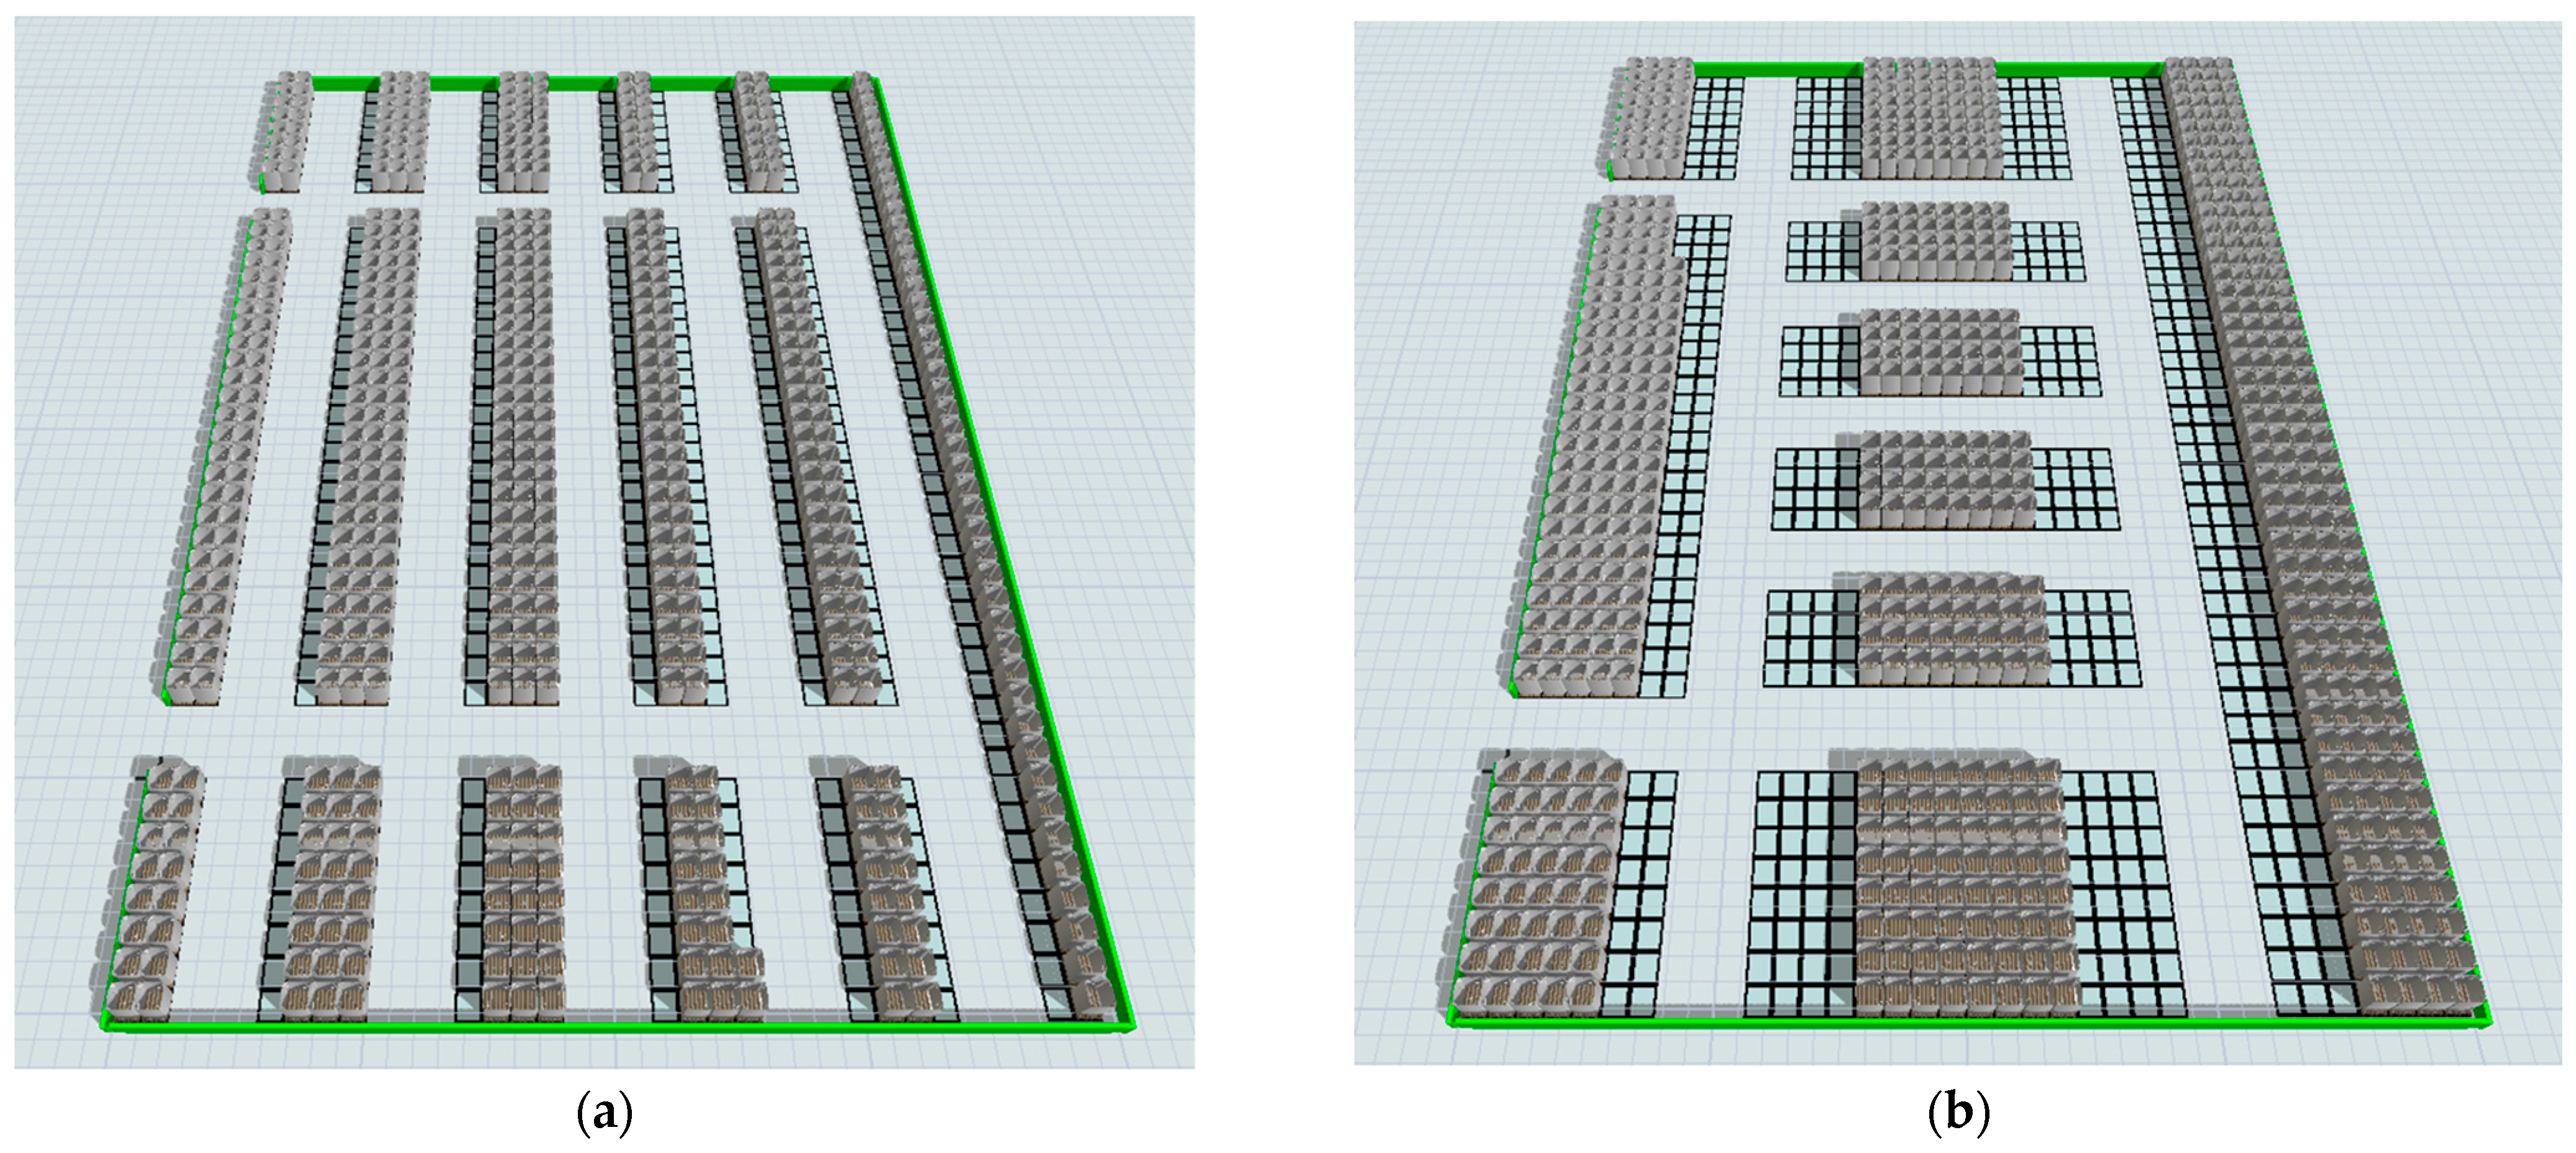
2.1. Warehouse Features

The additional conditions for the construction of the model were the physical dimensions of the raw material bag–pallet assembly. An ISO 2 pallet of 1200 × 1000 mm, standardized in ISO 6780 [45] and a height of 1.9 m (sum of the height of the pallet and the bags). The average occupancy space, allowing safe handling of the bags, is established with a margin of +100 mm in width and +100 mm in depth.
On the other hand, the bags received do not reach 900 kg in any case, so the width of the aisles required is based on the choice of a conventional forklift truck of restrained dimensions and suitable for handling the indicated load with a reduced turning radius. The technical characteristics of the chosen forklift truck require a minimum aisle width of 3327 mm. The aisle width considered in this study is set at 3500 mm, which slightly increases the maneuvering capacity (see Figure 1a).
Therefore, the space of each of the plant locations will be defined as a rectangular area of 1300 × 1100 mm, with an aisle width of 3.5 m (necessary for the transport of raw materials). Figure 1b shows the warehouse layout with the highest storage capacity. The two transverse aisles (accesses and connections) are necessary to access the longitudinal aisles (in the case of maximum capacity, a single aisle), which allow the loading and unloading of pallets. In this maximum capacity situation, the warehouse can hold 1392 bags, with the number of bags capacity decreasing depending on the chosen layout. For a layout with 2 central aisles (Figure 1b), the storage capacity is reduced to 1265 storage bins.
The different warehouse layouts used will be associated with a nomenclature that refers to the number of zones provided across the width (transverse) and lengthwise. Figure 1b corresponds to a 2 × 3 layout, and Figure 2 corresponds to a 3 × 3 layout.
The different distributions are parameterized according to the following criteria and restrictions:
  • Number of zones across [2, 3, 4, 5, 6];
  • Number of zones lengthwise [3, 4, 5, 6];
  • Width zones shall be evenly distributed. Since the central zones have two access corridors, these will have the number of locations per column that would correspond to two zones since, in practice, they are considered two adjoining zones, each of which is accessed only from one corridor;
  • The zones adjacent to the longitudinal walls of the warehouse do not need to be crossed by transversal aisles since they do not serve as communication with any longitudinal aisle;
  • A variable associated with the storage logic has additionally been defined.

2.2. Logics Implemented

Different logics can be implemented in the model, considering, for the analysis, the two most representative ones. The first of these, which is called “row storage-S1”, logic S1 (see Figure 2a), tries to fill the different zones in such a way that the number of locations occupied in each of their rows is as small as possible. This logic achieves a uniform distribution of the material in rows. Under normal operating conditions, following this type of logic requires that the forklift operator should be provided with precise information about where to place a bag since the field of vision will normally be restricted in configurations with more than one longitudinal aisle by the bags that already have been stored.
The second logic used, logic S2 (see Figure 2b), is based on filling complete zones so that each of the columns enabled in that zone is completed before continuing with the adjacent one. This storage system does not necessarily require one to indicate to the operator the location in which to place a bag coming from the raw material unloading zone since there is better visual control of the filled/unfilled zones.
The operating conditions of the forklift are set for the analysis at the following values:
  • Lifting/lowering speed of blades: 0.1 m/s;
  • Maximum speed on travel paths: 2.00 m/s;
  • Maximum speed in loading/unloading travel: 1.00 m/s;
  • Acceleration: 1.00 m/s2.
The operating conditions, the dimensions of the warehouse, the space occupied by the sack–pallet assembly, and the width of the aisles have not been the subject of analysis in this study, focusing on identifying which storage logic and which warehouse configuration may be the most appropriate depending on the storage needs.
The model allows, as is obvious, the alteration of those conditions that remain constant while providing information on occupancy times and, fundamentally, on the number of relocations produced in the process of extracting batches of bags for their subsequent use in the production process.
The unloading of raw material is integrated into the simulation based on the schedule agreed with the supplier, with delivery batches of 15–20 bags per truck.

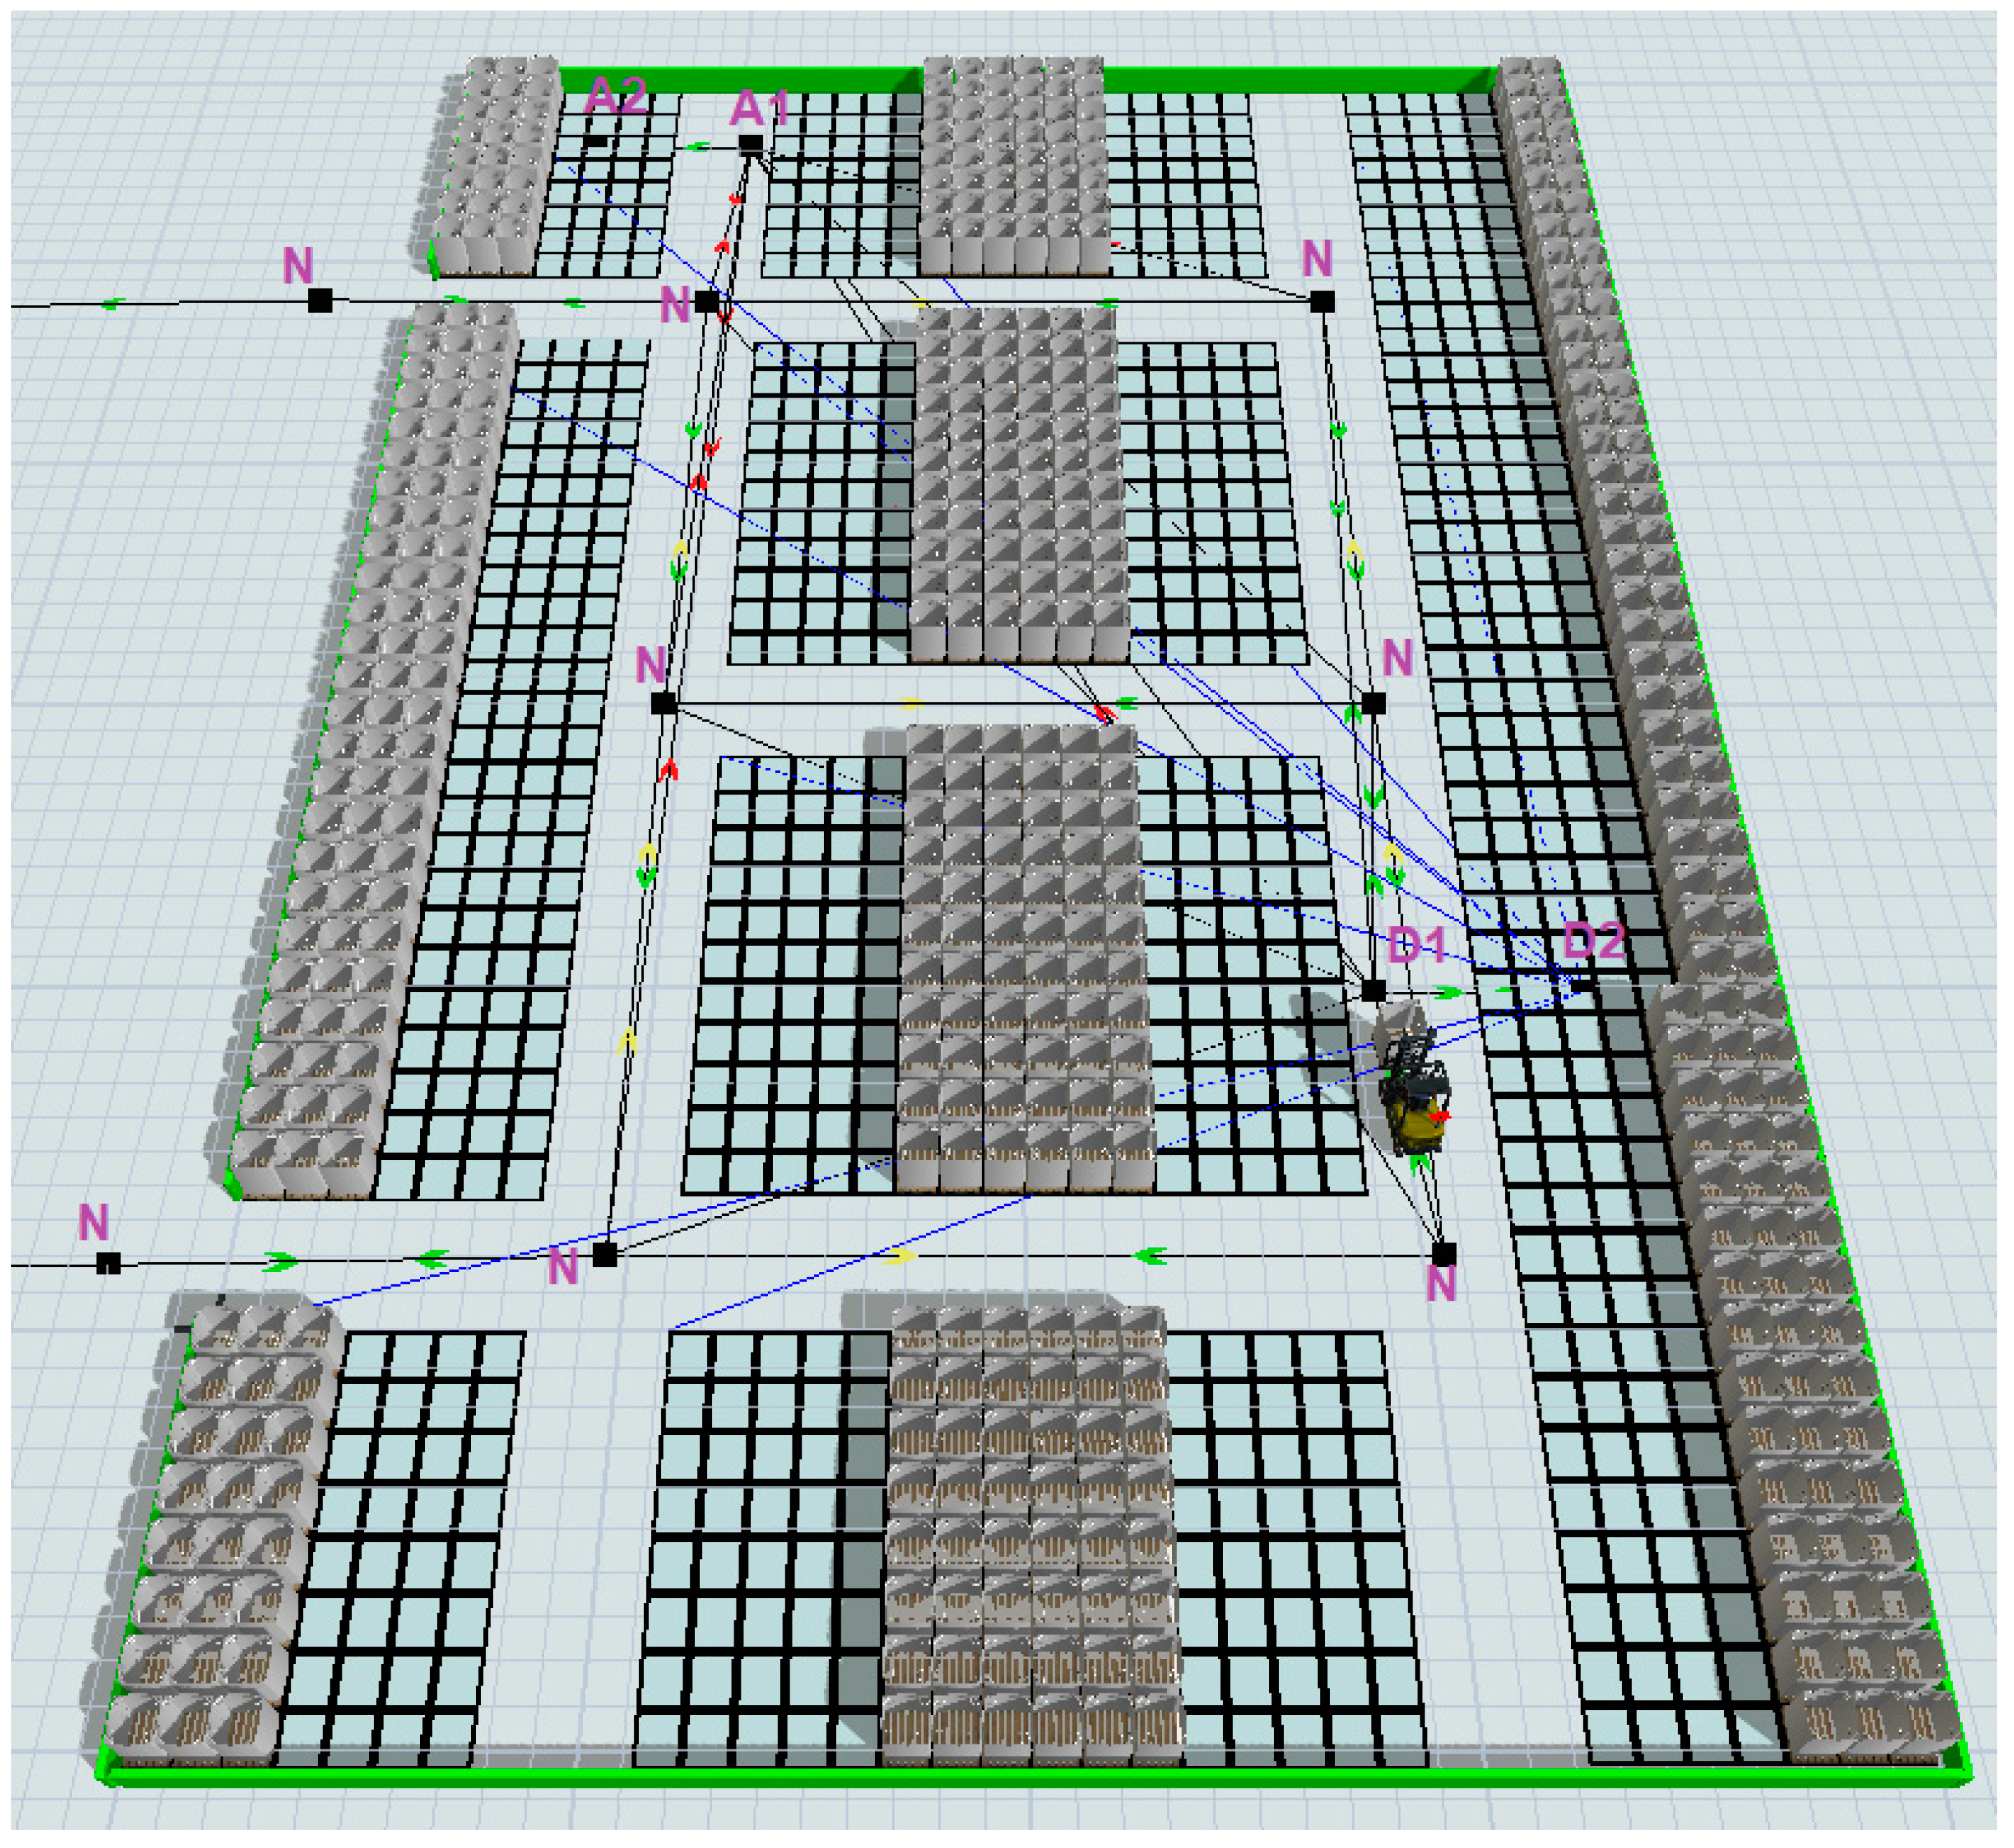
2.3. Definition of Nodes and Paths
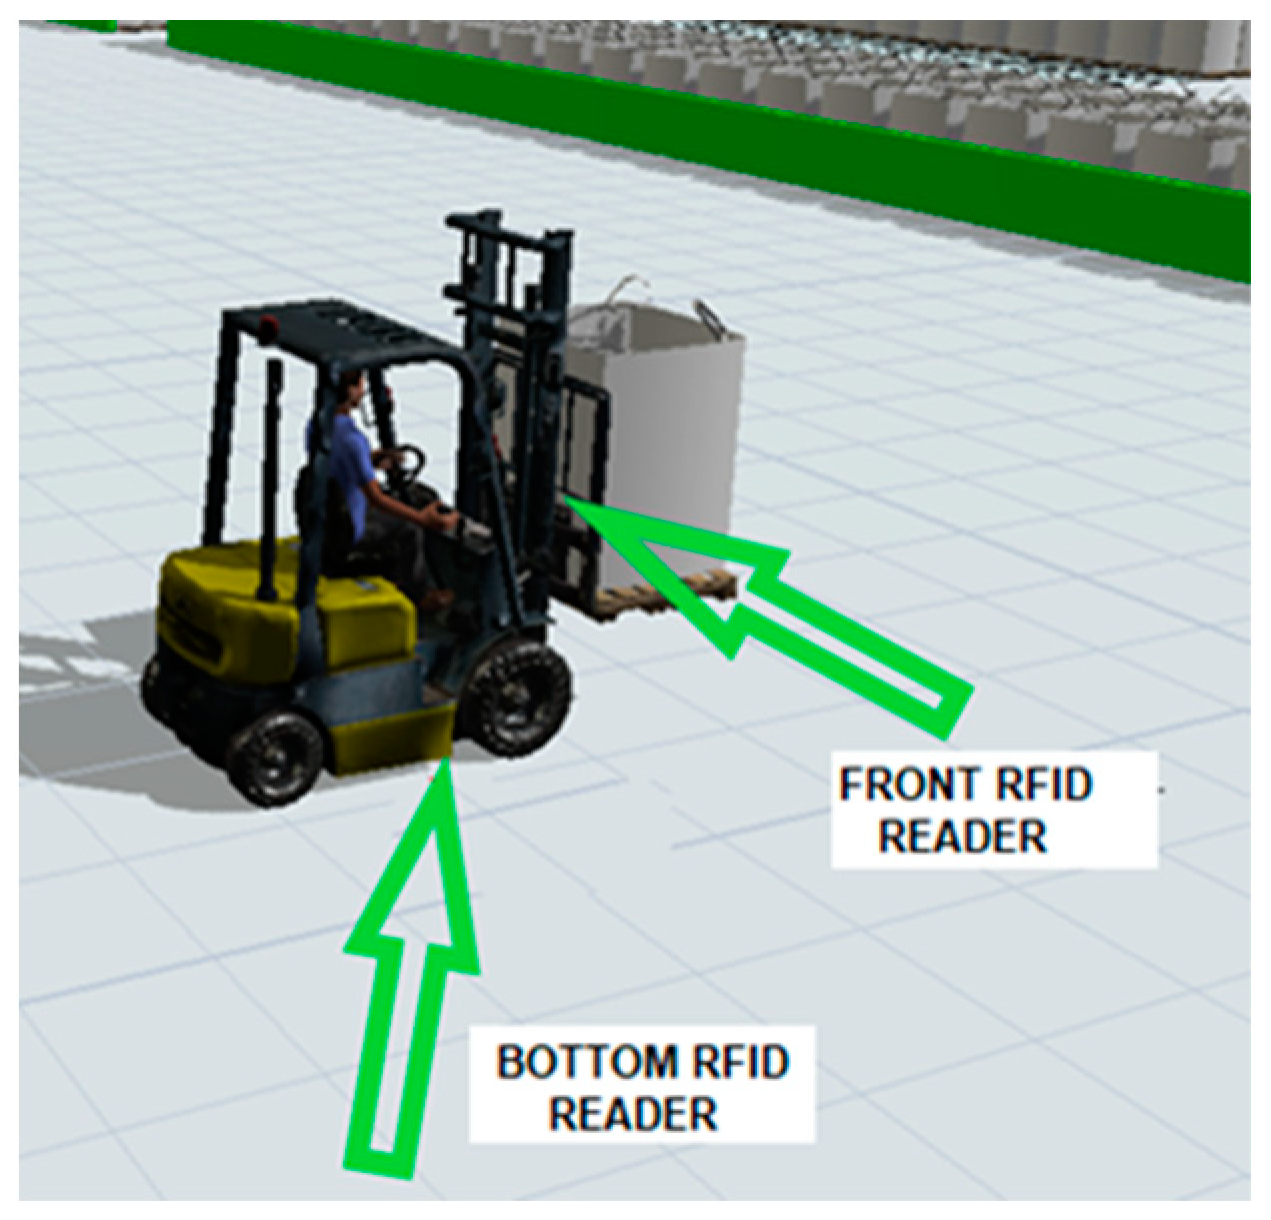
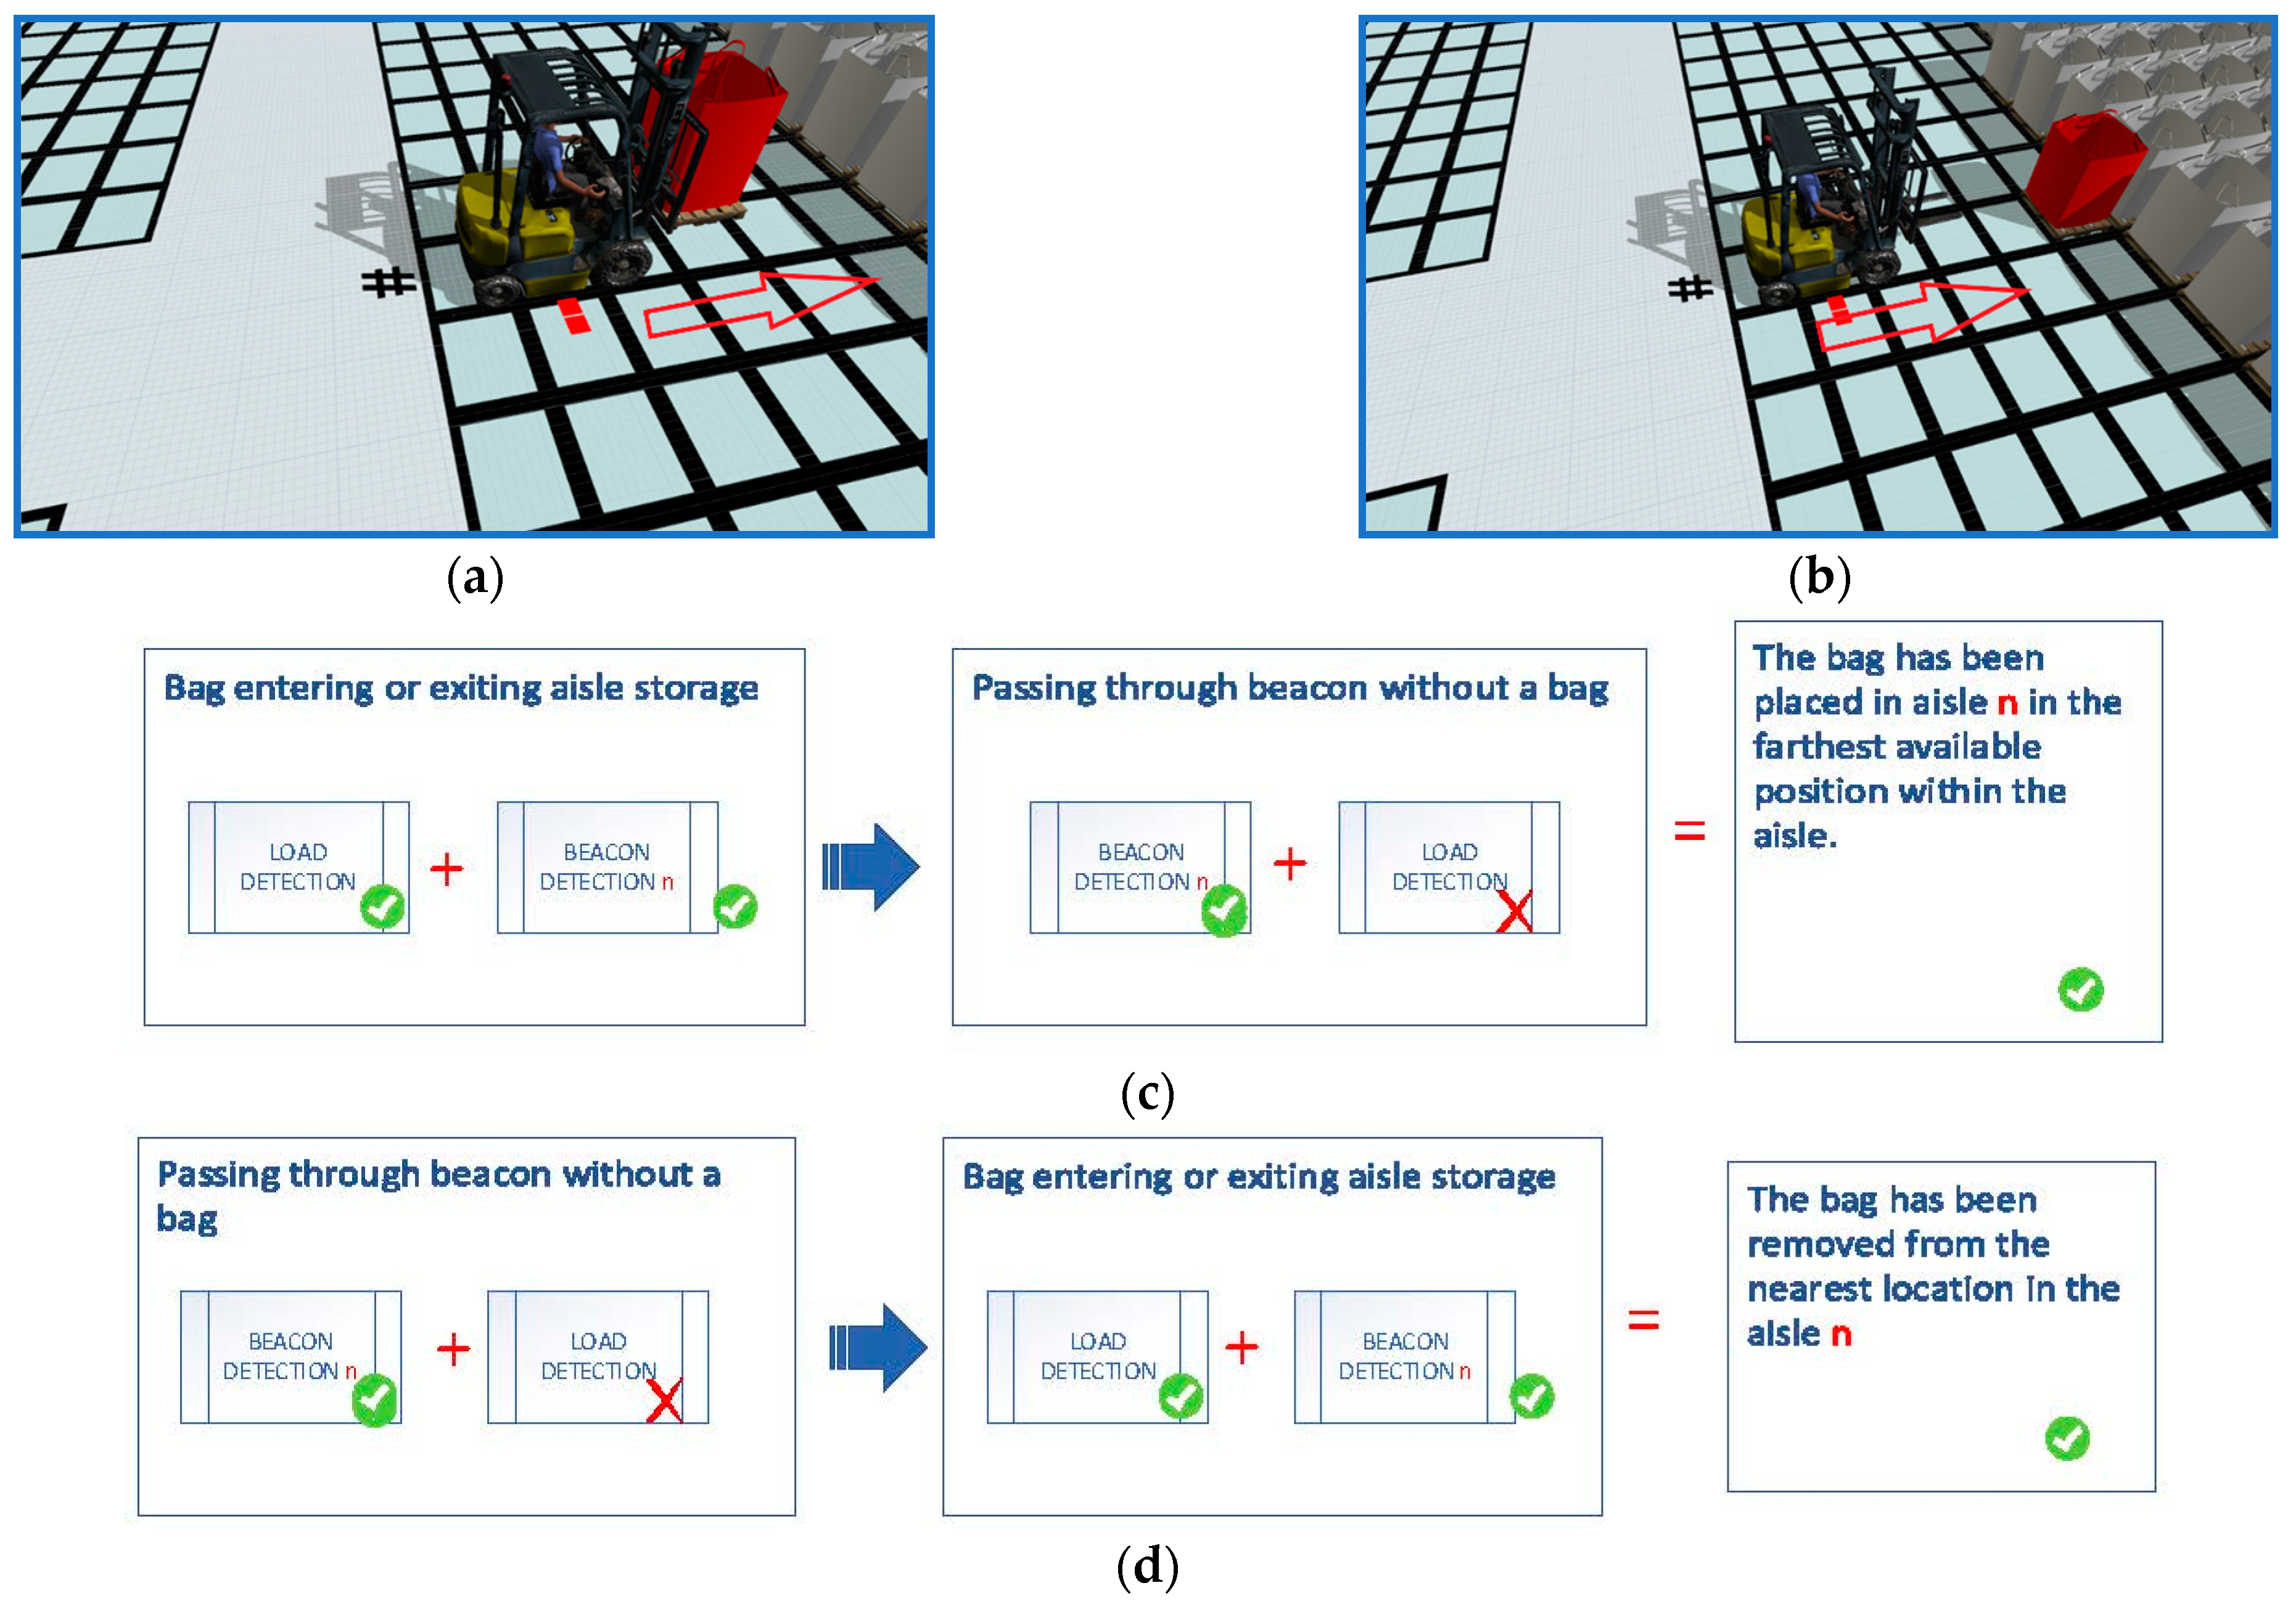
The “N” nodes (see Figure 3) are dynamically defined (depending on the chosen warehouse layout) at the aisle intersections. To model a behavior close to reality, the trajectories that the forklift will follow when attacking a column are complemented by two additional nodes. The first (D1 or A1) is located in front of the column in the furthest position, and the second (D2 or A2) is the end point where the forklift is positioned for loading or unloading. Note that D1–is considered in loads/unloads in right-hand positions and A1–A2 in loads/unloads in left-hand positions.
The paths that interconnect the nodes, as well as their restrictions and circulation directions, are dynamically modified in each warehouse layout, as well as according to the optimal path calculated.
The maximum speed on the loading/unloading paths, i.e., between nodes D1 and D2 (or between A1 and A2), is limited to the value set for this variable at the beginning of the simulation.

2.4. RFID Used

Each of the bags has been characterized and identified individually by means of a passive RFID tag during the unloading process (prior to the storage process). This type of tag allows the reflection and modulation of a carrier signal [46].
The system used for the management of the storage bins is configured as a beacon system. The beacons are passive RFID tags located in the aisles in front of each of the storage bin columns. The “beacon” tags are installed in floor cavities and protected with epoxy resin to prevent deterioration and to form a completely flat surface that does not hinder transit. The forklift incorporates two short-range RFID readers (Figure 4). One of them is located at the bottom of the forklift, which will detect the beacons, and the other at the front, which will detect whether the forklift is loaded or not, as well as which particular bag is being moved.
This low-cost system, through the sequencing (Figure 5) of the readings of both RFID readers, makes it possible to know the position of each of the bags in the warehouse at any given moment, making it relatively easy to readapt the beacon system to a new warehouse layout.
The particular process under analysis requires processing a quantity of raw material that generally involves about 10 bags (previously selected). Each combination of bags will determine manufacturing times, quantities of additives, and energy inputs. The choice of a given combination is made on the basis of criteria of optimization of the available resources. The way to transfer this choice to the simulation model is by means of a random process in which 10 bags are selected randomly.
The location of these bags may correspond to interior positions (Figure 6) within each of the storage zones.

2.5. Relocation Criteria

In the case that the selected bag is located in a position that is not directly accessible, the bags located in previous positions must be removed and relocated according to the storage logic that was initially defined.
The number of relocations required for the execution of an overall production plan determines the suitability of the chosen system. A higher number of relocations associated with the same global production plan requires more transport and handling time; it should be understood as the number of relocations to be carried out over an extended period. In this particular case, the possible damage caused to the bags by excessive handling must also be taken into account. The number of relocations (Figure 7) can be considered the key indicator when comparatively analyzing different scenarios.
The storage logic is studied for each layout and its different degrees of occupancy. Once the most favorable storage logic has been determined, it is fixed, and the different physical layouts that the warehouse can take will be comparatively analyzed.
As each arrangement allows a different storage capacity, the criteria for the comparative analysis must be based on the same SKU and referenced to the equivalent occupancy rate in a 3 × 3 layout. Thus, for example, a 3 × 3 layout (capacity of 1266 locations) with an occupancy rate of 50% (633 occupied locations) would be equivalent to a 3 × 6 layout with an occupancy rate of 65%. Thus, the scenarios compared will be those having the same initial occupancy.

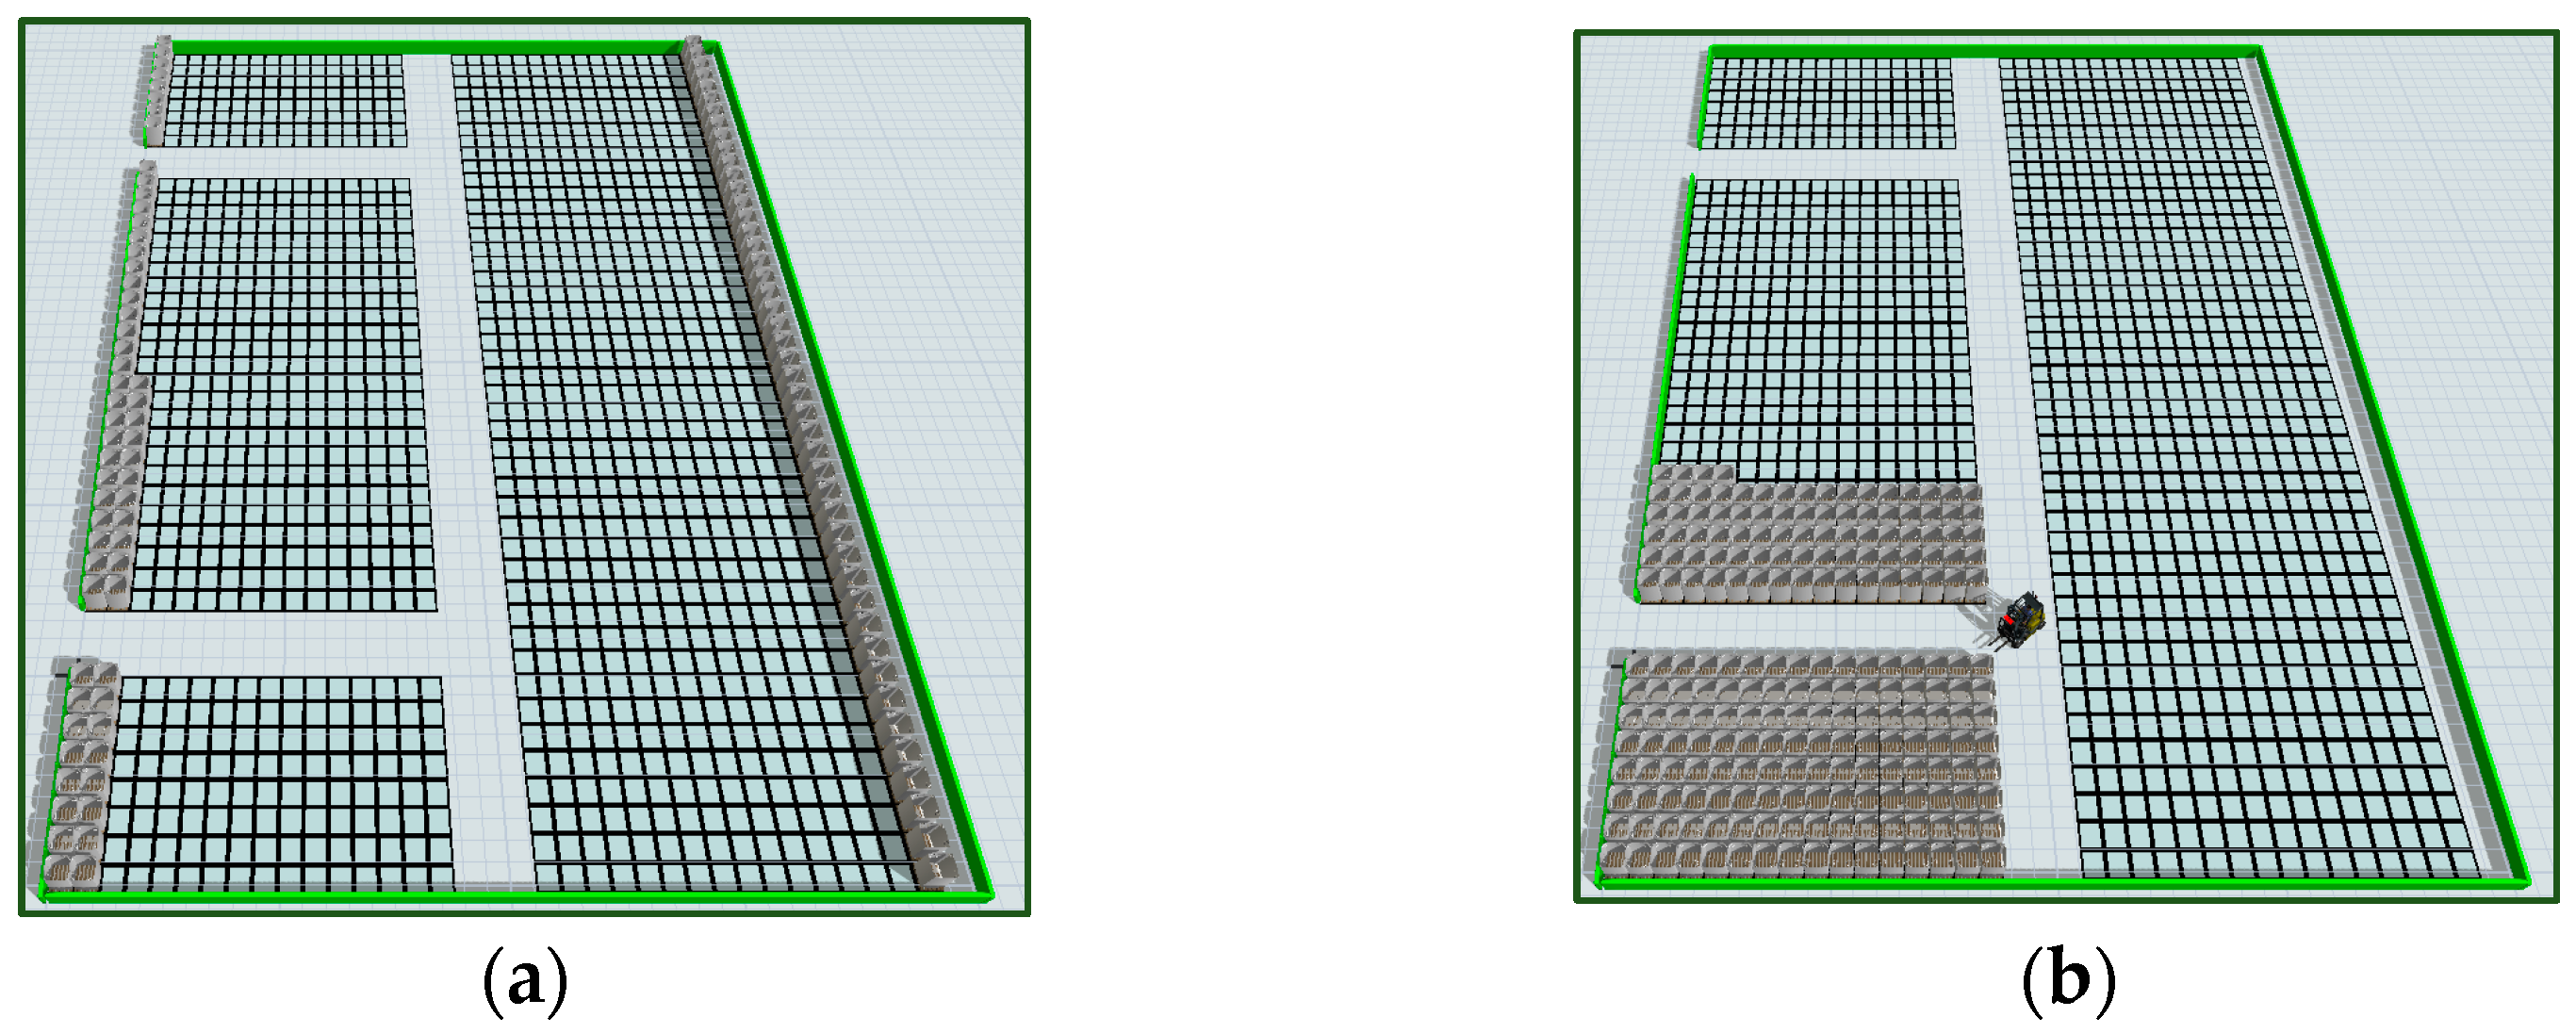
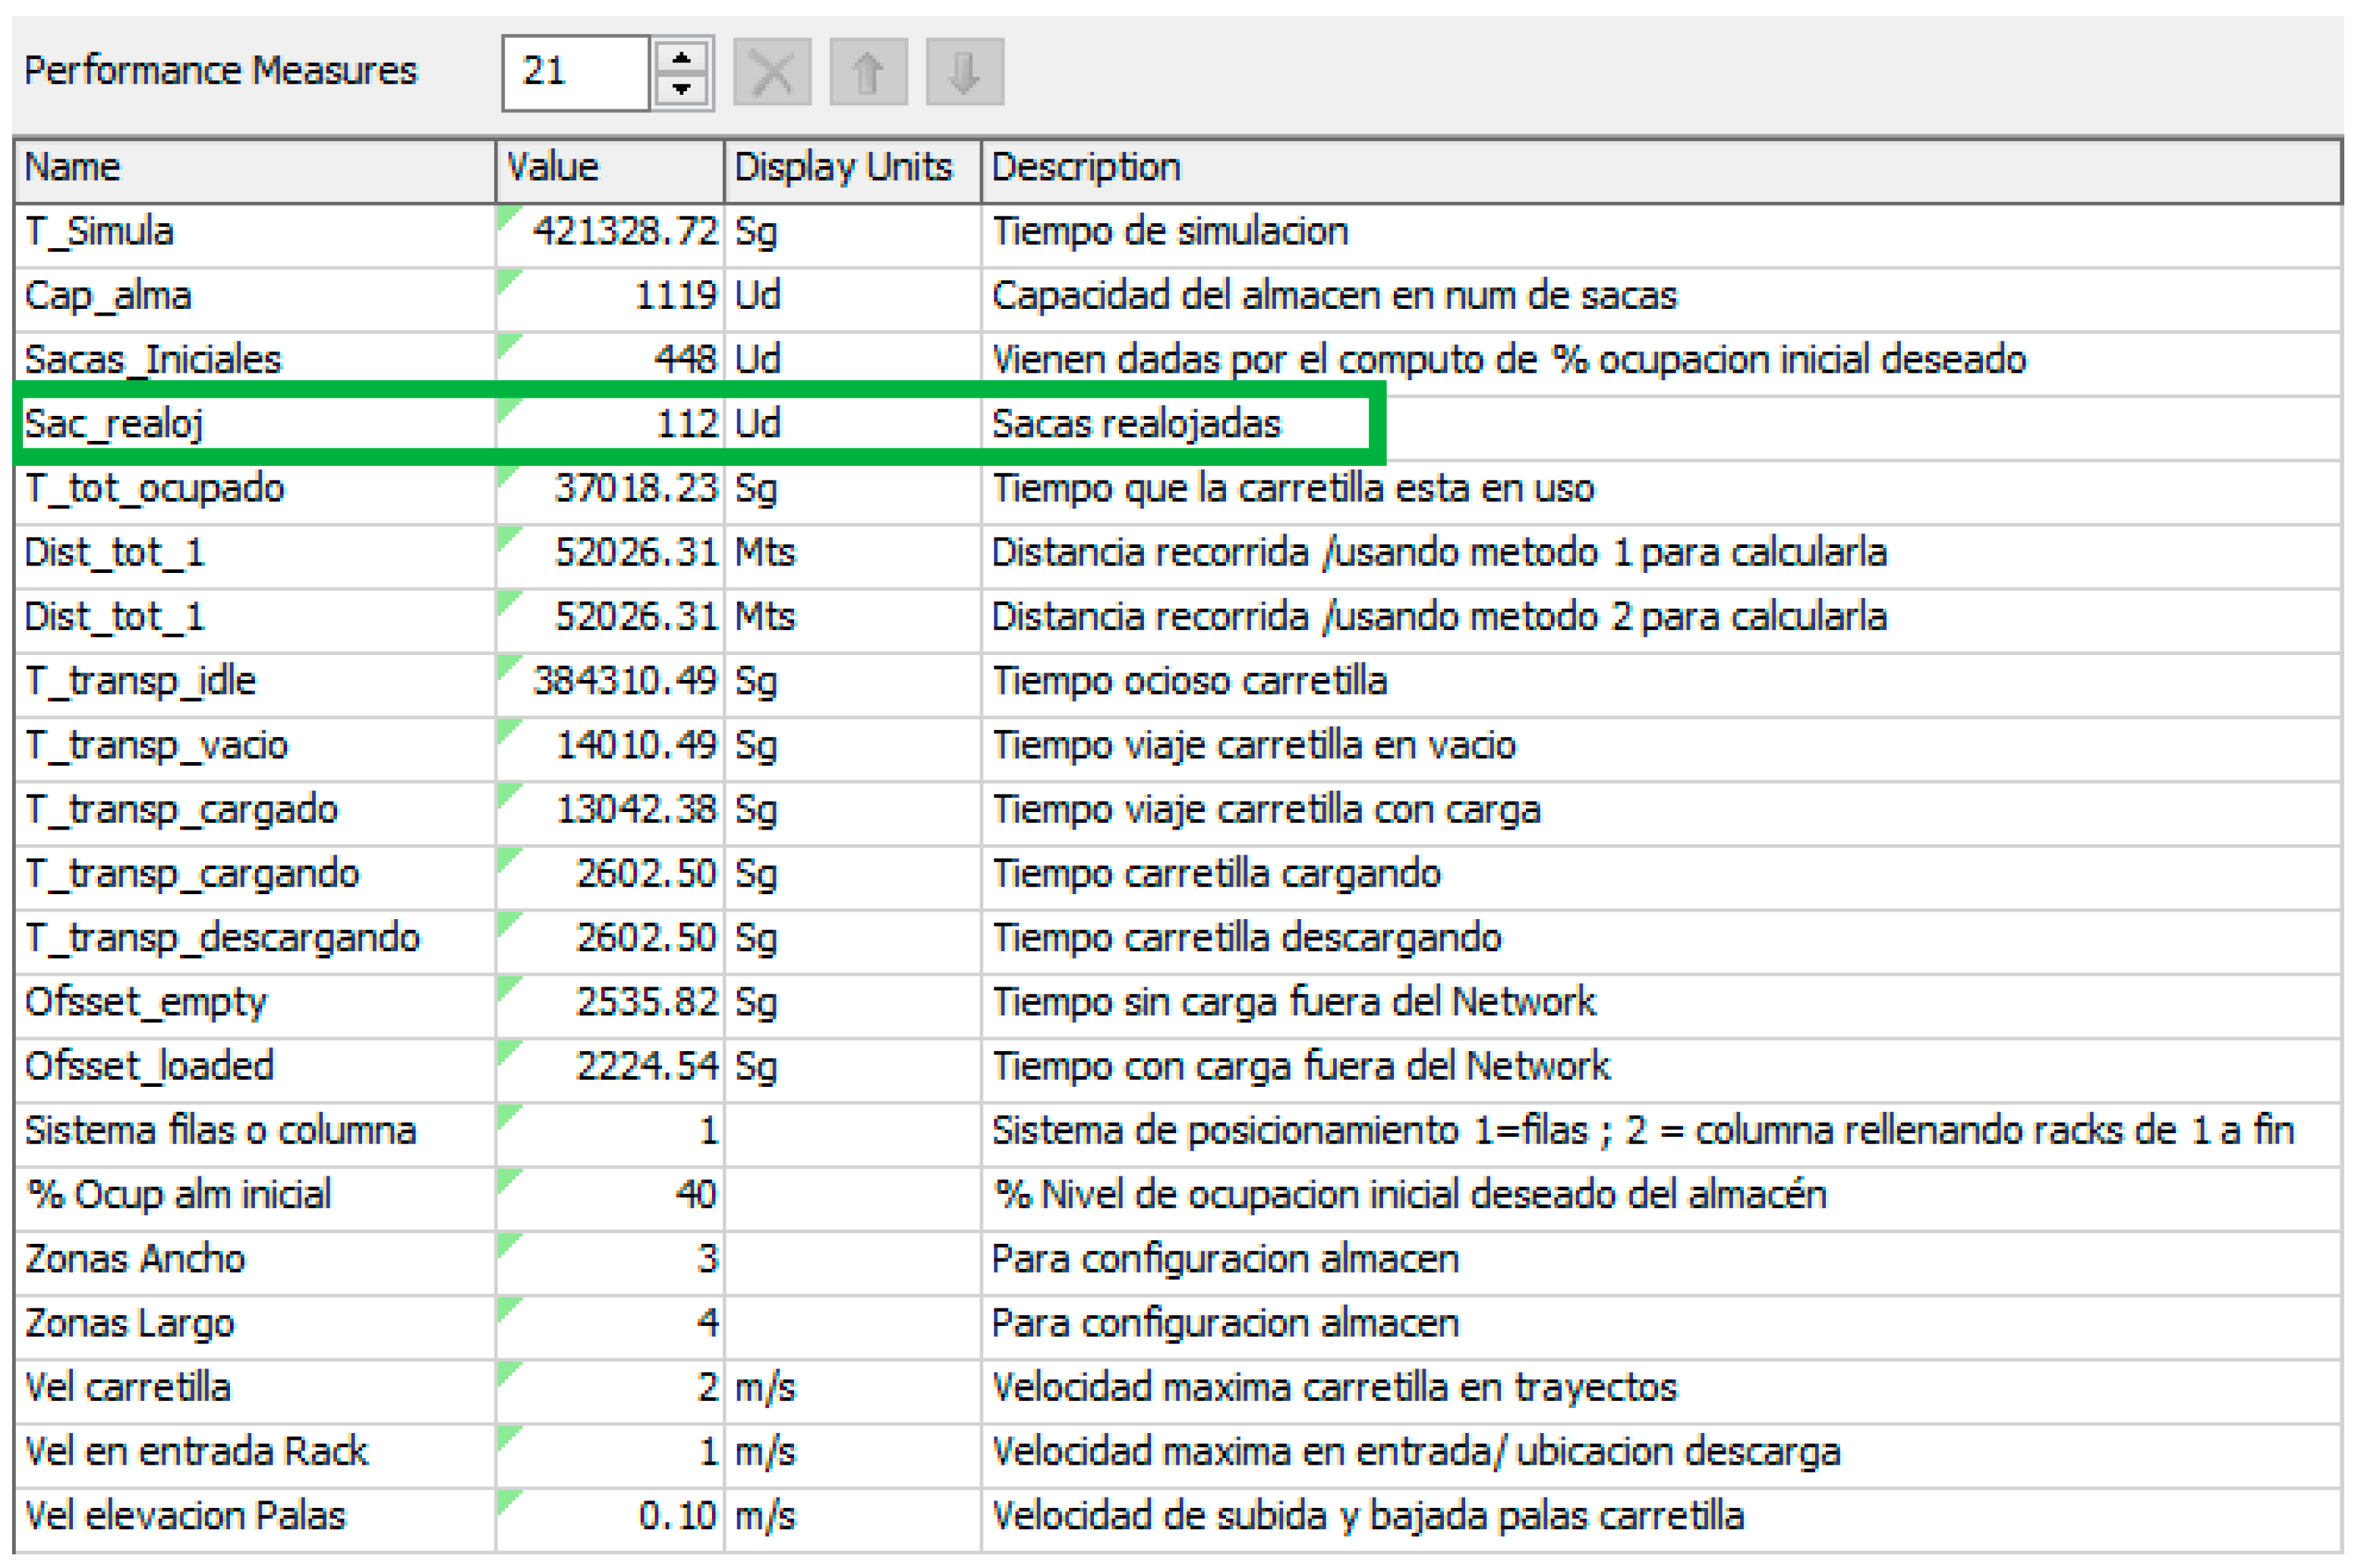
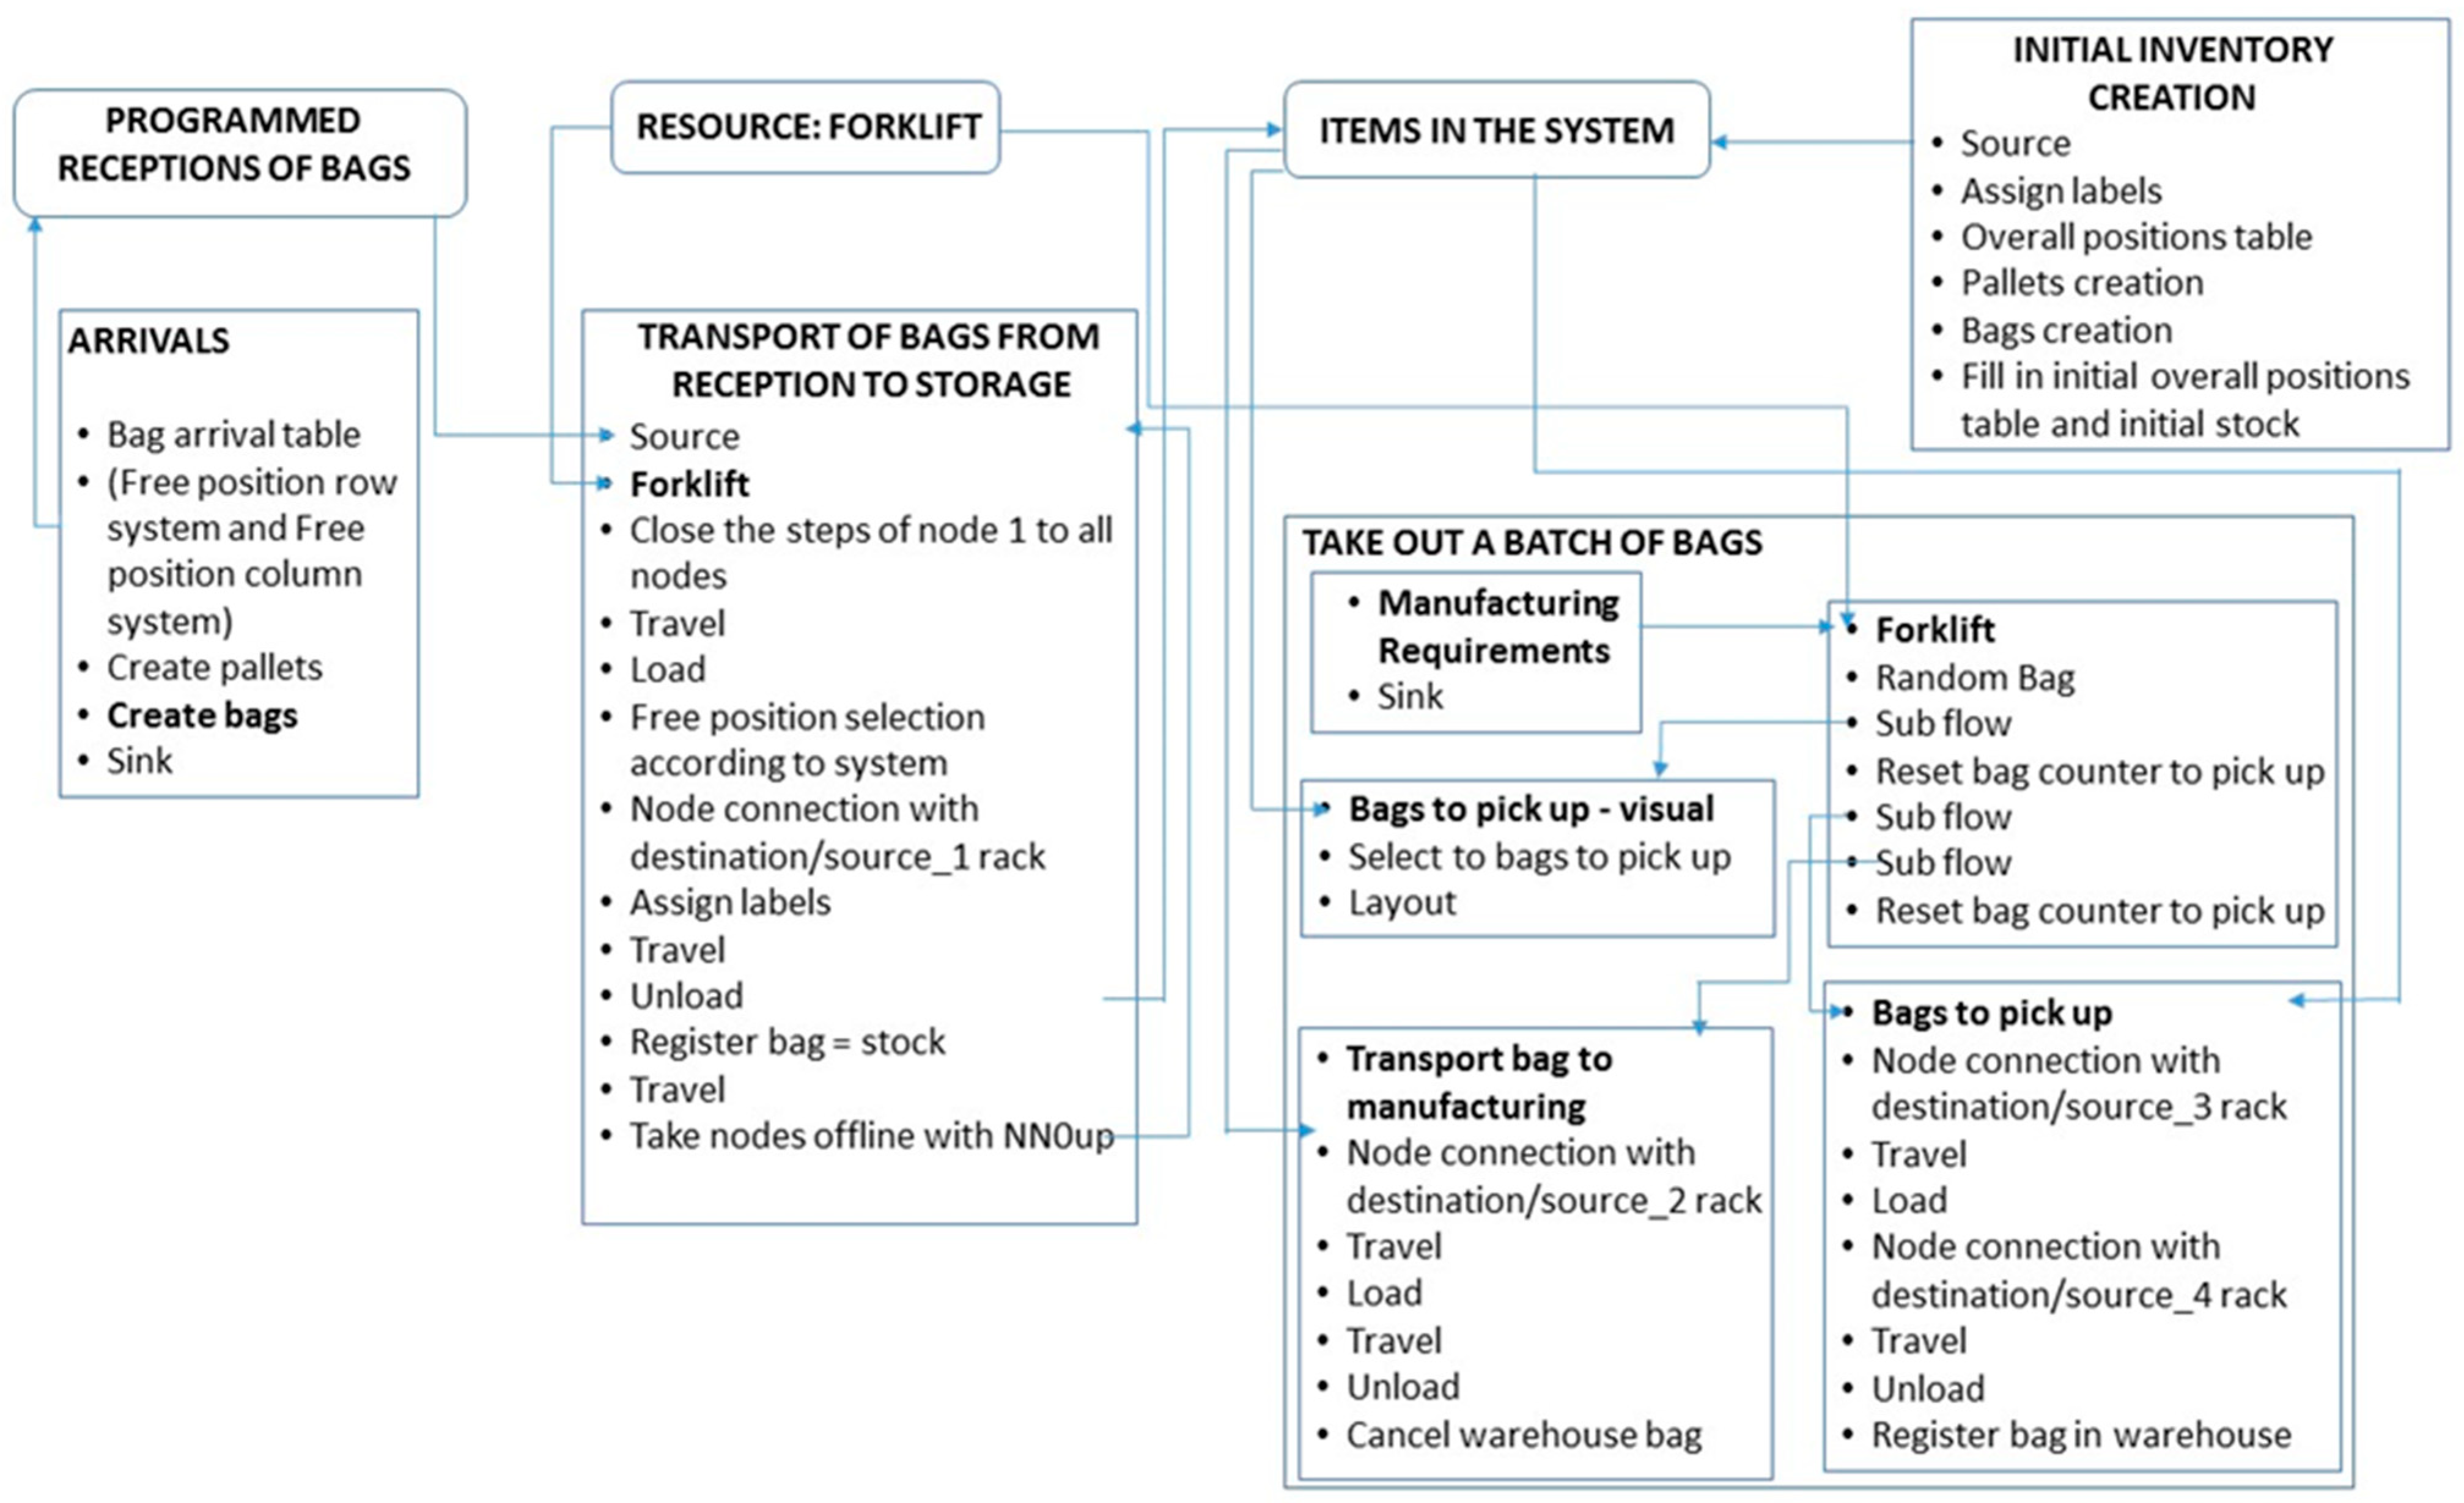
2.6. Simulation Model

The simulation model is able to generate layouts of the storage area according to the number of zones in width and length defined by the user. This zone specification directly determines the number of aisles required to access the different zones and the storage capacity of each one of them.
It is necessary to define the nodes and the paths that link them in order to calculate at each moment which is the optimal route (minimum distance traveled). This is supported by a network of nodes and arcs, G (N, A), where N is a set of n nodes, and A is a set of m directed arcs; each arc is defined by (i, j) ∈ A, and has an associated length cij that represents the distance between nodes i and j, according to notation given by Ahuja et al. [37]. Equation (1) shows the objective function, minimizing the distance traveled, where xij is a nonnegative decision variable. Equations (2) and (3) represent the constraints of the problem.
M i n i m i z e i ,   j     A c i j × x i j ,
subject to,
j : i ,   j     A x i j j : j ,   i     A x j ,   i = b i , i N ,
d j d i + c i j , i ,   j     A ,
where i = 1 n b i = 0 , b(s) = 1, b(t) = −1, and b(i) = 0, with s being the source node and t the sink node, for each node i. Moreover, d(j) is a distance label for each node jN. Equation (3) is the optimality condition, and it indicates that the shortest path length to node j, d(j) is not greater than the arc length (i, j), cij, plus the shortest path length to node i, d(i), all for each arc (i, j).
In any given scenario, two nodes are located at fixed positions outside the warehouse. The first one corresponds to the previous storage area, and the second one to the final unloading area. At the beginning of the simulation, the algorithm generates nodes at the aisle crossings. To complete the number of nodes, it is necessary to generate a pair of nodes that are dynamically located at the chosen row entry position and at the final position within the row (loading or unloading process).
The algorithm used dynamically links these nodes in such a way that the possible paths coincide with the defined aisles. This ensures that the optimal routes are always followed (shortest distances traveled).
Solving is executed by FlexSim [42]. This software makes it possible to define speeds and accelerations in different situations for the forklift truck. Thus, the speeds are different for aisle travel, changes in direction, and even for positioning within the selected row. The choice and configuration of these operating parameters have been chosen based on the characteristics of the forklift truck. Figure 8 shows a scheme of the main elements of the simulation model and the relationships between them.

3. Results

3.1. Equivalent Layouts Occupancy

Results regarding equivalent layouts can be observed in Table 1. As the number of aisles increases, the associated layouts reduce the overall storage capacity. In order to eliminate scenarios that are not operational from the comparison, either because they do not reach the reference capacity or because they are very close to their maximum storage capacity, the combinations with an occupancy rate of more than 95% have been discarded from the analysis. According to the determined criteria, there are no equivalent layouts for occupancies greater than 85%, and in any case, the number of them decreases in parallel with the growth of the occupancy rate, as expected.

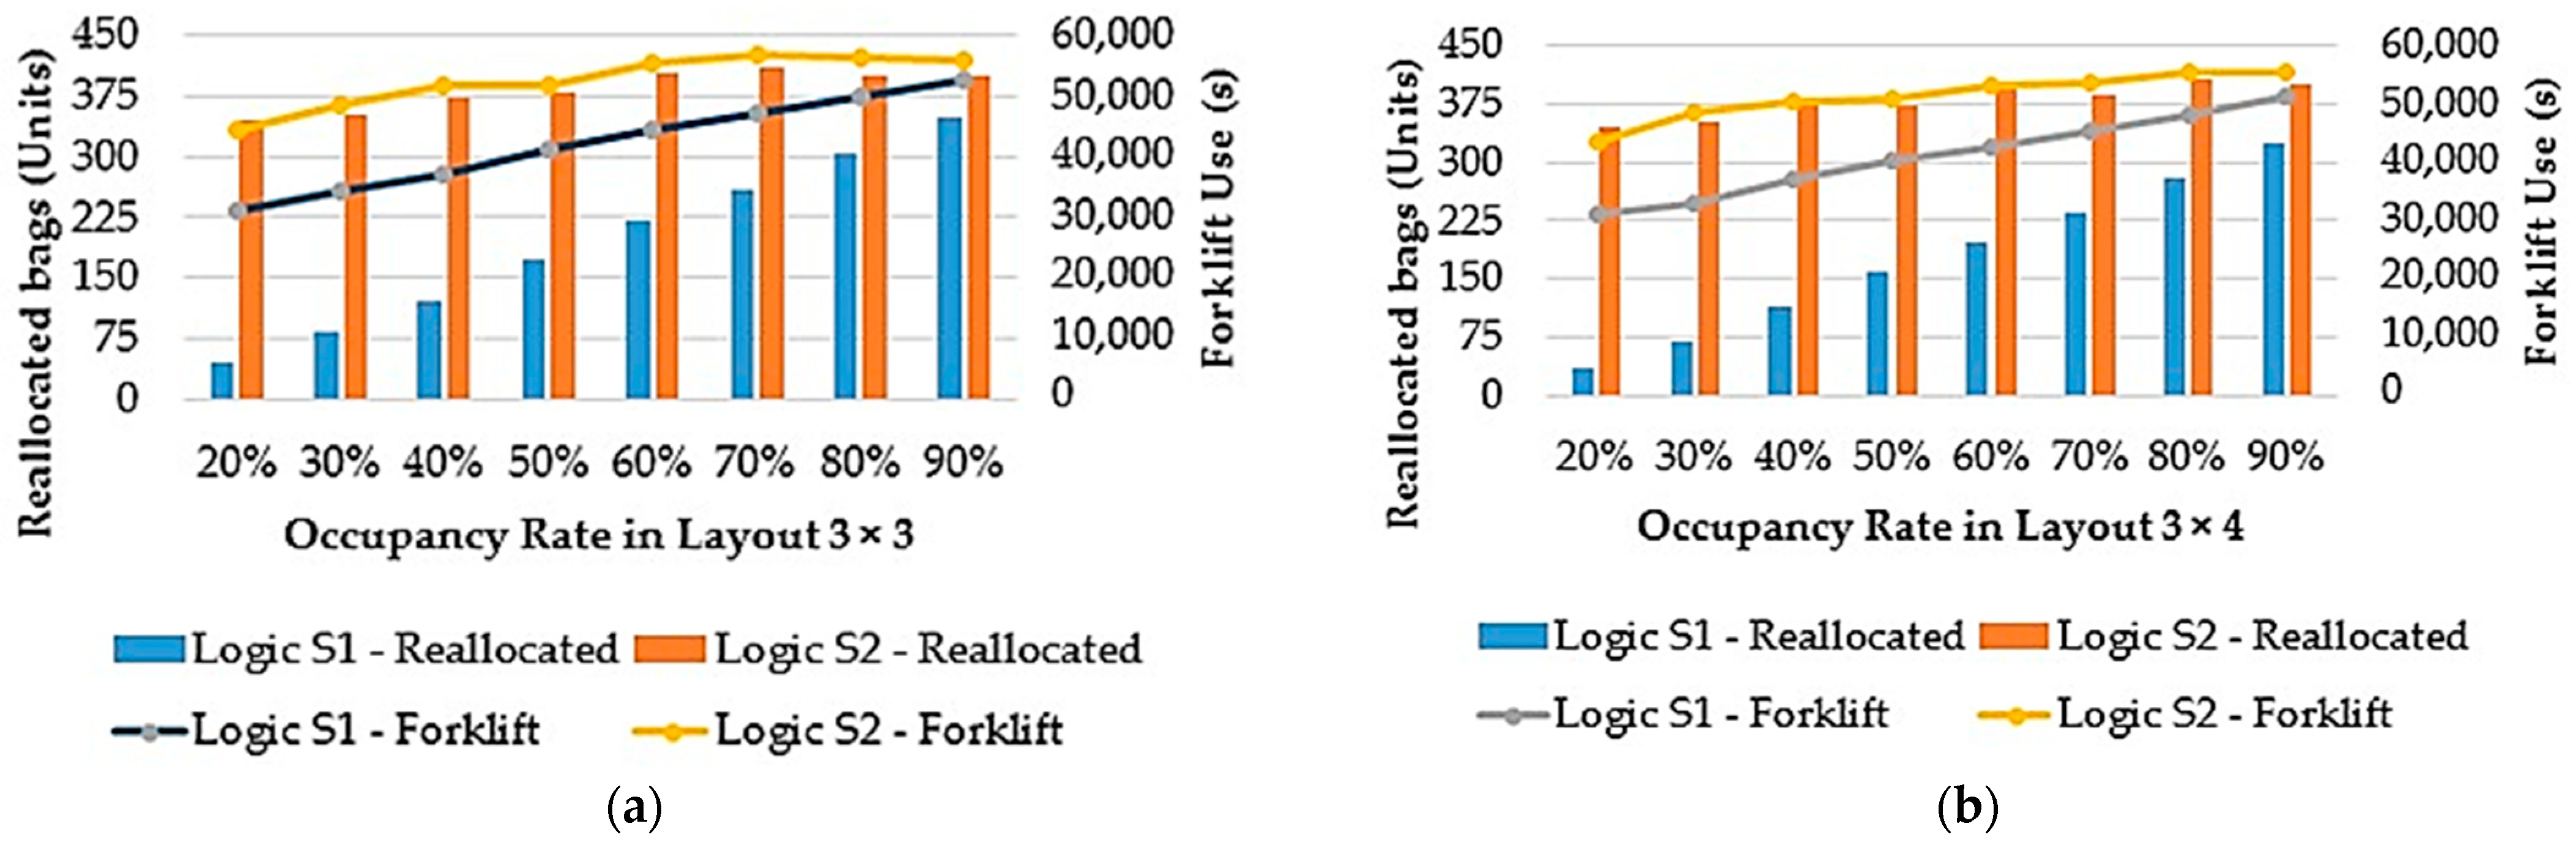
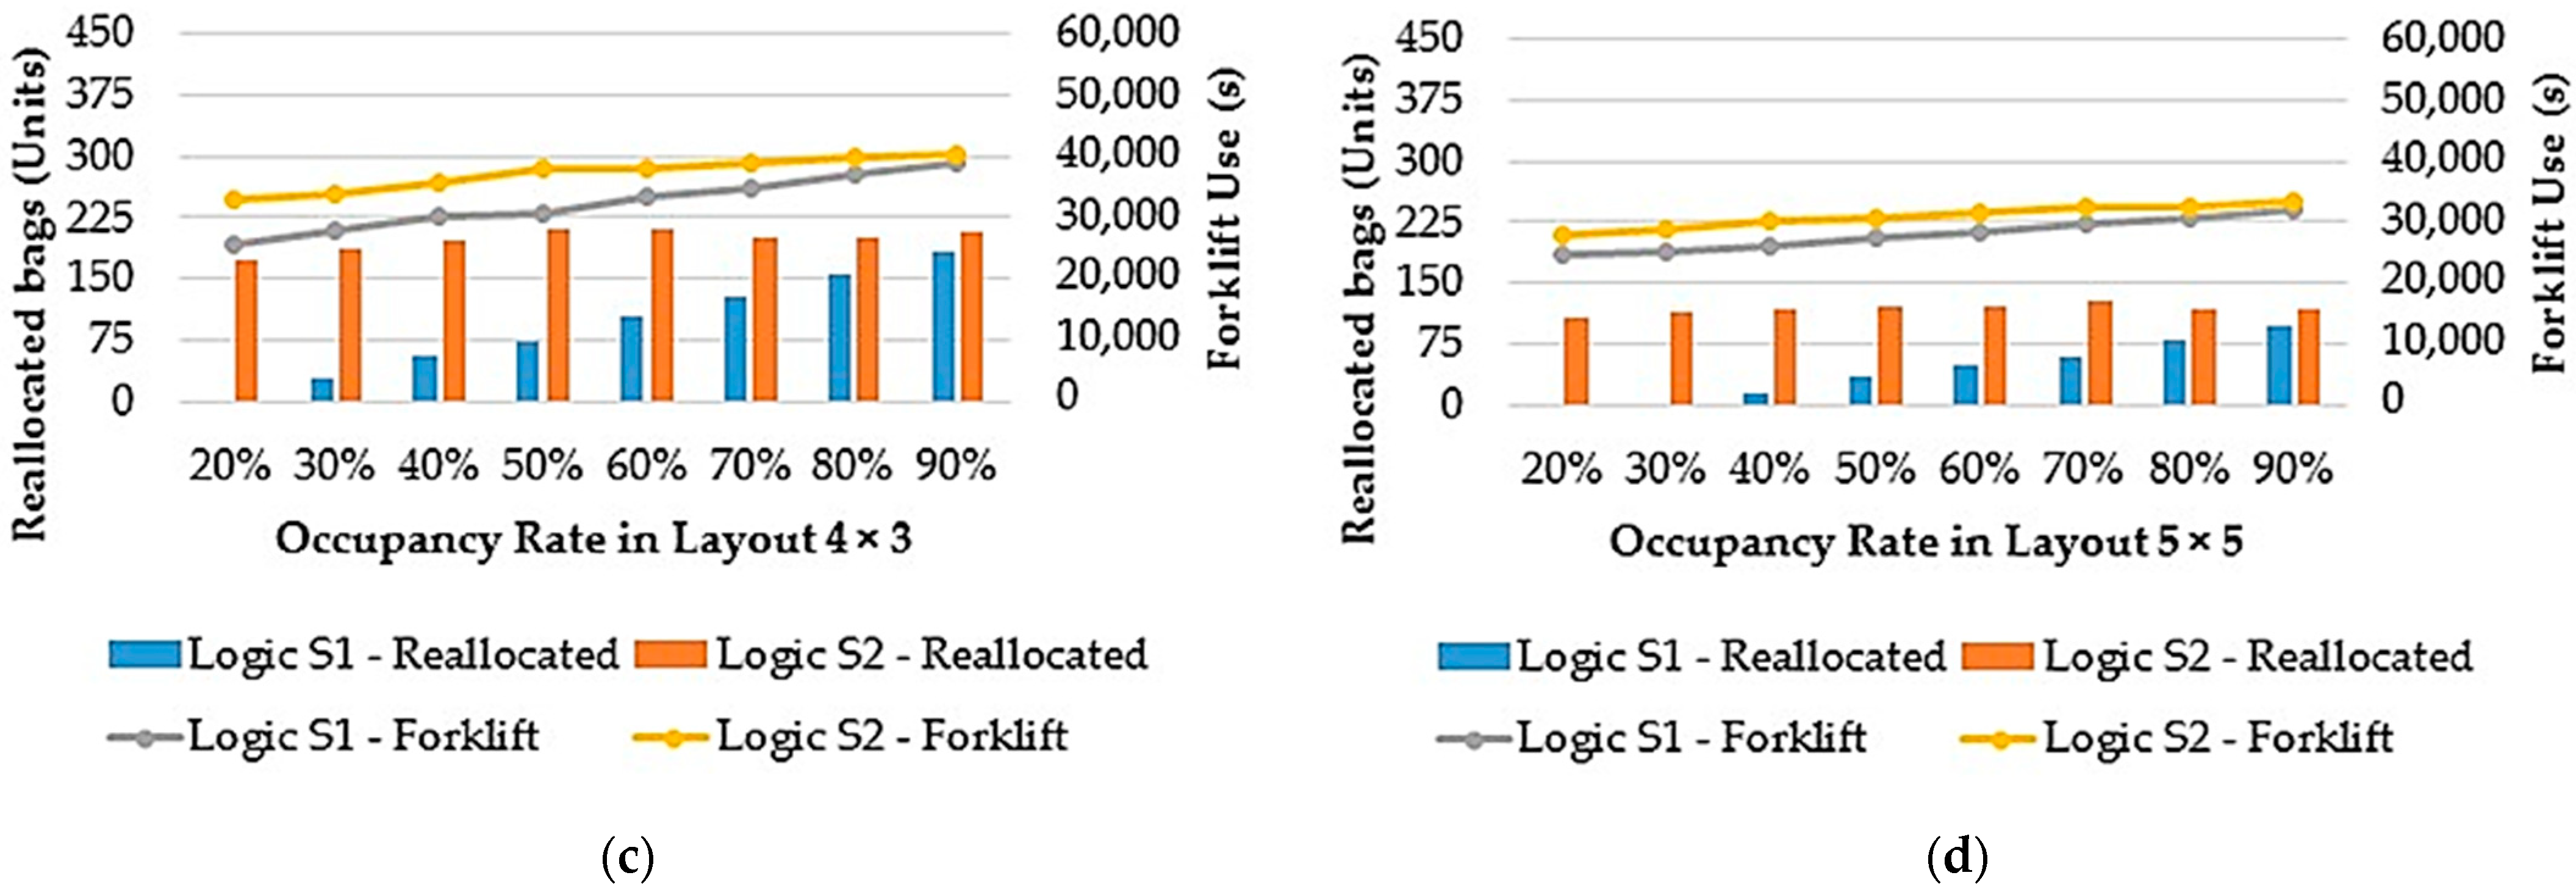
3.2. S1 versus S2 Storage Logics

Logics S1 and S2 have been tested through simulations carried out in the 3 × 3, 3 × 4, 4 × 3, and 5 × 5 layouts, with five repetitions per simulation, and in the occupancy range between 20 and 90%. The total simulation times range between 421,001 and 424,353; therefore, there are no significant differences, although a high computation time is appreciated.
The average values of the five simulations referring to the reallocated bags and the time of use of the forklift are shown in Figure 9. An increase in the number of reallocated bags and a longer use time of the forklift is observed when logic S2 is applied in Figure 9. As is expected, by increasing the number of rows or columns in the layout, the number of reallocations is reduced, reaching zero in layouts such as 4 × 3 and 5 × 5 when the range of warehouse occupancy is less than 20% for (see Figure 9c) and less than 30% for (see Figure 9d).
Finally, it is possible to affirm that the results of the simulations performed are clear regarding the execution of the logics analyzed (Figure 9):
  • Logic S1 performs better in all the arrangements analyzed, regardless of the degree of occupancy.
  • The differences between the two logics become smaller as the degree of occupancy increases, in particular in the range close to 90%.
  • The time that the forklift has been occupied also follows the same pattern, although the percentage differences between the times occupied in each of the two logics compared to the number of bags repositioned is smaller.

3.3. Analysis of Storage Configurations

3.3.1. Analysis

In Figure 10a, the layouts with a greater number of “transversal zones” can be observed, layout 6 × 3 with a 76.3% occupancy rate and layout 3 × 3 with a 50% occupancy rate, while in Figure 10b, the layouts with a greater number of “longitudinal zones”, layout 3 × 6 with 65.0% occupancy rate and layout 3 × 3 with a 50% occupancy rate can be seen. The analysis of the configurations (Table 2) under different occupancy conditions shows diverse results, although with an evident tendency towards a better performance of the layouts with a greater number of “transversal zones” (Figure 10a), compared to those layouts with a greater number of “longitudinal zones” (Figure 10b).
For low storage requirements (less than 822 bags) and low occupancy rates (less than 65%), the 6 × 3 configuration performs best. As more storage capacity is needed, the number of viable layouts decreases. Of those that are available, the layouts with the highest number of “transverse zones” and the lowest number of “longitudinal zones” are the most suitable.
For high storage requirements (more than 80%), the number of available alternatives is so small that a comparison between layouts is meaningless. In these cases, the simulation only provides information on occupancy times and the number of reallocations made.

3.3.2. Results of the Analysis

Table 2 shows the equivalent layout for 3 × 3 with different percentages of occupancies, presenting the maximum and the minimum quantity of relocations. This table shows that the maximum number of relocations is achieved in the 3 × 6 layout for 50, 55, 60, 65, and 70% of occupancy and the maximum in the 3 × 5 layout for 75% of occupancy. Similar results can be observed for the minimum number of relocations in the 5 × 3 layout for 65, 70, and 75% of occupancy and a minimum quantity in the 6 × 3 layout for 50, 55, and 60% of occupancy.
Analogous results can be observed for the use of the forklift.
Considering the occupancy range, the differences between the reallocated bags can vary between 156 and 198, depending on the selected layout. This could involve many internal movements in case of a wrong choice that could cause wear in the bags due to excessive handling. Note that these amounts are higher than relocations for some configurations. In terms of time, the forklift could need up to almost an additional 18,000 s, 5 extra hours of operation, which could mean more maintenance tasks.
The integration of internal transport with warehouse management shows that the maximum use of space does not necessarily lead to an improvement in the internal movements of material and equipment. All these results are consistent with those shown in the previous subsections. The results obtained may have, as their main application, the use of these methods in warehouses without rigid structures, where work at full capacity is not always required, with the flexibility to modify its layout, and where minimizing internal transport time is a priority, such as bulk material storage.

4. Conclusions

A way to digital twin applied to non-stacking warehouse management by combination of RFID technology and spatial-operational multivariate simulation has been carried out. The warehouse is intended for the storage of recycled bags, and the variables analyzed are the reallocated bags and the forklift time use. All the simulations have been repeated five times, and their computing time is around 117 h. Two logics have been applied, finding that logic S1 provides a more efficient solution with any degree of occupancy, although the differences with respect to logic S2 are reduced when this occupancy rate increases. In addition, the time of use of the forklift follows a similar pattern.
The results of the simulations indicate that for occupancy rates below 65%, the 6 × 3 configuration is recommended. Moreover, this layout has provided fewer reallocated bags and, consequently, shorter forklift usage times. However, its reverse configuration, 3 × 6, is the least recommended. As storage capacity increases, the number of viable designs decreases, being those with the greatest number of “transverse zones” and the least number of “longitudinal zones” as the most suitable. With storage requirements greater than 80%, the number of available alternatives is greatly reduced. The integration of internal transport with warehouse management indicates that the maximum use of space does not lead to an improvement in internal movements, which implies that a digital warehouse would facilitate its management.
As future work, several immediate lines are open, completing the transition to the digital twin in this particular warehouse by connecting to the physical system and integrating this system with the maintenance management and manufacturing execution systems (MES), all of which could be studied to continue progressing towards Industry 4.0.

Author Contributions

Conceptualization, J.S.F.-C.; methodology, J.S.F.-C.; software, J.S.F.-C.; validation, J.S.F.-C. and R.D.; formal analysis, J.S.F.-C. and R.D.; investigation, J.S.F.-C.; resources, J.S.F.-C. and R.D; data curation, J.S.F.-C.; writing—original draft preparation, J.S.F.-C. and R.D.; writing—review and editing, J.S.F.-C. and R.D.; supervision, R.D. All authors have read and agreed to the published version of the manuscript.

Funding

This research received no external funding.

Institutional Review Board Statement

Not applicable.

Informed Consent Statement

Not applicable.

Data Availability Statement

No new data were created or analyzed in this study. Data sharing is not applicable to this article.

Acknowledgments

The authors would like to thank the UNED Master’s Program in Advanced Manufacturing Engineering for their support.

Conflicts of Interest

The authors declare no conflict of interest.

References

  1. Madni, A.M.; Madni, C.C.; Lucero, S.D. Leveraging Digital Twin Technology in Model-Based Systems Engineering. Systems 2019, 7, 7. [Google Scholar] [CrossRef] [Green Version]
  2. Cimino, C.; Negri, E.; Fumagalli, L. Review of digital twin applications in manufacturing. Comput. Ind. 2019, 113, 103130. [Google Scholar] [CrossRef]
  3. Dos Santos, C.H.; Gabriel, G.T.; Soares do Amaral, J.V.; Barra Montevechi, J.A.; de Queiroz, J.A. Decision-making in a fast fashion company in the Industry 4.0 era: A Digital Twin proposal to support operational planning. Int. J. Adv. Manuf. Technol. 2021, 116, 1653–1666. [Google Scholar] [CrossRef]
  4. Mendi, A.F. A Digital Twin Case Study on Automotive Production Line. Sensors 2022, 22, 6963. [Google Scholar] [CrossRef] [PubMed]
  5. Pilati, F.; Sbaragli, A.; Regattieri, A.; Cohen, Y. Real Time Locating System for a Learning Cross-Docking Warehouse. In Proceedings of the Conference on Learning Factories CLF2021, Graz, Austria, 1–2 July 2021. [Google Scholar] [CrossRef]
  6. Rebelo, C.G.S.; Pereira, M.T.; Silva, F.J.G.; Ferreira, L.P.; Sá, J.C. The relevance of space analysis in warehouse management. Procedia Manuf. 2021, 55, 471–478. [Google Scholar] [CrossRef]
  7. Fontana, M.E.; Cavalcante, C.A.V. Use of Promethee method to determine the best alternative for warehouse storage location assignment. Int. J. Adv. Manuf. Technol. 2014, 70, 1615–1624. [Google Scholar] [CrossRef]
  8. Manzini, R.; Accorsi, R.; Baruffaldi, G.; Santi, D.; Tufano, A. Performance assessment in order picking systems: A visual double cross-analysis. Int. J. Adv. Manuf. Technol. 2019, 101, 1927. [Google Scholar] [CrossRef]
  9. Contreras-Hernandez, L.; Jiménez-G, H.S.; Dantas, P.P.L.; Cavalcante, C.A.V. Using multi-criteria decision making for selecting picking strategies. Oper. Res. Int. J. 2022, 22, 3265–3290. [Google Scholar] [CrossRef]
  10. Fontana, M.E.; Cavalcante, C.A.V. Using the Efficient Frontier to Obtain the Best Solution for the Storage Location Assignment Problem. Math. Probl. Eng. 2014, 2014, 745196. [Google Scholar] [CrossRef]
  11. Sadowski, A.; Wojciechowski, P.; Engelseth, P. The contingent nature of warehouse flexibility. Int. J. Product. Perform. 2021, 17, 3417–3442. [Google Scholar] [CrossRef]
  12. Polyportis, A.; Mugge, R.; Magnier, L. Consumer acceptance of products made from recycled materials: A scoping review. Resour. Conserv. Recycl. 2022, 186, 106533. [Google Scholar] [CrossRef]
  13. Janssen, L.; Claus, T.; Sauer, J. Literature review of deteriorating inventory models by key topics from 2012 to 2015. Int. J. Prod. Econ. 2016, 182, 86–112. [Google Scholar] [CrossRef] [Green Version]
  14. Zhang, Y.; Chai, Y.; Ma, L. Research on Multi-Echelon Inventory Optimization for Fresh Products in Supply Chains. Sustainability 2021, 13, 6309. [Google Scholar] [CrossRef]
  15. Alonso, L.; Rubio, E.M.; de Agustina, B.; Domingo, R. Latest clean manufacturing trends applied to a world class manufacturing management for improving logistics and environmental performance. Procedia Manuf. 2017, 13, 1151–1158. [Google Scholar] [CrossRef]
  16. D’Orazio, L.; Messina, R.; Schiraldi, M.M. Industry 4.0 and World Class Manufacturing Integration: 100 Technologies for a WCM-I4.0 Matrix. Appl. Sci. 2020, 10, 4942. [Google Scholar] [CrossRef]
  17. Roodbergen, K.J.; Iris, I.F.A.; Taylor, G.D., Jr. Simultaneous determination of warehouse layout and control policies. Int. J. Prod. Res. 2015, 53, 3306–3326. [Google Scholar] [CrossRef]
  18. Revillot-Narváez, D.; Pérez-Galarce, F.; Álvarez-Miranda, E. Optimising the storage assignment and order-picking for the compact drive-in storage system. Int. J. Prod. Res. 2020, 58, 6949–6969. [Google Scholar] [CrossRef]
  19. Ahmadi Keshavarz, A.R.; Jaafari, D.; Khalaj, M.; Dokouhaki, P. A Survey of the Literature on Order-Picking Systems by Combining Planning Problems. Appl. Sci. 2021, 11, 10641. [Google Scholar] [CrossRef]
  20. Derhami, S.; Smith, J.S.; Kevin, R.; Gue, K.R. Optimising space utilisation in block stacking warehouses. Int. J. Prod. Res. 2017, 55, 6436–6452. [Google Scholar] [CrossRef]
  21. Derhami, S.; Smith, J.S.; Gue, K.R. A simulation-based optimization approach to design optimal layouts for blocks stacking warehouses. Int. J. Prod. Econ. 2020, 223, 107525. [Google Scholar] [CrossRef]
  22. Öztürkoğlu, Ö.; Hoser, D. A discrete cross aisle design model for order-picking warehouses. Eur. J. Oper. Res. 2019, 275, 411–430. [Google Scholar] [CrossRef]
  23. Venkitasubramony, R.; Adil, G.K. Modeling the effect of imperfect staggering in product inflow using queuing theory: Revisiting block stacking layout. Flex. Serv. Manuf. J. 2021, 33, 689–716. [Google Scholar] [CrossRef]
  24. Motroni, A.; Buffi, A.; Nepa, P. Forklift Tracking: Industry 4.0 Implementation in Large-Scale Warehouses through UWB Sensor Fusion. Appl. Sci. 2021, 11, 10607. [Google Scholar] [CrossRef]
  25. Motroni, A.; Buffi, A.; Nepa, P.; Pesi, M.; Congi, A. An Action Classification Method for Forklift Monitoring in Industry 4.0 Scenarios. Sensors 2021, 21, 5183. [Google Scholar] [CrossRef] [PubMed]
  26. Unhelkar, B.; Joshi, S.; Sharma, M.; Prakash, S.; Mani, A.K.; Prasad, M. Enhancing supply chain performance using RFID technology and decision support systems in the industry 4.0—A systematic literature review. Int. J. Inf. Manag. 2022, 2, 100084. [Google Scholar] [CrossRef]
  27. Tripicchio, P.; D’Avella, S.; Unetti, M. Efficient localization in warehouse logistics: A comparison of LMS approaches for 3D multilateration of passive UHF RFID tags. Int. J. Adv. Manuf. Technol. 2022, 120, 4977–4988. [Google Scholar] [CrossRef]
  28. Rzymowski, M.; Nyka, K.; Kulas, L. Direction of Arrival Estimation Based on Received Signal Strength Using Two-Row Electronically Steerable Parasitic Array Radiator Antenna. Sensors 2022, 22, 2034. [Google Scholar] [CrossRef]
  29. Hayward, S.J.; Earps, J.; Sharpe, R.; van Lopik, K.; Tribe, J.; West, A.A. A novel inertial positioning update method, using passive RFID tags, for indoor asset localization. CIRP J. Manuf. Sci. Technol. 2021, 35, 968–982. [Google Scholar] [CrossRef]
  30. Garriz, C.; Domingo, R. Simulation, through discrete events, of industrial processes in productive environments. Procedia Manuf. 2017, 13, 1074–1081. [Google Scholar] [CrossRef]
  31. Garriz, C.; Domingo, R. Development of trajectories through the Kalman algorithm and application to an industrial robot in the automotive industry. IEEE Access 2019, 7, 23570–23578. [Google Scholar] [CrossRef]
  32. Florescu, A.; Barabas, S.A. Modeling and Simulation of a Flexible Manufacturing System—A Basic Component of Industry 4.0. Appl. Sci. 2020, 10, 8300. [Google Scholar] [CrossRef]
  33. Garriz, C.; Domingo, R. Trajectory Optimization in Terms of Energy and Performance of an Industrial Robot in the Manufacturing Industry. Sensors 2022, 22, 7538. [Google Scholar] [CrossRef]
  34. Fonseca i Casas, P.; Lijia Hu, D.; Guasch i Petit, A.; Figueras i Jové, J. Simplifying the Verification of Simulation Models through Petri Net to FlexSim Mapping. Appl. Sci. 2020, 10, 139. [Google Scholar] [CrossRef] [Green Version]
  35. Tao, F.; Xiao, B.; Qi, Q.; Cheng, J.; Ji, P. Digital twin modeling. J. Manuf. Syst. 2022, 64, 372–389. [Google Scholar] [CrossRef]
  36. Ben Rabia, M.A.; Bellabdaoui, A. Simulation-based analytics: A systematic literature review. Simul. Model. Pract. Theory 2022, 117, 102511. [Google Scholar] [CrossRef]
  37. Ahuja, R.K.; Magnanti, T.L.; Orlin, J.B. Network Flows: Theory, Algorithms, and Applications; Prentice-Hall: Upper Saddle River, NJ, USA, 1993. [Google Scholar]
  38. Roodbergen, K.J.; de Koster, R. Routing order pickers in a warehouse with a middle aisle. Eur. J. Oper. Res. 2001, 133, 32–43. [Google Scholar] [CrossRef] [Green Version]
  39. Lewin, K. Action research and minority problems. J. Soc. Issues 1946, 2, 34–46. [Google Scholar] [CrossRef]
  40. McNiff, J.; Whitehead, J. Action Research: Principles and Practice, 2nd ed.; Routledge Falmer: New York, NY, USA, 2002. [Google Scholar]
  41. Zhuang, C.; Liu, J.; Xiong, H. Digital twin-based smart production management and control framework for the complex product assembly shop-floor. Int. J. Adv. Manuf. Technol. 2018, 96, 1149–1163. [Google Scholar] [CrossRef]
  42. FlexSim. Available online: www.flexsim.com (accessed on 1 March 2022).
  43. Beaverstock, M.; Greenwood, A.; Nordgren, W. Applied Simulation: Modeling and Analysis Using Flexsim, 5th ed.; BookBaby: Pennsauken, NJ, USA, 2018. [Google Scholar]
  44. Kwok, P.K.; Yan, M.; Chan, B.K.P.; Lau, H.Y.K. Crisis management training using discrete-event simulation and virtual reality techniques. Comput. Ind. Eng. 2019, 135, 711–722. [Google Scholar] [CrossRef]
  45. ISO 6780; Flat Pallets for Intercontinental Materials Handling—Principal Dimensions and Tolerances. International Organization for Standardization: Geneva, Switzerland, 2003.
  46. ISO/IEC 15962; Information Technology—Radio Frequency Identification (RFID) for Item Management—Data Protocol: Data Encoding Rules and Logical Memory Functions. International Organization for Standardization: Geneva, Switzerland, 2022.
Figure 1. Warehouse: (a) physical bags; (b) virtual layout—maximum capacity layout (2 × 3) and layout (3 × 3).
Applsci 13 04652 g001
Figure 2. Storage: (a) logic S1; (b) logic S2.
Applsci 13 04652 g002
Figure 3. Nodes and paths.
Applsci 13 04652 g003
Figure 4. Forklift RFID readers.
Applsci 13 04652 g004
Figure 5. Sequence of the readings of RFID readers: (a) bag unloading; (b) bag extraction; (c) sequences of readings in the unloading of bags; (d) sequences of readings in the extraction of bags.
Applsci 13 04652 g005
Figure 6. Chosen bag (green); to be relocated (red); already relocated (yellow).
Applsci 13 04652 g006
Figure 7. Performance measures.
Applsci 13 04652 g007
Figure 8. Scheme of the main elements of simulation model.
Applsci 13 04652 g008
Figure 9. S1 vs. S2 regarding reallocated bags and time used by forklift: (a) 3 × 3 layout; (b) 3 × 4 layout; (c) 4 × 3 layout; (d) 5 × 5 layout.
Applsci 13 04652 g009aApplsci 13 04652 g009b
Figure 10. Layouts with a greater number of transversal or longitudinal zones: (a) layout (6 × 3) with 76.3% occupancy rate = 50% occupancy rate layout (3 × 3); (b) layout (3 × 6) with 65.0% occupancy rate = 50% occupancy rate layout (3 × 3).
Applsci 13 04652 g010
Table 1. Equivalent layouts occupancy.
Reference Layout (3 × 3) Occupancy
Occupancy
Layout (3 × 3)
50%55%60%65%70%75%80%85%90%
Available Slots
Layout (3 × 3)
633696759822886949101210751139
Equivalent Occupancy (%)
Layouts3 × 456.662.267.873.579.284.890.4>95%>95%
4 × 358.364.169.975.781.687.493.2>95%>95%
3 × 562.168.274.480.686.993.0>95%>95%>95%
5 × 363.469.776.082.388.795.0>95%>95%>95%
4 × 464.971.377.884.290.8>95%>95%>95%>95%
3 × 665.071.577.984.491.0>95%>95%>95%>95%
5 × 470.177.184.191.0>95%>95%>95%>95%>95%
4 × 571.678.785.993.0>95%>95%>95%>95%>95%
4 × 675.482.990.4>95%>95%>95%>95%>95%>95%
6 × 376.383.991.4>95%>95%>95%>95%>95%>95%
5 × 577.685.393.0>95%>95%>95%>95%>95%>95%
5 × 681.889.9>95%>95%>95%>95%>95%>95%>95%
6 × 484.092.3>95%>95%>95%>95%>95%>95%>95%
6 × 593.1>95%>95%>95%>95%>95%>95%>95%>95%
6 × 6>95%>95%>95%>95%>95%>95%>95%>95%>95%
Table 2. Reallocated bags and time of forklift use in layouts with different equivalent occupancies.
Reallocated Bags (Units)Time of Forklift Use (s)
Occupancy
Layout
50%55%60%65%70%75%50%55%60%65%70%75%
3 × 3173194220623325828541,23642,80544,29246,02647,18448,815
Layouts3 × 417520822925127629041,44343,70545,35746,40948,43548,806
4 × 310111212614115717532,86634,12034,48036,14536,46538,554
3 × 518621423426328330841,54644,44445,38047,36748,66949,807
5 × 35971859310611729,72730,09631,15432,03432,46733,854
4 × 4109121140157169 33,15534,818351,95636,98737,361
3 × 6197223251279297 42,70844,79846,20348,58750,037
5 × 4658294104 29,36330,79831,98331,947
4 × 5119131153166 34,32734,82036,41437,029
4 × 6125137157 35,32835,22836,612
6 × 3415051 27,17728,04728,375
5 × 57791101 30,06731,48831,858
5 × 68498 30,76331,355
6 × 44355 27,25628,419
6 × 552 28,216
Disclaimer/Publisher’s Note: The statements, opinions and data contained in all publications are solely those of the individual author(s) and contributor(s) and not of MDPI and/or the editor(s). MDPI and/or the editor(s) disclaim responsibility for any injury to people or property resulting from any ideas, methods, instructions or products referred to in the content.

