Article

Integrating Spherical Fuzzy Sets and the Objective Weights Consideration of Risk Factors for Handling Risk-Ranking Issues

Department of Management Sciences, R.O.C. Military Academy, Kaohsiung 830, Taiwan
Appl. Sci. 2023, 13(7), 4503; https://doi.org/10.3390/app13074503
Submission received: 12 March 2023 / Revised: 25 March 2023 / Accepted: 31 March 2023 / Published: 2 April 2023
(This article belongs to the Special Issue Artificial Intelligence in Complex Networks)

Abstract

:
Risk assessments and risk prioritizations are crucial aspects of new product design before a product is launched into the market. Risk-ranking issues involve the information that is considered for the evaluation and objective weighting considerations of the evaluation factors that are presented by the data. However, typical risk-ranking methods cannot effectively grasp a comprehensive evaluation of this information and ignore the objective weight considerations of the risk factors, leading to inappropriate evaluation results. For a more accurate ranking result of the failure mode risk, this study proposes a novel, flexible risk-ranking approach that integrates spherical fuzzy sets and the objective weight considerations of the risk factors to process the risk-ranking issues. In the numerical case validation, a new product design risk assessment of electronic equipment was used as a numerically validated case, and the simulation results were compared with the risk priority number (RPN) method, improved risk priority number (IRPN) method, intuitionistic fuzzy weighted average (IFWA) method, and spherical weighted arithmetic average (SWAA) method. The test outcomes that were confirmed showed that the proposed novel, flexible risk-ranking approach could effectively grasp the comprehensive evaluation information and provide a more accurate ranking of the failure mode risk.

1. Introduction

Risk assessment and risk-ranking issues include multiple evaluation criteria, multiple failure modes, and multiple experts, which can be categorized as multi-criteria decision making (MCDM) problems. The results of the risk assessment and risk-ranking of a product or system directly affect the product quality, profit, and market competitiveness. These risk-ranking problems primarily involve two important issues: the method of evaluating the information processing and the consideration of the risk factor weights. The typical risk priority number (RPN) approach is the most widely applied method for risk assessments and has been adopted by different industry standards, such as QS9000, IATF 16949, MILSTD-1629A, ISO 9001, and IEC 60812 [1]. In the RPN method, the failure risk of the failure mode is ranked using the RPN value, which is obtained by multiplying the three risk factors, severity (Sev), occurrence (Occ), and detection (Det). The RPN method involves simple calculations and, in recent years, has thus been widely applied in various areas, such as hospital radiopharmacy management [2], semiconductor manufacturing [3], robot-assisted rehabilitation processes [4], photovoltaic cell manufacturing [5], power transformer equipment [6], submersible pump risk analyses [7], and high-dose-rate brachytherapy treatments [8]. However, the RPN method is not able to process the uncertainty of the evaluation information [9,10] and ignores the objective weight consideration of the risk factors [4,11], also violating the definition of the measurement scale [12,13].
To process the uncertainty of the evaluation information, Zadeh [14] first presented a fuzzy set for handling the decision making issues in everyday life. The fuzzy set (FS) method applied membership degrees (MD) and non-membership degrees (NMD) to express the content of the evaluation information. The NMD is equal to 1 minus the MD in the FS method. To solve the restriction of the FS, Atanassov [15] proposed an intuitionistic FS to increase the consideration of the indeterminacy degree (ID), which required that the sum of MD, ID, and NMD must be equal to 1. The intuitionistic FS method has the advantage of an ID consideration; therefore, the intuitionistic FS method has recently been used within many different fields, such as stock prediction [16], supplier selection [17], enterprise resource planning systems [18], medical diagnoses [19], risk assessments [20], supply chain management [21], tourist destination selection [22], and so on. Extending the concept of the intuitionistic FS, the picture fuzzy set applied the MD, ID, NMD, and refusal degree to express an expert’s opinion [23], and the sum of the MD, ID, and NMD had to be less than or equal to 1. However, in the actual execution of the MCDM problems, sometimes, the sum of the MD and NMD exceeds one. To overcome the restriction of the MD and NMD of the intuitionistic FS, Yager [24] proposed a Pythagorean FS, allowing the sum of the MD and NMD to be greater than 1, but restricting the sum of squares of the MD and NMD to be less than 1. The Pythagorean FS has the advantage of being able to consider the MD, ID, and NMD simultaneously. To fully consider all the possible situations in a decision analysis, Mahmood et al. [25] used a three-dimensional FS mode to propose a spherical FS. A spherical FS allows the sum of the MD, ID, and NMD to be greater than 1, but restricts the sum of the squares of the MD, ID, and NMD to a value of less than 1. The main difference between the spherical FS and Pythagorean FS is that the spherical FS increases the consideration of the refusal degree. In a spherical FS, decision makers can specify the MD, ID, and NMD values [26]. Currently, the spherical FS is being widely used in many different areas, such as vehicle model selection [27], the construction of Fangcang shelter hospitals [28], community epidemic prevention [29], medical diagnoses [30], waste management [31], green supply chain management [32], and performance evaluation [33,34].
Another key issue in risk assessments is the objective weight consideration of the evaluation factors, which affects the accuracy of the risk assessment results. However, the traditional RPN method only considers the subjective assessment of the experts in the risk assessment process, ignoring the objectivity of the research data, which leads to incorrect assessment results [35]. Scholars have also used different calculation methods to deal with the objective weights of the MCDM problems. For example, Liang et al. [36] used the structural entropy weight approach to calculate the indicator weights of the index and then combined the fuzzy technique for order of preference with a similarity to ideal solution (TOPSIS) model, structural entropy weight approach, and cloud inference, in order to process the risk assessments of urban polyethylene gas pipelines. Likewise, Paramanik et al. [37] applied the criteria importance through an intercriteria correlation (CRITIC) approach to obtain the objective weights of the evaluation criteria, and then combined the linear programming technique for a multidimensional analysis of preference and the best–worst approach to process the web service selection problems. Earlier, Barukab et al. [38] combined the spherical FS, entropy measures, and fuzzy TOPSIS methods to process the group decision making problems for a robot selection. Recently, Chang [39] reported the use of the combined compromise solution (CoCoSo) approach and subjective–objective weights consideration to process the supplier selection problems.
To fully solve the limitations of these typical risk assessment methods, considering the information and weights, a novel flexible approach that integrates the spherical FS and objective-weight-considering factors is proposed in this study to process the risk-ranking issues. The proposed novel, flexible risk-ranking approach uses the spherical FS to fully grasp the fuzzy, intuitionistic fuzzy, and spherical fuzzy information that is provided by experts. The proposed approach also uses the preference selection index (PSI) to probe the objective weights of the evaluation factors that are presented by the data itself.
The remainder of this paper is organized as follows. In Section 2, some of the basic concepts, definitions, and algorithm rules of the RPN method, spherical weighted arithmetic average (SWAA) method, and PSI method are presented and briefly reviewed. In Section 3, a novel, flexible risk-ranking approach that integrates the SWAA and PSI methods is proposed. 
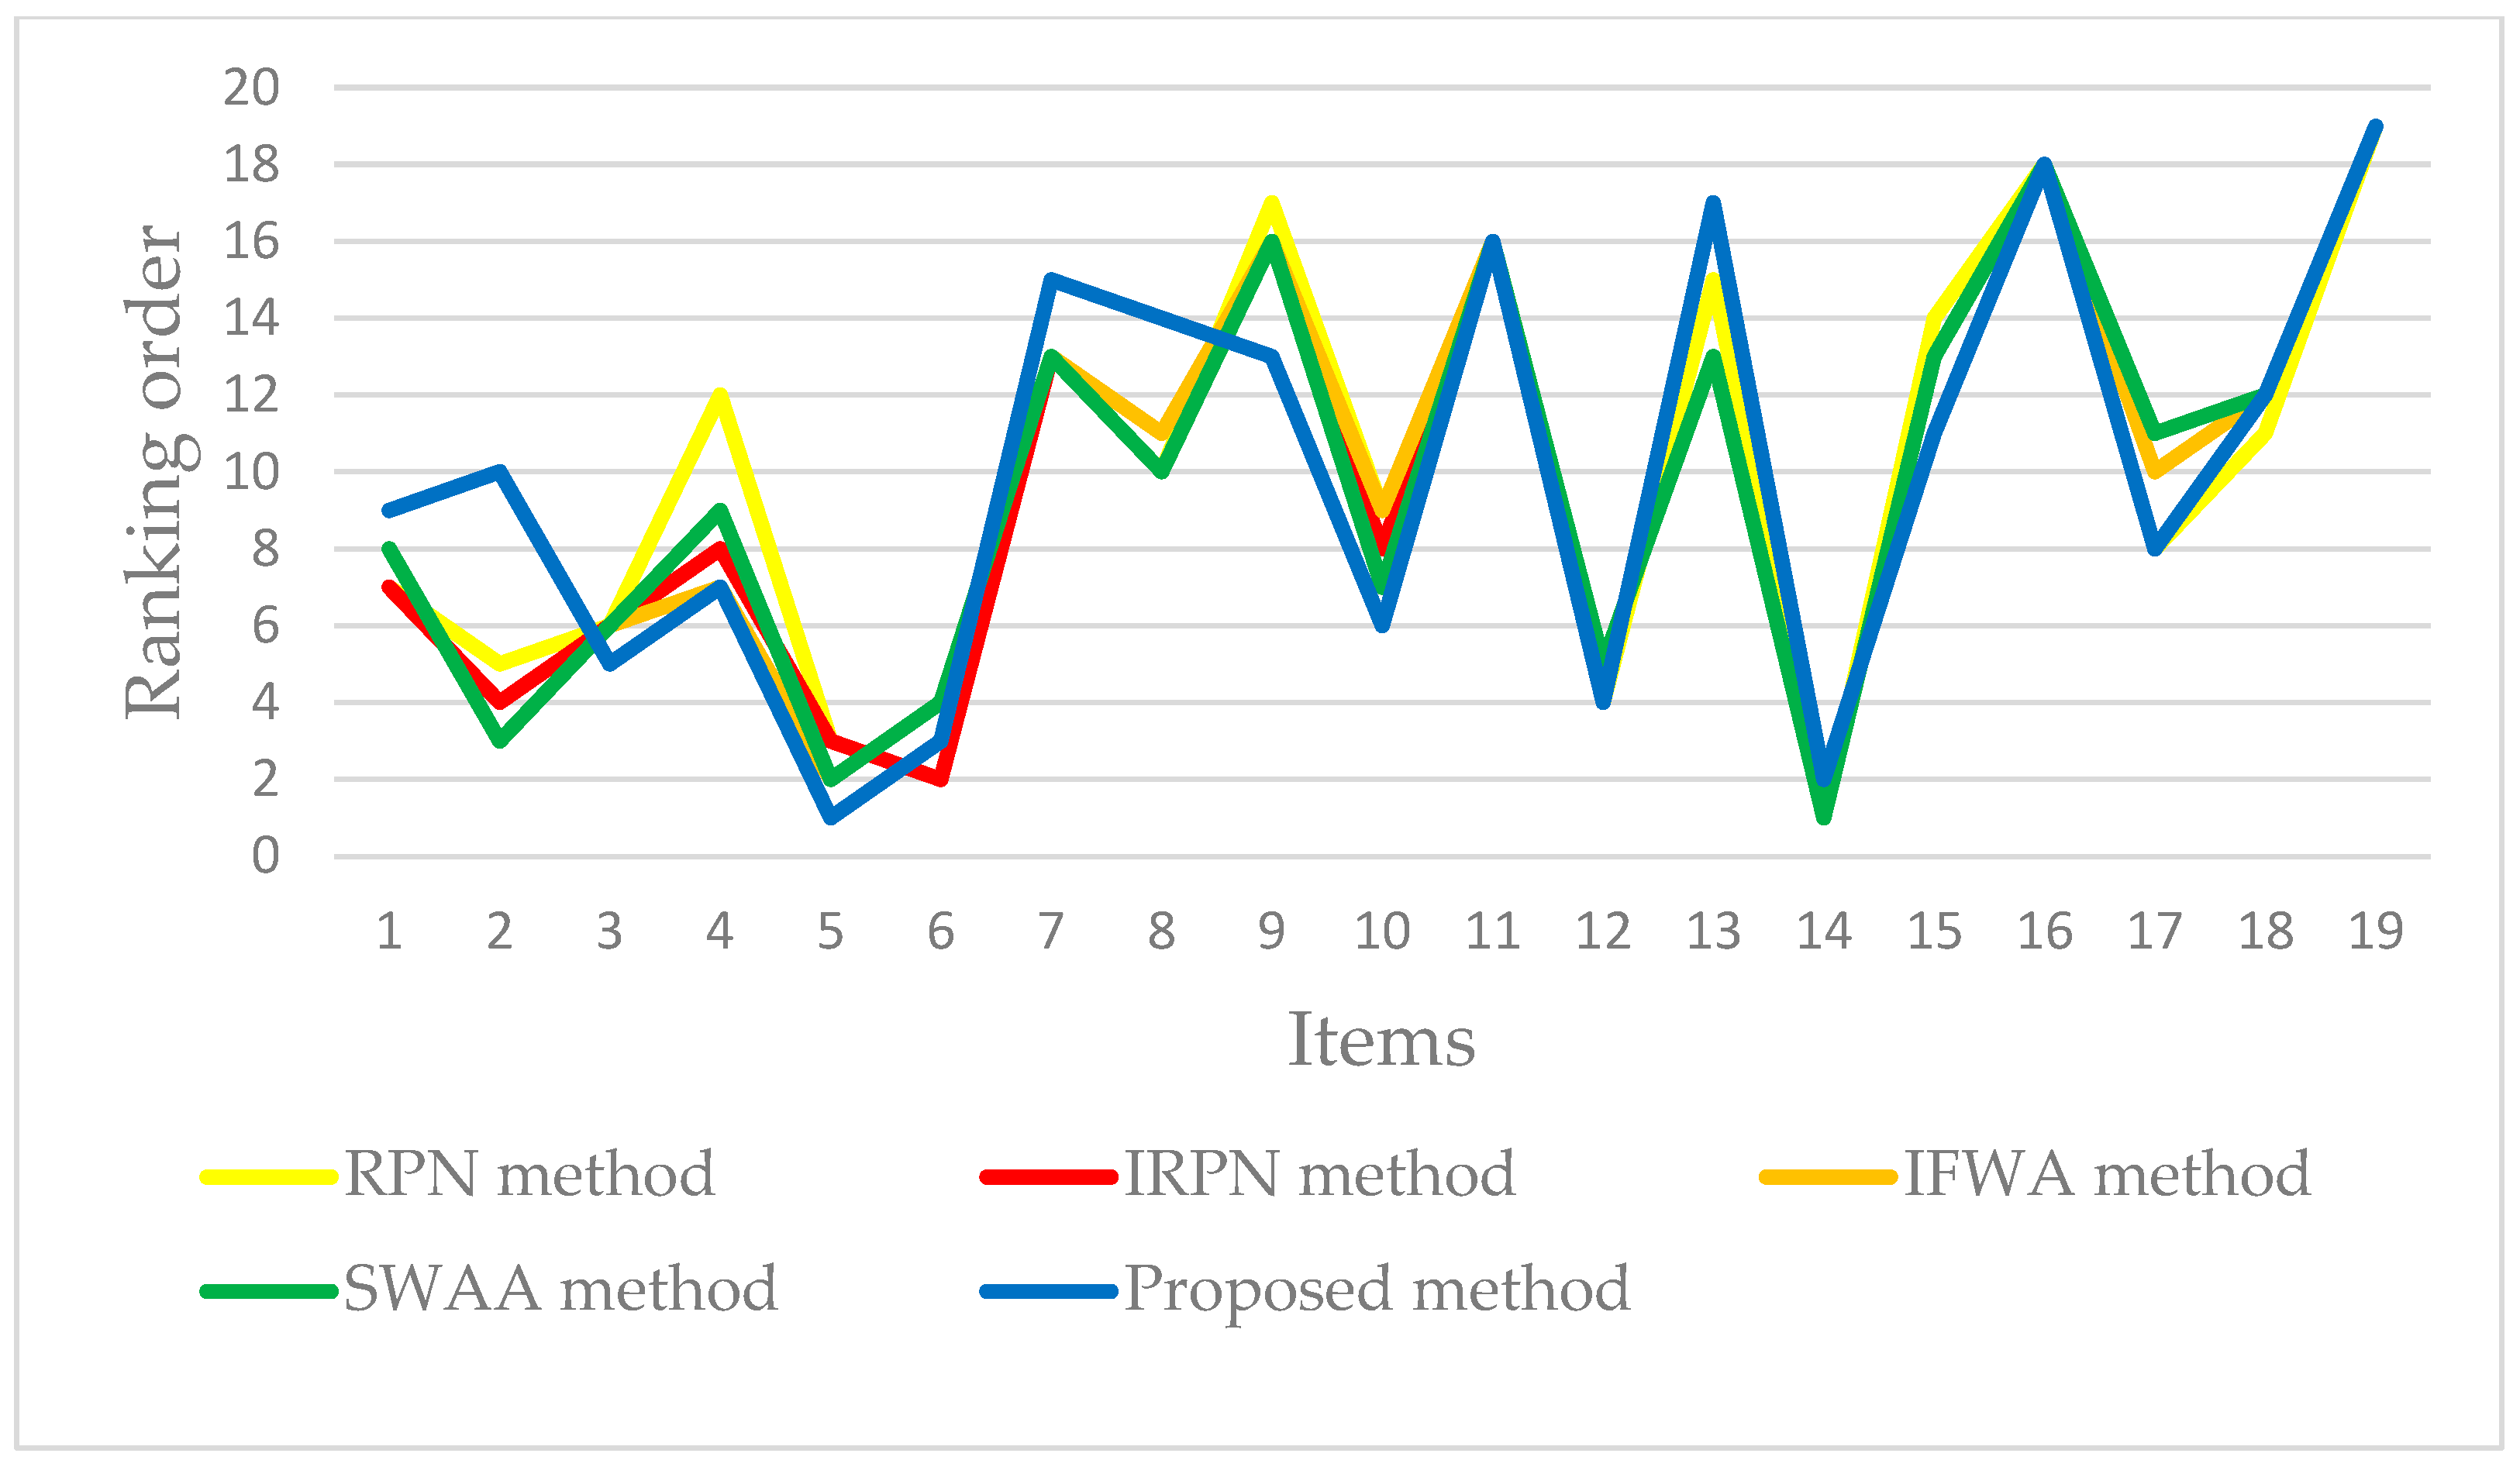
Section 4 presents a risk assessment numerical example of a new electronic equipment product design and compares the calculation results of the RPN, improved risk priority number (IRPN) method, intuitionistic fuzzy weighted average (IFWA) method, SWAA method, and proposed method. Section 5 presents the conclusions and future research directions.

2. Preliminaries

Here, we briefly review some of the basic definitions, concepts, and algorithm rules of the RPN method, SWAA method, and PSI method.

2.1. Risk Priority Number Method

At present, failure mode and effect analysis (FMEA) is the most commonly used risk assessment method by different industries; this method originated in the aerospace industry in the 1950s and has been widely used within different industries since [40]. The FMEA approach uses the RPN value to rank the possible failure risks. The RPN value is the product of three risk factors with equal weights: severity (Sev), occurrence (Occ), and detection (Det). The RPN value is calculated using Equation (1).
R P N = S e v × O c c × D e t
The risk factor Sev represents the severity of the failure occurrence, Occ is the probability of the failure occurrence, and Det is the probability that a failure occurrence cannot be detected. These risk factors, Sev, Occ, and Det, use risk assessment ratings of 1–10. The potential failure mode (FM) has a higher RPN value, which means that this FM has a higher risk of failure, and a higher risk priority must be given to prevent the occurrence of such failures.

2.2. Spherical Fuzzy Set Method

The intuitionistic FS is the basis of the spherical FS. The basic principles related to the intuitionistic FS and the calculation rules are described as follows:
Definition 1
[41]. Assuming that X is the universe of discourse. Then, an intuitionistic FS I in X and the IFWA are expressed as follows:
I = x , μ I x , ν I x x X
where  μ I x  and  ν I x  represent the MD and NMD, respectively, and  μ I x  and  ν I x [ 0,1 ]  satisfy the condition  μ I x + ν I x 1 .
I F W A I 1 , I 2 , , I n = 1 g = 1 n ( 1 μ g x ) w g , g = 1 n ν g w g
where  w g  represents the weight of  I g w g [ 0,1 ]  and  g = 1 n w g = 1 .
The score value of the intuitionistic FS is defined as follows:
S c o r e I = μ I x ν I x
Mahmood et al. [25] used a three-dimensional FS mode by extending the concepts of the FS, intuitionistic FS, and Pythagorean FS to propose a spherical FS for processing the MCDM problems under uncertain conditions. The basic principles related to the spherical FS and the calculation rules are described as follows.
Definition 2
[42]. Assuming that X is the universe of discourse, then, a spherical FS S in X is defined as follows:
S = x , μ S x , π S x , ν S x x X
where the  μ S x π S x , and  ν S x  represent the MD, ID, and NMD, and  μ S x π S x , and  ν S x [ 0,1 ]  satisfy the condition  0 μ S x 2 + π S x 2 + ν S x 2 1 .
The refusal degree ( R S ( x ) ) can be expressed as follows:
R S x = 1 μ S x 2 π S x 2 ν S x 2
Definition 3
[42,43]. Supposing that the  S 1 = μ S 1 x , π S 1 x , ν S 1 x  and  S 2 = μ S 2 x , π S 2 x , ν S 2 x  are any two spherical FSs, the basic algorithm rules of the spherical FSs are as follows:
S 1 S 2 = μ S 1 2 + μ S 2 2 μ S 1 2 · μ S 2 2 , 1 μ S 2 2 · π S 1 2 + 1 μ S 1 2 · π S 2 2 π S 1 2 · π S 2 2 , ν S 1 · ν S 2
S 1 S 2 = μ S 1 · μ S 2 , ( 1 ν S 2 2 ) · π S 1 2 + ( 1 ν S 1 2 ) · π S 2 2 π S 1 2 · π S 2 2 , ν S 1 2 + ν S 2 2 ν S 1 2 · ν S 2 2
k S 1 = 1 ( 1 μ S 1 2 ) k , ( 1 μ S 1 2 ) k ( 1 μ S 1 2 π S 1 2 ) k , ν S 1 k ;   k > 0
S 1 k = μ S 1 k , ( 1 ν S 1 2 ) k ( 1 ν S 1 2 π S 1 2 ) k , 1 ( 1 ν S 1 2 ) k ;   k > 0
Definition 4
[43]. Let  S g = μ S x , π S x , ν S x  be the spherical FS and  w g  represent the weights of  S g w g [ 0,1 ]  and  g = 1 n w g = 1 . The spherical weighted arithmetic average (SWAA) is defined as:
S W A A S 1 , S 2 , , S n = g = 1 n w g S g = 1 g = 1 n ( 1 μ g 2 ) w g , g = 1 n ( 1 μ g 2 ) w g g = 1 n ( 1 μ g 2 π g 2 ) w g , g = 1 n ν g w g
Definition 5
[43]. Let  S g = μ S x , π S x , ν S x  be the spherical FS and  w g  represent the weight of  S g w g [ 0,1 ]  and  g = 1 n w g = 1 . The spherical weighted geometric average (SWGA) is defined as:
S W G A S 1 , S 2 , , S n = g = 1 n S g w g = g = 1 n μ g w g , g = 1 n ( 1 ν g 2 ) w g g = 1 n ( 1 ν g 2 π g 2 ) w g , 1 g = 1 n ( 1 ν g 2 ) w g
Definition 6
[28,43]. Let  S g = μ S x , π S x , ν S x  be the spherical FS,  μ S x π S x , and  ν S x [ 0,1 ]  , then the score and accuracy values are defined as follows:
S c o r e S = μ S π S 2 υ S π S 2
A c c u r a c y S = μ S 2 + π S 2 + ν S 2
Definition 7
[1,28]. The comparison rules of the two spherical FSs,  S 1 = μ S 1 x , π S 1 x , ν S 1 x  and  S 2 = μ S 2 x , π S 2 x , ν S 2 x , are defined as follows.
(1)
If  S c o r e S 1 > S c o r e S 2 , then  S 1 > S 2 ;
(2)
if  S c o r e S 1 = S c o r e S 2 , and  A c c u r a c y S 1 > A c c u r a c y S 2 , then  S 1 > S 2 ;
(3)
if  S c o r e S 1 = S c o r e S 2 , and  A c c u r a c y S 1 = A c c u r a c y S 2 , then  S 1 = S 2 .

2.3. The Preference Selection Index (PSI) Method

The PSI approach was first introduced by Maniya and Bhatt [44]; in this approach, statistical concepts are used to calculate the overall preference value of the assessment factors and then process the material selection issues. The algorithm program of the PSI approach is as follows:
(1)
Create an initial decision matrix,  x i j :
The  x i j  values represent the values of the ith alternative and jth decision criterion.  i = 1 , 2 , , m , and  j = 1 , 2 , , n .
x i j = x 11 x 12 x 1 n x 21 x 22 x 2 n x m 1 x m 2 x m n
(2)
The decision matrix is normalized as,  N i j :
N i j = x i j x j m a x ,   for   the   profit   decision   criteria
N i j = x j m i n x i j ,   for   the   cost   decision   criteria
(3)
The preference variation value  P V j  is calculated as:
P V j = i = 1 m ( N i j N j ) 2 ,   N j = 1 m i = 1 m N i j
(4)
The overall preference value  O P j  is calculated as:
O P j = 1 P V j n j = 1 n P V j
(5)
The preference selection value  P S i  is calculated as:
P S i = j = 1 n N i j × O P j

3. Proposed Novel Flexible Risk-Ranking Approach

Failure risk analysis is a crucial factor in product design and manufacturing processes. FMEA is the most commonly and widely used risk assessment method and is used as a different industry standard. It is a systematic, structured approach to risk assessment and uses RPN values to rank the risks of the FM. In product or system failure risk assessment, two main factors need to be considered: the information for the evaluation and the objective weighting considerations of the risk factors that are presented by the data themselves. However, the RPN method cannot process intuitionistic and spherical fuzzy information, nor does it consider the objective weighting of the risk factors that are presented by the data. Moreover, the calculation mode of an RPN method violates the definition of the measurement scale. To solve the restrictions of the RPN method, this study integrated the spherical FS and an objective weight consideration of the risk factors to process these risk-ranking issues. The proposed method uses the MD, ID, and NMD of the spherical FS to represent the assessment information of the risk factors. Thus, the proposed novel, flexible risk-ranking approach can process fuzzy, intuitionistic fuzzy, and spherical fuzzy information simultaneously and can fully consider various types of information. The proposed novel, flexible risk-ranking approach used the PSI approach to calculate the objective weights of the risk factors and the SWAA method to obtain the aggregation values of the risk factors, which solves the problem of the RPN method violating the definition of the measurement scale.
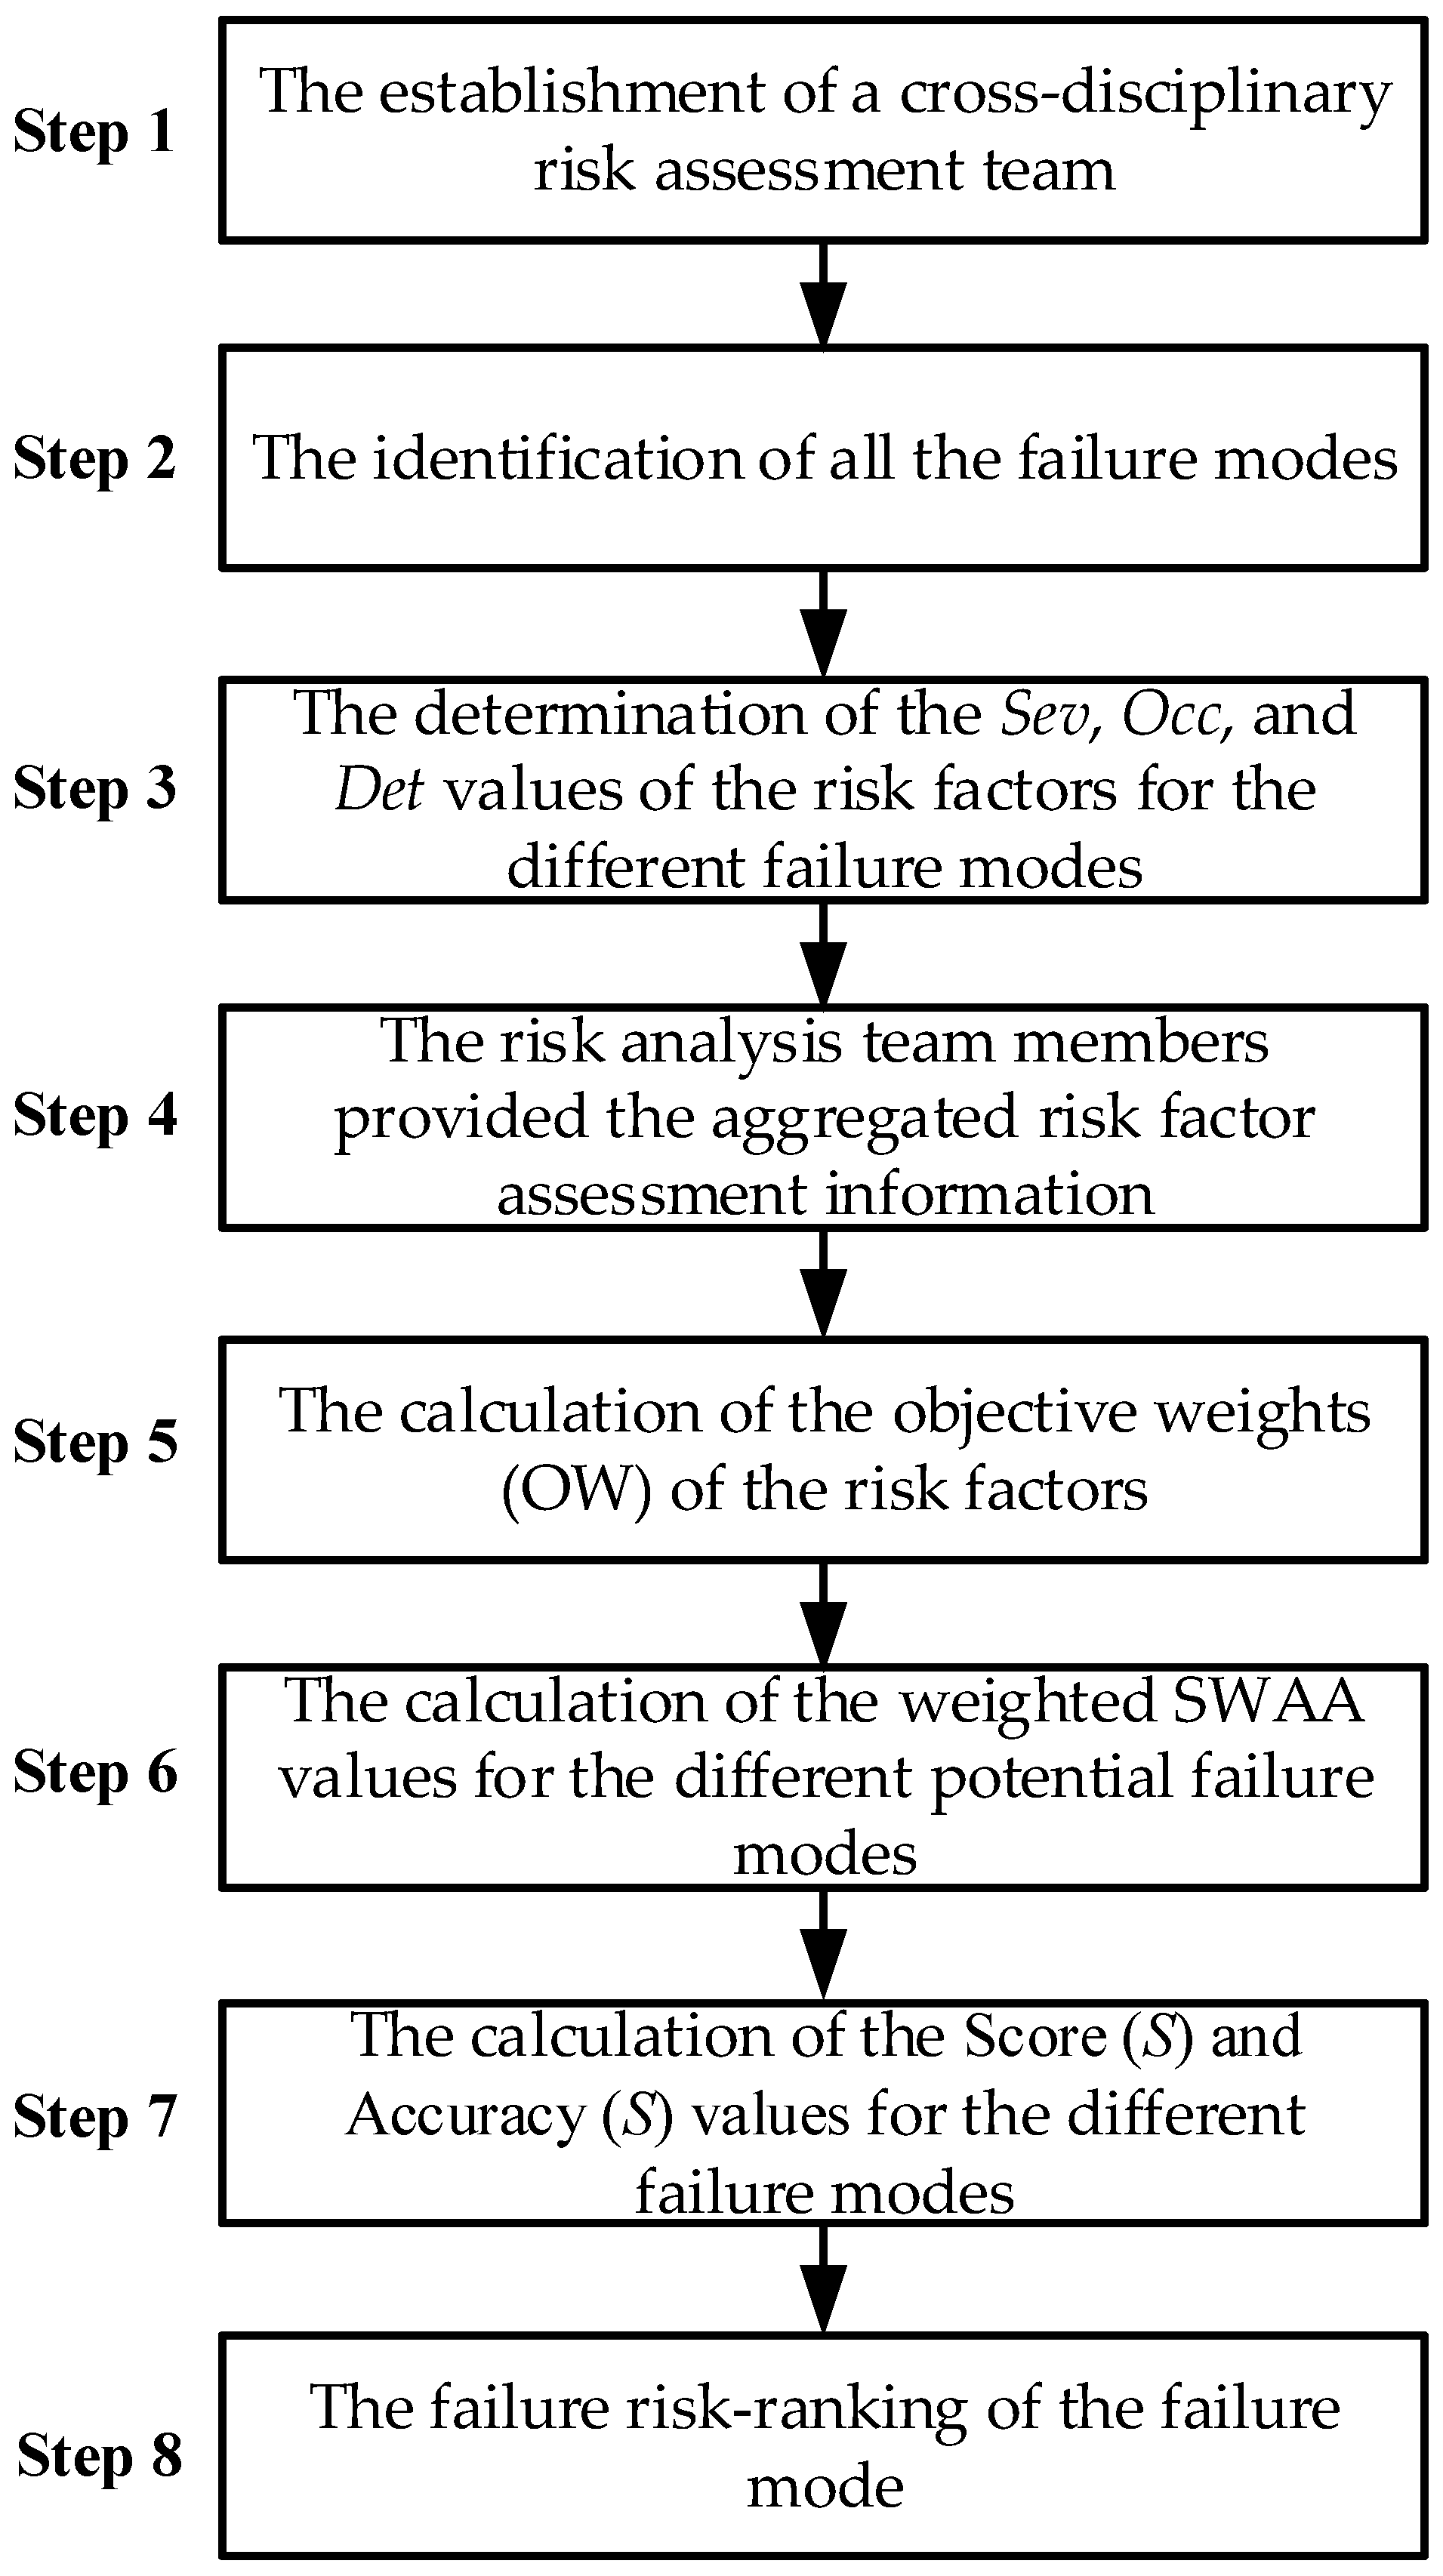
The proposed method can be broadly divided into eight steps (as shown in Figure 1), as follows.
  • Step 1. The establishment of a cross-disciplinary risk assessment team.
This was achieved based on their respective professional backgrounds.
  • Step 2. The identification of all the failure modes.
The risk analysis team members had a discussion to identify all the possible potential FMs based on the risk topic being evaluated.
  • Step 3. The determination of the Sev, Occ, and Det values of the risk factors for the different failure modes.
The risk analysis team members, according to their professional experience and background, determined the Sev, Occ, and Det values of the risk factors for the different FMs.
  • Step 4. The risk analysis team members provided the aggregated risk factor assessment information.
Based on the data from Step 3, Equation (11) was used to aggregate the assessment information of the risk factors that were provided by the risk analysis team members.
  • Step 5. The calculation of the objective weights (OW) of the risk factors.
Based on the data from Step 4, Equations (15)–(18) were used to calculate the preference variation value ( P V j ). Then, Equation (19) was used to calculate the overall preference value ( O P j ).
Based on the overall preference value ( O P j ), Equation (21) was used to calculate the objective weights ( O W j ) of the risk factors.
O W j = μ j π j 2 υ j π j 2 j = 1 3 μ j π j 2 υ j π j 2
  • Step 6. The calculation of the weighted SWAA values for the different potential failure modes.
Based on the data from Steps 4 and 5, Equation (11) was used to calculate the weighted SWAA values of the different FMs.
  • Step 7. The calculation of the  S c o r e S  and  A c c u r a c y S  values for the different failure modes.
Based on the data from Step 6, Equations (13) and (14) were used to calculate the  S c o r e S  and  A c c u r a c y S  values of the different FMs, respectively.
  • Step 8. The failure risk-ranking of the failure mode.
The failure risk of the FM was ranked according to the  S c o r e S  and  A c c u r a c y S  values.

4. Numerical Example

4.1. Case Overview

The completeness of the information considerations and the rationality of the evaluation results of the proposed novel, flexible risk-ranking approach were verified in this study by using the new product design of electronic equipment as a numerically validated case (adapted from [45]). The new product design for electronic equipment requires a risk assessment, avoiding a product failure with limited resources and instantly completing the system design within the specification constraints specified by the customer. The risk analysis assessment team for electronic equipment includes three domain experts (DE1, DE2, and DE3) in engineering and electronic design. The main goal of the risk analysis assessment team is to confirm the possible failure risk items in the product design process of the electronic equipment, correctly sort the risk-ranking of the potential FM, and allocate resources under the limited resources in the best possible way to prevent the occurrence of risks. The relationship between the linguistic terms and spherical fuzzy numbers within the new product design of an electronic equipment case is shown in Table 1, according to which, the domain experts are given these linguistic terms based on the different potential FMs, the results of which are shown in Table 2.

4.2. Solution with the Risk Priority Number Approach

The RPN approach [2] uses the RPN value to rank the possible failure risks. The RPN value is the product of the three equal weighted risk factors: Sev, Occ, and Det. The higher the RPN value that is represented, the higher the risk level of the FM, and it must be given a higher risk prevention priority to prevent the occurrence of this FM. However, the RPN method can only handle the MD information of the FM. As shown in Table 1 and Table 2, Equation (1) was used to calculate the RPN value of the electronic equipment new product design failure, and the results are expressed in Table 3.

4.3. Solution with the Improved Risk Priority Number Method

To solve the problem of the RPN method violating the definition of the measurement scale, the improved risk priority number (IRPN) [46] is used as the sum of the Sev, Occ, and Det risk factors to estimate the IRPN value. The IRPN method is the same as the RPN approach and can only process the MD information of the FM. According to Table 1 and Table 2, the sum of Sev, Occ, and Det risk factors was used to calculate the IRPN value for the electronic equipment new product design failure, and the results are expressed in Table 4.

4.4. Solution with the Intuitionistic Fuzzy Weighted Average Method

The intuitionistic fuzzy weighted average (IFWA) method [41] can simultaneously consider the MD and NMD in the risk assessment problem of the new product design of the electronic equipment. According to Table 1 and Table 2, Equations (3) and (4) were used to calculate the IFWA and score values for the electronic equipment new product design failure, and results are expressed in Table 5.

4.5. Solution with the Spherical Weighted Arithmetic Average Method

The spherical weighted arithmetic average (SWAA) method [43] can simultaneously consider the MD, ID, and NMD of the new product design of the electronic equipment. As mentioned in Table 1 and Table 2, Equation (11) was used to aggregate the evaluation opinions of the different domain experts on the risk factors Sev, Occ, and Det. Then, Equations (11), (13) and (14) were used to calculate the SWAA, score, and accuracy values for the electronic equipment new product design failure, and the results are expressed in Table 6.

4.6. Solution with the Proposed Novel Flexible Risk-Ranking Approach

To solve the restrictions of the typical risk assessment approach in its information processing and objective weighting considerations, the proposed method integrates the spherical FS and considers the objective weights of the risk factors to process the risk-ranking issues. The proposed novel, flexible approach is implemented in eight distinct steps, as described below. The process first must establish a cross-disciplinary risk assessment team, identify all the potential FMs, and determine the Ser, Occ, and Det values of the risk factors for the different potential FMs (Steps 1–3).
Step 4. The risk analysis team members provided the aggregated risk factor assessment information.
Based on Table 1 and Table 2, Equation (11) was used to aggregate the evaluation opinions of the different domain experts on the risk factors Sev, Occ, and Det, and the results are expressed in Table 7.
  • Step 5. The calculation of the objective weights (OW) of the risk factors.
Based on the data from Step 4, Equations (15)–(18) were used to calculate the preference variation value ( P V j ), as given below:
P V S e v = ( 0.670 , 0.192 , 0.607 ) ;   P V O c c = ( 0.126 , 0.106 , 0.099 ) ;   P V D e t = ( 0.517 , 0.190 , 0.464 )
According to the preference variation value ( P V j ), Equation (19) was used to calculate the overall preference value ( O P j ), as given below:
O P S e v = ( 0.196 , 0.322 , 0.215 ) ;   O P O c c = ( 0.518 , 0.356 , 0.492 ) ;   O P D e t = ( 0.286 , 0.322 , 0.293 )
According to the overall preference value ( O P j ), Equation (21) was used to calculate the objective weights ( O W j ) of the risk factors, as given below:
O W S e v = 0.353 ;   O W O c c = 0.612 ;   O W D e t = 0.035
  • Step 6. The weighted SWAA values for the different potential failure modes were calculated.
Based on the data from Steps 4 and 5, Equation (11) was used to calculate the weighted SWAA values of the different potential FMs; the results are expressed in Table 7.
  • Step 7. The calculation of the  S c o r e S  and  A c c u r a c y S  values for the different failure modes.
Based on the data from Step 6, Equations (13) and (14) were used to calculate the  S c o r e S  and  A c c u r a c y S  values of the different potential FMs, respectively, and the results are expressed in Table 7.
  • Step 8. The failure risk-ranking of the failure mode.
According to the  S c o r e S  and  A c c u r a c y S  values, the comparison rules of the spherical FS (Definition 7) were applied to the failure risk-ranking of the potential FM, and the results are expressed in Table 7.

4.7. Comparison between Different Methods

In order to verify the comprehensiveness and effectiveness of the proposed novel, flexible risk-ranking approach in the information processing and weight processing of the risk-ranking problem, Section 4 adopts a risk assessment case of the new product design of electronic equipment to verify and compare its calculation results with the RPN method, IRPN method, IFWA method, and SWAA method. These five calculation methods were calculated using the same input data (Table 1 and Table 2). After the calculation, the risk-ranking results of the different calculation methods for the potential FMs are expressed in Table 8 and Figure 2. The main differences in the factors considered by the five different calculation approaches are expressed in Table 9.
According to the contents of Table 3, Table 4, Table 5, Table 6, Table 7, Table 8 and Table 9, the primary advantages of the proposed novel, flexible risk-ranking approach over the other calculation methods are as follows. Firstly, its information consideration is an advantage; both the RPN method and IRPN method can only process the MD information of a potential FM, and cannot handle the ID and refusal degree information, while the IFWA method can effectively grasp the intuitionistic fuzzy information that is provided by the experts on the risk factors (MD, ID, and NMD information of a potential FM). However, the IFWA method still cannot effectively deal with the spherical fuzzy information (MD, ID, NMD, and refusal degree information of a potential FM) that is provided by the experts on the risk factors. The SWAA method and the proposed method can simultaneously process the MD, ID, NMD, and refusal degree information of a potential FM and can fully consider various types of information.
Secondly, its measurement scale consideration is also advantageous. The attributes of the data distinguish the different measurement scales. The measurement scale includes the nominal scale, ordinal scale, interval scale, and ratio scale. The data attributes of the risk factors belong to the ordinal scale, and the geometric mean cannot be used for calculation. The RPN method uses the concept of the Ser, Occ, and Det risk factor products for its calculation; this violates the definition of the measurement scale and leads to biased risk-ranking results. The IRPN, IFWA, SWAA, and the proposed novel, flexible risk-ranking approach can fully consider the definition of the data attribute measurement scale and apply a more reasonable calculation mode.
The other advantage is its objective weight consideration. The RPN, IRPN, IFWA, and SWAA methods ignore the objective weighting considerations of the risk factors that are presented by the data, which may lead to distortion of the risk-ranking results. The proposed novel approach used the PSI technique to calculate the objective weights of the different risk factors to truly reflect the significance of the data.

5. Conclusions

For any industry, risk analysis and risk prioritization are key issues. Maximizing the yield rate of products under limited resources will ensure the profitability of the company and the overall customer satisfaction. Risk analysis and risk ranking must be considered as the processing modes of the information evaluation and the relative weight of the risk factors. The lack of a comprehensive evaluation information consideration or ignoring the objective weighting of the risk factors can lead to incorrect evaluation results. However, most of the risk-ranking methods cannot simultaneously handle the comprehensive evaluation information consideration, measurement scale consideration, and relative weight of the risk factors, which causes biased risk-ranking results. This study proposed a novel, flexible risk-ranking approach to obtain rigorous and correct risk-ranking results; here, the spherical FS and objective weight considerations of the risk factors are integrated to process the risk-ranking issues.
The contributions of the proposed novel, flexible risk-ranking method are as follows:
(1)
The proposed novel, flexible risk-ranking method can grasp the information on the intuitionistic fuzzy evaluation of the risk factors,
(2)
The proposed novel, flexible risk-ranking method can grasp the information on the spherical fuzzy evaluation of the risk factors,
(3)
The proposed novel, flexible risk-ranking method considers the measurement scale of the data,
(4)
The proposed novel, flexible risk-ranking method considers the relative weights of the risk factors,
(5)
The IRPN, IFWA, and SWAA methods are special examples of the proposed novel, flexible risk-ranking method.
In the future, researchers can extend the concept of the proposed method to process different decision making problems such as performance evaluation, supplier selection, reliability evaluation, green energy planning, resource allocation, big data processing, and project management. In addition, future researchers can probe the impact of different subjective and objective weight combinations on their risk-ranking results.

Funding

The authors would like to thank the National Science and Technology Council, Taiwan, for financially supporting this research under Contract No. MOST 110-2410-H-145-001 and MOST 111-2221-E-145-003.

Institutional Review Board Statement

Not applicable.

Informed Consent Statement

Not applicable.

Data Availability Statement

Not applicable.

Conflicts of Interest

The author declares no conflict of interest.

References

  1. Chang, K.H. A new emergency-risk-evaluation approach under spherical fuzzy-information environments. Axioms 2022, 11, 474. [Google Scholar] [CrossRef]
  2. Romero-Zayas, I.; Anon, F.C.; Virosta, M.S.; del Pozo, J.C.; Montero, C.S.; Baizan, A.N.; Fuster, D. Implementation of the failure modes and effects analysis in a hospital radiopharmacy unit. Rev. Esp. Med. Nucl. Imagen Mol. 2022, 41, 300–310. [Google Scholar] [CrossRef]
  3. Chang, Y.C.; Chang, K.H.; Chen, C.Y. Risk assessment by quantifying and prioritizing 5S activity for semiconductor manufacturing. Proc. Inst. Mech. Eng. Part B J. Eng. Manuf. 2013, 227, 1874–1887. [Google Scholar] [CrossRef]
  4. Liu, J.W.; Wang, D.J.; Lin, Q.L.; Deng, M.K. Risk assessment based on FMEA combining DEA and cloud model: A case application in robot-assisted rehabilitation. Expert Syst. Appl. 2023, 214, 119119. [Google Scholar] [CrossRef]
  5. Wen, T.C.; Chung, H.Y.; Chang, K.H.; Li, Z.S. A flexible risk assessment approach integrating subjective and objective weights under uncertainty. Eng. Appl. Artif. Intell. 2021, 103, 104310. [Google Scholar] [CrossRef]
  6. Jiang, M.L.; Ren, H.P. Risk priority evaluation for power transformer parts based on intuitionistic fuzzy preference selection index method. Math. Probl. Eng. 2022, 2022, 8366893. [Google Scholar]
  7. Bhattacharjee, P.; Dey, V.; Mandal, U.K. Failure mode and effects analysis (FMEA) using interval number based BWM-MCDM approach: Risk expected value (REV) method. Soft Comput. 2022, 26, 12667–12688. [Google Scholar] [CrossRef]
  8. Chang, K.H. A novel risk ranking method based on the single valued neutrosophic set. J. Ind. Manag. Optim. 2022, 18, 2237–2253. [Google Scholar] [CrossRef]
  9. Chang, K.H.; Wen, T.C.; Chung, H.Y. Soft failure mode and effects analysis using the OWG operator and hesitant fuzzy linguistic term sets. J. Intell. Fuzzy Syst. 2018, 34, 2625–2639. [Google Scholar] [CrossRef]
  10. Chang, K.H.; Chung, H.Y.; Wang, C.N.; Lai, Y.D.; Wu, C.H. A new hybrid Fermatean fuzzy set and entropy method for risk assessment. Axioms 2023, 12, 58. [Google Scholar] [CrossRef]
  11. Yu, J.X.; Zeng, Q.Z.; Yu, Y.; Wu, S.B.; Ding, H.Y.; Ma, W.T.; Gao, H.T.; Yang, J. Failure mode and effects analysis based on rough cloud model and MULTIMOORA method: Application to single-point mooring system. Appl. Soft. Comput. 2023, 132, 109841. [Google Scholar] [CrossRef]
  12. Chang, K.H.; Wen, T.C. A novel efficient approach for DFMEA combining 2-tuple and the OWA operator. Expert Syst. Appl. 2010, 37, 2362–2370. [Google Scholar] [CrossRef]
  13. Song, W.Y.; Ming, X.G.; Wu, Z.Y.; Zhu, B.T. Failure modes and effects analysis using integrated weight-based fuzzy TOPSIS. Int. J. Comput. Integr. Manuf. 2013, 26, 172–1186. [Google Scholar] [CrossRef]
  14. Zadeh, L.A. Fuzzy sets. Inf. Control. 1965, 8, 338–353. [Google Scholar] [CrossRef] [Green Version]
  15. Atanassov, K.T. Intuitionistic fuzzy sets. Fuzzy Sets Syst. 1986, 20, 87–96. [Google Scholar] [CrossRef]
  16. Wang, W.M.; Lin, W.W.; Wen, Y.M.; Lai, X.Z.; Peng, P.; Zhang, Y.; Li, K.Q. An interpretable intuitionistic fuzzy inference model for stock prediction. Expert Syst. Appl. 2023, 213, 118908. [Google Scholar] [CrossRef]
  17. Chang, K.H. A novel supplier selection method that integrates the intuitionistic fuzzy weighted averaging method and a soft set with imprecise data. Ann. Oper. Res. 2019, 272, 139–157. [Google Scholar] [CrossRef]
  18. Deb, P.P.; Bhattacharya, D.; Chatterjee, I.; Saha, A.; Mishra, A.R.; Ahammad, S.H. A decision-making model with intuitionistic fuzzy information for selection of enterprise resource planning systems. IEEE Trans. Eng. Manag. 2022, 1–15, (Early Access). [Google Scholar] [CrossRef]
  19. Albaity, M.; Mahmood, T. Medical diagnosis and pattern recognition based on generalized dice similarity measures for managing intuitionistic hesitant fuzzy information. Mathematics 2022, 10, 2815. [Google Scholar] [CrossRef]
  20. Chang, K.H.; Cheng, C.H. A risk assessment methodology using intuitionistic fuzzy set in FMEA. Int. J. Syst. Sci. 2010, 41, 1457–1471. [Google Scholar] [CrossRef]
  21. Riaz, M.; Akmal, K.; Almalki, Y.; Ahmad, D. Cubic intuitionistic fuzzy topology with application to uncertain supply chain management. Math. Probl. Eng. 2022, 2022, 9631579. [Google Scholar] [CrossRef]
  22. Hussain, A.; Ullah, K.; Ahmad, J.; Karamti, H.; Pamucar, D.; Wang, H.L. Applications of the multiattribute decision-making for the development of the tourism industry using complex intuitionistic fuzzy Hamy mean operators. Comput. Intell. Neurosci. 2022, 2022, 8562390. [Google Scholar] [CrossRef] [PubMed]
  23. Ullah, K. Picture fuzzy maclaurin symmetric mean operators and their applications in solving multiattribute decision-making problems. Math. Probl. Eng. 2021, 2021, 1098631. [Google Scholar] [CrossRef]
  24. Yager, R.R. Pythagorean membership grades in multicriteria decision making. IEEE Trans. Fuzzy Syst. 2014, 22, 958–965. [Google Scholar] [CrossRef]
  25. Mahmood, T.; Ullah, K.; Khan, Q.; Jan, N. An approach toward decision-making and medical diagnosis problems using the concept of spherical fuzzy sets. Neural Comput. Appl. 2019, 31, 7041–7053. [Google Scholar] [CrossRef]
  26. Ghoushchi, S.J.; Bonab, S.R.; Ghiaci, A.M.; Haseli, G.; Tomaskova, H.; Hajiaghaei-Keshteli, M. Landfill site selection for medical waste using an integrated SWARA-WASPAS framework based on spherical fuzzy set. Sustainability 2021, 13, 13950. [Google Scholar] [CrossRef]
  27. Ali, J.; Naeem, M. Multi-criteria decision-making method based on complex t-spherical fuzzy Aczel-Alsina aggregation operators and their application. Symmetry 2023, 15, 85. [Google Scholar] [CrossRef]
  28. Akram, M.; Zahid, K.; Kahraman, C. A PROMETHEE based outranking approach for the construction of Fangcang shelter hospital using spherical fuzzy sets. Artif. Intell. Med. 2023, 135, 102456. [Google Scholar] [CrossRef]
  29. Li, Z.X.; Liu, A.J.; Miao, J.; Yang, Y. A three-phase method for spherical fuzzy environment and application to community epidemic prevention management. Expert Syst. Appl. 2023, 211, 118601. [Google Scholar] [CrossRef]
  30. Jin, Y.; Hussain, M.; Ullah, K.; Hussain, A. A new correlation coefficient based on T-spherical fuzzy information with its applications in medical diagnosis and pattern recognition. Symmetry 2022, 14, 2317. [Google Scholar] [CrossRef]
  31. Haseli, G.; Ghoushchi, S.J. Extended base-criterion method based on the spherical fuzzy sets to evaluate waste management. Soft Comput. 2022, 26, 9979–9992. [Google Scholar] [CrossRef]
  32. Alshammari, I.; Parimala, M.; Ozel, C.; Riaz, M. Spherical linear Diophantine fuzzy TOPSIS algorithm for green supply chain management system. J. Funct. Space 2022, 2022, 3136462. [Google Scholar] [CrossRef]
  33. Hussain, A.; Ullah, K.; Yang, M.S.; Pamucar, D. Aczel-Alsina aggregation operators on T-spherical fuzzy (TSF) information with application to TSF multi-attribute decision making. IEEE Access 2022, 10, 26011–26023. [Google Scholar] [CrossRef]
  34. Akram, M.; Ullah, K.; Pamucar, D. Performance evaluation of solar energy cells using the interval-valued T-spherical fuzzy Bonferroni mean operators. Energies 2022, 15, 292. [Google Scholar] [CrossRef]
  35. Chen, W.; Yang, B.; Liu, Y. An integrated QFD and FMEA approach to identify risky components of products. Adv. Eng. Inform. 2022, 54, 101808. [Google Scholar] [CrossRef]
  36. Liang, X.B.; Ma, W.F.; Ren, J.J.; Dang, W.; Wang, K.; Nie, H.L.; Cao, J.; Yao, T. An integrated risk assessment methodology based on fuzzy TOPSIS and cloud inference for urban polyethylene gas pipelines. J. Clean. Prod. 2022, 376, 134332. [Google Scholar] [CrossRef]
  37. Paramanik, A.R.; Sarkar, S.; Sarkar, B. OSWMI: An objective-subjective weighted method for minimizing inconsistency in multi-criteria decision making. Comput. Ind. Eng. 2022, 169, 108138. [Google Scholar] [CrossRef]
  38. Barukab, O.; Abdullah, S.; Ashraf, S.; Arif, M.; Khan, S.A. A new approach to fuzzy TOPSIS method based on entropy measure under spherical fuzzy information. Entropy 2019, 21, 1231. [Google Scholar] [CrossRef] [Green Version]
  39. Chang, K.H. Integrating subjective-objective weights consideration and a combined compromise solution method for handling supplier selection issues. Systems 2023, 11, 74. [Google Scholar] [CrossRef]
  40. Zhang, H.H.; Xu, Z.H.; Qian, H.; Su, X.Y. Failure mode and effects analysis based on Z-numbers and the graded mean integration representation. CMES-Comp. Model. Eng. Sci. 2023, 134, 1005–1019. [Google Scholar] [CrossRef]
  41. Liu, S.; Yu, W.; Liu, L.; Hu, Y.A. Variable weights theory and its application to multi-attribute group decision making with intuitionistic fuzzy numbers on determining decision maker’s weights. PLoS ONE 2019, 14, e0212636. [Google Scholar] [CrossRef] [PubMed]
  42. Mathew, M.; Chakrabortty, R.K.; Ryan, M.J. A novel approach integrating AHP and TOPSIS under spherical fuzzy sets for advanced manufacturing system selection. Eng. Appl. Artif. Intell. 2020, 96, 103988. [Google Scholar] [CrossRef]
  43. Gundogdu, F.K.; Kahraman, C. Spherical fuzzy sets and spherical fuzzy TOPSIS method. J. Intell. Fuzzy Syst. 2019, 36, 337–352. [Google Scholar] [CrossRef]
  44. Maniya, K.; Bhatt, M.G. A selection of material using a novel type decision-making method: Preference selection index method. Mater. Des. 2010, 31, 1785–1789. [Google Scholar] [CrossRef]
  45. Aguirre, P.A.G.; Perez-Dominguez, L.; Luviano-Cruz, D.; Noriega, J.J.S.; Gomez, E.M.; Callejas-Cuervo, M. PFDA-FMEA, an integrated method improving FMEA assessment in product design. Appl. Sci. 2021, 11, 1406. [Google Scholar] [CrossRef]
  46. Ciani, L.; Guidi, G.; Patrizi, G. A critical comparison of alternative risk priority numbers in failure modes, effects, and criticality analysis. IEEE Access 2019, 7, 92398–92409. [Google Scholar] [CrossRef]
Figure 1. The flowchart of the proposed method.
Applsci 13 04503 g001
Figure 2. The risk-ranking results of different calculation methods.
Applsci 13 04503 g002
Table 1. Relationship between the linguistic terms and spherical fuzzy numbers.
Linguistic Terms   μ S   π S   ν S
Extremely high impact (EH)0.950.100.20
Very high impact (VH)0.850.200.30
High impact (HI)0.750.300.40
Slightly high impact (SH)0.650.400.50
Medium impact (MI)0.550.500.60
Slightly low impact (SL)0.450.400.70
Low impact (LI)0.350.300.80
Very low impact (VL)0.250.200.85
Extremely low impact (EL)0.150.100.90
Extremely very low impact (EV)0.100.100.95
Table 2. Linguistic values of potential failure items given by experts. (FM: failure mode).
ItemsPotential Failure ModeSevOccDet
DE1DE2DE3DE1DE2DE3DE1DE2DE3
1Extremely limited launch time (FM1)MISLSLSLSLLISHSLSL
2Customer request changes (FM2)SLSLLISLSLLIEHEHVH
3Lack of aesthetic consideration (FM3)MISLMIMIMISLSHMIMI
4Product technical failure (FM4)HISHHIVLVLSLVLSLVL
5Design changes at the last minute (FM5)VHEHEHSLSLSLSLSLSL
6Poor product performance (FM6)VHHIVHMIMISLSHMIMI
7Manufacturing is not ready to start (FM7)SLSLLISLLILISLSLLI
8Insufficient manufacturing capacity (FM8)MISLMILIVLVLMISLMI
9Long lead times for materials (FM9)SLSLLISLSLLILILILI
10Potential market saturation (FM10)VLVLLISHMIMIMILIMI
11Failed test run (FM11)SLLISLLISLLILISLLI
12Customer sample failed (FM12)MISHMIMILIMISHMIMI
13Insufficient stock to start (FM13)LILILISLLISLSLSLSL
14Incorrect market analysis (FM14)VHHIVHMIMISLVHHIVH
15Unavailability of any new technology for development (FM15)LILISLSLSLSLSLLILI
16Environmental compliance not considered (FM16)LISLLISLLILILILISL
17New technologies in the manufacturing process (FM17)SHSLSLSLSLLISLLISL
18Lack of experts to develop products (FM18)SLLISLSLSLLILISLSL
19Poor quality raw materials (FM19)ELVLELELELLIVLELEL
Table 3. The RPN value of the electronic equipment new product design failure.
ItemsSevOccDetRPNRank
10.4830.4170.5170.1047
20.4170.4170.9170.1595
30.5170.5170.5830.1566
40.7170.3170.3170.07212
50.9170.4500.4500.1863
60.8170.5170.5830.2462
70.4170.3830.4170.06713
80.5170.2830.5170.07610
90.4170.4170.3500.06117
100.2830.5830.4830.0809
110.4170.3830.3830.06116
120.5830.4830.5830.1644
130.3500.4170.4500.06615
140.8170.5170.8170.3451
150.3830.4500.3830.06614
160.3830.3830.3830.05618
170.5170.4170.4170.0908
180.4170.4170.4170.07211
190.1830.2170.1830.00719
Table 4. The IRPN value of the electronic equipment new product design failure.
ItemsSevOccDetIRPNRank
10.4830.4170.5171.4177
20.4170.4170.9171.7504
30.5170.5170.5831.6176
40.7170.3170.3171.3508
50.9170.4500.4501.8173
60.8170.5170.5831.9172
70.4170.3830.4171.21713
80.5170.2830.5171.31711
90.4170.4170.3501.18316
100.2830.5830.4831.3508
110.4170.3830.3831.18316
120.5830.4830.5831.6505
130.3500.4170.4501.21713
140.8170.5170.8172.1501
150.3830.4500.3831.21713
160.3830.3830.3831.15018
170.5170.4170.4171.3508
180.4170.4170.4171.25012
190.1830.2170.1830.58319
Table 5. The IFWA value of the electronic equipment new product design failure.
ItemsSevOccDetIFWA S c o r e I Rank
1(0.486, 0.514)(0.419, 0.581)(0.527, 0.473)(0.479, 0.521)−0.0428
2(0.419, 0.581)(0.419, 0.581)(0.928, 0.072)(0.710, 0.290)0.4203
3(0.519, 0.481)(0.519, 0.481)(0.586, 0.414)(0.542, 0.458)0.0856
4(0.720, 0.280)(0.324, 0.676)(0.324, 0.676)(0.496, 0.504)−0.0087
5(0.928, 0.072)(0.450, 0.550)(0.450, 0.550)(0.721, 0.279)0.4412
6(0.822, 0.178)(0.519, 0.481)(0.586, 0.414)(0.672, 0.328)0.3434
7(0.419, 0.581)(0.385, 0.615)(0.419, 0.581)(0.408, 0.592)−0.18513
8(0.519, 0.481)(0.285, 0.715)(0.519, 0.481)(0.451, 0.549)−0.09811
9(0.419, 0.581)(0.419, 0.581)(0.350, 0.650)(0.397, 0.603)−0.20716
10(0.285, 0.715)(0.586, 0.414)(0.491, 0.509)(0.468, 0.532)−0.0649
11(0.419, 0.581)(0.385, 0.615)(0.385, 0.615)(0.397, 0.603)−0.20716
12(0.586, 0.414)(0.491, 0.509)(0.586, 0.414)(0.557, 0.443)0.1135
13(0.350, 0.650)(0.419, 0.581)(0.450, 0.550)(0.408, 0.582)−0.18513
14(0.822, 0.172)(0.519, 0.481)(0.822, 0.178)(0.752, 0.248)0.5041
15(0.385, 0.615)(0.450, 0.550)(0.385, 0.615)(0.408, 0.592)−0.18513
16(0.385, 0.615)(0.385, 0.615)(0.385, 0.615)(0.385, 0.615)−0.23018
17(0.527, 0.473)(0.419, 0.581)(0.419, 0.581)(0.457, 0.543)−0.08610
18(0.419, 0.581)(0.419, 0.581)(0.419, 0.581)(0.419, 0.581)−0.16312
19(0.185, 0.815)(0.223, 0.777)(0.185, 0.815)(0.198, 0.802)−0.60519
Table 6. The SWAA, score, and accuracy values of the electronic equipment new product design failure.
ItemsSevOccDetSWAA S c o r e S A c c u r a c y S Rank
1(0.487, 0.443, 0.665)(0.420, 0.373, 0.732)(0.533, 0.403, 0.626)(0.484, 0.409, 0.673)−0.0640.8548
2(0.420, 0.373, 0.732)(0.420, 0.373, 0.732)(0.928, 0.127, 0.229)(0.739, 0.263, 0.497)0.1720.8623
3(0.520, 0.475, 0.632)(0.520, 0.475, 0.632)(0.587, 0.467, 0.565)(0.544, 0.473, 0.608)−0.0130.8906
4(0.721, 0.332, 0.431)(0.334, 0.296, 0.797)(0.334, 0.296, 0.797)(0.526, 0.324, 0.649)−0.0650.8039
5(0.928, 0.127, 0.229)(0.450, 0.400, 0.700)(0.450, 0.400, 0.700)(0.745, 0.278, 0.482)0.1770.8652
6(0.823, 0.231, 0.330)(0.520, 0.475, 0.632)(0.587, 0.467, 0.565)(0.681, 0.382, 0.490)0.0780.8504
7(0.420, 0.373, 0.732)(0.387, 0.341, 0.765)(0.420, 0.373, 0.732)(0.410, 0.363, 0.743)−0.1420.85113
8(0.520, 0.475, 0.632)(0.288, 0.240, 0.833)(0.520, 0.475, 0.632)(0.461, 0.431, 0.693)−0.0680.87810
9(0.420, 0.373, 0.732)(0.420, 0.373, 0.732)(0.350, 0.300, 0.800)(0.399, 0.352, 0.754)−0.1590.85116
10(0.288, 0.240, 0.833)(0.587, 0.467, 0.565)(0.497, 0.461, 0.660)(0.482, 0.424, 0.677)−0.0610.8717
11(0.420, 0.373, 0.732)(0.387, 0.341, 0.765)(0.387, 0.341, 0.765)(0.399, 0.352, 0.754)−0.1590.85116
12(0.587, 0.467, 0.565)(0.497, 0.461, 0.660)(0.587, 0.467, 0.565)(0.560, 0.466, 0.595)−0.0080.8855
13(0.350, 0.300, 0.800)(0.420, 0.373, 0.732)(0.450, 0.400, 0.700)(0.410, 0.363, 0.743)−0.1420.85113
14(0.823, 0.231, 0.330)(0.520, 0.475, 0.632)(0.823, 0.231, 0.330)(0.759, 0.303, 0.410)0.1970.8361
15(0.387, 0.341, 0.765)(0.450, 0.400, 0.700)(0.387, 0.341, 0.765)(0.410, 0.363, 0.743)−0.1420.85113
16(0.387, 0.341, 0.765)(0.387, 0.341, 0.765)(0.387, 0.341, 0.765)(0.387, 0.341, 0.765)−0.1780.85218
17(0.533, 0.403, 0.626)(0.420, 0.373, 0.732)(0.420, 0.373, 0.732)(0.463, 0.385, 0.695)−0.0900.84511
18(0.420, 0.373, 0.732)(0.420, 0.373, 0.732)(0.420, 0.373, 0.732)(0.420, 0.373, 0.732)−0.1260.85212
19(0.190, 0.143, 0.883)(0.239, 0.199, 0.865)(0.190, 0.143, 0.883)(0.208, 0.164, 0.877)−0.5060.83919
Table 7. The weighted SWAA, score, and accuracy values of the proposed method.
ItemsSevOccDetWeighted SWAA S c o r e S A c c u r a c y S Rank
1(0.487, 0.443, 0.665)(0.420, 0.373, 0.732)(0.533, 0.403, 0.626)(0.450, 0.403, 0.704)−0.0880.8609
2(0.420, 0.373, 0.732)(0.420, 0.373, 0.732)(0.928, 0.127, 0.229)(0.476, 0.360, 0.703)−0.1040.85010
3(0.520, 0.475, 0.632)(0.520, 0.475, 0.632)(0.587, 0.467, 0.565)(0.523, 0.475, 0.629)−0.0210.8955
4(0.721, 0.332, 0.431)(0.334, 0.296, 0.797)(0.334, 0.296, 0.797)(0.534, 0.325, 0.641)−0.0560.8027
5(0.928, 0.127, 0.229)(0.450, 0.400, 0.700)(0.450, 0.400, 0.700)(0.755, 0.272, 0.472)0.1940.8671
6(0.823, 0.231, 0.330)(0.520, 0.475, 0.632)(0.587, 0.467, 0.565)(0.675, 0.378, 0.500)0.0730.8493
7(0.420, 0.373, 0.732)(0.387, 0.341, 0.765)(0.420, 0.373, 0.732)(0.401, 0.354, 0.752)−0.1560.85115
8(0.520, 0.475, 0.632)(0.288, 0.240, 0.833)(0.520, 0.475, 0.632)(0.401, 0.375, 0.748)−0.1380.86114
9(0.420, 0.373, 0.732)(0.420, 0.373, 0.732)(0.350, 0.300, 0.800)(0.418, 0.371, 0.734)−0.1300.85213
10(0.288, 0.240, 0.833)(0.587, 0.467, 0.565)(0.497, 0.461, 0.660)(0.509, 0.427, 0.651)−0.0440.8656
11(0.420, 0.373, 0.732)(0.387, 0.341, 0.765)(0.387, 0.341, 0.765)(0.399, 0.353, 0.753)−0.1580.85116
12(0.587, 0.467, 0.565)(0.497, 0.461, 0.660)(0.587, 0.467, 0.565)(0.535, 0.464, 0.621)−0.0200.8884
13(0.350, 0.300, 0.800)(0.420, 0.373, 0.732)(0.450, 0.400, 0.700)(0.399, 0.352, 0.754)−0.1590.85117
14(0.823, 0.231, 0.330)(0.520, 0.475, 0.632)(0.823, 0.231, 0.330)(0.684, 0.370, 0.491)0.0840.8462
15(0.387, 0.341, 0.765)(0.450, 0.400, 0.700)(0.387, 0.341, 0.765)(0.427, 0.380, 0.725)−0.1170.85211
16(0.387, 0.341, 0.765)(0.387, 0.341, 0.765)(0.387, 0.341, 0.765)(0.387, 0.341, 0.765)−0.1780.85218
17(0.533, 0.403, 0.626)(0.420, 0.373, 0.732)(0.420, 0.373, 0.732)(0.465, 0.386, 0.692)−0.0880.8458
18(0.420, 0.373, 0.732)(0.420, 0.373, 0.732)(0.420, 0.373, 0.732)(0.420, 0.373, 0.732)−0.1260.85212
19(0.190, 0.143, 0.883)(0.239, 0.199, 0.865)(0.190, 0.143, 0.883)(0.221, 0.180, 0.872)−0.4780.84219
Table 8. The risk-ranking results of different calculation methods for potential failure mode.
ItemsRPN Method [2]IRPN Method [46]IFWA Method [41]SWAA Method [43]Proposed Method
RPNRankIRPNRank S c o r e I Rank S c o r e S A c c u r a c y S Rank S c o r e S A c c u r a c y S Rank
10.10471.4177−0.0428−0.0640.8548−0.0880.8609
20.15951.75040.42030.1720.8623−0.1040.85010
30.15661.61760.0856−0.0130.8906−0.0210.8955
40.072121.3508−0.0087−0.0650.8039−0.0560.8027
50.18631.81730.44120.1770.86520.1940.8671
60.24621.91720.34340.0780.85040.0730.8493
70.067131.21713−0.18513−0.1420.85113−0.1560.85115
80.076101.31711−0.09811−0.0680.87810−0.1380.86114
90.061171.18316−0.20716−0.1590.85116−0.1300.85213
100.08091.3508−0.0649−0.0610.8717−0.0440.8656
110.061161.18316−0.20716−0.1590.85116−0.1580.85116
120.16441.65050.1135−0.0080.8855−0.0200.8884
130.066151.21713−0.18513−0.1420.85113−0.1590.85117
140.34512.15010.50410.1970.83610.0840.8462
150.066141.21713−0.18513−0.1420.85113−0.1170.85211
160.056181.15018−0.23018−0.1780.85218−0.1780.85218
170.09081.3508−0.08610−0.0900.84511−0.0880.8458
180.072111.25012−0.16312−0.1260.85212−0.1260.85212
190.007190.58319−0.60519−0.5060.83919−0.4780.84219
Table 9. The main differences in factors considered by different calculation methods.
Information ConsiderationMeasurement Scale ConsiderationObjective Weight Consideration
Intuitionistic Fuzzy InformationSpherical Fuzzy Information
RPN method [2]NoNoNoNo
IRPN method [46]NoNoYesNo
IFWA method [41]YesNoYesNo
SWAA method [43]YesYesYesNo
Proposed methodYesYesYesYes
Disclaimer/Publisher’s Note: The statements, opinions and data contained in all publications are solely those of the individual author(s) and contributor(s) and not of MDPI and/or the editor(s). MDPI and/or the editor(s) disclaim responsibility for any injury to people or property resulting from any ideas, methods, instructions or products referred to in the content.

