Article

MCI Conversion Prediction Using 3D Zernike Moments and the Improved Dynamic Particle Swarm Optimization Algorithm

by
Pouya Bolourchi
1,*,
Mohammadreza Gholami
1,
Masoud Moradi
2,
Iman Beheshti
3,* and
Hasan Demirel
2,† on behalf of the Alzheimer’s Disease Neuroimaging Initiative
1
Electrical and Electronic Engineering, Final International University, Via Mersin 10, Girne 99320, Turkey
2
Electrical and Electronic Engineering, Eastern Mediterranean University, Via Mersin 10, Famagusta 99628, Turkey
3
Department of Human Anatomy and Cell Science, Max Rady College of Medicine, Rady Faculty of Health Science, University of Manitoba, Winnipeg, MB R3T 2N2, Canada
*
Authors to whom correspondence should be addressed.
Data used in this article were obtained from Alzheimer’s Disease Neuroimaging Initiative (ADNI).
Appl. Sci. 2023, 13(7), 4489; https://doi.org/10.3390/app13074489
Submission received: 14 March 2023 / Revised: 30 March 2023 / Accepted: 31 March 2023 / Published: 1 April 2023
(This article belongs to the Special Issue Artificial Intelligence (AI) in Neuroscience)

Abstract

:
Mild cognitive impairment (MCI) conversion prediction is a vital challenge in the area of Alzheimer’s disease (AD) as it could determine possible treatment pathways for AD patients. In this work, we presented a robust MCI conversion prediction framework based on the 3D-Zernike Moment (3D-ZM) method that generates statistical features (e.g., shape, texture, and symmetry information) from 3D-MRI scans and improved dynamic particle swarm optimization (IDPSO) that finds an informative sub-set of Zernike features for MCI conversion prediction. We quantified the efficiency of the proposed prediction framework on a large sample of MCI patients including 105 progressive-MCI (pMCI) and 121 stable-MCI (sMCI) at the baseline from the ADNI dataset. Using the proposed MCI conversion prediction framework, pMCI patients were distinguished from sMCI patients with an accuracy exceeding 75% (sensitivity, 83%, and specificity, 68%), which is well comparable with the state-of-the-art MCI conversion prediction approaches. Experimental results indicate that the 3D-ZM method can represent informative statistical patterns from 3D-MRI scans and IDPSO has a great capability to find meaningful statistical features for identifying MCI patients who are at risk of conversion to the AD stage.

1. Introduction

Alzheimer’s disease (AD) is a dysfunctional brain disorder that gradually affects the patient’s cognitive abilities. It is the most common type of dementia and typically manifests as memory impairment. Memory disorder typically develops slowly and progressively over time. At first, memory impairment is limited to recent events, but long-term memories are gradually damaged over time. Many people around the world are affected by AD [1]. By 2050, it is projected that 12.7 million Americans will have AD, an increase from the current estimate prevalency of 6.5 million [2]. Generally, AD is classified into two main phases: mild cognitive impairment (MCI) and dementia due to AD. The preclinical phase starts years before the disease is identified [3]. MCI is the stage that occurs between cognitively health and dementia due to AD [4]. Patients with MCI experience more cognitive deterioration than would be expected with normal aging, yet there are no obvious disruptions to their daily activities [5]. Dementia due to AD is the final phase which is associated with striking behavioral and cognitive abnormalities. [6]. It is documented that 10–15% of MCI subjects are at risk of developing dementia due to AD, which is known as progressive-MCI (pMCI), while the rest remain stable (stable-MCI or sMCI) or return to a cognitively healthy condition [7,8]. Clinically, MCI conversion prediction is crucial as it would help doctors to identify MCI patients who are at risk of developing dementia due to AD. Identifying pMCI patients at this stage can lead to early interventions and better management of the condition, including regular monitoring of cognitive function and appropriate support for patients. The accurate prediction of MCI conversion is also important for clinical trials and research studies aimed at developing new treatments for AD as it helps ensure that clinical trials are conducted on the right patient population, increasing the likelihood of success. For example, the U.S. Food and Drug Administration (FDA) recently confirmed Aducanumab (Aduhelm) as a treatment for AD. This medicine, which diminishes amyloid plaques in the brain, can be used to treat AD patients in the MCI or mild dementia stages. However, Aduhelm may not be appropriate for all MCI patients and it is recommended only for MCI patients who are at risk of developing dementia due to AD (i.e., pMCI patients). Thus, many researchers have concentrated on developing innovative and robust algorithms for identifying MCI patients who are at risk of developing dementia [9,10,11].
In the last two decades, neuroimaging techniques such as structural magnetic resonance imaging (sMRI), functional magnetic resonance imaging (fMRI), and positron emission tomography (PET) have been extensively used for AD analysis [12]. Among these imaging techniques, sMRI was widely employed to diagnose AD as this modality is able to provide a high-resolution image of the brain that contains vital information and details about brain tissues. In addition, unlike PET or single photon emission computed tomography (SPECT), sMRI does not require a radioactive pharmaceutical injection. In this study, we concentrated on sMRI data at the baseline for MCI conversion prediction. In addition to neuroimaging data, machine learning (ML) models have been used for early AD or monitoring AD progression [13]. An MCI conversion prediction framework using ML methods typically consists of the following steps: preprocessing, feature extraction, feature selection, and classification. Preprocessing techniques are mainly used to enhance brain images through noise removal and the elimination of unrelated parts.
The aim of the feature extraction stage is to extract informative features from pre-processed brain scans for AD detection. Different features extracted from sMRI data have been widely evaluated for MCI conversion prediction: gray matter (GM) signal intensities [14], histogram-based features generated from individual connectivity networks [15], region of interest (ROI) [16], and sMRI measurement of the hippocampus [17]. The main objective of feature selection is to find an informative subset of features with the aim of improving prediction accuracy and avoiding the course of dimensionality. Many studies were conducted using different feature selection methods for MCI conversion prediction. Filter, wrapper, and embedded methods are the main three types of feature selection methods [18]. Filter-based methods analyze the feature worth based on typical characteristics of data without using a learning algorithm. Wrapper methods use the output of a classifier to evaluate the importance of features. Applying the wrapper methods leads to better accuracy yet a higher computational cost and time requirement [18]. Embedded methods have the advantages of both methods [19]. Embedded methods such as sparse learning-based methods use learning algorithms in the selection process [18]. The least absolute shrinkage and selection operator (LASSO) was used in [20]. A multi-modal feature selection algorithm using feature correlation and feature structure fusion was applied in [21]. Three feature selection methods, a random subset feature selection algorithm, minimal redundancy maximal relevance, and a sparse linear regression feature selection algorithm were applied in [22]. The last stage of an MCI conversion prediction framework is classification and evaluation. Many algorithms are used for MCI conversion prediction, such as support vector machine (SVM), k-nearest neighbor [23], decision trees [24], and random forest [25]. Among all classification methods, the SVM classifier [26] is widely used for AD detection due to its high accuracy compared to other classifiers.
In this study, we proposed a new MCI conversion prediction framework based on the 3D-Zernike Moment (3D-ZM) model and an improved dynamic particle swarm optimization (IDPSO) algorithm. The 3D-ZM model generates statistical features (e.g., shape, texture, and symmetry information) from 3D-sMRI scans. These statistical features can be considered a lower-dimensional feature space which are representing sMRI images. IDPSO is a meta-heuristic algorithm that can be used as a robust feature selection technique to find the optimal feature subset. We assessed the proposed MCI conversion prediction framework on a large set of sMRI data at the baseline from the ADNI dataset by means of SVM as the classifier. We will show that the proposed MCI conversion prediction framework has a strong capability to identify MCI patients who are at risk of conversion to the AD stage using only baseline MRI data.

2. Material and Methods

2.1. Samples and Image Preprocessing

The multimodal brain images used in this study came from the ADNI’s (Alzheimer’s Disease Neuroimaging Initiative) open database. Thousands of individuals were enlisted for the ADNI study from around North America to collect clinical data and brain scans. In this study, we used the baseline sMRI scans from pMCI and sMCI patients to train and evaluate our model. Table 1 displays demographic and clinical data from the ADNI used in this study. The official website should be considered for more information regarding the data acquisition protocol (https://adni.loni.usc.edu/about/, accessed on 15 October 2022). In this paper, sMCI refers to individuals diagnosed with MCI who did not develop AD within a period of 36 months and pMCI refers to individuals diagnosed with MCI who did develop AD within a period of 36 months. All brain sMRI scans were preprocessed based on the Voxel-based morphometry (VBM) technique using the CAT12 and the Statistical Parametric Mapping toolbox version 12 (http://www.fil.ion.ucl.ac.uk/spm/software/spm12/, accessed on 15 October 2022) with default settings. In general, MRI pre-processing is comprised of correcting the bias-field distortions; removal of non-brain tissue; segmentation of brain tissue into the components of GM, white matter, and cerebrospinal fluid; and DARTEL-normalization to MNI-space. In this paper, only GM of a brain MRI was used. The technical details of VBM-based sMRI pre-processing were described previously [27].

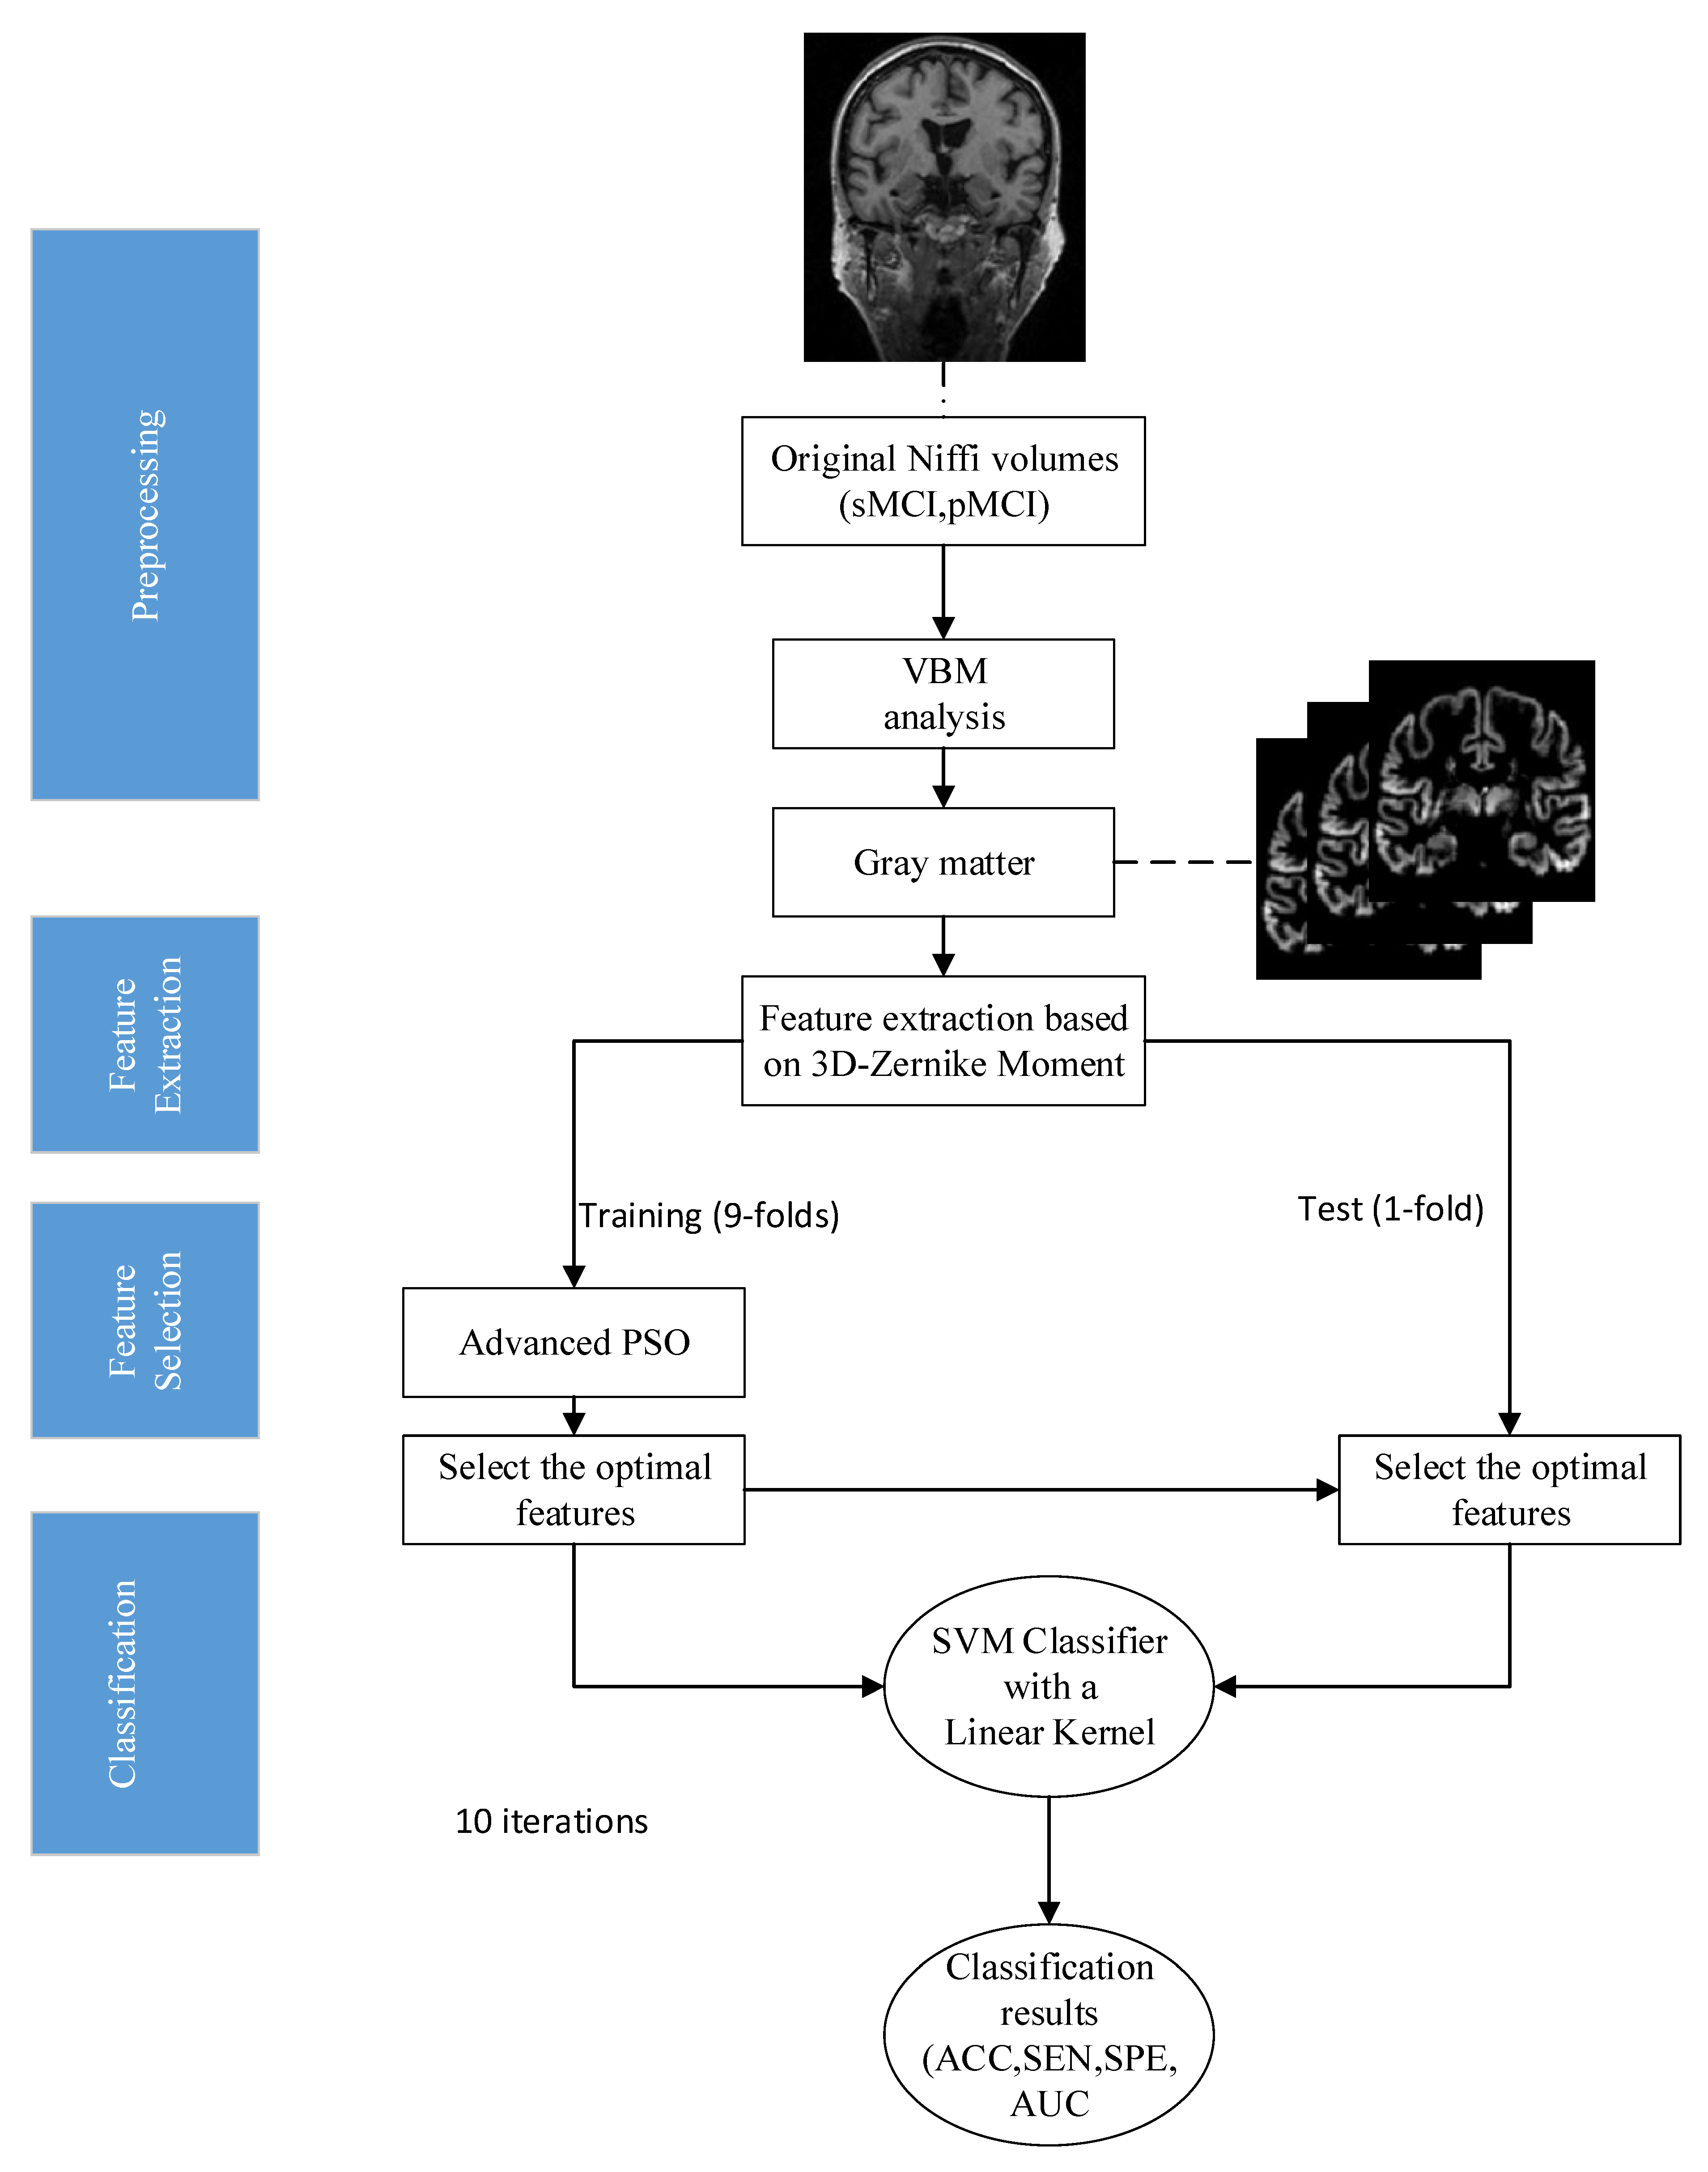
2.2. Methodology of the Proposed Prediction Model

In this section, we present the methodology of the proposed MCI conversion prediction framework, based on 3D-ZM, followed by an IDPSO algorithm. Figure 1 depicts the pipeline of the proposed prediction framework.

2.2.1. Feature Extraction Based on 3D-ZM

Moments are scalar properties with real or complex values that are used to describe a certain function. Moments are projections of function f onto a polynomial basis from a mathematical perspective. Moments are used in statistics to estimate population parameters. Moments are specific quantitative measures of the shape of a set of points. They can also be used to extract features from images by gathering relevant information. In this regard, moments as shape descriptors present powerful techniques for extracting shape-based features in AD. The ZM [28] method, one of many moment methods defined in the literature [29], is used in a variety of applications ranging from image enhancement to image classification [30,31,32] due to its scale, translation, and rotational invariance. Furthermore, the orthogonal basis of the function’s properties results in minimal information redundancy.
M p , q , r = P p ( x ) P q ( y ) P r ( z ) f ( x , y , z ) d x d y d z
where p, q, and r are integer coefficients indicating the various members of the basis set, and n is the order defined as n = p + q + r. Pp, Pq, and Pr are polynomial basis functions (PBF). With different PBF functions, various types of moments could be derived. The simplest 3D PBF are geometric moments with the form of xp yq rz. However, deploying these moments cause a poor recognition rate since their PBFs are not orthogonal. To overcome this problem, the orthogonality condition for the basis function must be satisfied in which:
3 4 π 0 1 0 2 π 0 π Z n l m ( r , θ , ϕ ) Z n l m ( r , θ , ϕ ) r 2 sin θ d ρ d θ d ϕ = δ n n δ l l δ m m
In 3D, the area of orthogonality can be defined cylindrically as:
M p , q , r = 0 2 π 0 1 1 1 G r ( Z ) R p , q ( ρ ) e i q ϕ f ( x , y , z ) ρ d z d ρ d ϕ
where p, r = 0, 1, 2, … and q = −p, …, p. R p , q ( ρ ) e i q ϕ is the kernel function on the disk and G r ( Z ) refers to 1D orthogonal polynomials. The 3D Zernike polynomial spherical coordinate is defined as:
M n l m ( r , θ , ϕ ) = R n l ( r ) Y l m ( θ , ϕ )
where Y l m is the spherical harmonics of degree l and order m and r ,   θ ,   ϕ are the spherical coordinates.
x = r sin θ cos ϕ y = r sin θ sin ϕ z = r cos θ
The 3D ZM is:
A n l m = 0 2 π 0 π 0 1 M n l m ( r , θ , ϕ ) ) f ( r , θ , ϕ ) r d r d θ d ϕ

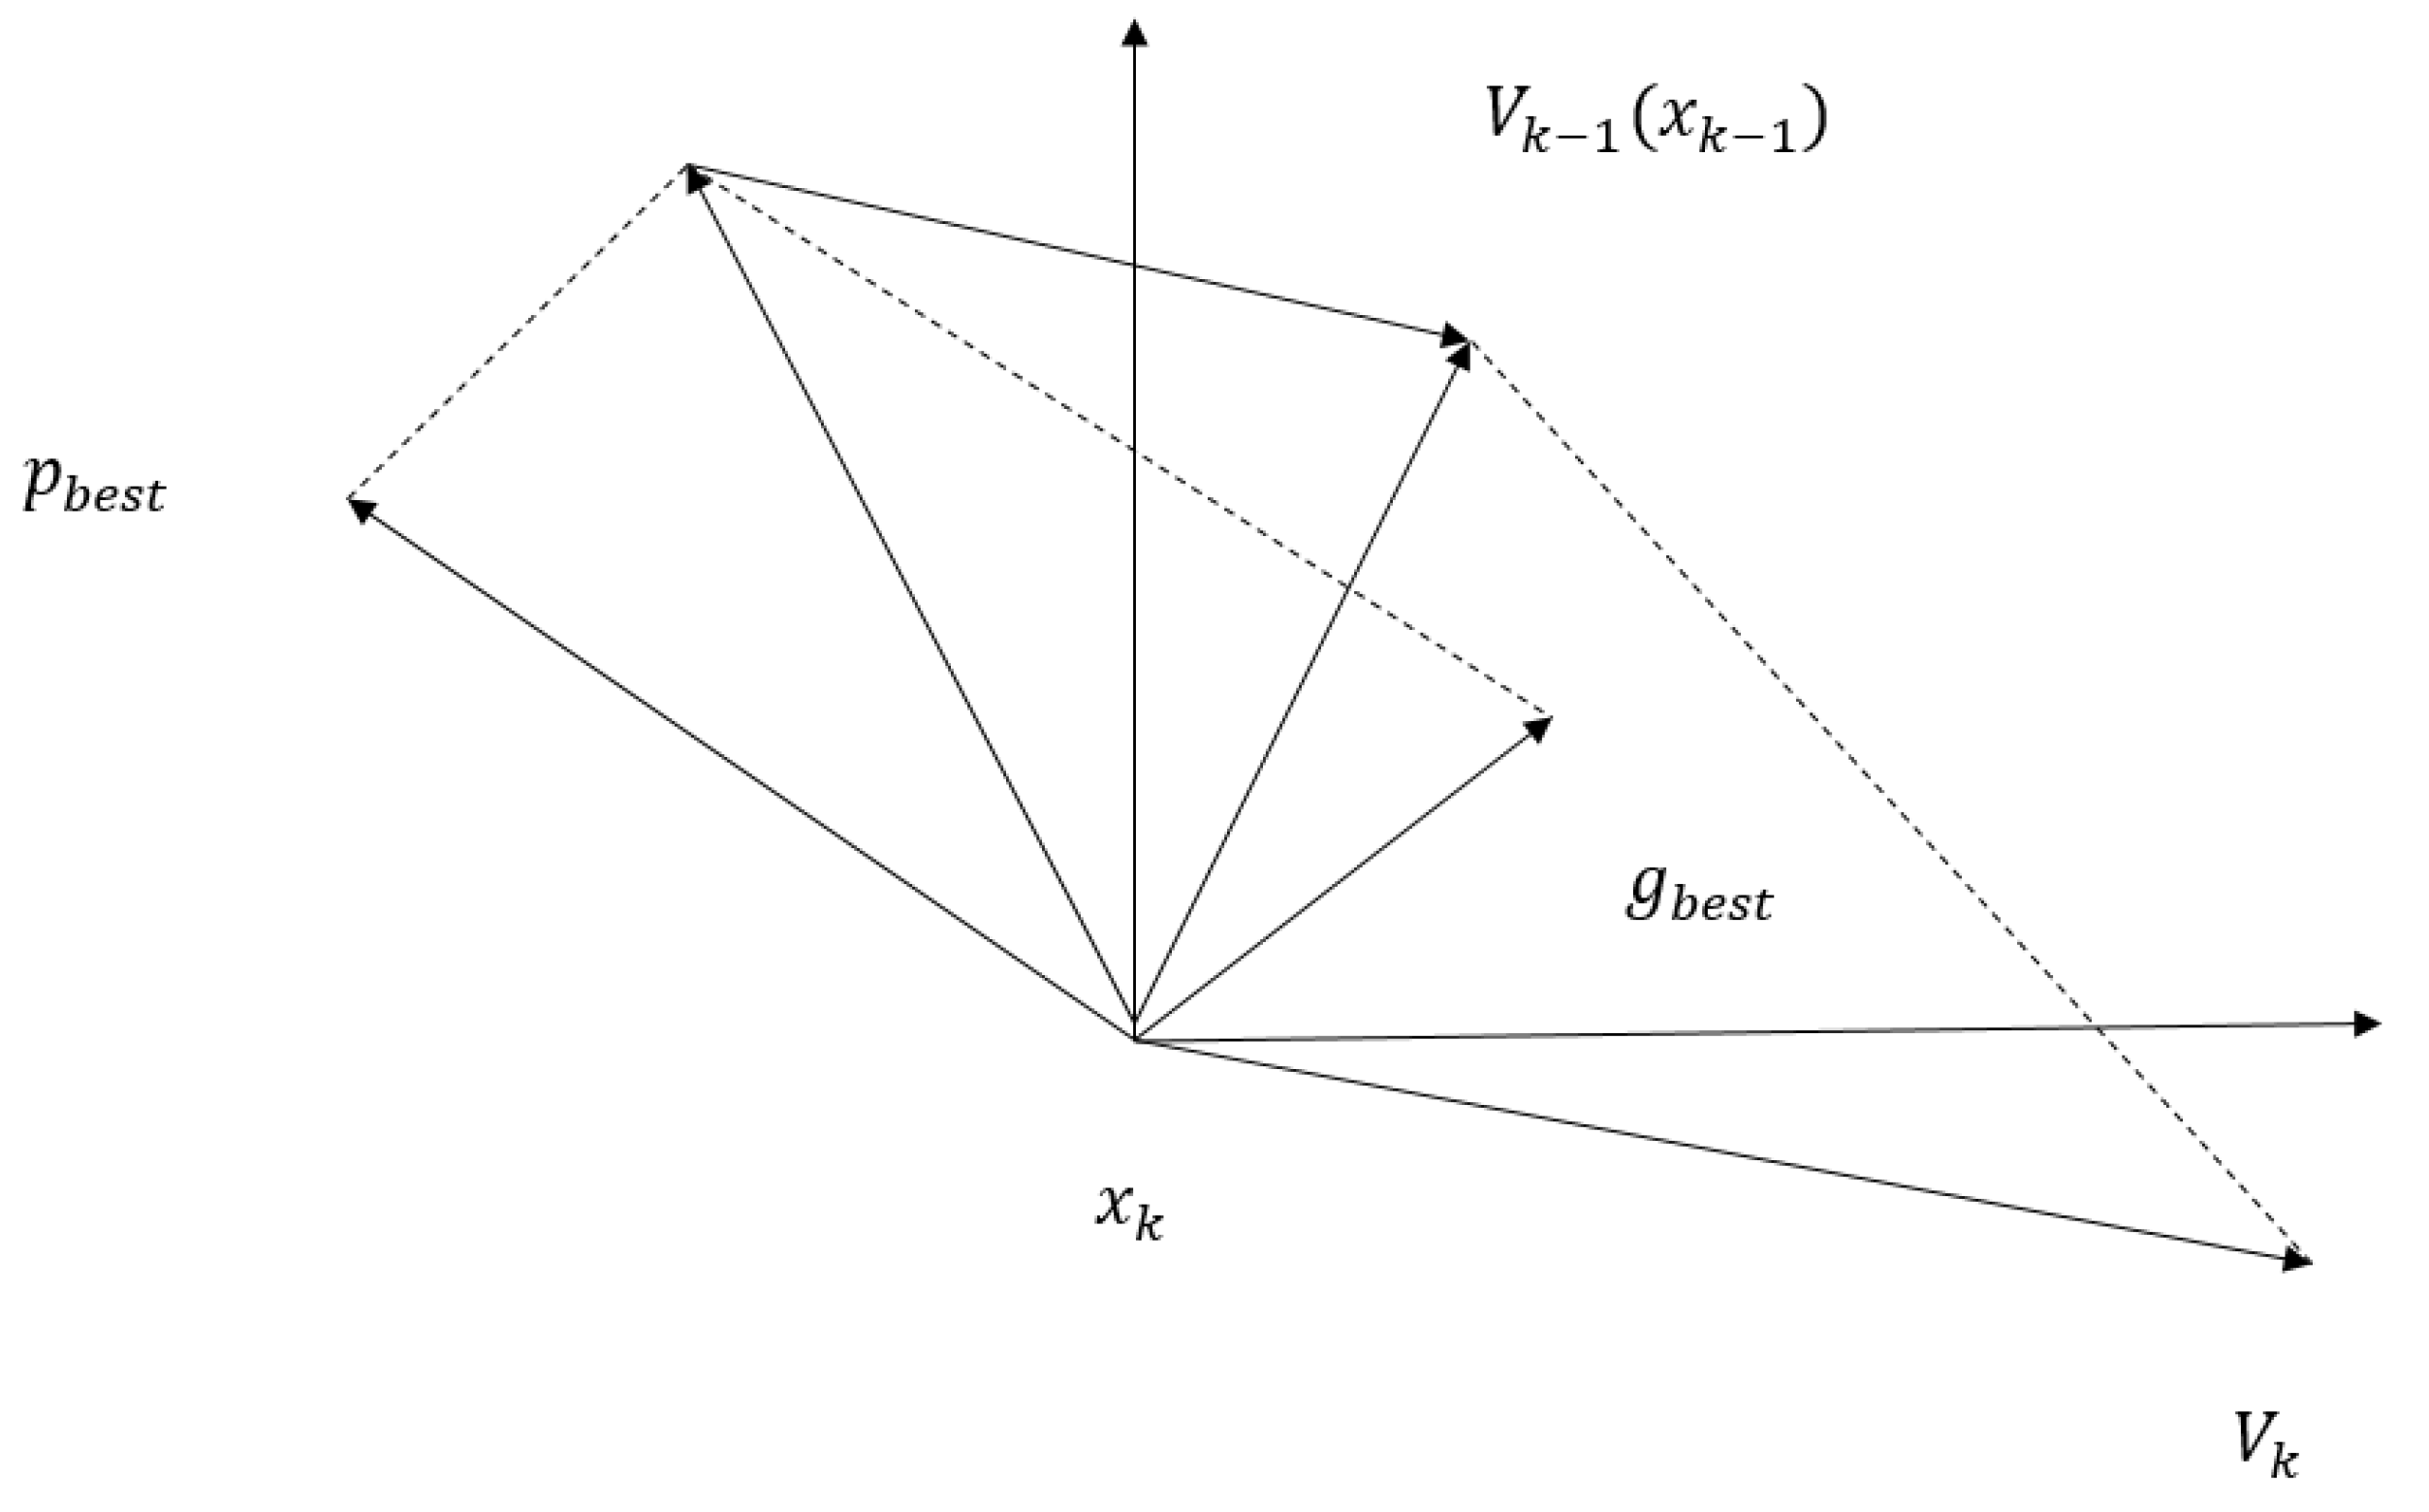
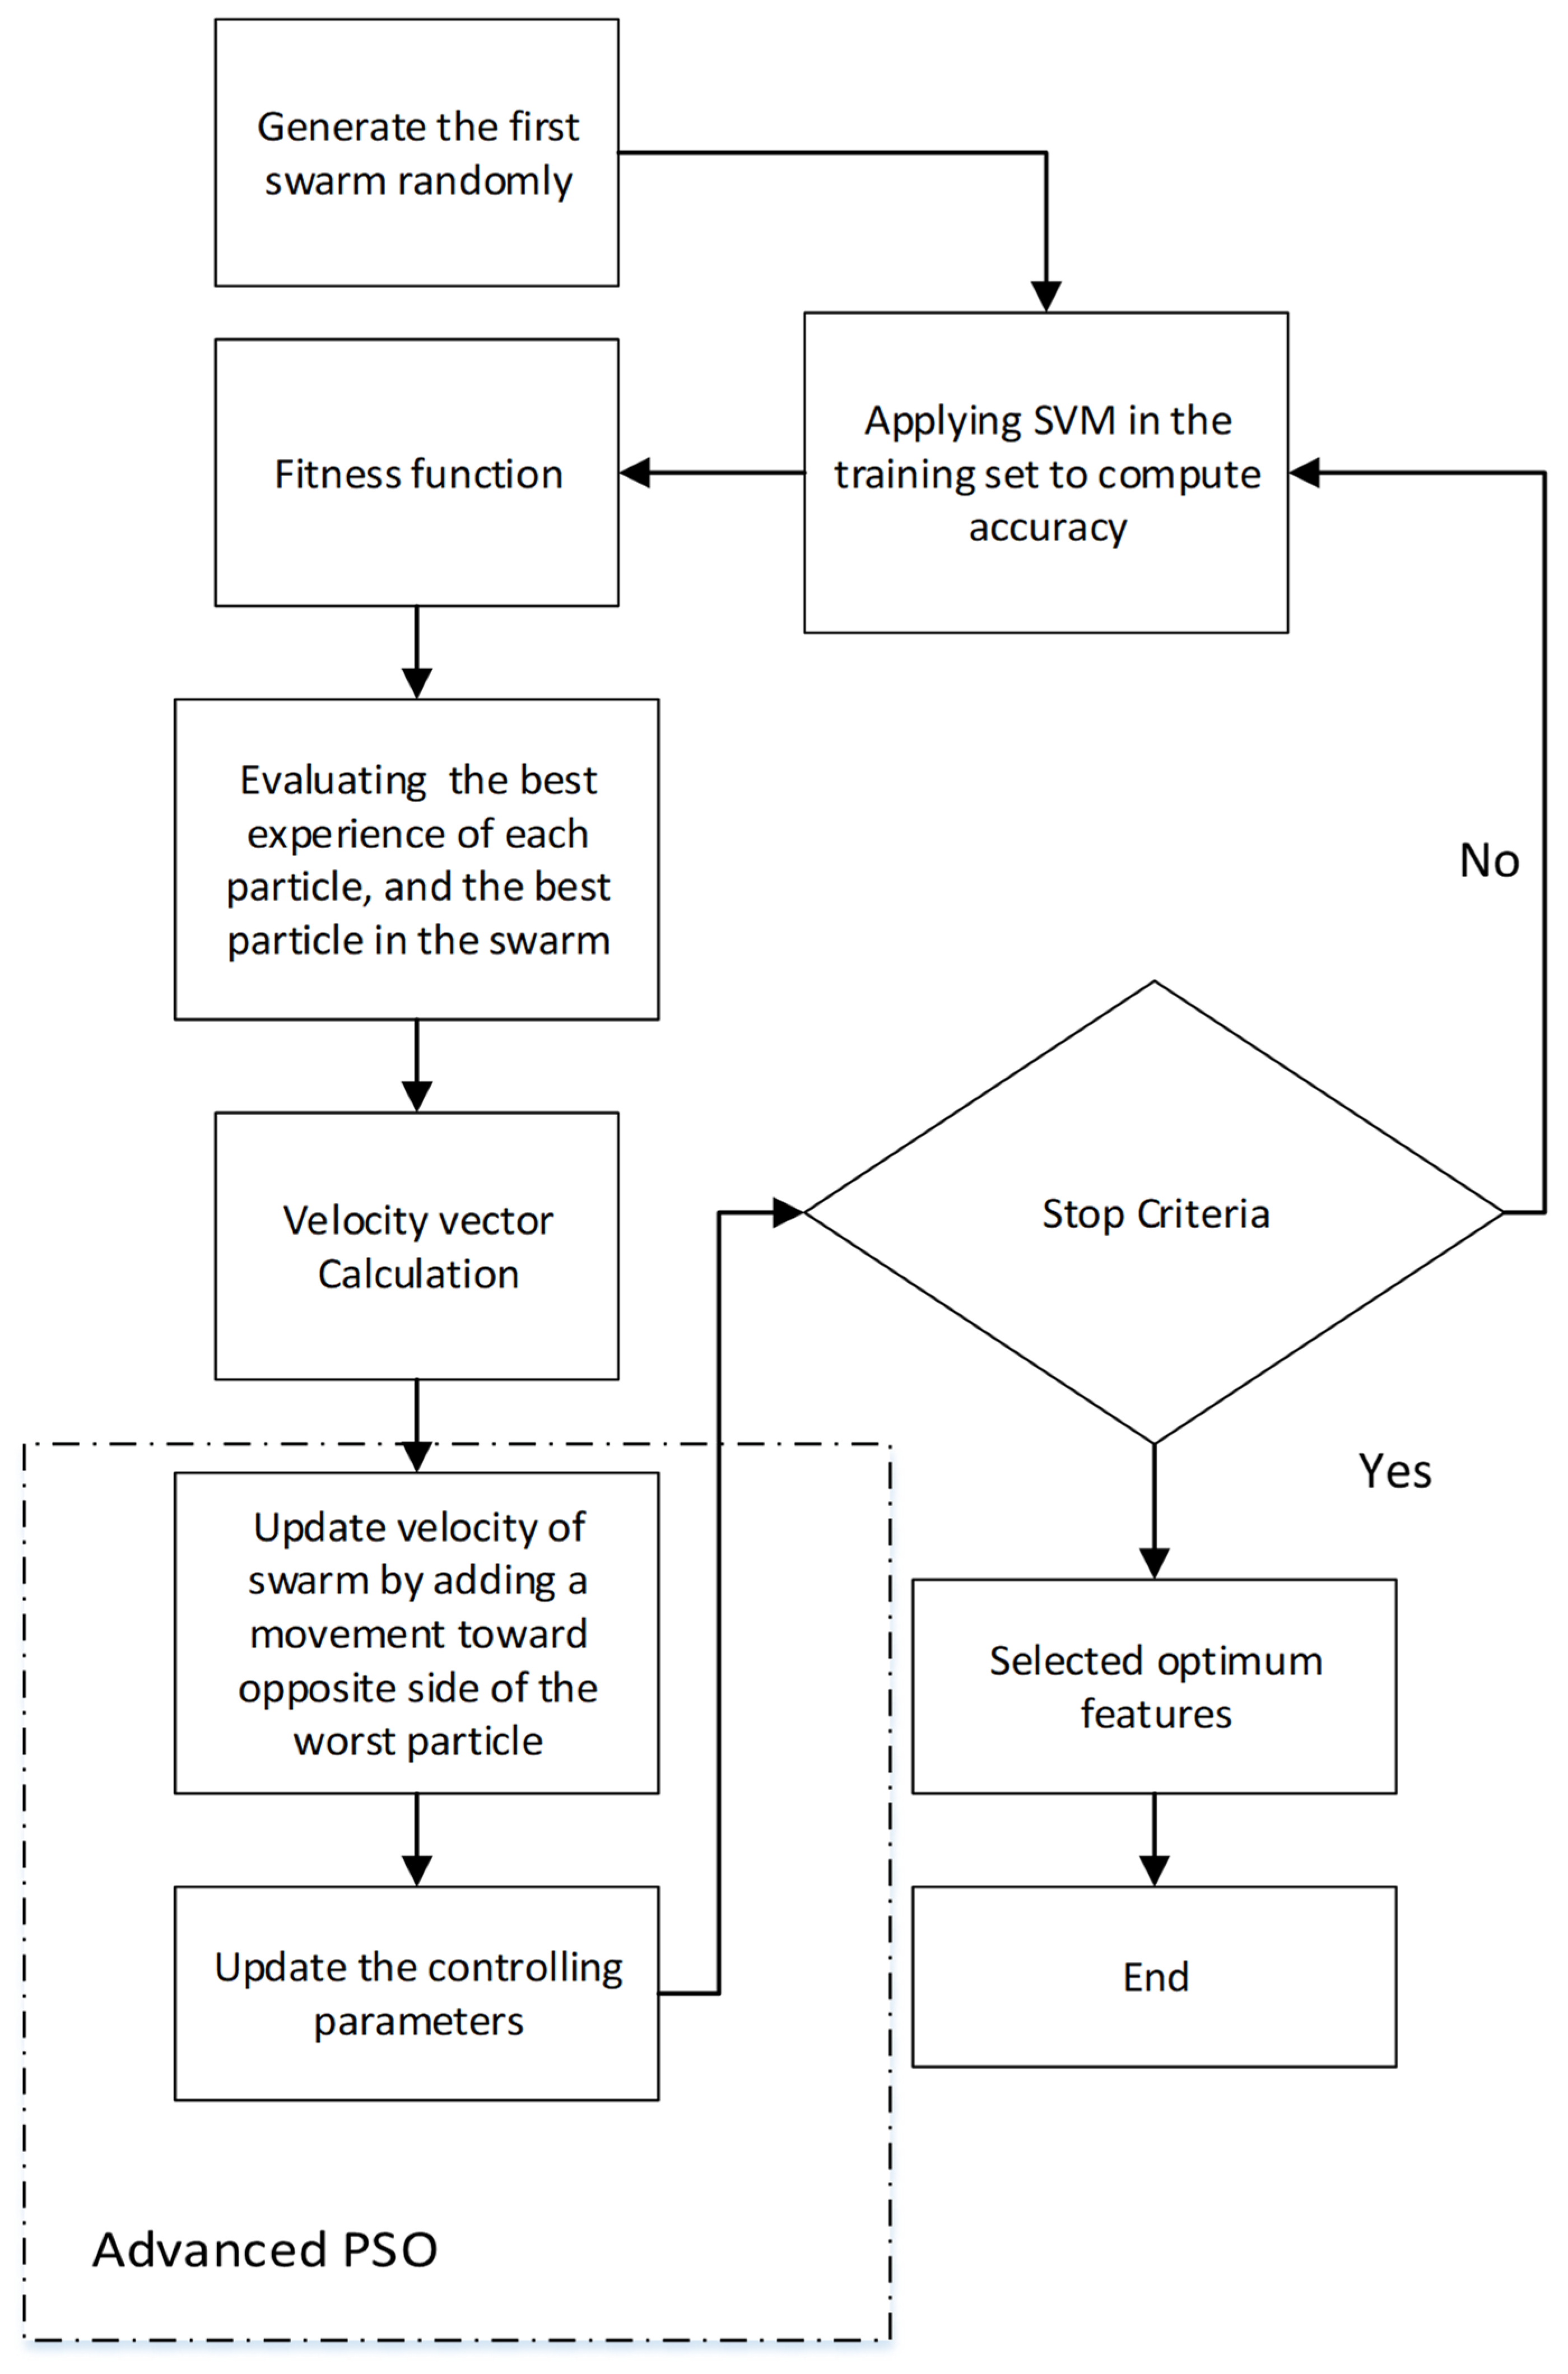
2.2.2. Feature Selection Based on IDPSO

We utilized an advanced dynamic algorithm called IDPSO to identify the optimal subset of features. Our goal was to reduce the number of features while retaining the most effective, relevant, and non-redundant ones. To achieve this, we considered both the number of features and the classification accuracy as crucial factors in our approach. We designed a fitness function based on a multi-objective optimization equation that guided our IDPSO algorithm towards the best feature subset for our purposes. The conventional PSO algorithm employs a population of particles, with each particle representing a possible solution to the problem at hand. As with other meta-heuristic algorithms, PSO operates iteratively. The initial population of particles is generated randomly, and subsequent iterations involve calculations based on the particles’ movements toward their individual and global best solutions. The fitness function of the problem is used to evaluate the particles. PSO’s performance is modeled on the behavior of birds seeking food sources, meaning that particles strive to locate the best possible solution (i.e., the optimized value of the fitness function). In traditional PSO, each particle moves toward its best memory and the best particle of the population (Equations (7) and (8)). After meeting the stop criteria, the particles are assumed to find the best solution.
V i j ( t + 1 ) = w v i j ( t ) + c 1 r 1 i j ( t ) × ( y i j ( t ) x i j ( t ) ) + c 2 r 2 i j ( t ) × ( y ^ j ( t ) x i j ( t ) )
x i j ( t + 1 ) = x i j ( t ) + v i j ( t + 1 )
where, v i j ( t ) is the velocity in dimension j at time t. x i j ( t ) is the position at time t. w, c 1 , and c 2 are inertia weight and controlling parameters termed cognitive and social coefficients, respectively. r 1 i j and r 2 i j are random numbers ~U (0,1). y i ( t ) and y i j ( t ) represent the best position of the individual and neighborhood and finally, x i j ( t + 1 ) is the new position at time t + 1. The movement of particles is shown in Figure 2.
Regarding the convergence of the PSO algorithm, the mathematical relationship between control parameters given in Equation (9) [33] should be met:
c 1 + c 2 < 24 ( 1 w 2 ) 7 5 w
Considering the significant advantages of PSO such as the simplicity in applying and controlling the parameters and fast convergence, many researchers have applied PSO in different steps of image processing. In [34,35], the PSO is applied for the feature selection step. PSO is utilized with convolutional neural networks (CNNs) for classification tasks in [36,37,38]. In addition, many other studies have focused on improving the PSO performance to overcome its shortcomings such as falling into local optimums [39,40,41,42,43,44]. Due to the large number of potential solutions in this problem, the PSO algorithm is susceptible to getting trapped in local optima, which is one of its main limitations. In this paper, we proposed several updates to the standard PSO algorithm to enhance its performance by preventing it from getting trapped in local optima and enabling it to explore a larger portion of the problem space. We introduced dynamic control parameters ( c 1 , c 2   and   c 3 ) to guide the movement of PSO towards better solutions based on the leader and best experience of the swarm. The c3 parameter was used to move particles away from the worst particles in the opposite direction, allowing the algorithm to escape from local optima. Additionally, a mutation operation was added to the algorithm, wherein each particle’s randomly selected value was updated if it was less than the probability of mutation (PM). We also updated the movement of particles to follow not only their best experiences and leaders but also the opposite position of the worst particles (Equation (10)). To address the problem of finding the local solution, we incorporated dynamic control parameters in our proposed IDPSO algorithm. Specifically, we updated the setting parameters such as PM, c 1 , c 2   and   c 3 after a certain number of iterations, as described in Equation (11).
I f   r a n d p m o v e   : V i j ( t + 1 ) = w v i j ( t ) + c 1 r 1 × ( y i j ( t ) x i j ( t ) ) + c 2 r 2 × ( y ^ j ( t ) x i j ( t ) ) + c 3 r 3 ( x i j ( t ) Y ˜ i ( t ) )
where Y ˜ i ( t ) denotes the position of particle the particle with the worst fitness function in time t and p m o v e   is a small value accounting for the probability of moving particles toward the worst particle.
i f   i t e r < s p e c i f i c i t e r : P M , c 1 , c 2 ( b a s e ) × ( i t e r _ max + i t e r ) i t e r _ max i f   i t e r > s p e c i f i c i t e r : P M , c 1 , c 2 ( b a s e ) × ( i t e r _ max i t e r ) i t e r _ max
where PM is the mutation parameter. P M b a s e is the initial value for PM. i t e r _ max is the maximum iteration number and i t e r is the variable that shows the number of algorithm iterations. Considering Equation (11), at the first iteration the value of PM is increasing which means that more random particles are generated to search sufficiency among all problem search spaces. After specific iterations, the random particle movements can be limited by decreasing the value of PM in each step.
As mentioned above, each particle represents a possible solution to the problem which can be a set of selected features. Only features with the corresponding value of one are selected for the classification. For instance, in the sample particle shown in Table 2, the optimal feature subset is composed of {f1, f3, f4, fn−1}. The main goal of using IDPSO is to reduce the minimum number of features to achieve the highest accuracy simultaneously. So, regarding the fitness function, we considered the above factors in Equation (12).
f f i = min [ k 1 ( 1 a c c i ) + k 2 ( n f e a t u r e s n s f e a t u r e s ) ]
where f f i and a c c i are the fitness function and accuracy calculated after the classification step for particle i. The parameter n f e a t u r e s is the number of total features and n s f e a t u r e s is the number of selected features for particle i. Moreover, k1 and k2 are the parameters used to adjust the operation of IDPSO. Figure 3 shows the pipeline of the proposed IDPSO.

2.2.3. Classifier

In this study, we employed an SVM algorithm [45], a standard classifier which has been widely used in many neuroimaging studies [46]. The 10-fold class-validation strategy was used during the classification stage. To this end, the entire dataset was divided into ten equal subsets, of which one fold was used as a test set and the other nine folds as a training set. The prediction accuracy was calculated in each iteration, and the average accuracy was computed at the end of 10 iterations. The sensitivity (SEN), specificity (SPE), and accuracy (ACC) were calculated as follows:
S e n s i t i v i t y = T P R = T P T P + F N
S p e c i f i c i t y = T N R = T N T N + F P
A c c u r a c y = T P + T N T P + F P + F N + T N
where TP, FN, TN, and FP denote true positive, false negative, true negative, and false-positive results, respectively. In addition, we reported the area under the receiver operating characteristic curve (AUC) for each experiment.

2.3. Alternative Methods
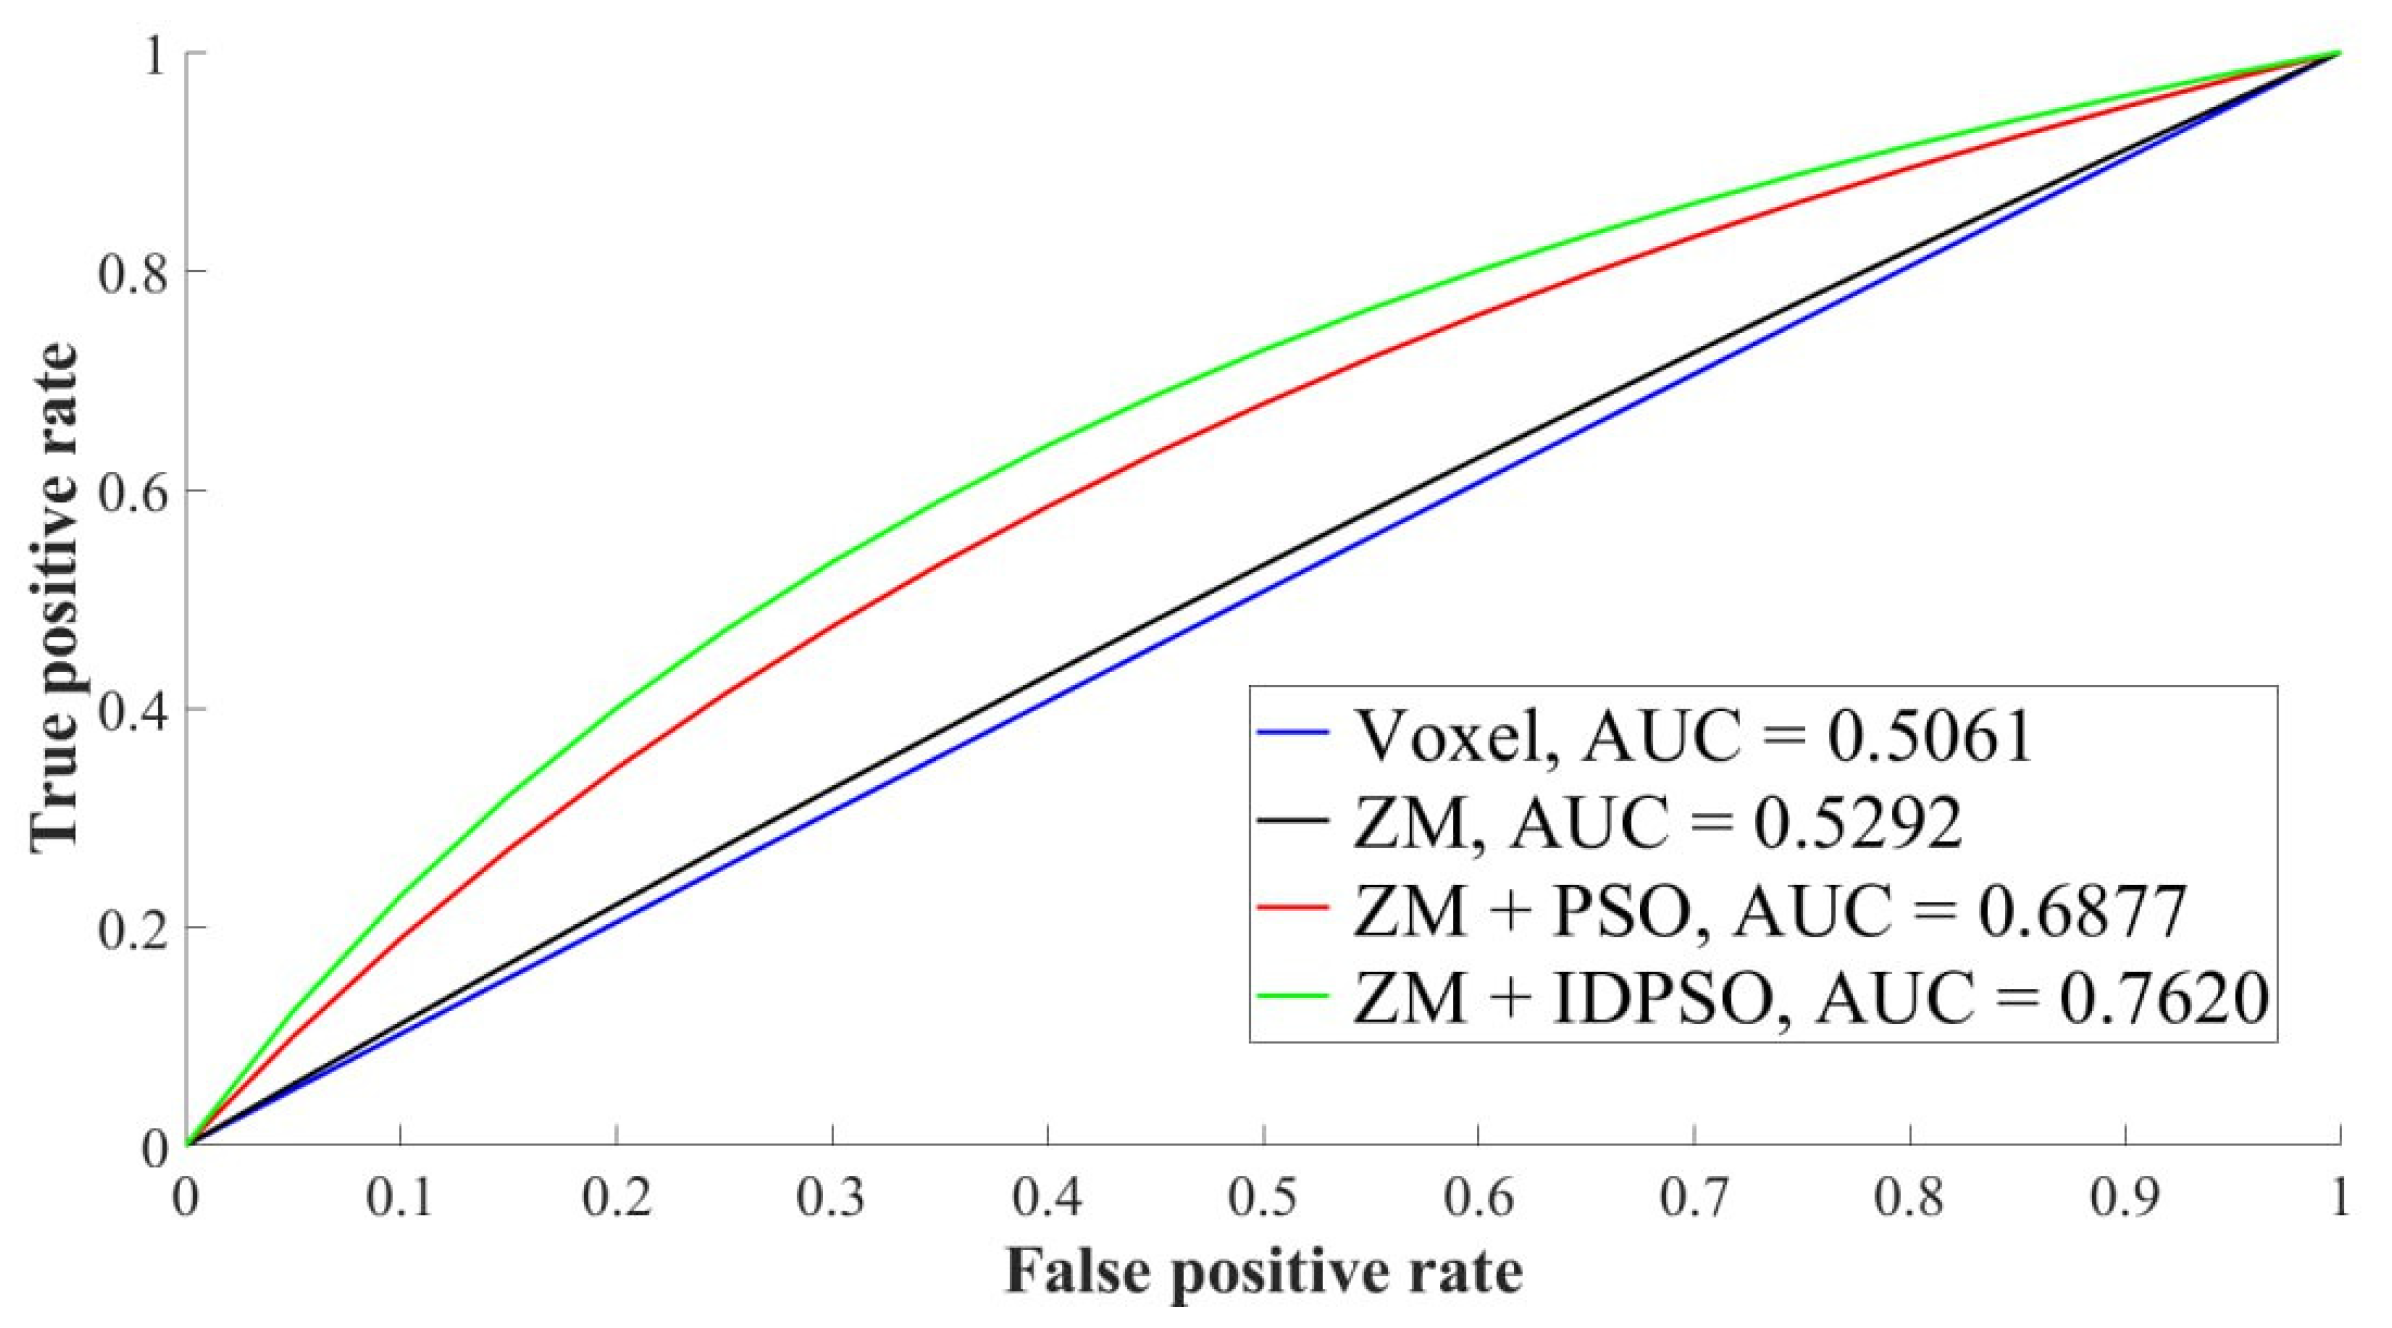
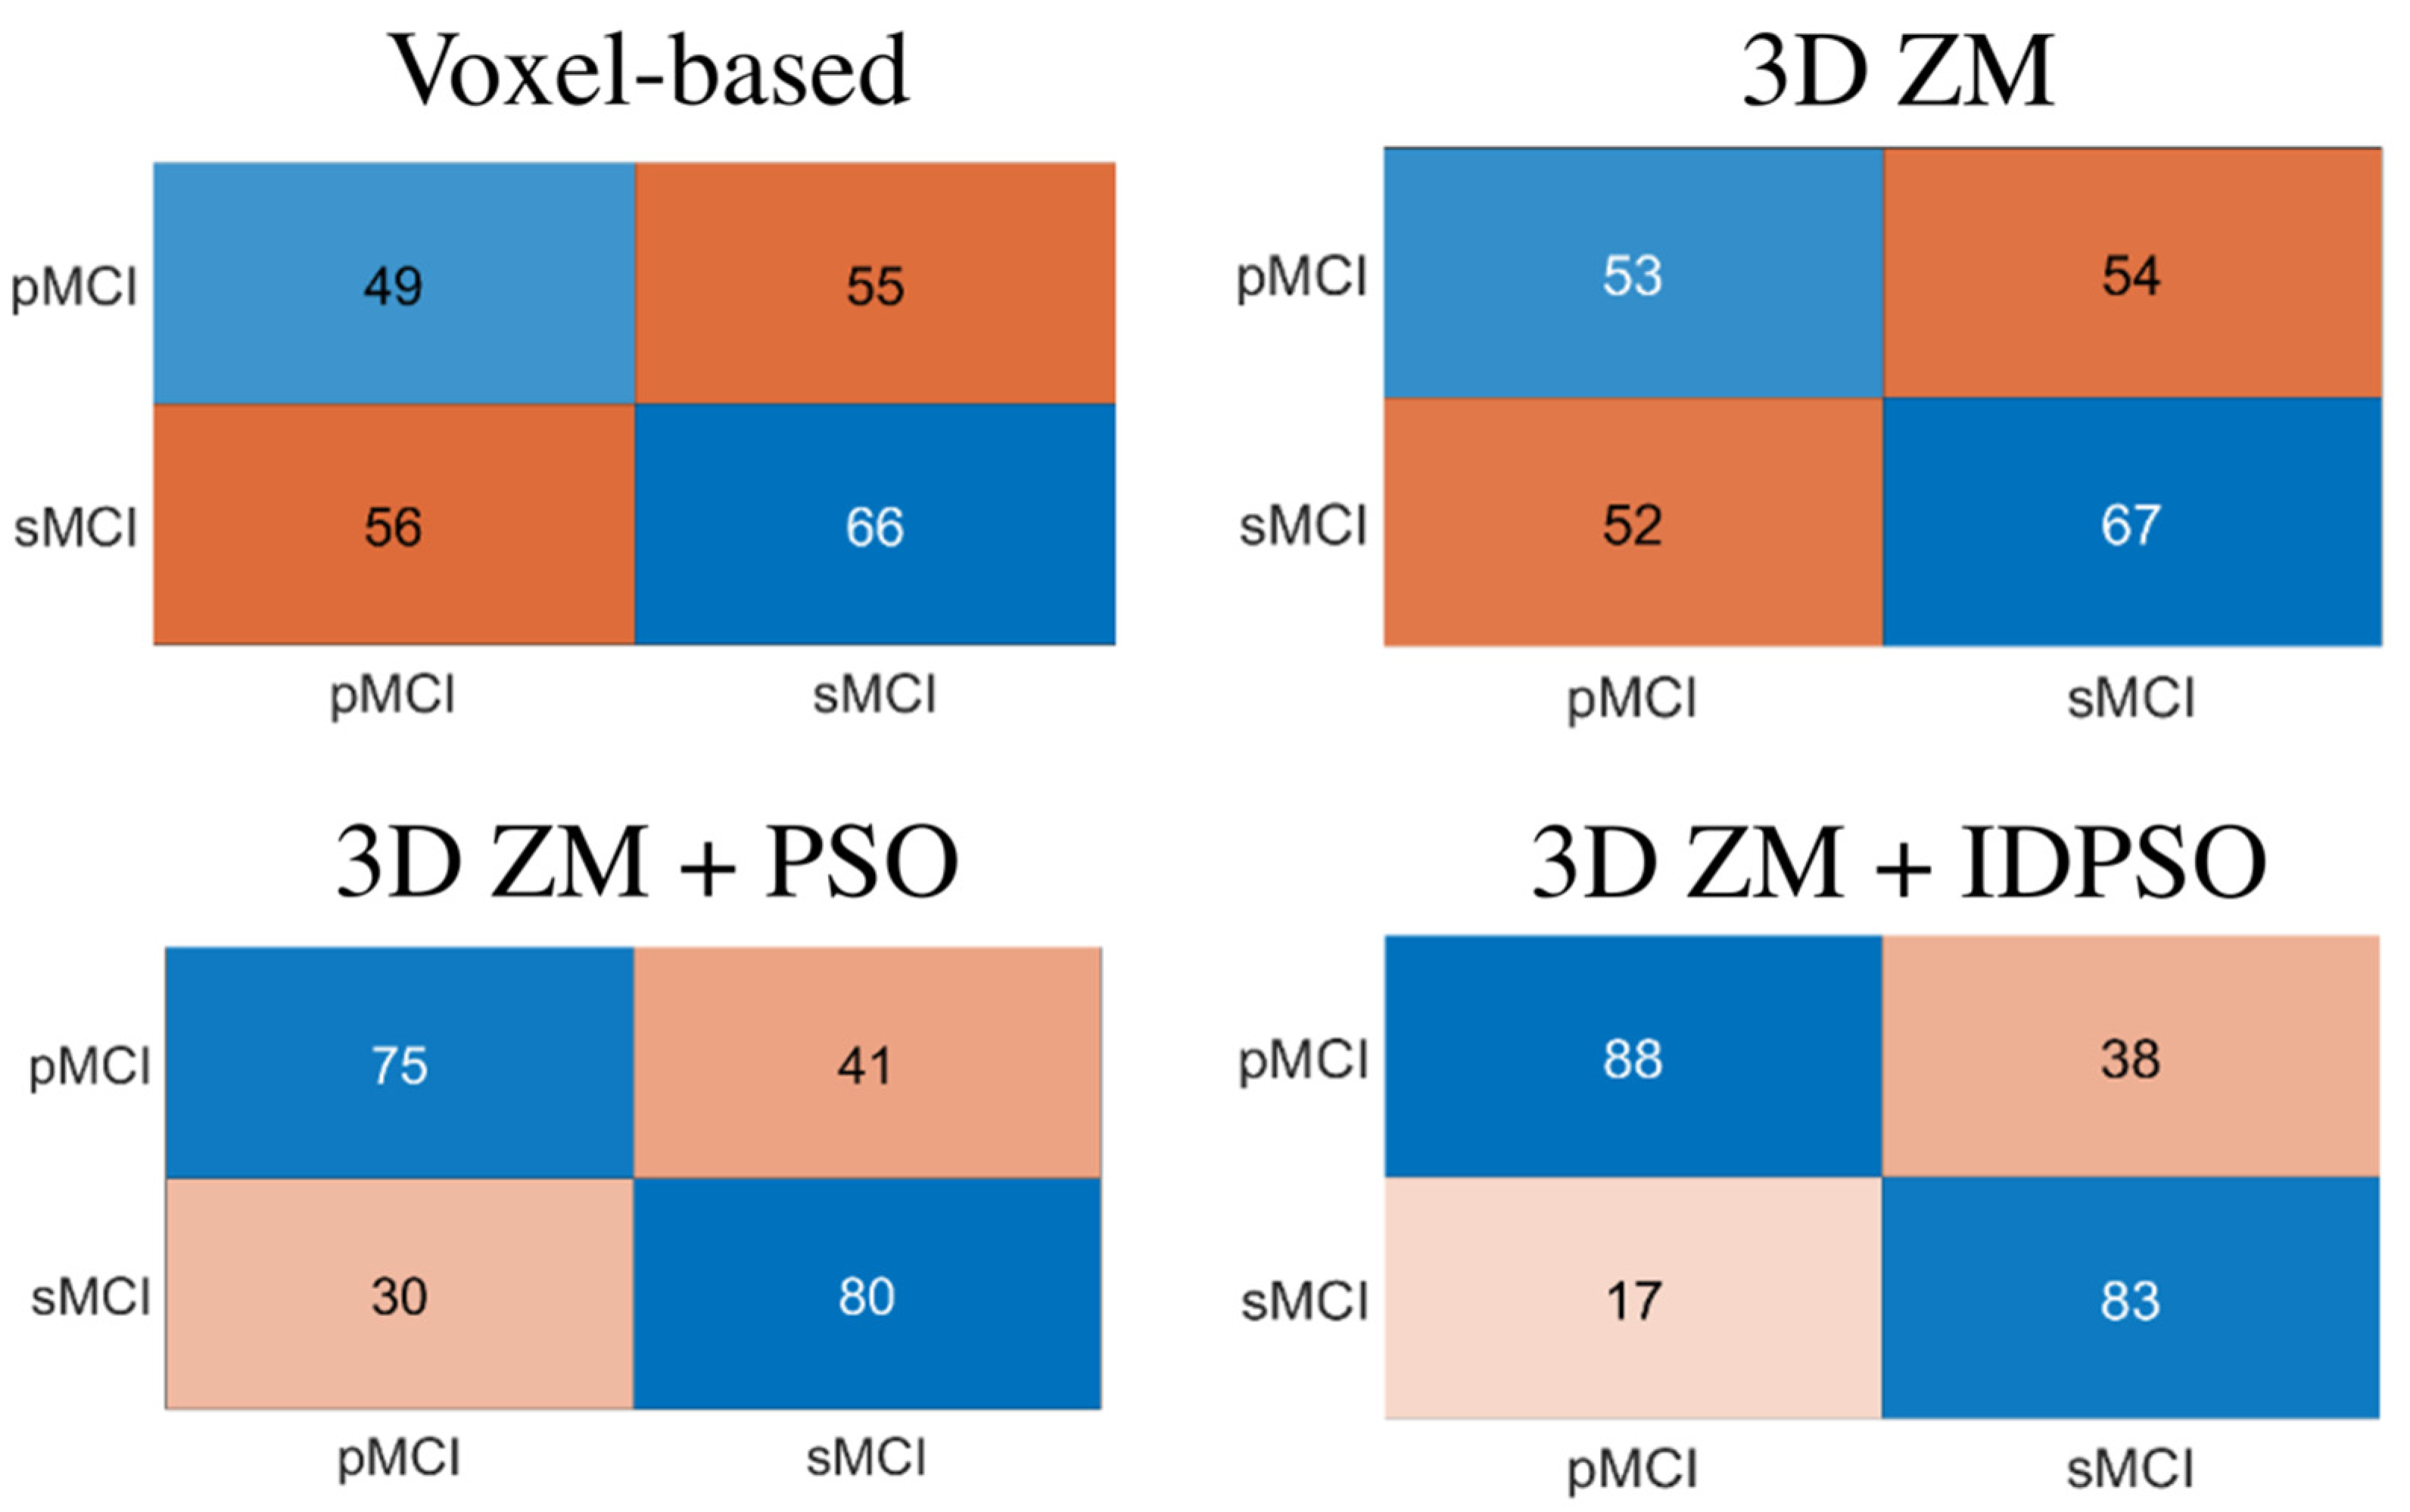
We compared the proposed feature extraction method (i.e., 3D-ZM) with alternative techniques that used GM signal intensities (i.e., the voxel-based technique) for MCI conversion prediction. To this end, we resampled the pre-processed GM images with 4 mm isotropic spatial resolution which generated 29,852 aligned GM density values per MRI. In addition, we compared the performance of IDPSO versus traditional PSO in the feature selection stage.

3. Results

In the first phase, we applied the 3D-ZM algorithm to extract statistical features from GM images, which generates 372 statistical features per subject. Next, these features were applied to a robust feature selection based on the IDPSO algorithm. The setting parameters regarding the IDPSO algorithm were as follows: population size =100, probability of mutation = 0.04, specific iteration is set to maximum iteration divided by two (1000 in 2000 iteration), C1 = 2, C2 = 1.5, C3 = 2, K1 and K2 are set to 1 and 10. Table 3 shows the results achieved based on different scenarios. Using GM voxel intensities, pMCI patients were distinguished from sMCI patients with 50.88% accuracy (SEN 46.67%, SPE 54.55%, AUC 0.51). The 3D-ZM-based feature extraction slightly improved the prediction accuracy (ACC 53.10%, SEN 50.48%, SPE 55.37%, and AUC 0.52). As can be seen from Table 3, feature selection based on the traditional PSO algorithm significantly improved the prediction performance when compared to classification results using raw statistical features extracted with the 3D-ZM-based feature extraction technique or raw GM voxel intensities (ACC 68.58%, SEN 71.43%, SPE 66.12%, and AUC 0.62). However, the best classification performance was achieved using the proposed 3D-ZM-based feature extraction technique and the IDPSO with 75.66% accuracy (SEN 83.81%, SPE 68.60%, and AUC 0.76). Our accuracy of 75.66% for identifying pMCI patients from sMCI patients is very comparable with state-of-the-art approaches using baseline MRI data [13]. Figure 4 displays the receiver operating characteristic (ROC) curves belonging to the different scenarios, whereas Figure 5 shows the confusion matrixes.

4. Discussion

Many recent studies have investigated new pattern recognition methods for identifying the MCI patients who are at risk of developing dementia due to AD. For example, the researchers in [47] developed a new feature selection technique based on feature ranking and a genetic algorithm (GA) to select the optimal features with maximum discriminative power and minimum numbers of selected features for AD detection. They used the Fisher criterion as part of the objective function in the GA to evaluate the feature subsets. The method was tested on 458 subjects from the ADNI dataset using 10-fold cross-validation and the achieved accuracy, sensitivity, specificity, and AUC were 75%, 76.92 %, 73.23%, and 0.75%, respectively. The authors in [48] proposed a scoring strategy based on linear discriminant analysis (LDA) for the multiclass diagnosis of AD using four different modalities and genetic features. The LASSO algorithm and principal component analysis (PCA) technique were used to remove irrelevant and interfering features before LDA. A binary extreme learning machine-based tree decision classifier was built for multiclass classification, and an accuracy of 66.7% and F1-score of 64.9% were achieved [48]. The sulcal features (depth, length, mean and Gaussian curvature, and surface area) were computed for 24 distinct sulci per subject from 210 subjects in the ADNI database using the Brain VISA sulcal identification pipeline [49]. The SVM was used for classification and 10-fold cross-validation was used to evaluate the performance. The classification accuracy was found to be 87.9%, the sensitivity 90.0%, and the specificity 86.7% based on 10 features and the area under the receiver operating characteristic curve was 0.89. In [14], the authors developed a computer-aided diagnosis CAD framework for early detection and prediction of AD and mild MCI conversion. The proposed CAD framework used a merit-based feature selection method and whole-brain voxel-wise analysis of baseline MRI data. The impact of different MRI spatial resolutions on AD classification and MCI conversion prediction was also explored. The proposed CAD framework yielded high classification accuracies in identifying AD/healthy control, sMCI/pMCI, sMCI/AD, and pMCI/HC using a support vector machine classifier through a 10-fold cross-validation strategy at a spatial resolution of 2 mm. Table 4 shows the detailed parameters of MCI conversion prediction performance using various machine learning approaches and sMRI data.
In this study, we developed an MCI conversion prediction framework based on 3D-ZM and IDPSO algorithms. Basically, voxel-based feature extraction methods suffer from the curse of dimensionality. As a result, a stage of feature selection or feature reduction is required in the development of a robust prediction system. In addition to the voxel-based method, other feature extraction techniques have been widely used in the area of AD classification such as contourlet transform (CoT) [54], complex wavelet transforms (CWT) [55], discrete wavelet transform (DWT) [56], Shearlet transforms (ST) [57], moment methods [58], and histogram-based features generated from individual connectivity networks [15]. In this study, we extracted the statistical features from GM images using the 3D-ZM algorithm. The 3D-ZM algorithm is a highly effective statistical technique for capturing the shape, texture, and symmetry information of anatomical structures in 3D-MRI scans. One key advantage of using 3D-ZM over 2D ones is that they provide a more comprehensive representation of an object’s 3D shape. These moments allow for the extraction of a wide range of features from sMRI images, including measures of symmetry, such as the degree of asymmetry between left and right brain hemispheres, and measures of shape complexity, such as the number of protrusions or indentations in a brain structure. In addition, the 3D-ZM method can represent a low dimensional informative statistical pattern from the 3D-MRI scan. For example, our 3D-ZM method generated 372 statistical features from a 3D GM image with size of 121 × 145 × 121 voxels. Thus, the computational cost of the classification task can be significantly reduced by applying a 3D-ZM feature extraction which also improves the performance of classifiers. Our experimental results showed that a feature extraction based on the 3D-ZM algorithm can provide better features for MCI conversion prediction than the raw voxel value (see Table 3). However, some irrelevant features may still be included in the extracted set, thus increasing the complexity and decreasing the accuracy of classification. The main reason for applying feature selection is to decrease the dimensionality of the problem by eliminating ineffective features and enhancing classifier performance. This can be challenging due to the considerable number of features and the nonlinear relationship between accuracy and the number of features. In fact, selecting the most effective feature is considered a nonlinear optimization problem which can be solved by metaheuristic algorithms. These algorithms can intelligently search among all possible solutions to the problem and find the optimum one. Furthermore, they have shown a high ability to solve multi-objective optimization problems. Metaheuristic algorithms are particularly suitable for solving feature selection problems because they offer easy control over parameters. To date, only a few studies have employed metaheuristic algorithms in AD detection. For example, Beheshti and peers proposed a robust feature-selection method for AD classification and MCI conversion prediction on the basis of feature ranking and a GA algorithm [47].
In the case of sMRI data analysis, the PSO algorithm has been shown to be particularly effective at identifying features associated with the conversion from MCI to AD (Table 3). In fact, the PSO algorithm is known as a powerful algorithm among all available meta-heuristic methods. The key advantage of the PSO algorithm is its ability to search large feature spaces efficiently and effectively. The PSO algorithm achieves this by maintaining a population of candidate solutions, each of which represents a subset of features, and iteratively updating the positions of these solutions based on their fitness (i.e., their ability to predict the outcome variable accurately). The main advantage of the PSO algorithm over other feature selection methods, such as GA, simulated annealing (SA), and brain storm optimization (BSO), is its simplicity and efficiency. The PSO algorithm can converge quickly to an optimal solution, even in high-dimensional feature spaces. Other advantages of the PSO are easily controlled compared to other similar algorithms. In contrast, GA and SA algorithms can be computationally expensive and may require more complex fitness functions and encoding schemes to handle large feature sets. Moreover, genetic algorithms are prone to premature convergence and may require extensive parameter tuning to achieve optimal performance.
Standard PSO algorithms use a simple update rule, which can limit their ability to explore complex search spaces and converge to optimal solutions. Advanced PSO algorithms, on the other hand, incorporate additional features such as adaptive inertia weights, constriction factors, and social learning strategies to improve the efficiency and effectiveness of the optimization process. These features allow the algorithm to balance exploration and exploitation of the search space, adapt to changing conditions, and avoid premature convergence to suboptimal solutions. The adaptive inertia weights adjust the trade-off between global and local search based on the fitness of the candidate solutions, while constriction factors reduce the step size of the particles as they approach optimal solutions. Our experimental results showed that advanced PSO algorithms can outperform standard PSO algorithms in terms of convergence speed and solution quality, especially in complex optimization problems with high-dimensional search spaces (see Table 3). Moreover, we demonstrated that advanced PSO algorithms have a strong capability to identify the most informative features and improve the accuracy for MCI conversion prediction. To our knowledge, this is the first study that utilized 3D-ZM features along with the IDPSO algorithm for MCI conversion prediction, which is the most challenging and demanding task in the area of AD detection. This study was conducted based on the ADNI dataset, which was created using highly standardized protocols to distinguish individuals at different AD stages. For our MCI conversion prediction framework to be adapted in clinical settings, further validation using other datasets with different protocols is needed.

5. Conclusions

We developed a novel MCI conversion prediction framework on the basis of the 3D-ZM and ISPSO algorithms in this paper. In the first stage, a 3D-ZM algorithm was applied to extract the statistical features of 3D-sMRI images. At this stage, a total of 372 statistical features were extracted. Then, we developed a novel feature selection technique based on the IDPSO algorithm to find optimal features for MCI conversion prediction. We assessed the reliability of our MCI conversion prediction framework on 121 sMCI and 105 pMCI patients from the ADNI dataset. Experimental results showed that the proposed method has a strong ability to identify pMCI patients from sMCI patients, which can be useful for determining possible treatment trajectories.

Author Contributions

Conceptualization, P.B. and I.B.; methodology, P.B. and M.G.; software, P.B. and M.G.; validation, P.B., M.G. and M.M.; formal analysis, P.B. and M.G.; writing—original draft preparation, P.B., M.G. and M.M.; writing—review and editing, P.B., M.G. and I.B.; visualization, P.B. and M.G.; supervision, I.B and H.D. All authors have read and agreed to the published version of the manuscript.

Funding

This research received no specific grant from any funding agency in the public, commercial, or not-for-profit sectors.

Institutional Review Board Statement

Not applicable.

Informed Consent Statement

Not applicable.

Data Availability Statement

Data used in this article were obtained from Alzheimer’s Disease Neuroimaging Initiative (ADNI; https://adni.loni.usc.edu/data-samples/access-data/).

Acknowledgments

Data collection and sharing for this project was funded by the Alzheimer’s Disease Neuroimaging Initiative (ADNI), USA (National Institutes of Health Grant U01 AG024904), and the DOD ADNI, USA (Department of Defense award number W81XWH-12-2-0012). ADNI is funded by the National Institute on Aging, the National Institute of Biomedical Imaging and Bioengineering, and through generous contributions from the following: AbbVie, Alzheimer’s Association; Alzheimer’s Drug Discovery Foundation; Araclon Biotech; BioClinica, Inc.; Biogen; Bristol-Myers Squibb Company; CereSpir, Inc.; Cogstate; Eisai Inc.; Elan Pharmaceuticals, Inc.; Eli Lilly and Company; EuroImmun; F. Hoffmann-La Roche Ltd. and its affiliated company Genentech, Inc.; Fujirebio; GE Healthcare; IXICO Ltd.; Janssen Alzheimer Immunotherapy Research and Development, LLC.; Johnson and Johnson Pharmaceutical Research and Development LLC.; Lumosity; Lundbeck; Merck and Co., Inc.; Meso Scale Diagnostics, LLC.; NeuroRx Research; Neurotrack Technologies; Novartis Pharmaceuticals Corporation; Pfizer Inc.; Piramal Imaging; Servier; Takeda Pharmaceutical Company; and Transition Therapeutics. The Canadian Institute of Health Research is providing funds to support ADNI clinical sites in Canada. Private sector contributions are facilitated by the Foundation for the National Institutes of Health (www.fnih.org). The grantee organization is the Northern California Institute for Research and Education and the study is coordinated by the Alzheimer’s Therapeutic Research Institute at the University of Southern California. ADNI data are disseminated by the Laboratory for Neuro Imaging at the University of Southern California.

Conflicts of Interest

On behalf of all authors, the corresponding author states that there is no conflict of interest.

References

  1. Martinez-Murcia, F.J.; Ortiz, A.; Gorriz, J.M.; Ramirez, J.; Castillo-Barnes, D. Studying the Manifold Structure of Alzheimer’s Disease: A Deep Learning Approach Using Convolutional Autoencoders. IEEE J. Biomed. Health Inform. 2020, 24, 17–26. [Google Scholar] [CrossRef]
  2. Sharma, A.; Kaur, S.; Memon, N.; Jainul Fathima, A.; Ray, S.; Bhatt, M.W. Alzheimer’s patients detection using support vector machine (SVM) with quantitative analysis. Neurosci. Inform. 2021, 1, 100012. [Google Scholar] [CrossRef]
  3. Sperling, R.A.; Aisen, P.S.; Beckett, L.A.; Bennett, D.A.; Craft, S.; Fagan, A.M.; Iwatsubo, T.; Jack, C.R.; Kaye, J.; Montine, T.J.; et al. Toward defining the preclinical stages of Alzheimer’s disease: Recommendations from the National Institute on Aging-Alzheimer’s Association workgroups on diagnostic guidelines for Alzheimer’s disease. Alzheimer’s Dement. 2011, 7, 280–292. [Google Scholar] [CrossRef] [Green Version]
  4. Pereira, T.; Ferreira, F.L.; Cardoso, S.; Silva, D.; De Mendonça, A.; Guerreiro, M.; Madeira, S.C. Neuropsychological predictors of conversion from mild cognitive impairment to Alzheimer’s disease: A feature selection ensemble combining stability and predictability. BMC Med. Inform. Decis. Mak. 2018, 18, 137. [Google Scholar] [CrossRef] [Green Version]
  5. Selkoe, D.J. Alzheimer’s disease: Genotypes, phenotypes, and treatments. Science 1997, 275, 630–631. [Google Scholar] [CrossRef]
  6. Benefits, P. Alzheimer’s Disease Facts and Figures Includes a Special Report on the Financial and Personal Benefits of Early Diagnosis; Alzheimer’s Association: Chicago, IL, USA, 2018. [Google Scholar]
  7. Petersen, R.C.; Doody, R.; Kurz, A.; Mohs, R.C.; Morris, J.C.; Rabins, P.V.; Ritchie, K.; Rossor, M.; Thal, L.; Winblad, B. Current concepts in mild cognitive impairment. Arch. Neurol. 2001, 58, 1985–1992. [Google Scholar] [CrossRef]
  8. Ramírez, J.; Górriz, J.M.; Ortiz, A.; Martínez-Murcia, F.J.; Segovia, F.; Salas-Gonzalez, D.; Castillo-Barnes, D.; Illán, I.A.; Puntonet, C.G. Ensemble of random forests One vs. Rest classifiers for MCI and AD prediction using ANOVA cortical and subcortical feature selection and partial least squares. J. Neurosci. Methods 2018, 302, 47–57. [Google Scholar] [CrossRef]
  9. Amoroso, N.; Diacono, D.; Fanizzi, A.; La Rocca, M.; Monaco, A.; Lombardi, A.; Guaragnella, C.; Bellotti, R.; Tangaro, S. Deep learning reveals Alzheimer’s disease onset in MCI subjects: Results from an international challenge. J. Neurosci. Methods 2018, 302, 3–9. [Google Scholar] [CrossRef] [Green Version]
  10. Forouzannezhad, P.; Abbaspour, A.; Li, C.; Cabrerizo, M.; Adjouadi, M. A Deep Neural Network Approach for Early Diagnosis of Mild Cognitive Impairment Using Multiple Features. In Proceedings of the 2018 17th IEEE international conference on machine learning and applications (ICMLA), Orlando, FL, USA, 17–20 December 2018; pp. 1341–1346. [Google Scholar] [CrossRef]
  11. Kim, D.; Kim, K. Detection of Early Stage Alzheimer’s Disease using EEG Relative Power with Deep Neural Network. In Proceedings of the 2018 40th Annual International Conference of the IEEE Engineering in Medicine and Biology Society (EMBC), Honolulu, HI, USA, 18–21 July 2018; pp. 352–355. [Google Scholar] [CrossRef]
  12. Saleem, T.J.; Zahra, S.R.; Wu, F.; Alwakeel, A.; Alwakeel, M. Deep Learning-Based Diagnosis of Alzheimer’ s Disease. J. Pers. Med. 2022, 12, 815. [Google Scholar] [CrossRef]
  13. Rathore, S.; Habes, M.; Iftikhar, M.A.; Shacklett, A.; Davatzikos, C. A review on neuroimaging-based classification studies and associated feature extraction methods for Alzheimer’s disease and its prodromal stages. Neuroimage 2017, 155, 530–548. [Google Scholar] [CrossRef]
  14. Beheshti, I.; Hossein-Abad, H.M.; Matsuda, H. Identification of alzheimer’s disease on the basis of a voxel-wise approach. Appl. Sci. 2019, 9, 3063. [Google Scholar] [CrossRef] [Green Version]
  15. Beheshti, I.; Maikusa, N.; Daneshmand, M.; Matsuda, H.; Demirel, H.; Anbarjafari, G. Classification of Alzheimer’s disease and prediction of mild cognitive impairment conversion using histogram-based analysis of patient-specific anatomical brain connectivity networks. J. Alzheimer’s Dis. 2017, 60, 295–304. [Google Scholar] [CrossRef]
  16. Min, R.; Wu, G.; Cheng, J.; Wang, Q.; Shen, D. Multi-atlas based representations for Alzheimer’s disease diagnosis. Hum. Brain Mapp. 2014, 35, 5052–5070. [Google Scholar] [CrossRef] [Green Version]
  17. Sørensen, L.; Igel, C.; Liv Hansen, N.; Osler, M.; Lauritzen, M.; Rostrup, E.; Nielsen, M. Early detection of Alzheimer’s disease using MRI hippocampal texture. Hum. Brain Mapp. 2016, 37, 1148–1161. [Google Scholar] [CrossRef]
  18. Li, J.; Cheng, K.; Wang, S.; Morstatter, F.; Trevino, R.P.; Tang, J.; Liu, H. Feature selection: A data perspective. ACM Comput. Surv. 2017, 50, 1–45. [Google Scholar] [CrossRef] [Green Version]
  19. Langley, P. Selection of Relevant Features in Machine Learning. In Proceedings of the AAAI Fall Symposium on Relevance, New Orleans, LA, USA, 4–6 November 1994; pp. 140–144. [Google Scholar]
  20. Li, H.T.; Yuan, S.X.; Wu, J.S.; Gu, Y.; Sun, X. Predicting conversion from mci to ad combining multi-modality data and based on molecular subtype. Brain Sci. 2021, 11, 674. [Google Scholar] [CrossRef]
  21. Jiao, Z.; Chen, S.; Shi, H.; Xu, J. Multi-Modal Feature Selection with Feature Correlation and Feature Structure Fusion for MCI and AD Classification. Brain Sci. 2022, 12, 80. [Google Scholar] [CrossRef]
  22. Spasov, S.; Passamonti, L.; Duggento, A.; Liò, P.; Toschi, N. A parameter-efficient deep learning approach to predict conversion from mild cognitive impairment to Alzheimer’s disease. Neuroimage 2019, 189, 276–287. [Google Scholar] [CrossRef] [Green Version]
  23. Dinu, A.J.; Ganesan, R. Early detection of alzheimer’s disease using predictive k-nn instance based approach and t-test method. Int. J. Adv. Trends Comput. Sci. Eng. 2019, 8, 29–37. [Google Scholar] [CrossRef]
  24. Saputra, R.A.; Agustina, C.; Puspitasari, D.; Ramanda, R.; Warjiyono; Pribadi, D.; Lisnawanty; Indriani, K. Detecting Alzheimer’s Disease by the Decision Tree Methods Based on Particle Swarm Optimization. J. Phys. Conf. Ser. 2020, 1641, 012025. [Google Scholar] [CrossRef]
  25. Ali, M.S.; Islam, M.K.; Haque, J.; Das, A.A.; Duranta, D.S.; Islam, M.A. Alzheimer’s Disease Detection Using m-Random Forest Algorithm with Optimum Features Extraction. In Proceedings of the 2021 1st International Conference on Artificial Intelligence and Data Analytics (CAIDA), Riyadh, Saudi Arabia, 6–7 April 2021; pp. 1–6. [Google Scholar] [CrossRef]
  26. Vichianin, Y.; Khummongkol, A.; Chiewvit, P.; Raksthaput, A.; Chaichanettee, S.; Aoonkaew, N.; Senanarong, V. Accuracy of Support-Vector Machines for Diagnosis of Alzheimer’s Disease, Using Volume of Brain Obtained by Structural MRI at Siriraj Hospital. Front. Neurol. 2021, 12, 640696. [Google Scholar] [CrossRef]
  27. Farokhian, F.; Beheshti, I.; Sone, D.; Matsuda, H. Comparing CAT12 and VBM8 for detecting brain morphological abnormalities in temporal lobe epilepsy. Front. Neurol. 2017, 8, 428. [Google Scholar] [CrossRef]
  28. Ghosal, S.; Mehrotra, R.; Louis, S. Zernike Moment-Based Feature Detectors Center for Computational Math University of Colorado at Denver. In Proceedings of the 1st International Conference on Image Processing, Austin, TX, USA, 13–16 November 1994; pp. 934–938. [Google Scholar]
  29. Teh, C.H.; Chin, R.T. On image analysis by the methods of moments. IEEE Trans. Pattern Anal. Mach. Intell. 1988, I, 556–561. [Google Scholar] [CrossRef]
  30. Ahmady, M.; Ghasemi, R.; Rashidy Kanan, H. Local weighted Pseudo Zernike Moments and fuzzy classification for facial expression recognition. In Proceedings of the 2013 13th Iranian Conference on Fuzzy Systems (IFSC), Qazvin, Iran, 27–29 August 2013; pp. 11–14. [Google Scholar] [CrossRef]
  31. Wang, S.L.; Xu, Y.R.; Pang, Y.J. A new Pseudo-Zernike boundary moment for marine targets feature extraction. In Proceedings of the 2011 Third Pacific-Asia Conference on Circuits, Communications and System (PACCS), Wuhan, China, 17–18 July 2011. [Google Scholar] [CrossRef]
  32. Vengurlekar, S.G.; Jadhav, D.; Shinde, S. Object Detection and Tracking using Zernike Moment. In Proceedings of the 2019 International Conference on Communication and Electronics Systems (ICCES), Coimbatore, India, 17–19 July 2019; pp. 12–17. [Google Scholar] [CrossRef]
  33. Poli, R. Mean and variance of the sampling distribution of particle swarm optimizers during stagnation. IEEE Trans. Evol. Comput. 2009, 13, 712–721. [Google Scholar] [CrossRef]
  34. Gu, S.; Cheng, R.; Jin, Y. Feature selection for high-dimensional classification using a competitive swarm optimizer. Soft Comput. 2018, 22, 811–822. [Google Scholar] [CrossRef] [Green Version]
  35. Xue, B.; Zhang, M.; Browne, W.N. Particle swarm optimization for feature selection in classification: A multi-objective approach. IEEE Trans. Cybern. 2013, 43, 1656–1671. [Google Scholar] [CrossRef]
  36. Tan, T.Y.; Zhang, L.; Lim, C.P.; Fielding, B.; Yu, Y.; Anderson, E. Evolving Ensemble Models for Image Segmentation Using Enhanced Particle Swarm Optimization. IEEE Access 2019, 7, 34004–34019. [Google Scholar] [CrossRef]
  37. Phong, N.H.; Santos, A.; Ribeiro, B. PSO-Convolutional Neural Networks with Heterogeneous Learning Rate. IEEE Access 2022, 10, 89970–89988. [Google Scholar] [CrossRef]
  38. Fernandes Junior, F.E.; Yen, G.G. Particle swarm optimization of deep neural networks architectures for image classification. Swarm Evol. Comput. 2019, 49, 62–74. [Google Scholar] [CrossRef]
  39. Al-Maamari, A.; Omara, F.A. Task scheduling using PSO algorithm in cloud computing environments. Int. J. Grid Distrib. Comput. 2015, 8, 245–256. [Google Scholar] [CrossRef]
  40. Li, X.; Guo, J.; Hu, J. An improved PSO algorithm and its application in GNSS ambiguity resolution. Appl. Sci. 2018, 8, 990. [Google Scholar] [CrossRef] [Green Version]
  41. Zhang, J.; Zhai, Y.; Han, Z.; Lu, J. Improved particle swarm optimization based on entropy and its application in implicit generalized predictive control. Entropy 2022, 24, 48. [Google Scholar] [CrossRef]
  42. Cheng, S. Population Diversity in Particle Swarm Optimization: Definition, Observation, Control, and Application. Ph.D. Thesis, University of Liverpool, Liverpool, UK, 2013. [Google Scholar]
  43. Fan, S.K.S.; Jen, C.H. An enhanced partial search to particle swarm optimization for unconstrained optimization. Mathematics 2019, 7, 357. [Google Scholar] [CrossRef] [Green Version]
  44. Ardiansyah, A.; Ferdiana, R.; Permanasari, A.E. MUCPSO: A Modified Chaotic Particle Swarm Optimization with Uniform Initialization for Optimizing Software Effort Estimation. Appl. Sci. 2022, 12, 1081. [Google Scholar] [CrossRef]
  45. Yuan, Z.; Yao, X.; Bu, X. Classification of Alzheimer’s Disease Using Conventional Machine Learning Methods with Cortical and Genetic Characteristics. In Proceedings of the 2022 IEEE 2nd International Conference on Power, Electronics and Computer Applications (ICPECA), Shenyang, China, 21–23 January 2022; pp. 303–306. [Google Scholar] [CrossRef]
  46. Tanveer, M.; Richhariya, B.; Khan, R.U.; Rashid, A.H.; Khanna, P.; Prasad, M.; Lin, C.T. Machine learning techniques for the diagnosis of alzheimer’s disease: A review. ACM Trans. Multimed. Comput. Commun. Appl. 2020, 16, 1–35. [Google Scholar] [CrossRef]
  47. Beheshti, I.; Demirel, H.; Matsuda, H. Classification of Alzheimer’s disease and prediction of mild cognitive impairment-to-Alzheimer’s conversion from structural magnetic resource imaging using feature ranking and a genetic algorithm. Comput. Biol. Med. 2017, 83, 109–119. [Google Scholar] [CrossRef]
  48. Lin, W.; Gao, Q.; Du, M.; Chen, W.; Tong, T. Multiclass diagnosis of stages of Alzheimer’s disease using linear discriminant analysis scoring for multimodal data. Comput. Biol. Med. 2021, 134, 104478. [Google Scholar] [CrossRef]
  49. Plocharski, M.; Østergaard, L.R. Extraction of sulcal medial surface and classification of Alzheimer’s disease using sulcal features. Comput. Methods Programs Biomed. 2016, 133, 35–44. [Google Scholar] [CrossRef] [Green Version]
  50. Xiao, R.; Cui, X.; Qiao, H.; Zheng, X.; Zhang, Y.; Zhang, C.; Liu, X. Early diagnosis model of Alzheimer’s disease based on sparse logistic regression with the generalized elastic net. Biomed. Signal Process. Control 2021, 66, 102362. [Google Scholar] [CrossRef]
  51. Abrol, A.; Bhattarai, M.; Fedorov, A.; Du, Y.; Plis, S.; Calhoun, V. Deep residual learning for neuroimaging: An application to predict progression to Alzheimer’s disease. J. Neurosci. Methods 2020, 339, 108701. [Google Scholar] [CrossRef] [Green Version]
  52. Liu, X.; Tosun, D.; Weiner, M.W.; Schuff, N. Locally linear embedding (LLE) for MRI based Alzheimer’s disease classification. Neuroimage 2013, 83, 148–157. [Google Scholar] [CrossRef] [Green Version]
  53. Liu, J.; Li, M.; Lan, W.; Wu, F.X.; Pan, Y.; Wang, J. Classification of Alzheimer’s Disease Using Whole Brain Hierarchical Network. IEEE/ACM Trans. Comput. Biol. Bioinforma 2018, 15, 624–632. [Google Scholar] [CrossRef]
  54. Feng, J.; Zhang, S.W.; Chen, L.; Xia, J. Alzheimer’s disease classification using features extracted from nonsubsampled contourlet subband-based individual networks. Neurocomputing 2021, 421, 260–272. [Google Scholar] [CrossRef]
  55. Ghorbanian, P.; Devilbiss, D.M.; Simon, A.J.; Bernstein, A.; Hess, T.; Ashrafiuon, H. Continuous wavelet transform eeg features of alzheimer’s disease. In Proceedings of the ASME 2012 5th Annual Dynamic Systems and Control Conference joint with the JSME 2012 11th Motion and Vibration Conference, Fort Lauderdale, FL, USA, 17–19 October 2012; Volume 1, pp. 567–572. [Google Scholar] [CrossRef]
  56. Zhang, Y.; Wang, S. Detection of Alzheimer’s disease by displacement field and machine learning. PeerJ 2015, 3, e1251. [Google Scholar] [CrossRef] [Green Version]
  57. Alinsaif, S.; Lang, J. 3D shearlet-based descriptors combined with deep features for the classification of Alzheimer’s disease based on MRI data. Comput. Biol. Med. 2021, 138, 104879. [Google Scholar] [CrossRef]
  58. Gorji, H.T.; Haddadnia, J. A novel method for early diagnosis of Alzheimer’s disease based on pseudo Zernike moment from structural MRI. Neuroscience 2015, 305, 361–371. [Google Scholar] [CrossRef]
Figure 1. Block diagram of the proposed MCI conversion prediction framework.
Applsci 13 04489 g001
Figure 2. The movements of particles in PSO.
Applsci 13 04489 g002
Figure 3. Proposed IDPSO.
Applsci 13 04489 g003
Figure 4. Receiver operating characteristics curves of MCI conversion prediction using different scenarios.
Applsci 13 04489 g004
Figure 5. The confusion matrixes for pMCI vs. sMCI task using different scenarios.
Applsci 13 04489 g005
Table 1. Characteristics of the subjects used in this study.
CategoryGender
(F/M)
AgeCDRMMSE
pMCI39/6674.95 ± 6.60.5 ± 0.026.6 ± 1.7
sMCI41/8074.45 ± 7.580.5 ± 0.027.3 ± 1.87
Note: all data are presented in mean ± standard deviation mode. CDR: Clinical Dementia Rating; MMSE: Mini-Mental State Examination; F: Female; M: Male.
Table 2. A sample particle representation of selected features.
No. Featuref1f2f3f4f5fn−1fn
Particle value1011010
Table 3. Experimental results of MCI conversion prediction using different scenarios.
MethodAccuracy (%)Sensitivity (%)Specificity (%)AUC
Voxel-based50.8846.6754.550.51
3DZM-based53.1050.4855.370.523
PSO-3DZM-based68.5871.4366.120.69
IDPSO-3DZM-based75.6683.8168.600.76
Table 4. State-of-the-artpMCI to sMCI prediction techniques using sMRI data.
ReferencepMCI/sMCIValidation MethodACC (%)SEN (%)SPE (%)AUCConversion Time (Months)
Xiao et al. (2020) [50]51/4510-Fold75.8773.7177.51------
Abrol et al. (2020) [51]189/2455-Fold83.01----------0–36
Beheshti et al. (2017) [47]71/6210-Fold75.0076.9273.230.750–36
Lin et al. (2021) [48]110/2085-Fold81.2%-------------
Liu et al. (2013) [52]97/93---69.0066.0072.00---0–36
Beheshti et al. (2019) [14]112/10210-Fold74.7773.2176.470.740–36
Liu et al. (2018) [53]120/16010-Fold72.08 75:11 71.05 0.710–18
Proposed Method105/12110-Fold75.6683.8168.600.750–36
Disclaimer/Publisher’s Note: The statements, opinions and data contained in all publications are solely those of the individual author(s) and contributor(s) and not of MDPI and/or the editor(s). MDPI and/or the editor(s) disclaim responsibility for any injury to people or property resulting from any ideas, methods, instructions or products referred to in the content.

