Article

SEBD: A Stream Evolving Bot Detection Framework with Application of PAC Learning Approach to Maintain Accuracy and Confidence Levels

1
College of Information Technology, United Arab Emirates University, Al Ain P.O. Box 15551, United Arab Emirates
2
College of Interdisciplinary Studies, Computational Systems, Zayed University, Abu Dhabi P.O. Box 144534, United Arab Emirates
*
Author to whom correspondence should be addressed.
Appl. Sci. 2023, 13(7), 4443; https://doi.org/10.3390/app13074443
Submission received: 6 March 2023 / Revised: 28 March 2023 / Accepted: 29 March 2023 / Published: 31 March 2023
(This article belongs to the Special Issue Social Network Analysis: Opportunities and Challenges)

Abstract

:
A simple supervised learning model can predict a class from trained data based on the previous learning process. Trust in such a model can be gained through evaluation measures that ensure fewer misclassification errors in prediction results for different classes. This can be applied to supervised learning using a well-trained dataset that covers different data points and has no imbalance issues. This task is challenging when it integrates a semi-supervised learning approach with a dynamic data stream, such as social network data. In this paper, we propose a stream-based evolving bot detection (SEBD) framework for Twitter that uses a deep graph neural network. Our SEBD framework was designed based on multi-view graph attention networks using fellowship links and profile features. It integrates Apache Kafka to enable the Twitter API stream and predict the account type after processing. We used a probably approximately correct (PAC) learning framework to evaluate SEBD’s results. Our objective was to maintain the accuracy and confidence levels of our framework to enable successful learning with low misclassification errors. We assessed our framework results via cross-domain evaluation using test holdout, machine learning classifiers, benchmark data, and a baseline tool. The overall results show that SEBD is able to successfully identify bot accounts in a stream-based manner. Using holdout and cross-validation with a random forest classifier, SEBD achieved an accuracy score of 0.97 and an AUC score of 0.98. Our results indicate that bot accounts participate highly in hashtags on Twitter.

1. Introduction

In the last decade, the rise of bot accounts has filled the ecosystem of social network websites with fake news and misinformation [1,2]. The problem with the involvement of such accounts in different world events has consequences in real life [3]. For example, the COVID-19 pandemic witnessed the role of bots in spreading misinformation [4]. Additionally, social bot accounts are involved in increasing polarization between different parties in elections worldwide [5,6]. The impacts of bot accounts are not limited to political events, but also affect financial [7] and health-related [8] events, in addition to others.
Bot designs increasingly adapt to the changes that social networks put in place. For example, Twitter has updated its rules to eliminate automation behavior from its users [9,10]. Despite these rules, bots work in an orchestrated manner to avoid being detected [11]. Therefore, it is important to reveal such hidden relationships between botnet members using graph neural networks, as they have proven to be successful at extracting such hidden information.
Since the beginning of social network platforms, researchers have recognized these accounts as sources of spam and viruses [12,13,14]. An increasing amount of research has been conducted using machine learning algorithms after the increased use of these accounts to inflate the social networks [2,15]. Due to the lack of sufficient labeled data, including sufficiently large samples of bots, supervised learning algorithms are unable to keep up with the rapidly developing feature sets and behaviors of modern bots. The performance of any algorithm generally depends on the quality of the training sample. If such an algorithm obtains a low generalization error on a large subset of training data, it does not provide sufficient evidence that the function is learnable. For this reason, we specify that the algorithm must be adaptable to a wide variety of training datasets in order to be considered learnable. A function is learnable if there is an algorithm that, with a high probability, yields a good generalization error when trained on a randomly selected training set.
One of the popular theoretical definitions of learnability is PAC learnability. PAC (probably approximately correct) learning is a mathematical analytical framework [16]. A PAC learner attempts to learn a concept (about correct) by selecting a hypothesis with a low generalization error from a set of hypotheses. In the context of machine learning, a problem is PAC-learnable if there exists an algorithm A that, given some independently drawn samples, would provide a hypothesis with a small error and a high probability for any distribution D and any concept C. It may not be possible to develop a perfect hypothesis with zero error; thus, the objective is to find a consistent hypothesis that can make approximately accurate predictions with an error upper bound.
As a consequence, detecting social bots in a stream-based manner is essential to mitigating their impact within a short period. In this paper, we propose a stream-based evolving bot detection framework (SEBD). Our framework was built using “following” links and a few profile features to identify bot accounts in a stream-based manner, using our trained model in [17] and the setup outlined in [18]. The following links are defined when account A follows account B. In [17], the model was built using a multi-view graph attention network via a transfer learning approach using both following links and interaction links. The model was able to achieve an accuracy score of 97.8%, an F1 score of 0.9842, and an MCC score of 0.9481. The graph attention mechanism with multi-view was able to reveal the hidden representations of nodes.
In SEBD, we used only fellowship links to reduce the complexity costs of online processing. Our goal was to examine the model’s ability to identify bot accounts in a stream environment and predict them correctly. The results were saved to perform offline evaluation. Then, a PAC learning framework was applied to ensure the confidence and accuracy levels of our framework, and generalize our model. This will maintain good classification rates, and lower the misclassification error for bot and human classes. Thus, we ensured that our model is adaptive to different training samples to perform the task of classifying Twitter accounts into humans and bots in a stream-based manner.
Our contributions are as follows:
  • We propose a stream-based evolving bot detection (SEBD) framework using multi-view graph attention networks, Apache Kafka, and the Twitter API.
  • We conducted a stream prediction phase and, then, apply PAC learnability in an offline phase to measure the accuracy and confidence levels of our model’s learning.
  • We evaluated SEBD via cross-domain evaluation methods using test holdout with cross-validation, a benchmark dataset, a baseline tool, and machine learning classifiers. We collected our data based on scenarios and hashtags with random training samples to ensure the generalization of our model.
The rest of this paper is organized as follows. Related work is presented in Section 2. In Section 3, we present the methodology. Section 4 discusses the proposed framework results. Section 5 highlights the remaining challenges in this domain and considers future directions for research efforts that aim to address this problem.

2. Related Work

2.1. Graph Neural Networks

Deep learning techniques based on graphs have recently received increasing attention. The capacity of graph neural networks (GNNs) to learn to extract latent representation from the complex relationships and interactions of a given network has led them to gain popularity. GNNs are capable of graphing structured data for tasks such as node classification, link prediction, and graph classification [19]. GNNs are categorized into recurrent graph neural networks (RGNNs), convolutional graph neural networks (CGNNs), graph auto-encoders (GAEs), and spatio-temporal graph neural networks (STGNNs) [20]. The classic convolutional neural network (CNN), which operates in the Euclidean domain, is being extended to arbitrary graphs through extensive research [21]. Graph convolutional networks (GCNs) were proposed in [22]. They built graph convolution networks via local first-order approximation of spectral convolution. The embeddings of nodes represented aggregated information from nearby neighbors. Numerous researchers have since carried out studies in this area. An inductive framework, GraphSAGE, was proposed by William et al. [23]. The framework effectively constructs node embedding for unseen data utilizing feature aggregation and node sampling technology, which resolves the issue of GCN being unable to compute the whole graph Laplacian. Each layer’s output embedding, which demonstrates how to extract nodes from the neighborhood of node aggregate data, depends on all the neighbors of the layer above it. An attention-based design was suggested by Velickovic et al. [24] to categorize graph structure data.

2.2. Bot Detection

The impact of automated information dissemination on Twitter during big events, such as elections and social media activism, has been addressed by several studies. Bots have been involved in the dissemination of such information, as shown by studies of the 2016 US presidential elections in which the authors created regression models for the diffusion of political messages [5,25]. Bots have also been seen to advocate for activist participation at extreme rallies to manipulate social networks [26]. These developments raise concerns, as bots’ effects on humans have been linked to increased divisiveness and violence in society.
To counter the spread of false and damaging information on social media, bot detection platforms have been proposed. There are many well-received supervised bot detection methods in the literature, some of which include features such as text recognition [27], profile features [28], network features [29], and temporal patterns [30]. These methods were created with the help of reference datasets that were annotated to indicate whether an agent is a bot.
Botometer, DeBot, and BotHunter are three popular supervised bot detection solutions. These algorithms were trained on massive volumes of data from events, such as the 2016 US election, that were manually labeled with bot/human classifications. A total of 1150 characteristics are retrieved from each Twitter agent and used in Botometer’s supervised ensemble classification [31,32]. Botometer uses features based on users, tweet content, and the network of followers. DeBot [30] uses temporal patterns of account activity, spotting commonalities, differences, and shifting groupings that characterize bot behavior. This technique rests on the premise that a high degree of correlation between the profiles of different social media users is indicative of bot behavior. In [33], BotHunter categorizes Twitter agents using a supervised random forest method via a multi-tiered approach; each approach makes use of additional features as in previous work, from the content to the user to network features, and retrains the supervised model. It uses local categorization evaluation of Twitter agents and accepted tweets from the past as input from a file.
Due to the shortage of labeled data for supervised learning (SL) approaches, researchers have been seeking alternatives to SL in order to improve the accuracy of social bot identification using semi-supervised learning (SSL) or unsupervised learning (UL). Recently, ref. [34] proposed a spam detection method using an unsupervised approach. Their model integrates peer acceptance using interaction interest to distinguish genuine users from spam bots. In [35], the authors present a GAN approach with long short-term memory (LSTM) as a method for text-based bot detection. To determine the behaviors of bot samples for a specific classifier, they intended to raise the true-positive rate and lower the false-negative rate. DeeProbot [36] is a hybrid deep learning model that utilizes profile features and handles profile description text using a pre-trained global vector (GLoVe) for word representation. In [37], the author proposed a deep learning framework with the integration of three LSTM models to classify users engaging in interaction activity. Feng et al., (2021) proposed a self-learning framework (SATAR) for the detection of Twitter bots and it was built to be adaptable by pre-training a sizable number of users [38]. In doing so, they attempted to solve the issue of outdated Twitter bot generations.
Using self-supervised GNN with reinforcement learning (RL), the authors of [39] proposed a model for bot detection that determines the best multi-hop neighborhood and the number of layers in the GNN architecture. Recent studies have proposed employing GCNNs to improve spam bot detection using relational graph convolution networks (BotRGCN) [40] and GCNNs [41]. In [41], the authors used graph convolutional neural networks on a well-known spam bot dataset, and the results were better than those of previous methods. However, the problem with old datasets is that they are easy to spot, as they do not have the most recent bots in them.

2.3. PAC Learning

PAC (probably approximately correct) learning is a framework for analyzing the performance of machine learning algorithms in terms of their ability to learn a concept from a given set of training data. The framework was introduced by Leslie Valiant in 1984 [42], and it provides a theoretical foundation for understanding the limitations and capabilities of learning algorithms.
In the PAC learning framework, the goal is to learn a hypothesis function h that accurately predicts the output of a target function f on new, unseen data. The hypothesis function h is selected from a hypothesis space H , which is a set of possible functions that could potentially approximate the target function f . The quality of the hypothesis function h is evaluated in terms of its generalization error, which is the error rate of the hypothesis on new, unseen data.
Let X be the input space of instances of a dataset in a fixed, unknown distribution of D . X D   and Y 0 , 1 , where 0 represents a human label and 1 represents a bot label. We define the relationship between samples and labels using the labeling function f : X Y such that each y i = f   x i .
Let S be an independent and identically distributed (i.i.d.) training set that is drawn from a joint distribution P defined as D × 0 , 1 :
S = X 1 , Y 1 , ,   X n , Y n
where x i X and y i Y .
Let H denote the hypothesis class that consists of all possible hypotheses that our model can represent. A denotes the learning algorithm that maps dataset   S to a hypothesis h S H . Let C be a set of possible target concepts, where f     C : X     Y . We aim to find a hypothesis h which has a small generalization error or true error compared to c.
We define the lowest possible empirical risk minimization (ERM) error of a given hypothesis h S as:
h S = ERM H S arg min L S h h H
Based on the PAC learning definition [42], a hypothesis class H is PAC-learnable if there exist the function m H   :   0 ,   1 2     N and a learning algorithm that outputs h S   H, such that for all distributions D for which realizability holds, w.r.t. H and all ε, δ (0, 1).
L D   h S     ε   with   probability     1   δ ,   whenever   m     m H ε ,   δ
The function m H determines the sample complexity of learning H to guarantee a PAC solution.
m H ε , δ log H δ ε

3. Methodology

3.1. SEBD Architecture and Framework Phases

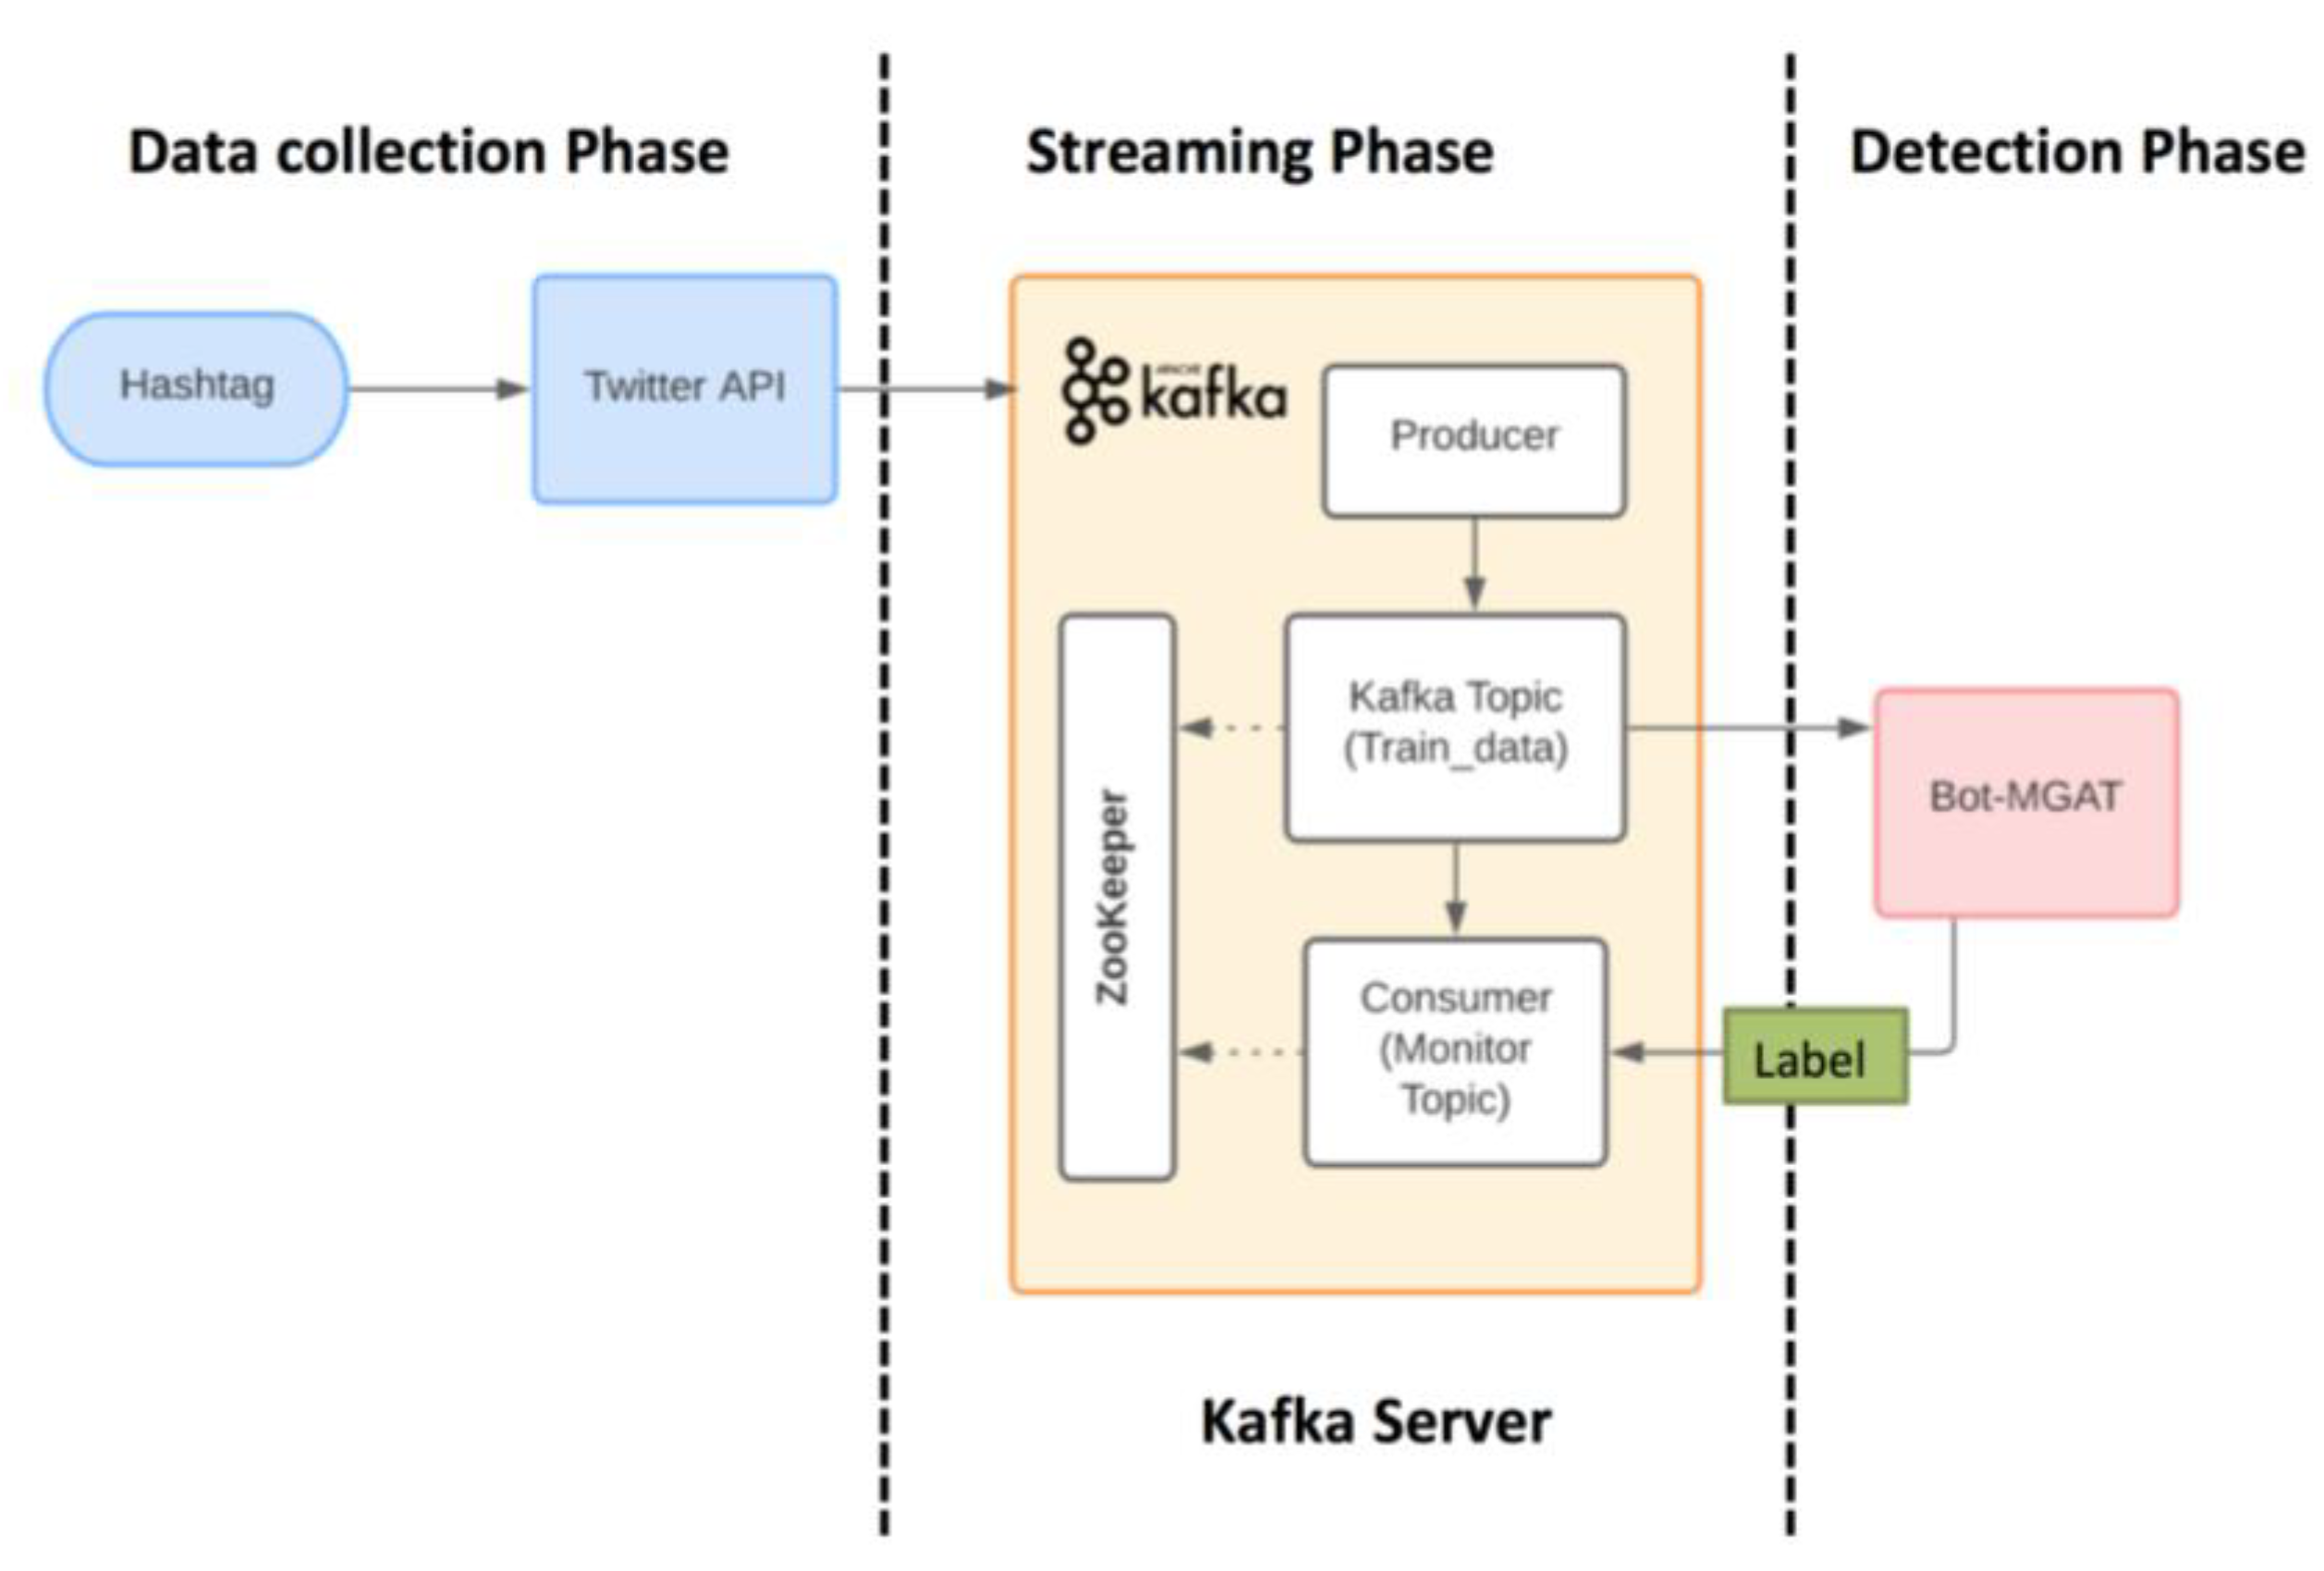
Figure 1 depicts the SEBD architecture. There are three phases for the framework. The first is the data collection phase. It starts by entering a hashtag to the Twitter API. The Twitter platform has developed an application-programming interface (API) to retrieve recent and popular tweets for research and development purposes. The API will fetch the required data about users’ accounts and filter the collected tweets using queries. Queries are keywords that help in retrieving the tweets of interest. From these tweets, we can collect different information regarding the owner of the tweet, the date of its creation, and any interactions that happen with it (replies, retweets, quoting, favorites, etc.) [18].
The second phase is the streaming phase. We used Apache Kafka, which is an open-source, fault tolerant, and distributed publish–subscribe messaging system for handling stream data [43]. It has been used by different popular social media platforms (Twitter and Netflix) due its scalability, manner of data distribution, and high availability [44]. The main parts of the Apache Kafka server in the streaming phase are shown in Figure 1. The collected data are sent to a Kafka topic through the Kafka producer.
The producer is responsible for publishing messages to Kafka topics. A Kafka topic is considered a container for storing messages and can comprise several partitions. Consumers subscribe to different topics and consume the messages by pulling them. Zookeeper software is used to manage and synchronize the information between different brokers (Kafka servers) in the Kafka cluster. On the other hand, Kafka consumers subscribe to topics and retrieve the relevant data.
In the last phase, the detection phase, we used our pre-trained model (Bot-MGAT) to predict the label of each account. These labels will be sent to another Kafka topic. A console consumer can be run on that topic to observe the labels in an online manner, as shown in Algorithm 1. Bot-MGAT is built using graph attention networks (GATs), which are a form of graph neural network in which nodes are assigned varying weights on the graph’s edges to reflect their relative significance. Self-attention is used to perform the weighting, which combines nodes’ and neighbors’ embeddings and applies a linear transformation [45]. Multiple perspectives can be taken on the same set of nodes in a multi-view graph, which is a type of relational graph (or, technically, multiple graphs with the same nodes, but different edges). Bot-MGAT is a model that performs relation-wise self-attention. This means that an attention mechanism is applied to each view of the graph and the resultant nodes’ embeddings are combined to perform classification tasks [22]. We trained Bot-MGAT using Twi-Bot20 [46], a benchmark dataset that is recent and diverse.
Algorithm 1: SEBD Framework.
#Data Collection Phase
Input to Twitter API: hashtag
Output user features Uf, follower edges Ufollower, following edges Ufollowing, follower features featfollower, following features featfollowing
#Streaming Phase
1If hashtag == ‘done’:
2  Data ← (Uf, Ufollower, Ufollowing, featfollower, featfollowing)
3  KafkaProducer.send (topic = ‘train_data’, value = Data)
4Else:
5  Continue Data Collection Phase
#Detection Phase
6Message ← KafkaConsumer.poll (topic = ‘train_data’)
7Proc_message ← pre_process (Message)
8Model ← load_pretrained (Bot-MGAT)
9Label ← Model (Proc_message)
10KafkaProducer.send (topic = ‘monitor’, value = Label)
#Result Monitoring
11ConsoleConsumer.poll (topic = ‘monitor’)

3.2. Data Acquisition and Preprocessing

The data collection process was performed over two different durations and time periods. We aimed to evaluate the performance of our model using two different groups of samples. The first sample group was used to evaluate the general performance in stream prediction using offline evaluation and a benchmark dataset. The second sample was used to evaluate the model confidence using PAC parameters to ensure learnability. The data were collected using the Twitter API.
For the first dataset collection (group 1) that took place during late September 2022, we chose 6 hashtags of different interests, as shown in Table 1. For each hashtag, we collected information on 50 users. For each user, we extracted information on 10 followers and 10 followings (friends). This helped in constructing the follower–following relationship graph to which we would apply our model. The reason for choosing such a small dataset was the rate limit of the Twitter API, which causes it to wait for a certain period of time after several API requests (https://developer.twitter.com/en/docs/twitter-api/rate-limits, accessed on 30 December 2022). The total estimated number of accounts was 6300 6 h a s h t a g s × 50 a c c o u n t s + 50 a c c o u n t s × 10 f o l l o w e r s + 50 a c c o u n t s × 10 f o l l o w i n g but we obtained data from 4705 accounts. This is because some of the accounts were either suspended (removed) or protected (you must follow them to retrieve their information).
For the second dataset collection (group 2), which took place on December 2022 and January 2023, we choose different scenarios to evaluate how the model was performing based on local or worldwide trends, the domain, used keywords, etc. Table 2 shows a summary of the collected hashtags based on domain. We collected data for three trending hashtags/keywords based on specific locations to compare them to worldwide trends. The estimated number of accounts for each hashtag or keyword was 100 a c c o u n t s + 100 a c c o u n t s × 10 f o l l o w e r s + 100 a c c o u n t s × 10 f o l l o w i n g , except for the first three hashtags in Table 2, for which the estimated number was 35 a c c o u n t s + 35 a c c o u n t s × 10 f o l l o w e r s + 35 a c c o u n t s × 10 f o l l o w i n g . These three hashtags/keywords were collected one after another; therefore, we decreased the number of accounts.

3.3. Selected Features

For each user, follower, and followed account, we extracted only the profile features. These profile features proved to be optimal in identifying social bot account [17,27,47]. Thus, the goal of using fewer profile features, in addition to their performance, was to minimize the requirements for preprocessing and encoding, in order to speed up the learning process. This would reduce the memory space requirements and computational costs of stream prediction. Therefore, we selected 6 numerical features and 4 categorical features.
Numerical features: These profile features have numerical values. They are described below:
  • Follower count: the number of users who are following this user account.
  • Favorite count: the number of tweets a user has liked since the account creation date.
  • Status count: the total number of tweets and retweets issued by the user.
  • Friend count: the total number of accounts this user is following.
  • Age in days: the total number of days since the account was created as of the date of retrieving the data.
  • Screen name length: the total number of characters (digits) in the screen name.
Categorical features: These profile features have Boolean values. They are described below:
  • Verified: Indicates that the user has a verified account.
  • Default profile: A true value means that the user has not altered the theme or background of their profile.
  • Default profile image: A true value means that the user has not uploaded a profile image and the default image is used.
  • Geo enabled: A true value denotes that the current user attaches geographical data when tweeting or retweeting.
Before using these features, the numerical features were normalized to eliminate bias. For the categorical features, true values were converted to 1 and false values to 0.

3.4. Hashtag Selection Criteria

There are many factors that can impact a trending hashtag or keywords. For example, the domain of interest (political or sports) is one of the factors of a trending hashtag. Spatial information on the event of a trending hashtag was noted, as some trends remain trending for hours and end up in the worldwide trending list. Therefore, to evaluate how our model adapted to different hashtags based on location or trending status and domain, we used the following hashtag criteria to collect different hashtags:
  • Not trending and trending.
  • Trending in a specific location vs. worldwide.
  • In a specific domain vs. multiple domains at once.
  • An individual hashtag vs. a group of hashtags in a similar location and a similar domain.
Thus, using this variety of hashtag statuses/domains/locations, the expected performance of our model was determined. This would help to evaluate its performance with regard to PAC learning parameters to ensure the accuracy and confidence of our model.

4. Results and Discussion

4.1. SEBD Evaluation

We evaluated SEBD using common evaluation metrics: accuracy score, F1 score, and MCC. The accuracy score aimed to evaluate the model correctness. Recall indicates the completeness of the model and precision represents the exactness or the predictive power of the model. The F1 score and Matthews correlation coefficient (MCC) were used as more balanced evaluation metrics for the binary classification task. They are defined in the following equations [48]:
A c c u r a c y = T P + T N T P + T N + F P + F N
P r e c i s i o n = T P T P + F P
R e c a l l = T P T P + F N
F 1 m e a s u r e = 2 P r e c i s i o n R e c a l l P r e c i s i o n + R e c a l l
M C C = TP × TN FP   × FN TP + FP TP + FN TN + FP TN + FN
where TP represents true-positive samples, TN true-negative samples, FN false-negative samples, and FP false-positive samples.
To evaluate SEBD, we applied four evaluations methods to understand how well the model performs in identifying bot accounts in a stream-based manner. We limited the evaluation to the prediction of labels and excluded the performance evaluation of concept-drift or sliding windows.

4.1.1. Evaluation Using Holdout Method

We used the holdout method to test a 30% split of all the data that SEBD predicted, and trained the model with the rest (70% split) using cross-validation (10 folds). We used the whole dataset (group 1 and group 2). We trained a random forest classifier with 100 estimators (trees). The mean F1 score for using cross-validation was 0.962. The performance results are shown in Table 3. SEBD achieved a score of 0.969 for accuracy, of 0.962 for recall, of 0.998 for precision, and of 0.91 for MCC. These results indicate that SEBD is effective at identifying bot accounts. Figure 2 shows the confusion matrix (A) and an AUC curve score of 0.98 (B) for SEBD.
The pre-trained model (Bot-MGAT) that SEBD is built on integrates a multi-view graph attention network. It was trained on both fellowship links and interaction links using transfer-learning approach [17]. Unlike GCN or RGCN, the use of multi-views serves on better understanding of the graph structure and the links between the graph’s nodes. This helps the model to capture the non-linear relationships between nodes more accurately, which can be useful for classification of graph nodes and link prediction. Table 3 shows SEBD compared to baseline work. In [41], the authors proposed an inductive representation learning technique utilizing GCNN to detect Twitter spam bots. Using a neural network and propagation techniques, they learned the embedding of nodes in the graph structure. They evaluated their approach using bot datasets that had old generations of spam bot accounts, which proved to be easier to detect and distinguish than recent generations of bots [49]. In [40], the proposed framework encodes different categories of characteristics, such as description, profile, and tweet, as numeric features. This approach avoids the need for feature engineering while constructing a heterogeneous graph with various types of edges between Twitter users. The researchers found that profile features have more weight in the performance of their model.

4.1.2. Evaluation Using Baseline

In this evaluation, we tested the model using group 1 hashtags, as shown in Table 1. We used a baseline tool to evaluate the resulting predictions. We extracted the account IDs and used Botometer API (https://rapidapi.com/OSoMe/api/botometer-pro, accessed on 30 September 2022) [50] to label these accounts using two different thresholds for the complete automation probability (CAP) scores, as shown in Table 4. CAP scores aim to recognize whether an account is run using automatic content software and the higher the score the higher the probability of this account being a bot. In [51], they suggest that the Botometer CAP threshold score is best at above 0.7. The results for the accuracy and F1 scores show good prediction of bot account when the CAP is 0.5, compared to when it is 0.75. Therefore, automatic behavior is not limited to bots, as they are restricted by Twitter policy and many human accounts (cyborg accounts) use automatic feeds in their account. The results of MCC indicate disagreement between the predictions of bots and humans using Botometer. This highlights that bots and cyborg accounts participate more in trending hashtags than human users [52].
Figure 3A,B represents the ROC curves for both thresholds using Botometer. The reason for the low area under the ROC curve (AUC) is the high false-positive rate. SEBD can even more accurately detect evolved bots than Botometer, as the second evaluation method shows.

4.1.3. Evaluation Using Benchmark Dataset

The third evaluation method was to use a ground truth dataset to train a supervised learning classifier and test it using our collected dataset (group 1) after predicting its labels using SEBD. We chose a random forest (RF) classifier to evaluate its performance, as it has been proven to effectively solve this problem [53]. For the ground truth dataset, we use the dataset available in GitHub (https://github.com/Niyaz94/Bot-Detction-On-Twitter/tree/main/Datasets, accessed on 29 September 2022). The author of this dataset used Botometer to label the obtained accounts from the Twitter API [54]. The dataset consists of more than 100K samples. The performance results of this evaluation method using the group 1 dataset are shown in Table 5. These results indicate that SEBD can effectively identify bots accounts. MCC is a measure of the quality of binary classifications, and takes into account true and false positives and negatives. A value of 1 indicates perfect performance, 0 indicates random performance, and −1 indicates complete disagreement between the model and ground truth. In our case, an MCC of 0.38 indicates that the model is performing well but could still be improved. Nevertheless, SEBD succeeded in efficiently identifying bot accounts, as shown in Figure 4. Figure shows the ROC curve for the second evaluation scenario.

4.1.4. Evaluation Using Other Classifiers

For the fourth evaluation, we used different classifiers, including random forest (RF) with the cross-validation method to observe the predictions of SEBD using both datasets (group 1 and group 2). We used a support vector machine (SVM), naïve Bayes (NB), k-nearest neighbors (KNN), and an ensemble voting classifier, and compared the precision, recall, and f1 measures. The results in Figure 5A show that, for the group 1 dataset, SEBD achieved very high recall scores (0.995 and 1), which measures the proportion of actual positive instances that were correctly identified by the model. A high recall score means that the model is able to detect most of the positive instances. For the precision scores of group 1, which measured the proportion of positive predictions that were actually positive, SEBD achieved 0.858 to 0.99. These high precision scores mean that the model produced a low number of false-positive predictions. An F1 score of 89% represents a balanced measure of precision and recall. As for F1, SEBD achieved a high F1 score (between 0.92 to 0.99), which indicates that the model performed well in terms of both precision and recall. For the group 2 dataset, as shown in Figure 5B, SEBD maintained higher scores for recall, and both RF and the ensemble classifier performed best in both datasets. The overall scores indicate that SEBD is able to effectively identify bot accounts.

4.2. SEBD with PAC Parameters

To evaluate SEBD with PAC parameters, we used group 2 hashtags, as shown in Table 2. This is due to the fact that all group 1 hashtags were collected and processed at once. Therefore, we used a different hashtag status to measure the model performance using PAC parameters (epsilon = 0.05, delta = 0.05). The results of the application of the PAC framework, in terms of false-positive rates and false-negative rates, are shown in Table 6. The given epsilon value of 0.05 means that the model was confident, with a probability of 1 − 0.05 = 0.95, that is, its error rate was less than 0.05. The given delta value of 0.05 means that the model was accurate, with a probability of 1 − 0.05 = 0.95, that is, its error rate was less than 0.05. SEBD showed a false-positive rate (FPR) of 0.025 and a false-negative rate (FNR) of 0.032 in the whole group 2 dataset. This means that, out of 100 instances where the model predicted a positive result, 25 were actually false-positive (incorrect) predictions and, out of 100 instances where the ground truth was positive, 32 predictions were missed (incorrect) by the model. Therefore, based on these results, the model seems to have good accuracy and confidence levels.
The results of the group 2 dataset using PAC learning parameters show that the model was able to effectively generalize to unseen data, as shown in Figure 6A. The empirical error and true error are close to each other, which means that the model performed well on both the training and test data, and there was no over-fitting issue, as shown in Figure 6B. The generalization error, shown in Figure 6A, represents the expected difference between the model’s performance on the training data and its performance on unseen data from the same distribution. In other words, it is an estimate of how well the model will perform on new, previously unseen data. In our case, the upper bound generalization error for a sample size of 2000 was 0.160. This means that the expected difference between the model’s performance on the training data and its performance on unseen data is 0.160. This can be interpreted as an estimate of the model’s expected error rate of new data in the worst-case scenario.
In general, SEBD is able to maintain false-positive rates and false-negative rates below epsilon and delta parameters for at least a sample size >2000, as shown in Table 7. This result of using RF is for the group 2 dataset combined and PAC parameters were: epsilon = 0.05, delta = 0.05. In other words, a sample size >2000 satisfies the PAC learning condition. Despite the different status of hashtags that were separately tested, as shown in Table 6, the overall results are good, unless the calibration set size is not met, as is the case for #climatecrisis, #thelastofus, and #iOS16. This is due to the inclusion of a lower number of these hashtags in the human class to generate random samples for training.

5. Conclusions

In this paper, we propose a stream-based evolving bot detection framework (SEBD). Our framework is built based on graph attention networks that integrate multiple views of fellowship links. It integrates Apache Kafka and the Twitter API to predict whether the account should be labeled as bot or human in a stream-based manner. SEBD utilizes fellowship links with few profile features to classify account types in the stream. Using few profile features to detect social bots is supported by a recent study [
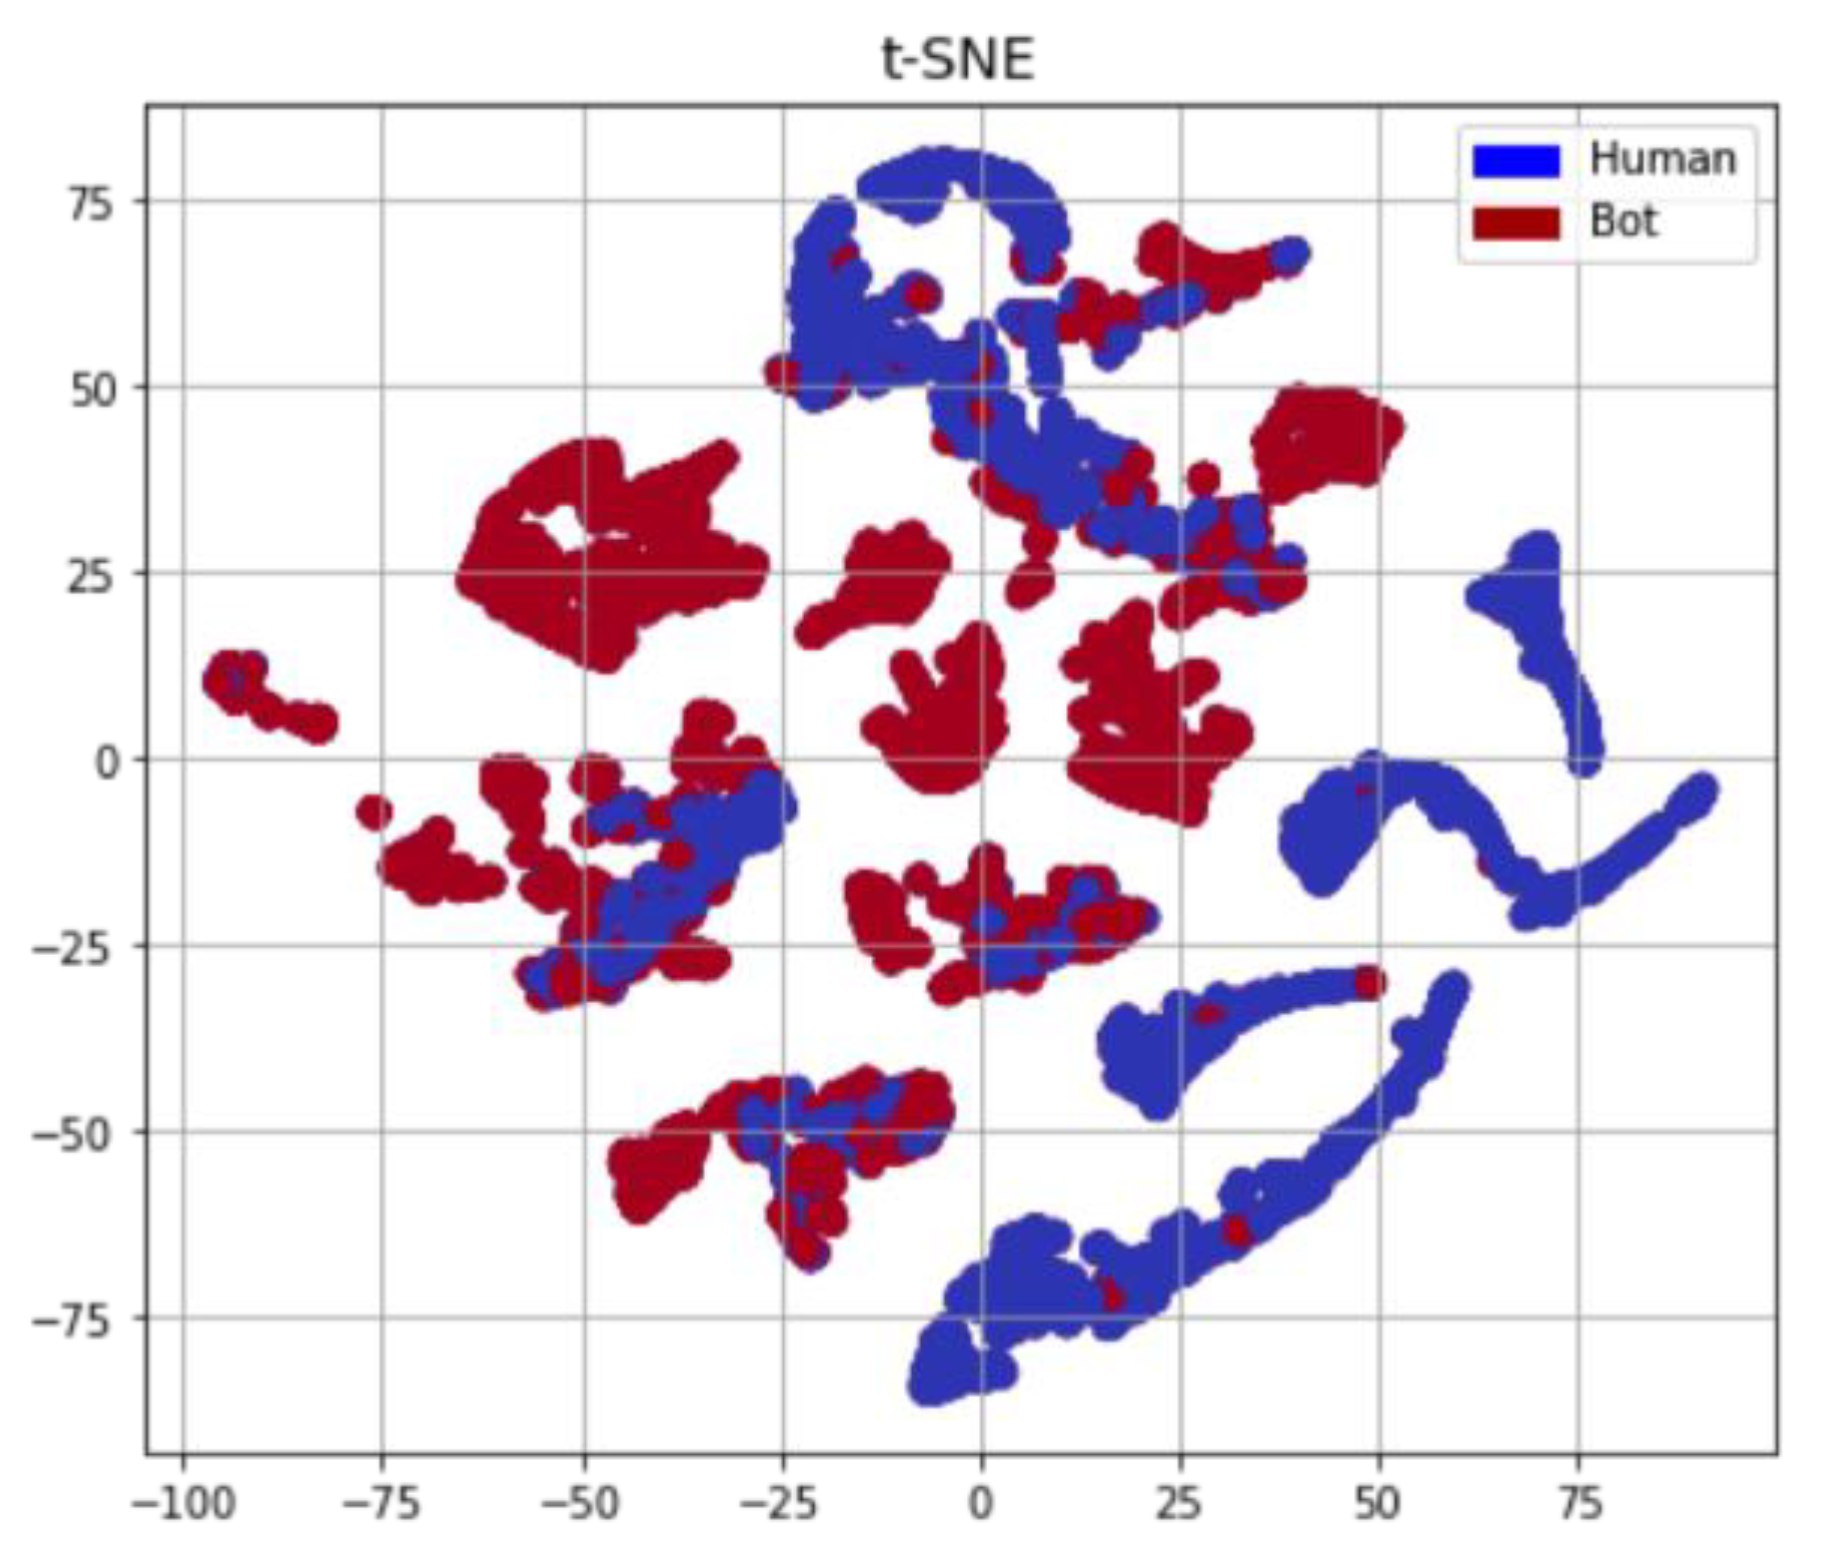
55]. Using such few profile features will decrease the computational costs of stream detection. It is obvious that detecting social bots in a stream-based way while evolving in hashtags is very effective. This is due to the fact that they work in an orchestrated manner as they are probably parts of botnets and they have similar features that make them distinguishable (see Figure 7). Recent studies support that bot accounts are very active in hashtags [56,57,58].
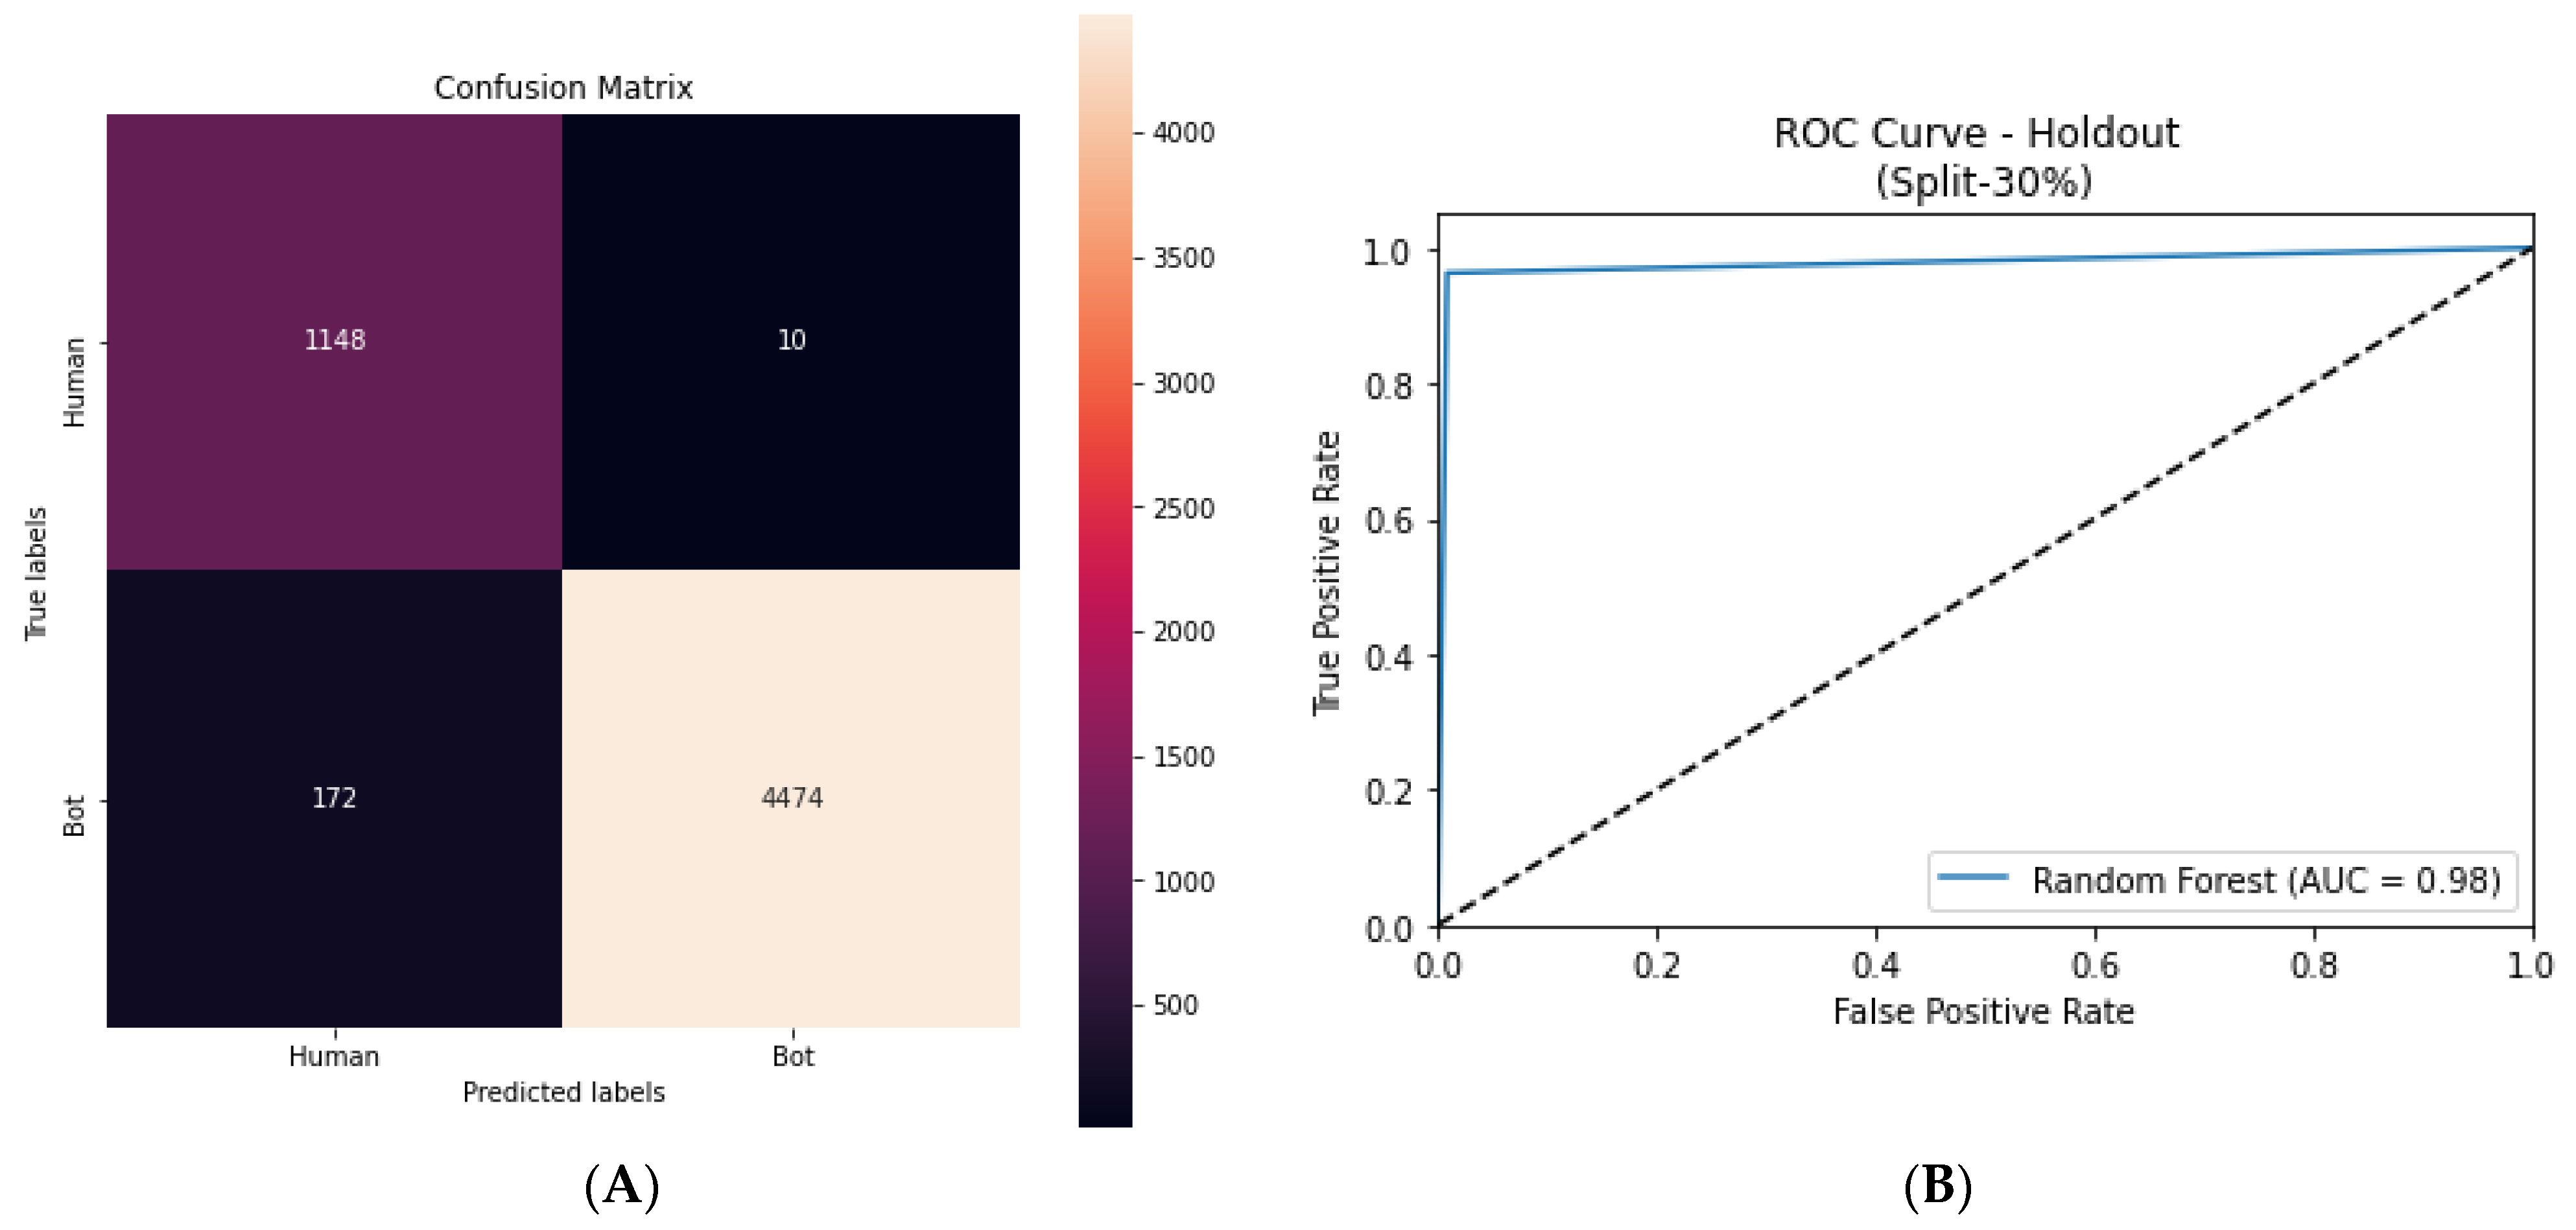
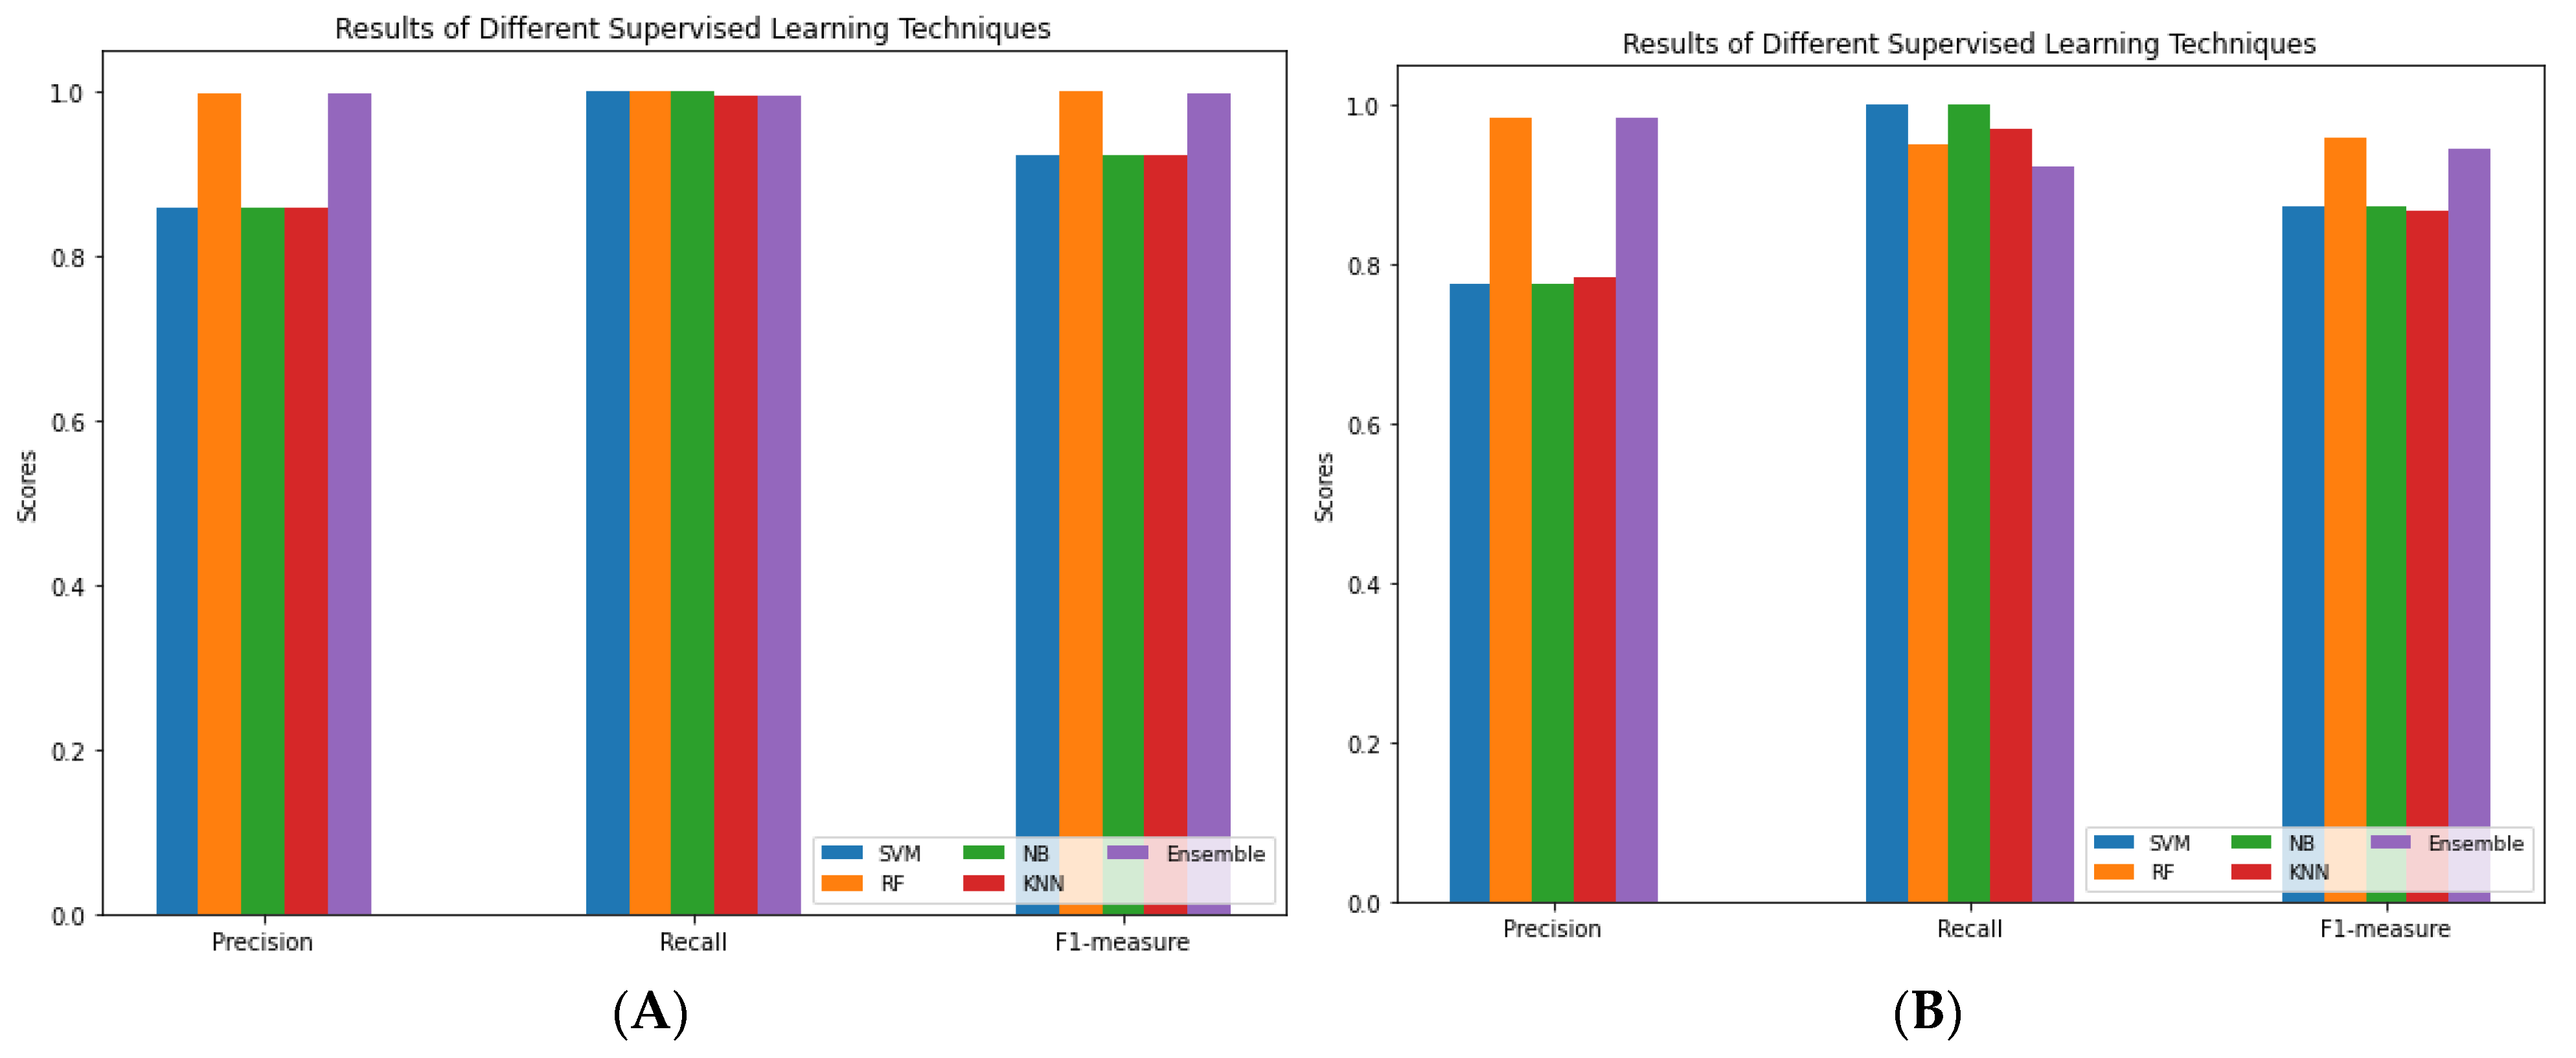
The multi-view graph attention network model has a more powerful representation of the data, allowing for better accuracy in predictions. The cross-domain evaluation of SEBD demonstrates its ability to effectively identify bot accounts using baseline comparison, a ground truth dataset and machine learning classifiers. SEBD achieved an AUC score of 0.98 using the holdout method and a mean F1 score of 0.96 using cross-validation for the trained model. The results obtained using a random forest classifier with a ground truth dataset support this finding. Additionally, SEBD was more successful in identifying bot accounts compared to the baseline tool. Random forest and ensemble classifiers perform well in the bot detection problem. The SEBD results show that bot accounts participate highly in hashtags on Twitter.
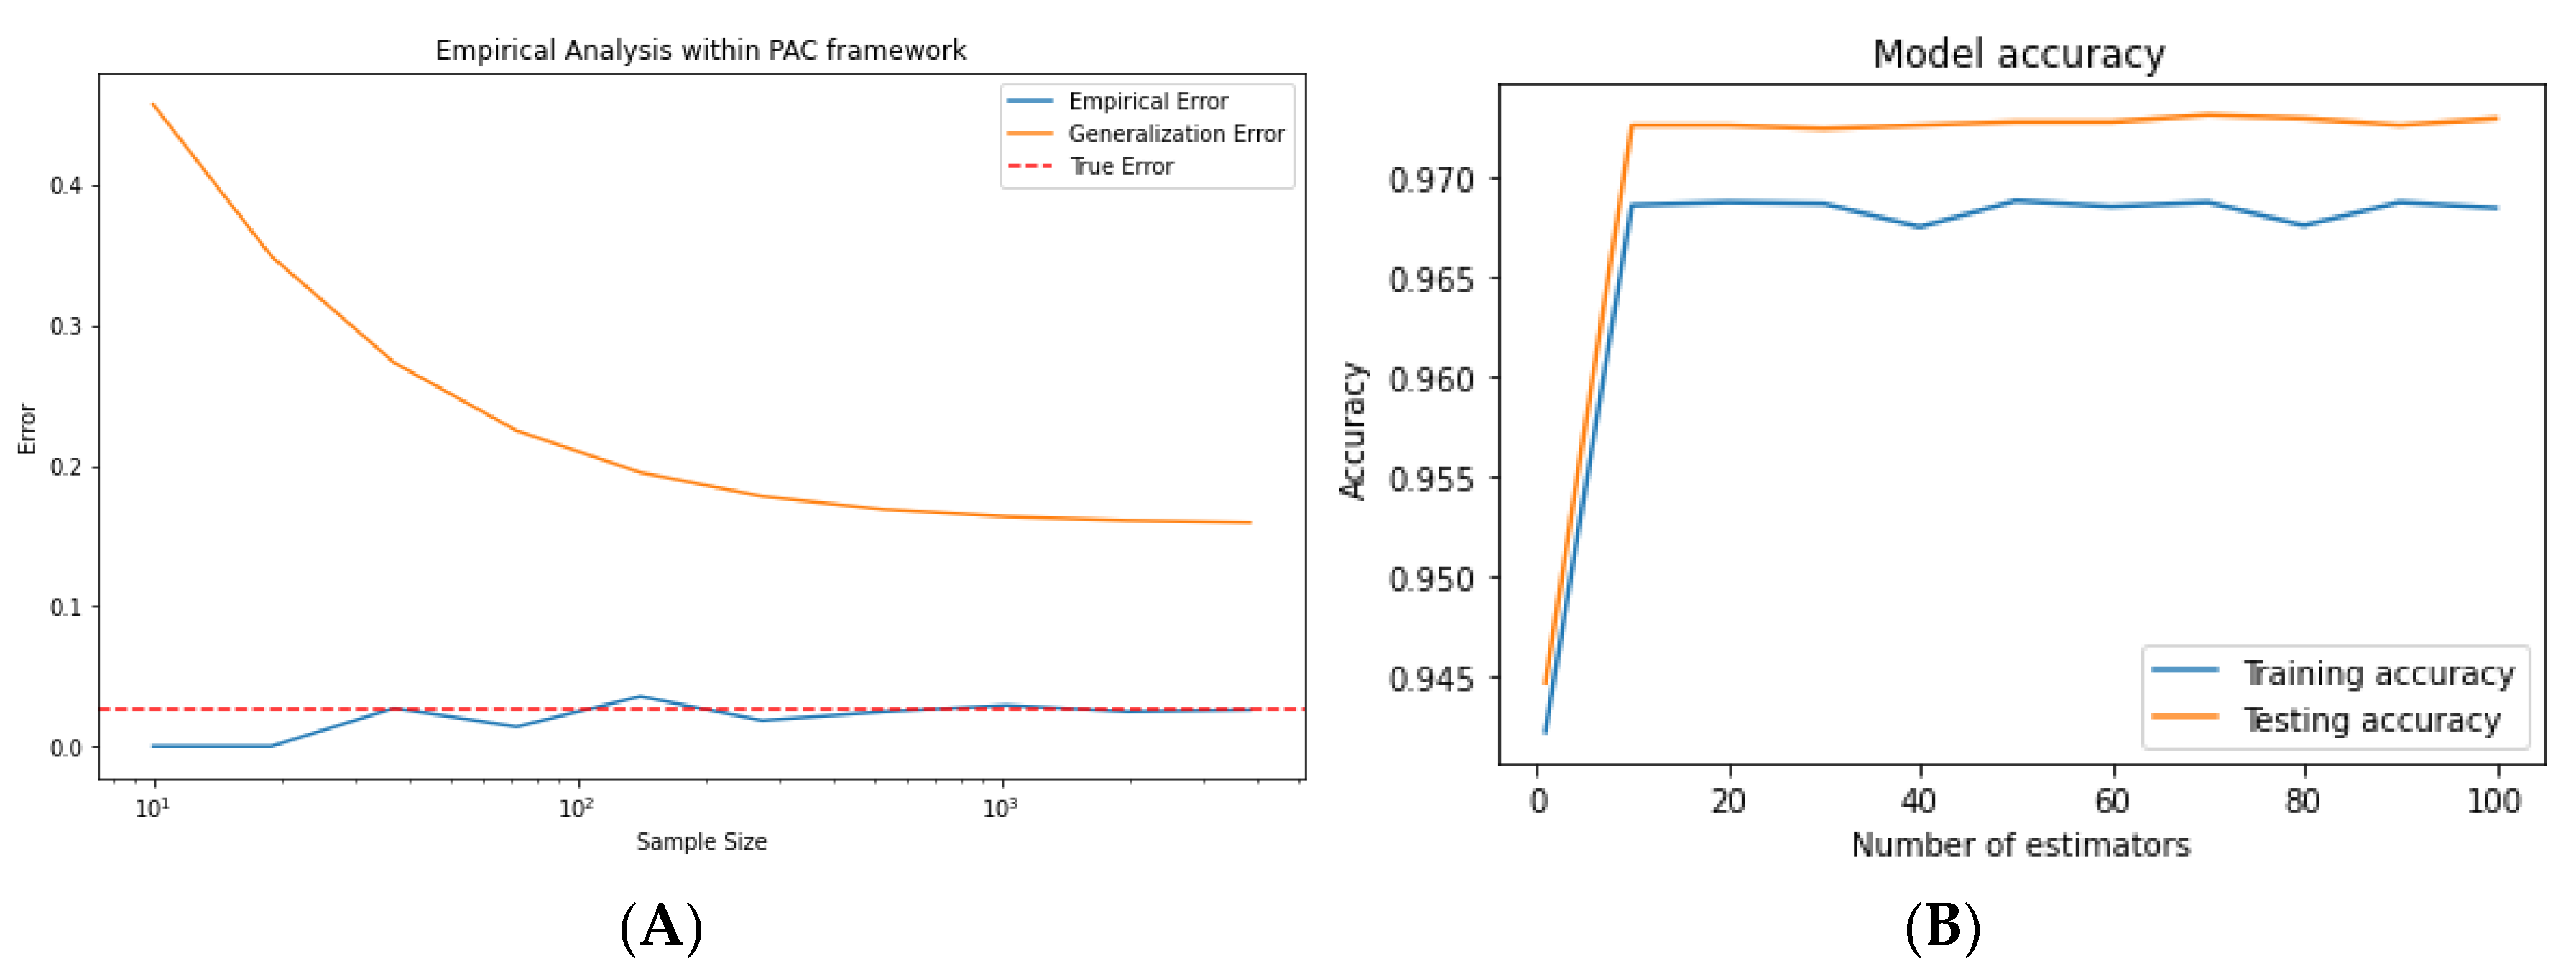
Furthermore, the SEBD results using the PAC learning framework indicate that our model meets the required accuracy and confidence levels in regard to the accuracy parameter (epsilon) and the confidence parameter (delta). The testing of different sample sizes shows that our results satisfy the PAC learning conditions for sample sizes > 2000 in terms of FNRs and FPRs. Additionally, the empirical error and true error show that the model is able to effectively generalize to unseen data.
Graph neural network models are powerful tools to extract hidden knowledge for classification tasks. Therefore, future studies should address looking for bot masters, as these bot accounts work as members of a botnet. In future work, SEBD will be examined using a trending hashtag (one active hashtag); an evaluation will be performed using one active hashtag over a longer period of time (e.g., days) to evaluate changes in predictions, and it will include concept drifts and window sliding.

Author Contributions

Conceptualization, E.A.; Methodology, E.A.; Software, E.A.; Formal analysis, E.A.; Data curation, E.A.; Writing—original draft, E.A.; Writing—review and editing, E.A., K.H. and H.A.; Visualization, E.A.; Supervision, K.H. and H.A. All authors have read and agreed to the published version of the manuscript.

Funding

This research received no external funding.

Data Availability Statement

The used data as benchmark dataset is from [54]. For our dataset please contact us (e.alothali@gmail.com).

Conflicts of Interest

The authors declare no conflict of interest.

References

  1. Wang, P.; Angarita, R.; Renna, I. Is this the era of misinformation yet: Combining social bots and fake news to deceive the masses. In Proceedings of the Web Conference 2018, Lyon, France, 23–27 April 2018; pp. 1557–1561. [Google Scholar]
  2. Adewole, K.S.; Anuar, N.B.; Kamsin, A.; Varathan, K.D.; Razak, S.A. Malicious accounts: Dark of the social networks. J. Netw. Comput. Appl 2017, 79, 41–67. [Google Scholar] [CrossRef]
  3. Aldayel, A.; Magdy, W. Characterizing the role of bots’ in polarized stance on social media. Soc. Netw. Anal. Min. 2022, 12, 1–24. [Google Scholar] [CrossRef] [PubMed]
  4. Antenore, M.; Camacho-Rodriguez, J.M.; Panizzi, E. A comparative study of Bot Detection techniques methods with an application related to COVID-19 discourse on Twitter. arXiv 2021, arXiv:2102.01148. [Google Scholar]
  5. Rizoiu, M.A.; Graham, T.; Zhang, R.; Zhang, Y.; Ackland, R.; Xie, L. DEBATENIGHT: The role and influence of socialbots on twitter during the first 2016 U.S. presidential debate. In Proceedings of the 12th International AAAI Conference on Web and Social Media, ICWSM 2018, Palo Alto, CA, USA, 25–28 June 2018; pp. 300–309. [Google Scholar]
  6. Grover, P.; Kar, A.K.; Dwivedi, Y.K.; Janssen, M. Polarization and acculturation in US Election 2016 outcomes—Can twitter analytics predict changes in voting preferences. Technol. Forecast. Soc. Change 2019, 145, 438–460. [Google Scholar] [CrossRef]
  7. Cresci, S.; Lillo, F.; Regoli, D.; Tardelli, S.; Tesconi, M. Cashtag piggybacking: Uncovering spam and bot activity in stock microblogs on Twitter. ACM Trans. Web. 2019, 13, 11. [Google Scholar] [CrossRef]
  8. Broniatowski, D.A.; Jamison, A.M.; Qi, S.; AlKulaib, L.; Chen, T.; Benton, A.; Quinn, S.C.; Dredze, M. Weaponized health communication: Twitter bots and Russian trolls amplify the vaccine debate. Am. J. Public Health 2018, 108, 1378–1384. [Google Scholar] [CrossRef]
  9. Twitter.com. Automation Rules. Available online: https://help.twitter.com/en/rules-and-policies/twitter-automation (accessed on 1 September 2022).
  10. Twitter.com. Twitter’s Platform Manipulation. Available online: https://help.twitter.com/en/rules-and-policies/platform-manipulation (accessed on 1 September 2022).
  11. Yang, K.C.; Varol, O.; Davis, C.A.; Ferrara, E.; Flammini, A.; Menczer, F. Arming the public with artificial intelligence to counter social bots. Hum. Behav. Emerg. Technol. 2019, 1, 48–61. [Google Scholar] [CrossRef] [Green Version]
  12. Lee, K.; Eoff, B.D.; Caverlee, J. Seven months with the devils: A long-term study of content polluters on twitter. In Proceedings of the Fifth International AAAI Conference on Weblogs and Social Media, Barcelona, Spain, 17–21 July 2011. [Google Scholar]
  13. Grier, C.; Thomas, K.; Paxson, V.; Zhang, M. @ spam: The underground on 140 characters or less. In Proceedings of the 17th ACM Conference on Computer and Communications Security, Chicago, IL, USA, 4–8 October 2010; pp. 27–37. [Google Scholar]
  14. Chu, Z.; Gianvecchio, S.; Wang, H.; Jajodia, S. Who is tweeting on twitter: Human, bot, or cyborg? In Proceedings of the Annual Computer Security Applications Conference, ACSAC, Austin, TX, USA, 6–10 December 2010; pp. 21–30. [Google Scholar]
  15. Orabi, M.; Mouheb, D.; Al Aghbari, Z.; Kamel, I. Detection of Bots in Social Media: A Systematic Review. Inf. Process. Manag. 2020, 57, 102250. [Google Scholar] [CrossRef]
  16. Haussler, D. Probably Approximately Correct Learning. In Proceedings of the 8th National AAAI Conference on Artificial Intelligence, AAAI’90, Boston, MA, USA, 29 July-3 August 1990; pp. 1101–1108. [Google Scholar]
  17. Alothali, E.; Salih, M.; Hayawi, K.; Alashwal, H. Bot-MGAT: A Transfer Learning Model Based on a Multi-View Graph Attention Network to Detect Social Bots. Appl. Sci. 2022, 12, 8117. [Google Scholar] [CrossRef]
  18. Alothali, E.; Alashwal, H.; Salih, M.; Hayawi, K. Real Time Detection of Social Bots on Twitter Using Machine Learning and Apache Kafka. In Proceedings of the 2021 5th Cyber Security in Networking Conference (CSNet), Abu Dhabi, United Arab Emirates, 12–14 October 2021; pp. 98–102. [Google Scholar]
  19. Xia, F.; Sun, K.; Yu, S.; Aziz, A.; Wan, L.; Pan, S.; Liu, H. Graph Learning: A Survey. IEEE Trans. Artif. Intell. 2021, 2, 109–127. [Google Scholar] [CrossRef]
  20. Wu, Z.; Pan, S.; Chen, F.; Long, G.; Zhang, C.; Philip, S.Y. A comprehensive survey on graph neural networks. IEEE Trans. Neural Netw. Learn. Syst. 2020, 32, 4–24. [Google Scholar] [CrossRef] [Green Version]
  21. Wu, Y.; Lian, D.; Xu, Y.; Wu, L.; Chen, E. Graph Convolutional Networks with Markov Random Field Reasoning for Social Spammer Detection. In Proceedings of the AAAI Conference on Artificial Intelligence, New York, NY, USA, 7–12 February 2020; Volume 34, pp. 1054–1061. [Google Scholar]
  22. Kipf, T.N.; Welling, M. Semi-supervised classification with graph convolutional networks. arXiv 2016, arXiv:1609.02907. [Google Scholar]
  23. Hamilton, W.L.; Ying, R.; Leskovec, J. Inductive representation learning on large graphs. In Proceedings of the 31st International Conference on Neural Information Processing Systems, Long Beach, CA, USA, 4–9 December 2017; pp. 1025–1035. [Google Scholar]
  24. Veličković, P.; Cucurull, G.; Casanova, A.; Romero, A.; Lio, P.; Bengio, Y. Graph attention networks. arXiv 2017, arXiv:1710.10903. [Google Scholar]
  25. Boichak, O.; Jackson, S.; Hemsley, J.; Tanupabrungsun, S. Automated diffusion? Bots and their influence during the 2016 US presidential election. In Proceedings of the Transforming Digital Worlds: 13th International Conference, iConference 2018, Sheffield, UK, 25–28 March 2018; pp. 17–26. [Google Scholar]
  26. Benigni, M.C.; Joseph, K.; Carley, K.M. Bot-ivistm: Assessing information manipulation in social media using network analytics. In Emerging Research Challenges and Opportunities in Computational Social Network Analysis and Mining; Springer: Cham, Switzerland, 2019; pp. 19–42. [Google Scholar]
  27. Kudugunta, S.; Ferrara, E. Deep neural networks for bot detection. Inf. Sci. 2018, 467, 312–322. [Google Scholar] [CrossRef] [Green Version]
  28. Cresci, S.; Di Pietro, R.; Petrocchi, M.; Spognardi, A.; Tesconi, M. Fame for sale: Efficient detection of fake Twitter followers. Decis. Support Syst. 2015, 80, 56–71. [Google Scholar] [CrossRef] [Green Version]
  29. Abou Daya, A.; Salahuddin, M.A.; Limam, N.; Boutaba, R. A graph-based machine learning approach for bot detection. In Proceedings of the 2019 IFIP/IEEE Symposium on Integrated Network and Service Management, Washington, DC, USA, 8–12 April 2019; pp. 144–152. [Google Scholar]
  30. Chavoshi, N.; Hamooni, H.; Mueen, A. Temporal Patterns in Bot Activities. In Proceedings of the 26th International Conference on World Wide Web Companion, Perth, Australia, 3–7 April 2017; pp. 1601–1606. [Google Scholar]
  31. Sayyadiharikandeh, M.; Varol, O.; Yang, K.C.; Flammini, A.; Menczer, F. Detection of Novel Social Bots by Ensembles of Specialized Classifiers. In Proceedings of the International Conference on Information and Knowledge Management, Birmingham, UK, 19–23 October 2020; pp. 2725–2732. [Google Scholar]
  32. Varol, O.; Ferrara, E.; Davis, C.; Menczer, F.; Flammini, A. Online human-bot interactions: Detection, estimation, and characterization. In Proceedings of the International AAAI Conference on Web and Social Media, ICWSM 2017, Montreal, QC, Canada, 15–18 May 2017; pp. 280–289. [Google Scholar]
  33. Beskow, D.M.; Carley, K.M. Bot-hunter: A tiered approach to detecting & characterizing automated activity on twitter. In Proceedings of the Conference Paper. SBP-BRiMS: International Conference on Social Computing, Behavioral-Cultural Modeling and Prediction and Behavior Representation in Modeling and Simulation, Washington, DC, USA, 10–13 July 2018. [Google Scholar]
  34. Koggalahewa, D.; Xu, Y.; Foo, E. An unsupervised method for social network spammer detection based on user information interests. J. Big. Data. 2022, 9, 7. [Google Scholar] [CrossRef]
  35. Najari, S.; Salehi, M.; Farahbakhsh, R. GANBOT: A GAN-based framework for social bot detection. Soc. Netw. Anal. Min. 2022, 12, 4. [Google Scholar] [CrossRef] [PubMed]
  36. Hayawi, K.; Mathew, S.; Venugopal, N.; Masud, M.M.; Ho, P.H. DeeProBot: A hybrid deep neural network model for social bot detection based on user profile data. Soc. Netw. Anal. Min. 2022, 12, 43. [Google Scholar] [CrossRef]
  37. Arin, E.; Kutlu, M. Deep Learning Based Social Bot Detection on Twitter. IEEE Trans. Inf. Forensics Secur. 2023, 18, 1763–1772. [Google Scholar] [CrossRef]
  38. Feng, S.; Wan, H.; Wang, N.; Li, J.; Luo, M. SATAR: A Self-supervised Approach to Twitter Account Representation Learning and its Application in Bot Detection. arXiv 2021, arXiv:2106.13089. [Google Scholar]
  39. Yang, Y.; Yang, R.; Li, Y.; Cui, K.; Yang, Z.; Wang, Y.; Xu, J.; Xie, H. RoSGAS: Adaptive Social Bot Detection with Reinforced Self-Supervised GNN Architecture Search. ACM Trans Web. 2022. accepted. [Google Scholar] [CrossRef]
  40. Feng, S.; Wan, H.; Wang, N.; Luo, M. BotRGCN: Twitter Bot Detection with Relational Graph Convolutional Networks. arXiv 2021, arXiv:2106.13092. [Google Scholar]
  41. Ali Alhosseini, S.; Bin Tareaf, R.; Najafi, P.; Meinel, C. Detect me if you can: Spam bot detection using inductive representation learning. In Proceedings of the 2019 World Wide Web Conference, San Francisco, CA, USA, 13–17 May 2019; pp. 148–153. [Google Scholar]
  42. Valiant, L.G. A theory of the learnable. Commun. ACM 1984, 27, 1134–1142. [Google Scholar] [CrossRef] [Green Version]
  43. Hamami, F.; Dahlan, I.A. The Implementation of Stream Architecture for Handling Big Data Velocity in Social Media. J. Phys. Conf. Ser. 2020, 1641, 012021. [Google Scholar] [CrossRef]
  44. Hiraman, B.R.; Viresh, M.C.; Abhijeet, C.K. A Study of Apache Kafka in Big Data Stream Processing. In Proceedings of the 2018 International Conference on Information, Communication, Engineering and Technology, ICICET 2018, Pune, India, 29–31 August 2018; pp. 1–3. [Google Scholar]
  45. Brody, S.; Alon, U.; Yahav, E. How attentive are graph attention networks? arXiv 2021, arXiv:2105.14491. [Google Scholar]
  46. Feng, S.; Wan, H.; Wang, N.; Li, J.; Luo, M. TwiBot-20, A Comprehensive Twitter Bot Detection Benchmark. In Proceedings of the 30th ACM International Conference on Information & Knowledge Management, Gold Coast, Australia, 1–5 November 2021; pp. 4485–4494. [Google Scholar]
  47. Alothali, E.; Hayawi, K.; Alashwal, H. Hybrid feature selection approach to identify optimal features of profile metadata to detect social bots in Twitter. Soc. Netw. Anal. Min. 2021, 11, 84. [Google Scholar] [CrossRef]
  48. Tharwat, A. Classification assessment methods. Appl. Comput. Inform. 2018, 17, 168–192. [Google Scholar] [CrossRef]
  49. Cresci, S. A decade of social bot detection. Commun. ACM 2020, 63, 72–83. [Google Scholar] [CrossRef]
  50. Yang, K.-C.; Ferrara, E.; Menczer, F. Botometer 101, Social bot practicum for computational social scientists. arXiv 2022, arXiv:2201.01608. [Google Scholar] [CrossRef]
  51. Ng, L.H.X.; Robertson, D.C.; Carley, K.M. Stabilizing a supervised bot detection algorithm: How much data is needed for consistent predictions? Online Soc. Netw. Media 2022, 28, 100198. [Google Scholar] [CrossRef]
  52. Alothali, E.; Hayawi, K.; Alashwal, H. Characteristics of Similar-Context Trending Hashtags in Twitter: A Case Study. In Lecture Notes in Computer Science (Including Subseries Lecture Notes in Artificial Intelligence and Lecture Notes in Bioinformatics; Ku, W.-S., Kanemasa, Y., Serhani, M.A., Eds.; Springer International Publishing: Cham, Switzerland, 2020; pp. 150–163. [Google Scholar]
  53. Yang, K.C.; Varol, O.; Hui, P.M.; Menczer, F. Scalable and Generalizable Social Bot Detection through Data Selection. In Proceedings of the AAAI Conference on Artificial Intelligence, New York, NY, USA, 7–12 February 2020; Volume 34, pp. 1096–1103. [Google Scholar]
  54. Jalal, N.; Ghafoor, K.Z. Machine Learning Algorithms for Detecting and Analyzing Social Bots Using a Novel Dataset. Aro Sci. J. Koya Univ. 2022, 10, 11–21. [Google Scholar] [CrossRef]
  55. Tabassum, F.; Mubarak, S.; Liu, L.; Du, J.T. How Many Features Do We Need to Identify Bots on Twitter? In Information for a Better World: Normality, Virtuality, Physicality, Inclusivity; Sserwanga, I., Goulding, A., Moulaison-Sandy, H., Eds.; Springer Nature: Cham, Switzerland, 2023; pp. 312–327. [Google Scholar]
  56. Chen, C.F.; Shi, W.; Yang, J.; Fu, H.H. Social bots’ role in climate change discussion on Twitter: Measuring standpoints, topics, and interaction strategies. Adv. Clim. Chang. Res. 2021, 12, 913–923. [Google Scholar] [CrossRef]
  57. Yuan, X.; Schuchard, R.J.; Crooks, A.T. Examining Emergent Communities and Social Bots Within the Polarized Online Vaccination Debate in Twitter. Soc. Media Soc. 2019, 5, 2056305119865465. [Google Scholar] [CrossRef] [Green Version]
  58. De Nicola, R.; Petrocchi, M.; Pratelli, M. On the efficacy of old features for the detection of new bots. Inf. Process. Manag. 2021, 58, 102685. [Google Scholar] [CrossRef]
Figure 1. SEBD framework.
Applsci 13 04443 g001
Figure 2. SEBD results using holdout method and cross-validation with random forest.
Applsci 13 04443 g002
Figure 3. (A) Receiver operating characteristic (ROC) curve using Botometer with CAP score of 0.75. (B) Receiver operating characteristic (ROC) curve using Botometer with CAP score of 0.5.
Applsci 13 04443 g003
Figure 4. Receiver operating characteristic (ROC) curve for benchmark dataset using training/test with group 1 dataset.
Applsci 13 04443 g004
Figure 5. The results of other classifiers compared to RF (A) for group 1 hashtags and (B) for group 2 hashtags.
Applsci 13 04443 g005
Figure 6. (A) The generalization error compared to empirical error and true error of group 2 dataset. (B) The model’s accuracy in examining the over-fitting issue in terms of the number of estimators for both training and testing scores combined using group 2 dataset.
Applsci 13 04443 g006
Figure 7. Visualization of SEBD results using t-SNE.
Applsci 13 04443 g007
Table 1. Group 1 hashtags.
HashtagDomain
#WorldCup2022Sport
#Russia OR UkrainePolitical
#BitcoinFinancial
#iOS16Technology
#NotMyKingPolitical
#gamescom2022Entertainment
Total4705
Table 2. Group 2 hashtags.
HashtagDomainTotal NumberTrendingCombinedWorldwide
#AEWDynamiteSport2355
#AbbottElementarySport
#MozzSport
#Cowboys Sport2035
#PMQsPolitical3070
#Oscars2023Entertainment
#ClimateCrisis- 1540
#iOS16 Technology1986
#ChatGPTTechnology1681
#TheLastofUsEntertainment1972
Total 14,639
Table 3. SEBD results compared to baseline work.
Ref#ApproachAccuracy F1MCC
Alhossieni et al. [41]GCNN0.940.84-
BotRGCN [40]RGCN0.8620.87070.7021
SEBDMGAT0.9690.980.91
Table 4. Botometer results using group 1 dataset.
ToolCAPAccuracyF1 RecallPrecisionMCC
Botometer 0.500.76980.86450.86680.86230.1002
0.750.64910.76650.88430.67650.1254
Table 5. Result of benchmark dataset with RF training/test using group 1 dataset.
Dataset AccuracyF1 RecallPrecisionMCC
Ref [54]0.82730.89670.87080.92450.3780
Table 6. PAC framework results of SEBD using epsilon = 0.05 and delta = 0.05.
Hashtag SizeFeatures FNRsFPRs
BotHumanTotal
#AEWDynamite 55418012355110.0120.044
#AbbottElementary
#Mozz
#Cowboys 172131420350.0390.022
#PMQs+#Oscars2023263143930700.0380.004
#ClimateCrisis13741661540--
#iOS1618131731986--
#ChatGPT128040116810.0130.004
#TheLastofUs17382341972--
All Hashtags11,345329414,6390.0320.025
Table 7. The sample size ranges with minimum and maximum FNRs and FPRs of group 2 dataset combined with PAC parameters.
Sample Size FNRsFPRs
50–2000[0.024, 0.038][0.005, 0.196]
2050–5000[0.033, 0.35][0.001, 0.031]
5050–10,000[0.034, 0.035][0.001, 0.023]
>10,050[0.034, 0.035][0.001, 0.021]
Disclaimer/Publisher’s Note: The statements, opinions and data contained in all publications are solely those of the individual author(s) and contributor(s) and not of MDPI and/or the editor(s). MDPI and/or the editor(s) disclaim responsibility for any injury to people or property resulting from any ideas, methods, instructions or products referred to in the content.

