
A Dynamic Analysis of the Cycloid Disc Stress-Strain State

 , , , and
Abstract
:Featured Application
Abstract
1. Introduction
2. Theoretical Model of the Cycloid Disc Loading
- -
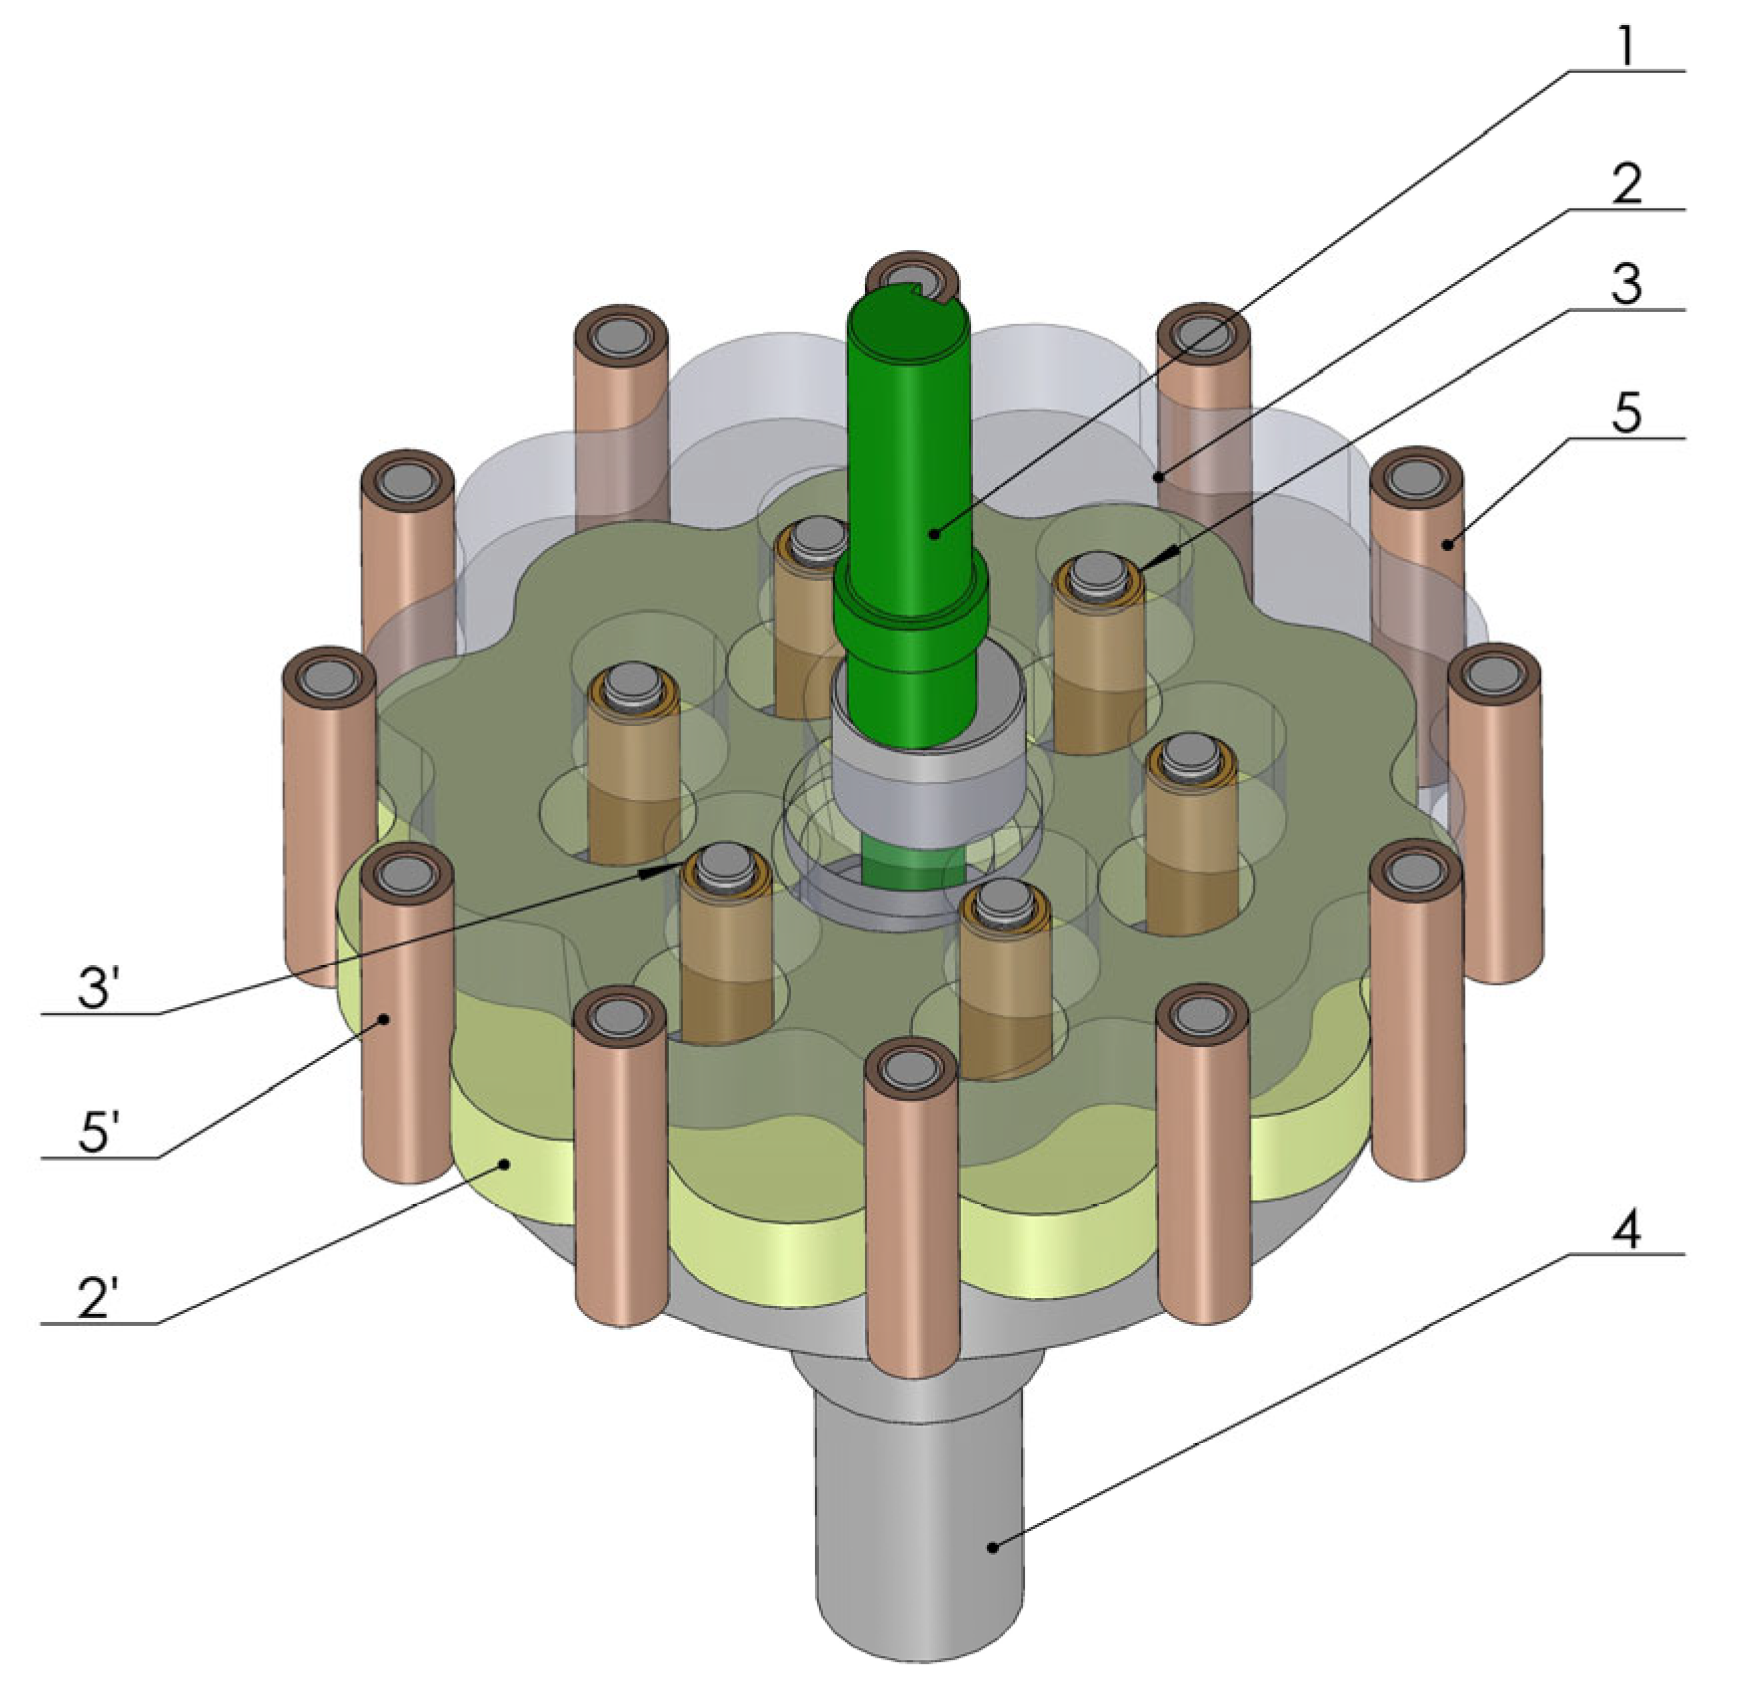
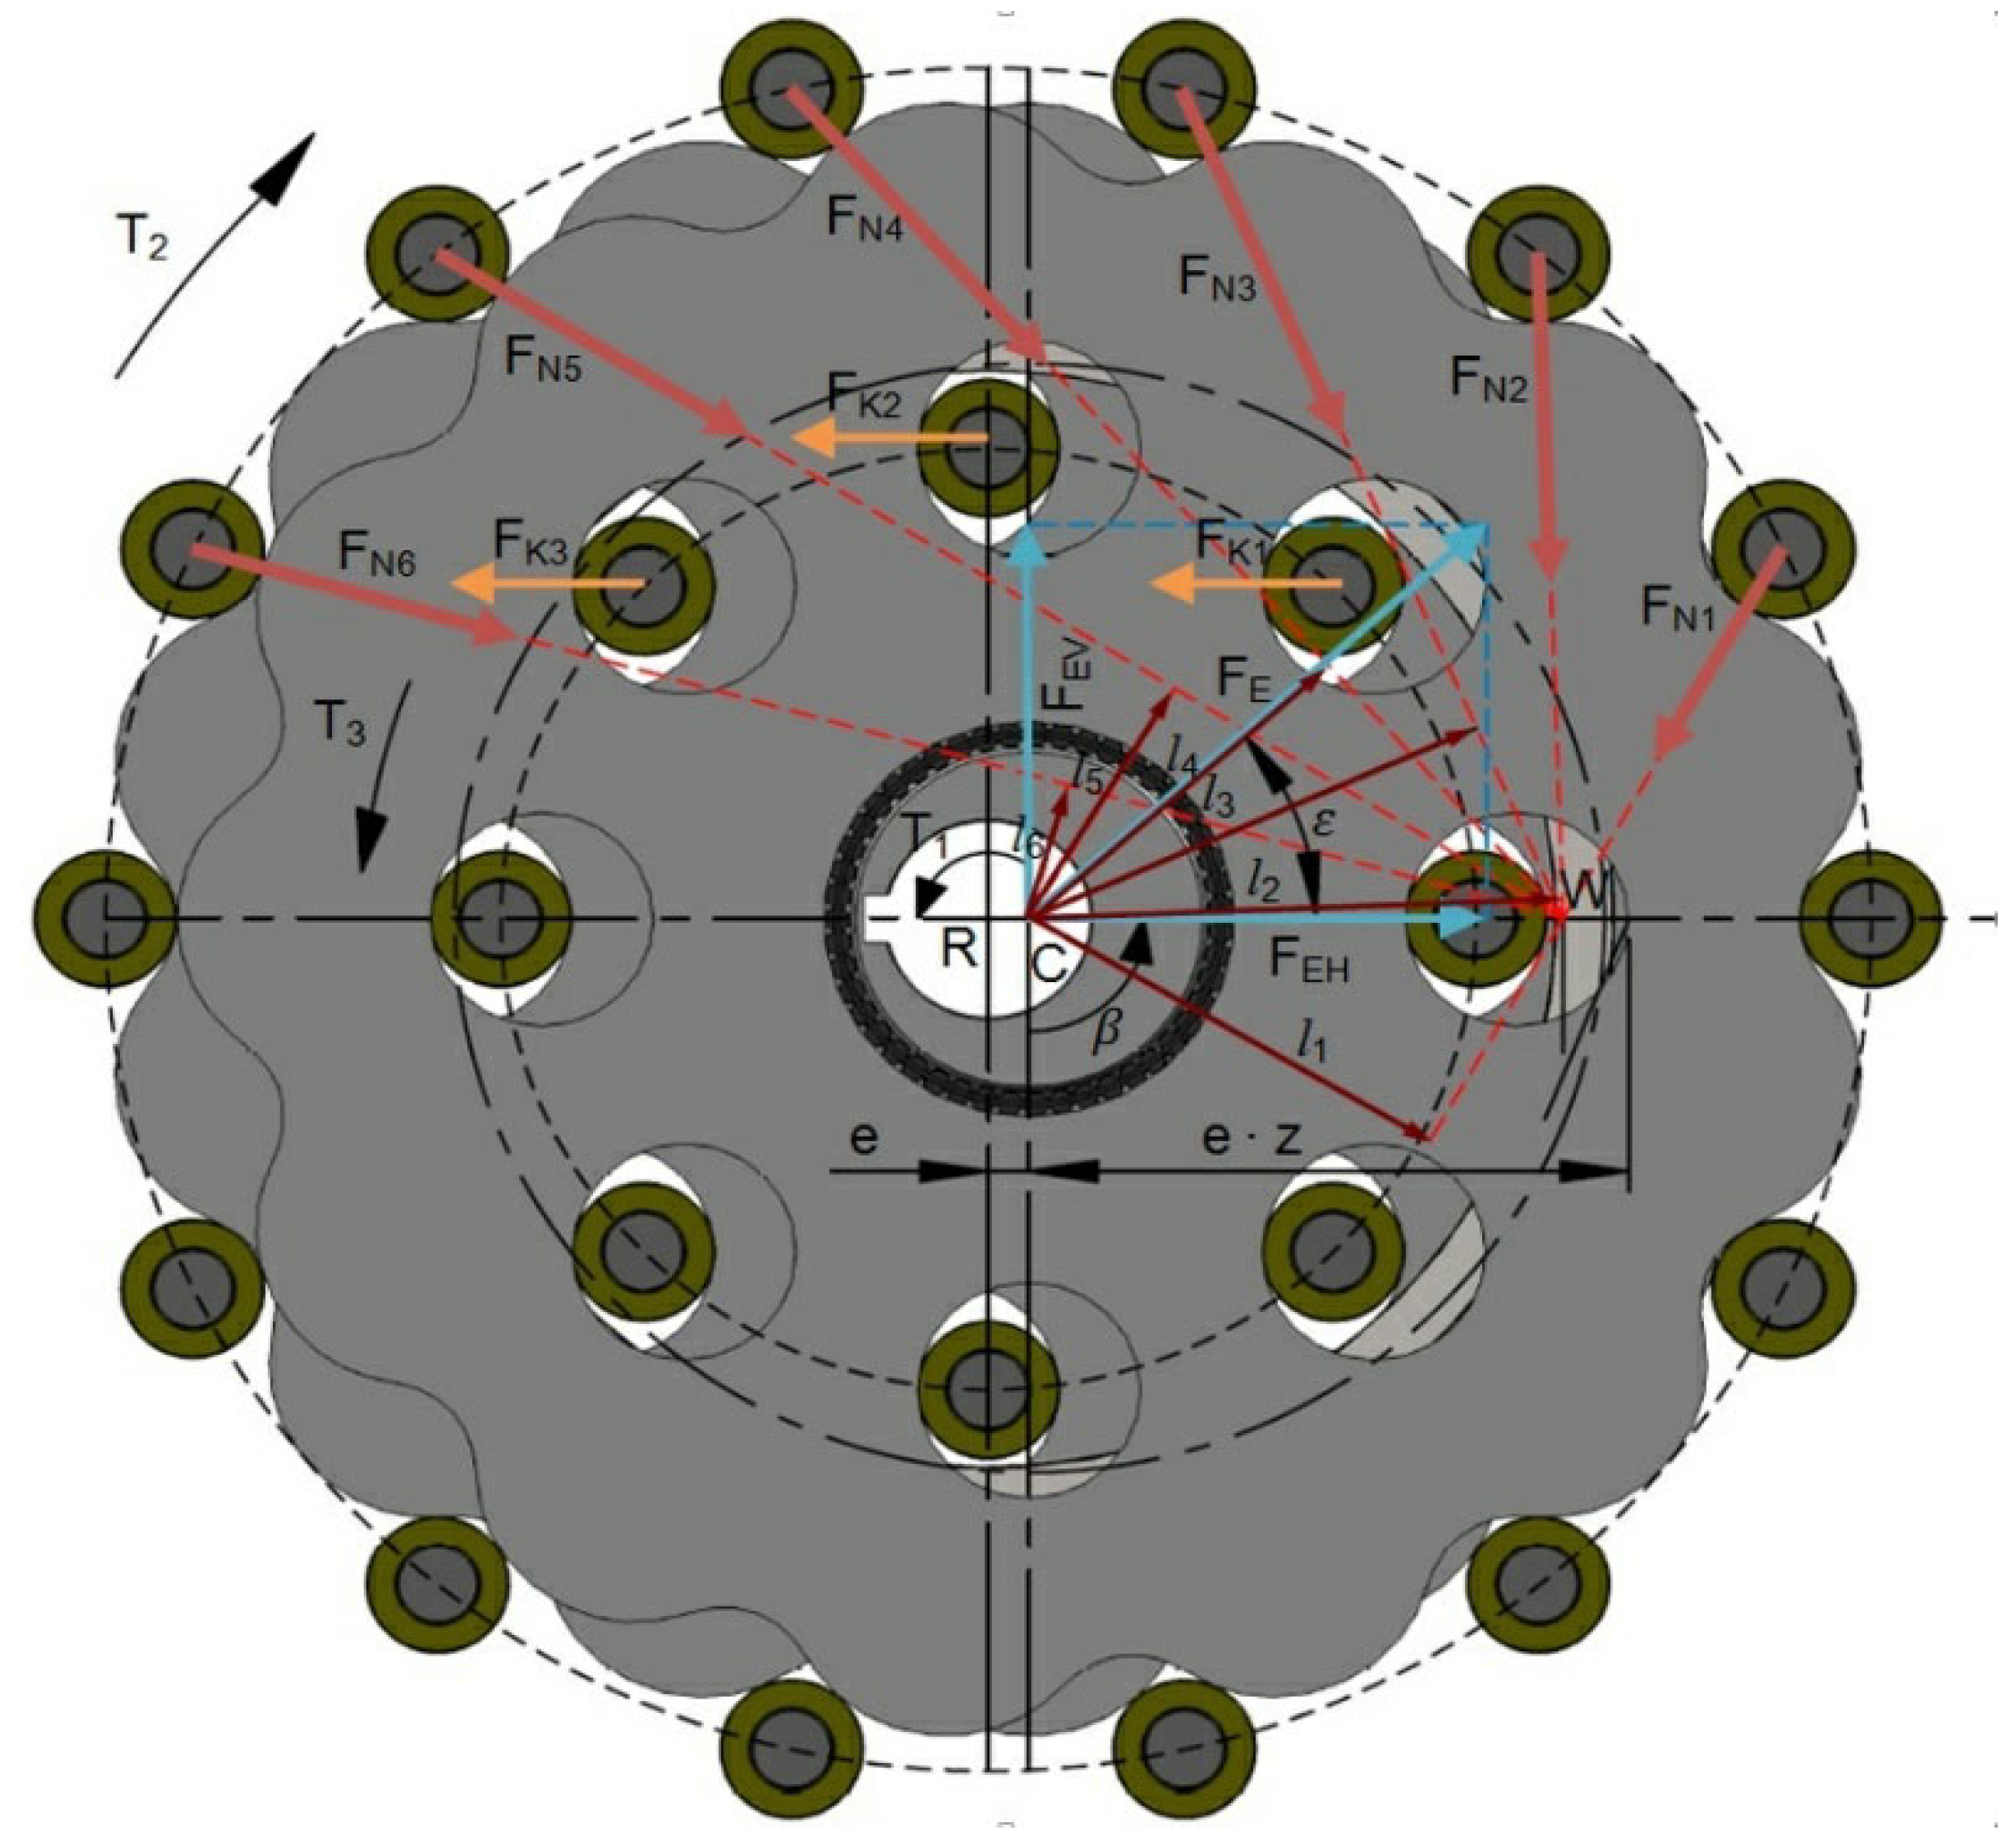
- FE—eccentric cam force (the force where the vertical component FEV generates the drive torque T1 on the cycloid disc due to its eccentric rotation),
- -
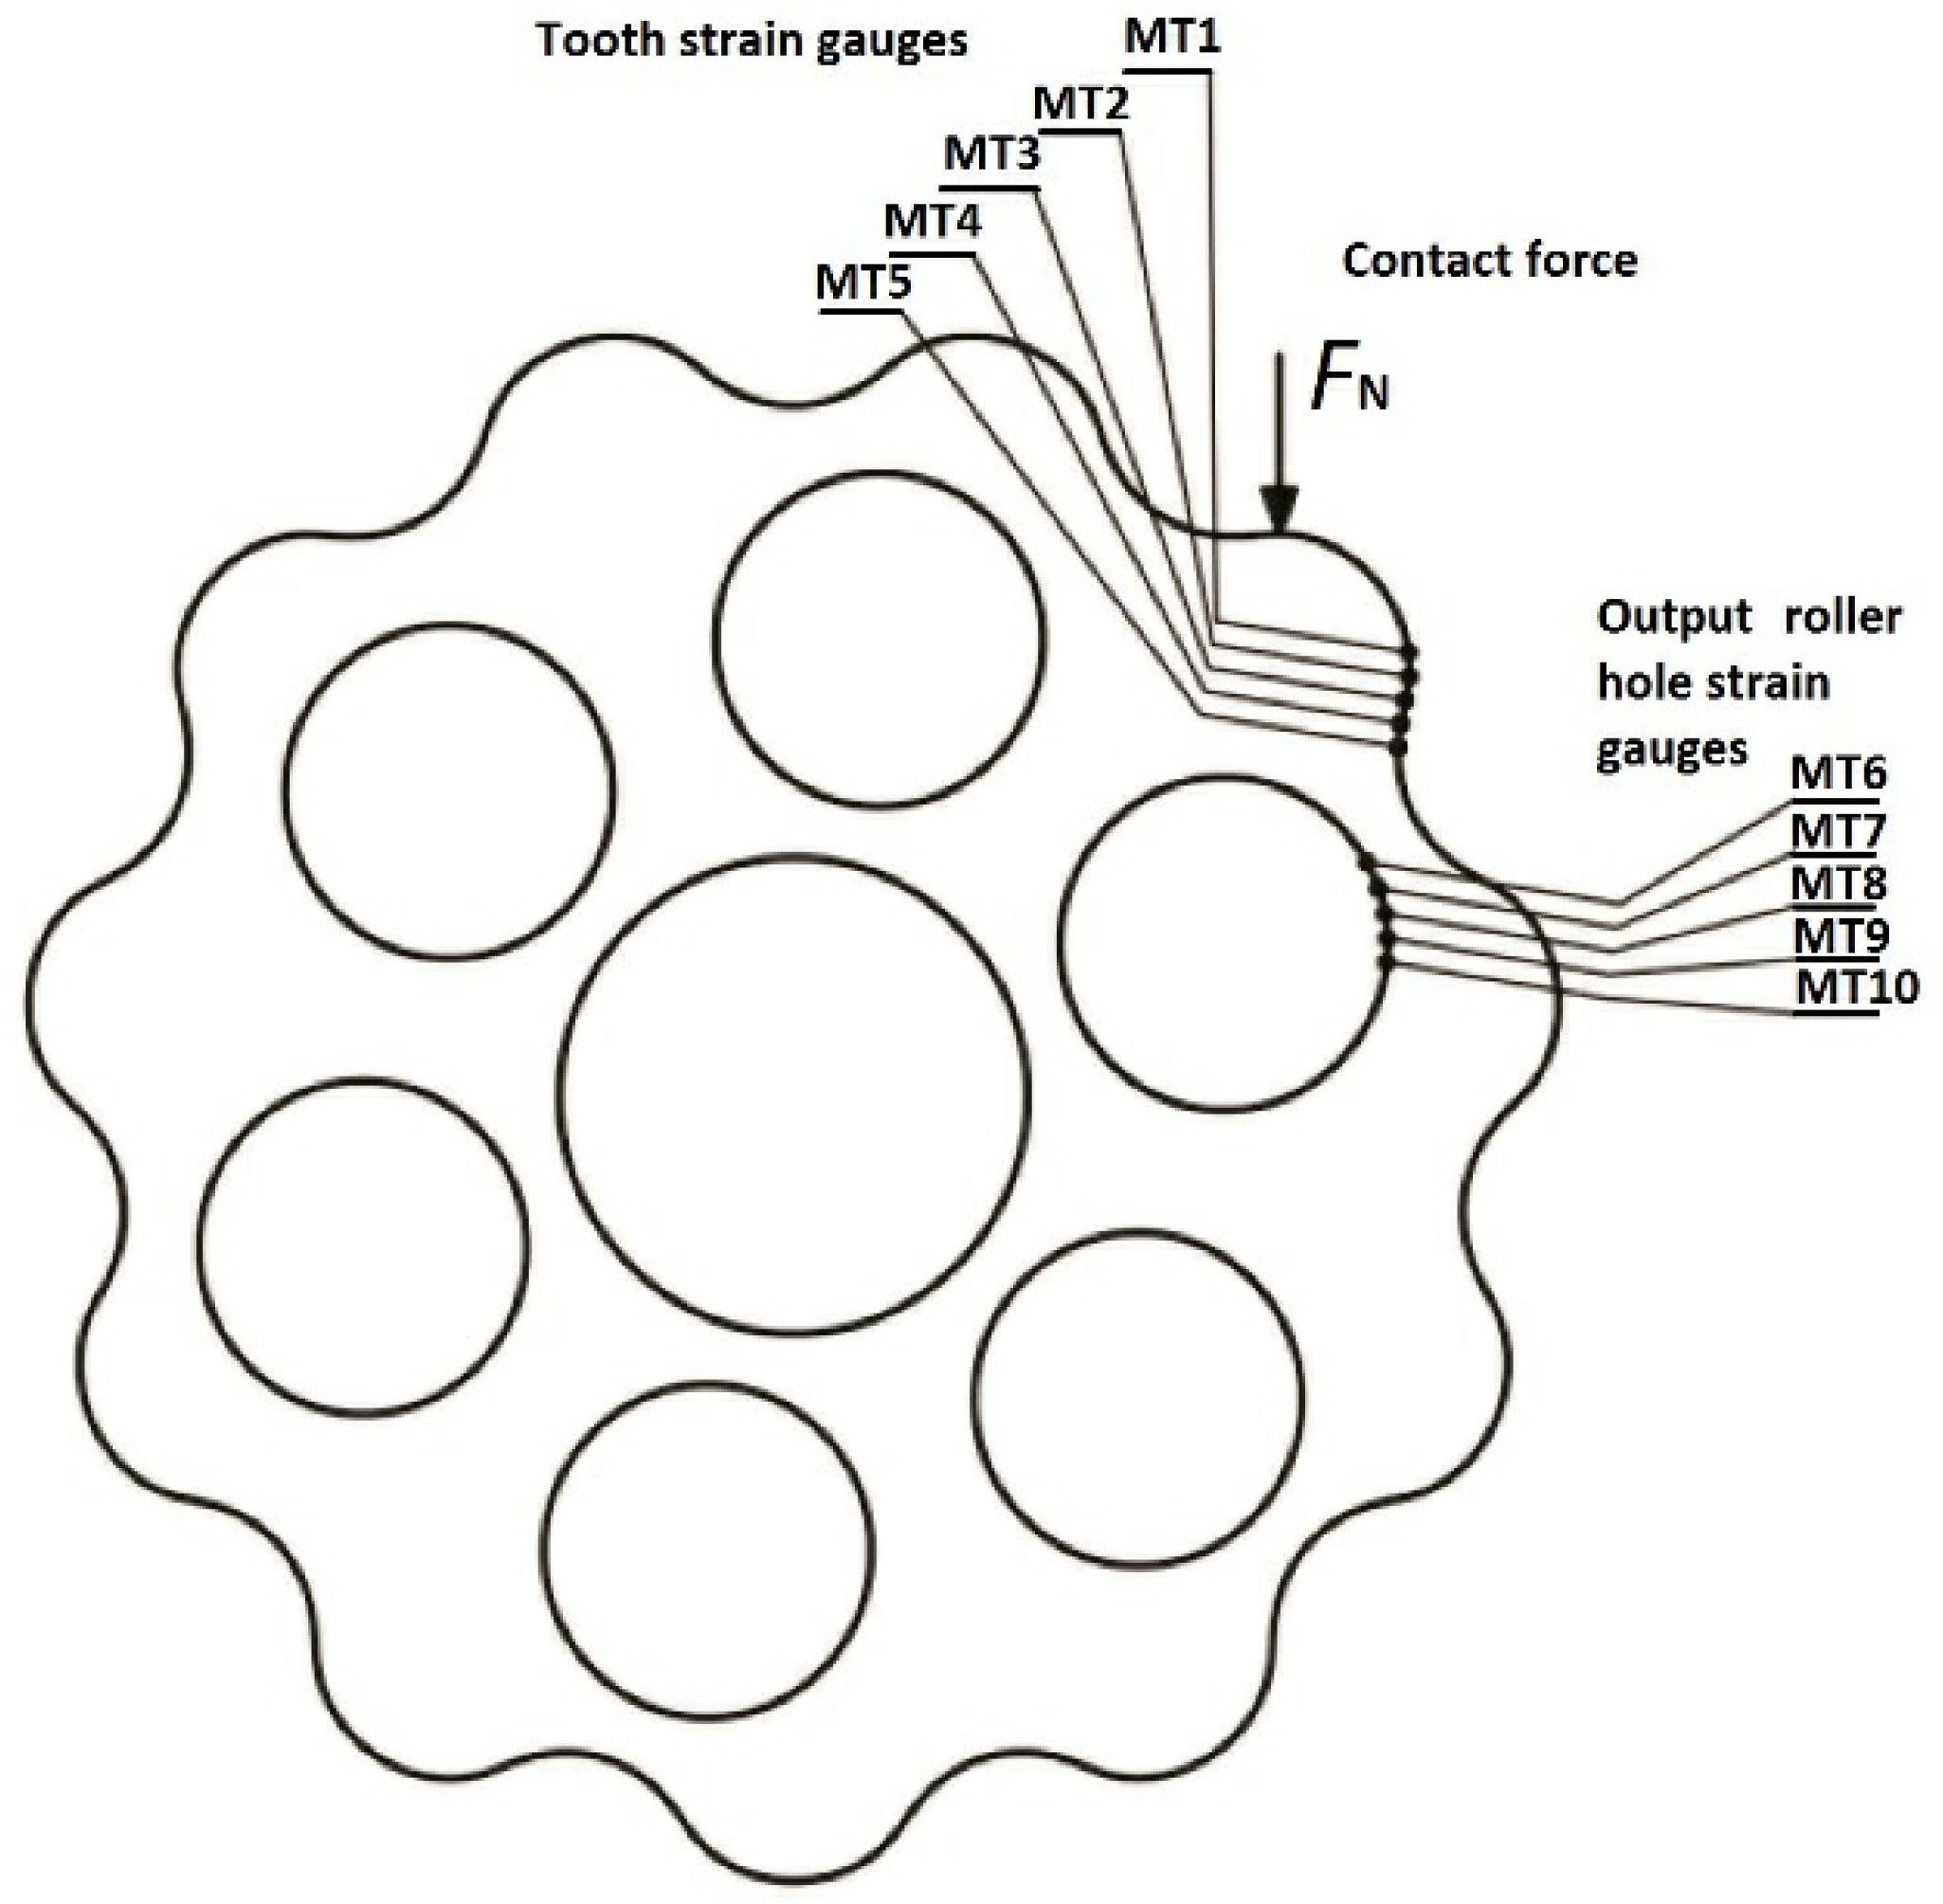
- FN—normal force at the current contact point of the cycloid disc tooth and the stationary ring gear roller (normal force),
- -
- FK—normal force at the current contact point of the output roller and the opening in the cycloid disc (output force).
- -
- T1—drive torque of the cycloid disc,
- -
- T2—torque on the ring gear,
- -
- T3—output torque of the cycloid disc.
- -
- Input power: Pin = 5.5 kW;
- -
- Input number of revolutions: nin = 1450 min−1;
- -
- Gear ratio: ur = 11;
- -
- Eccentricity e = 4 mm.
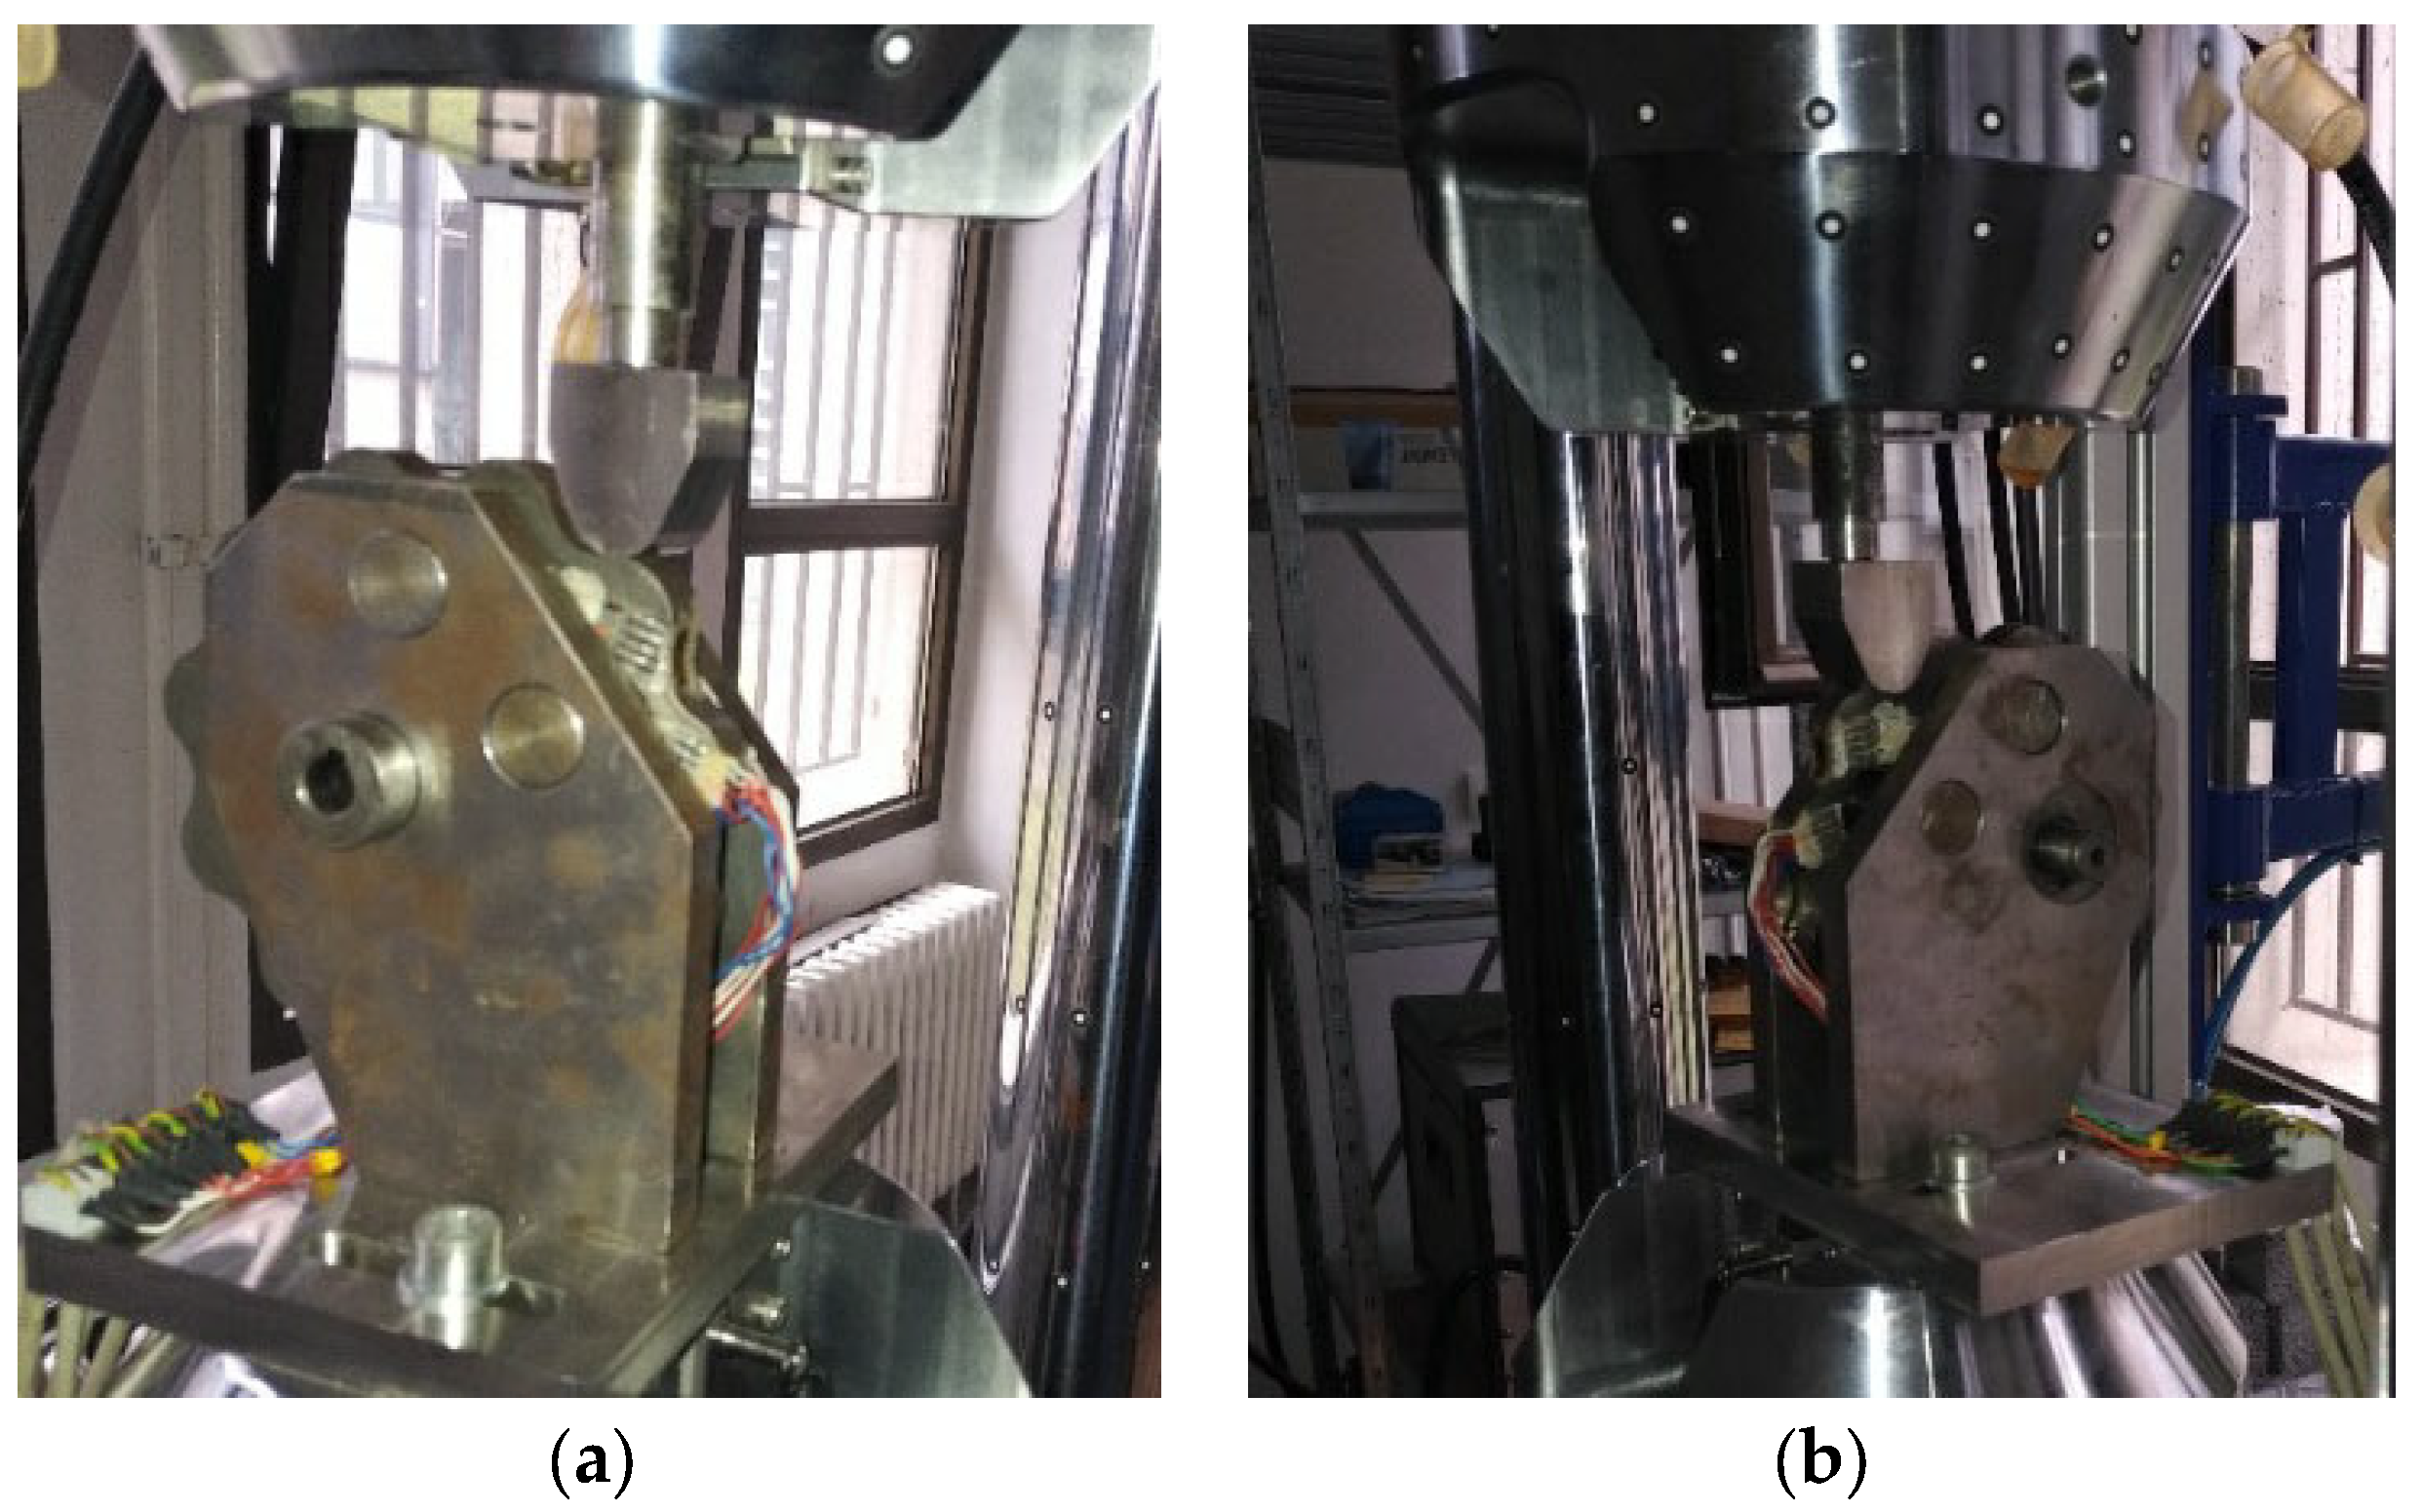
3. Experimental Analysis of the Cycloid Disc
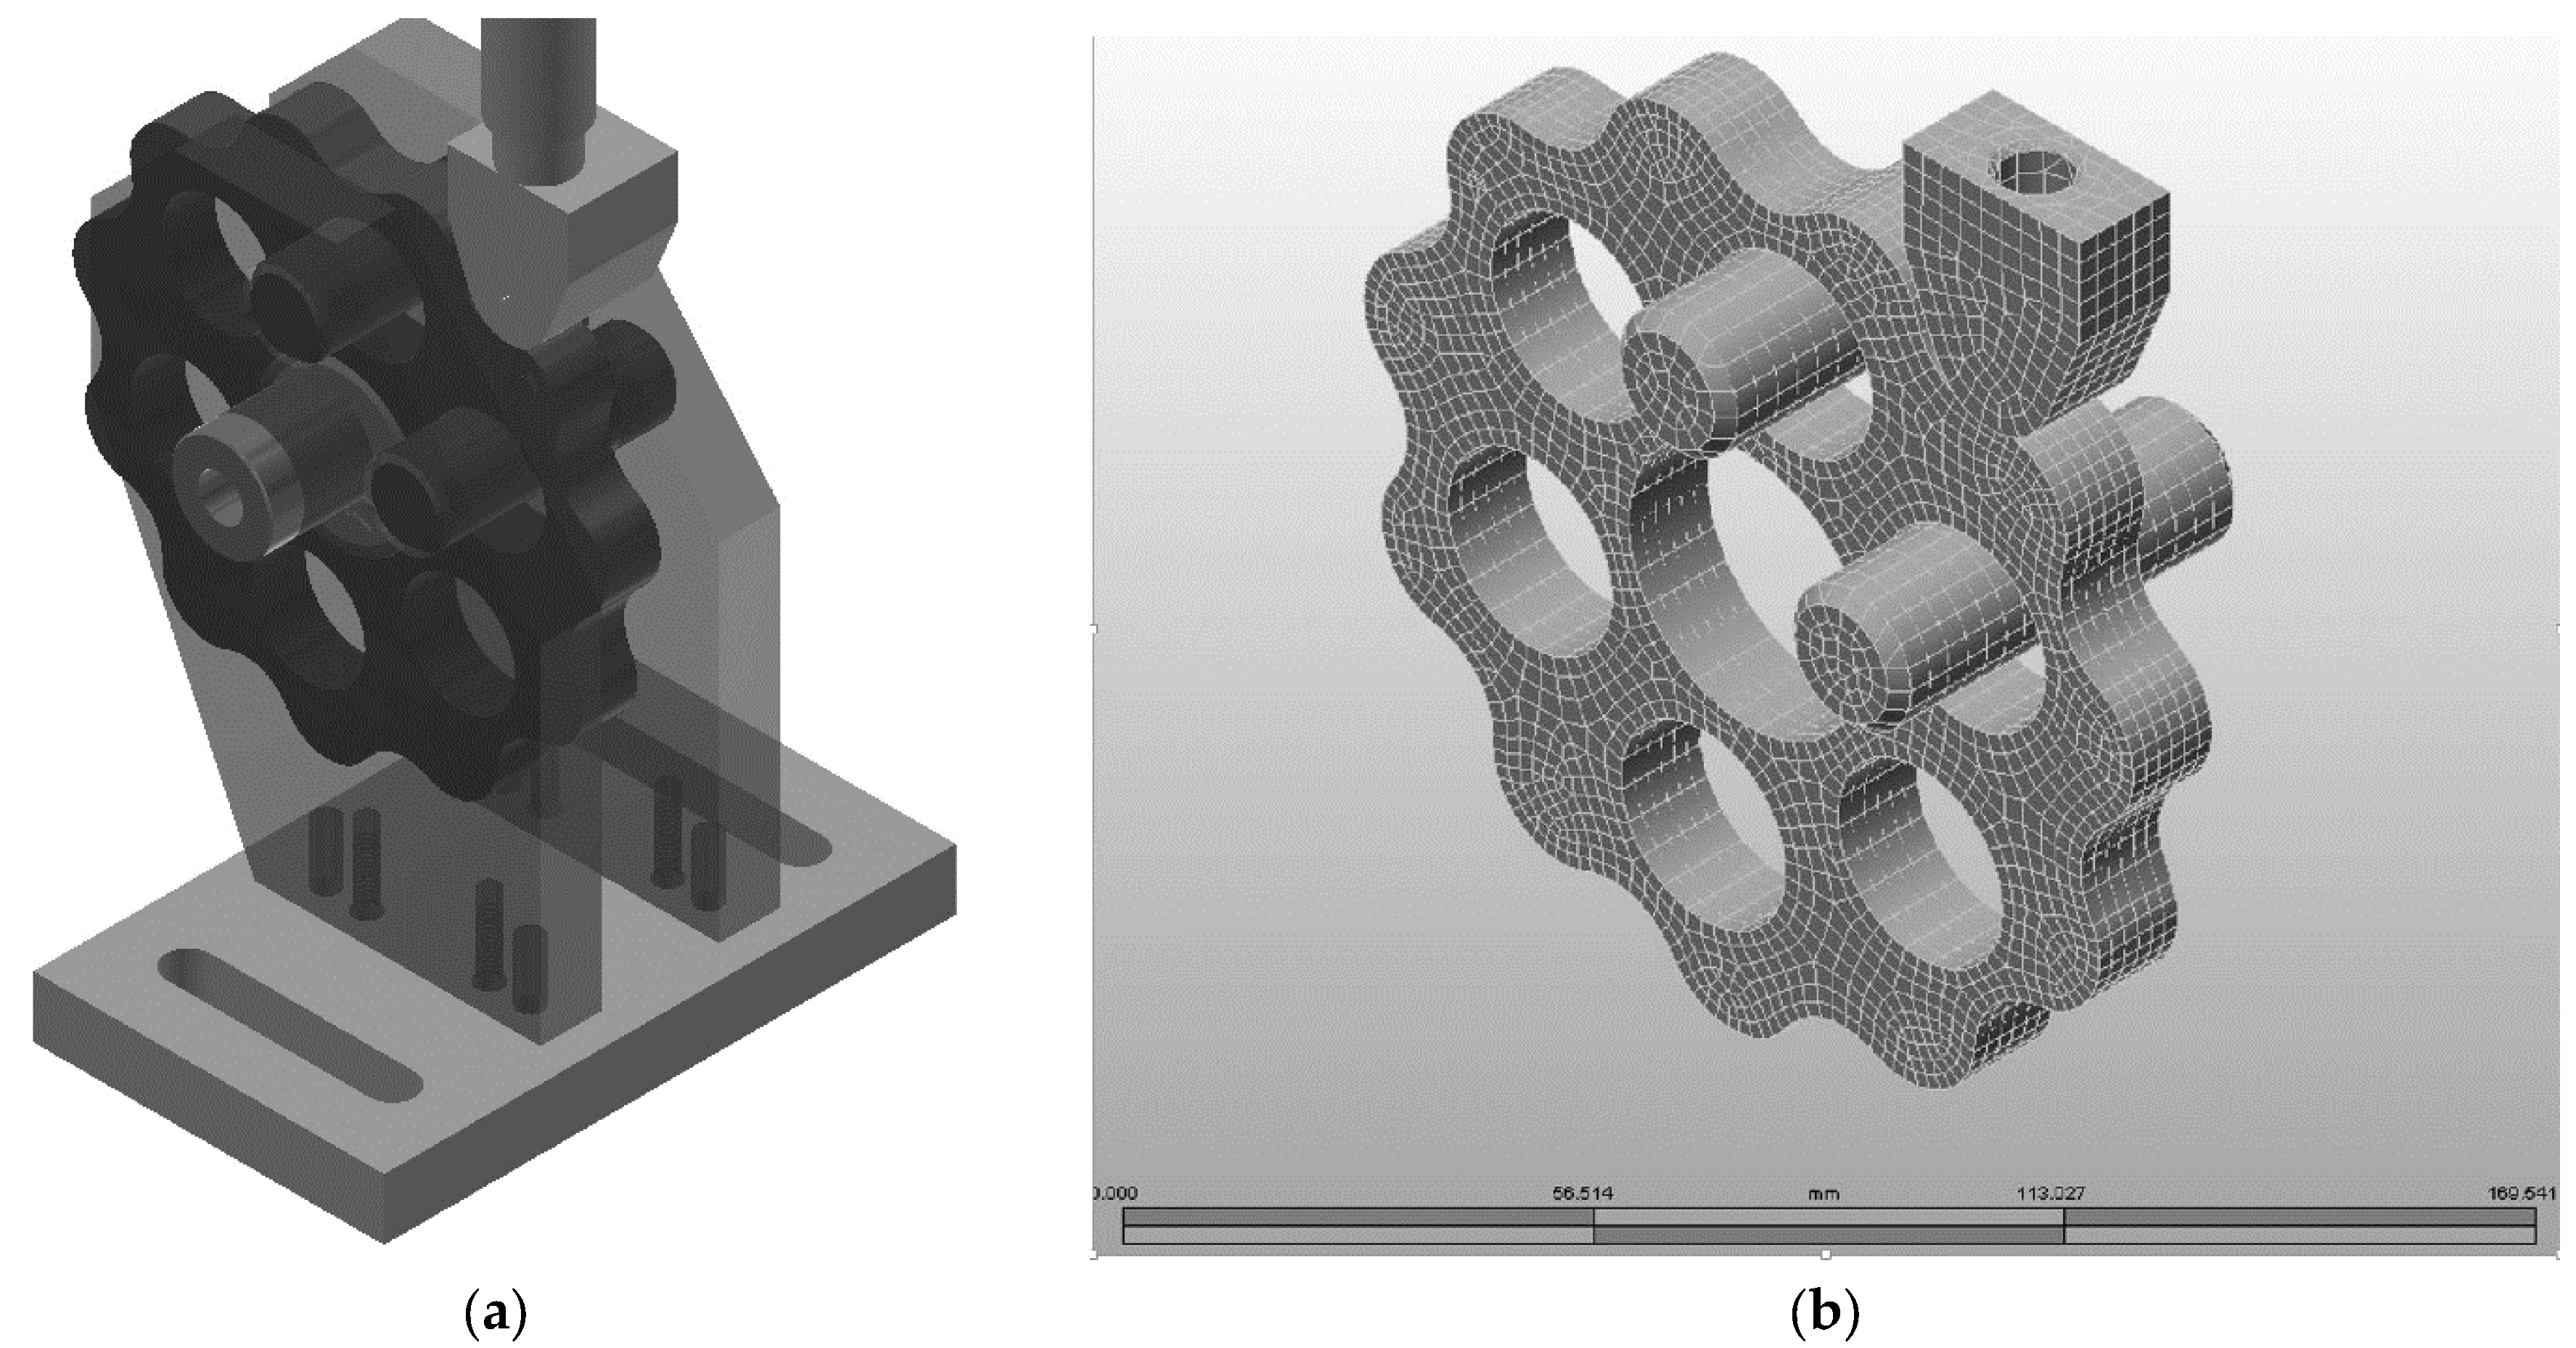
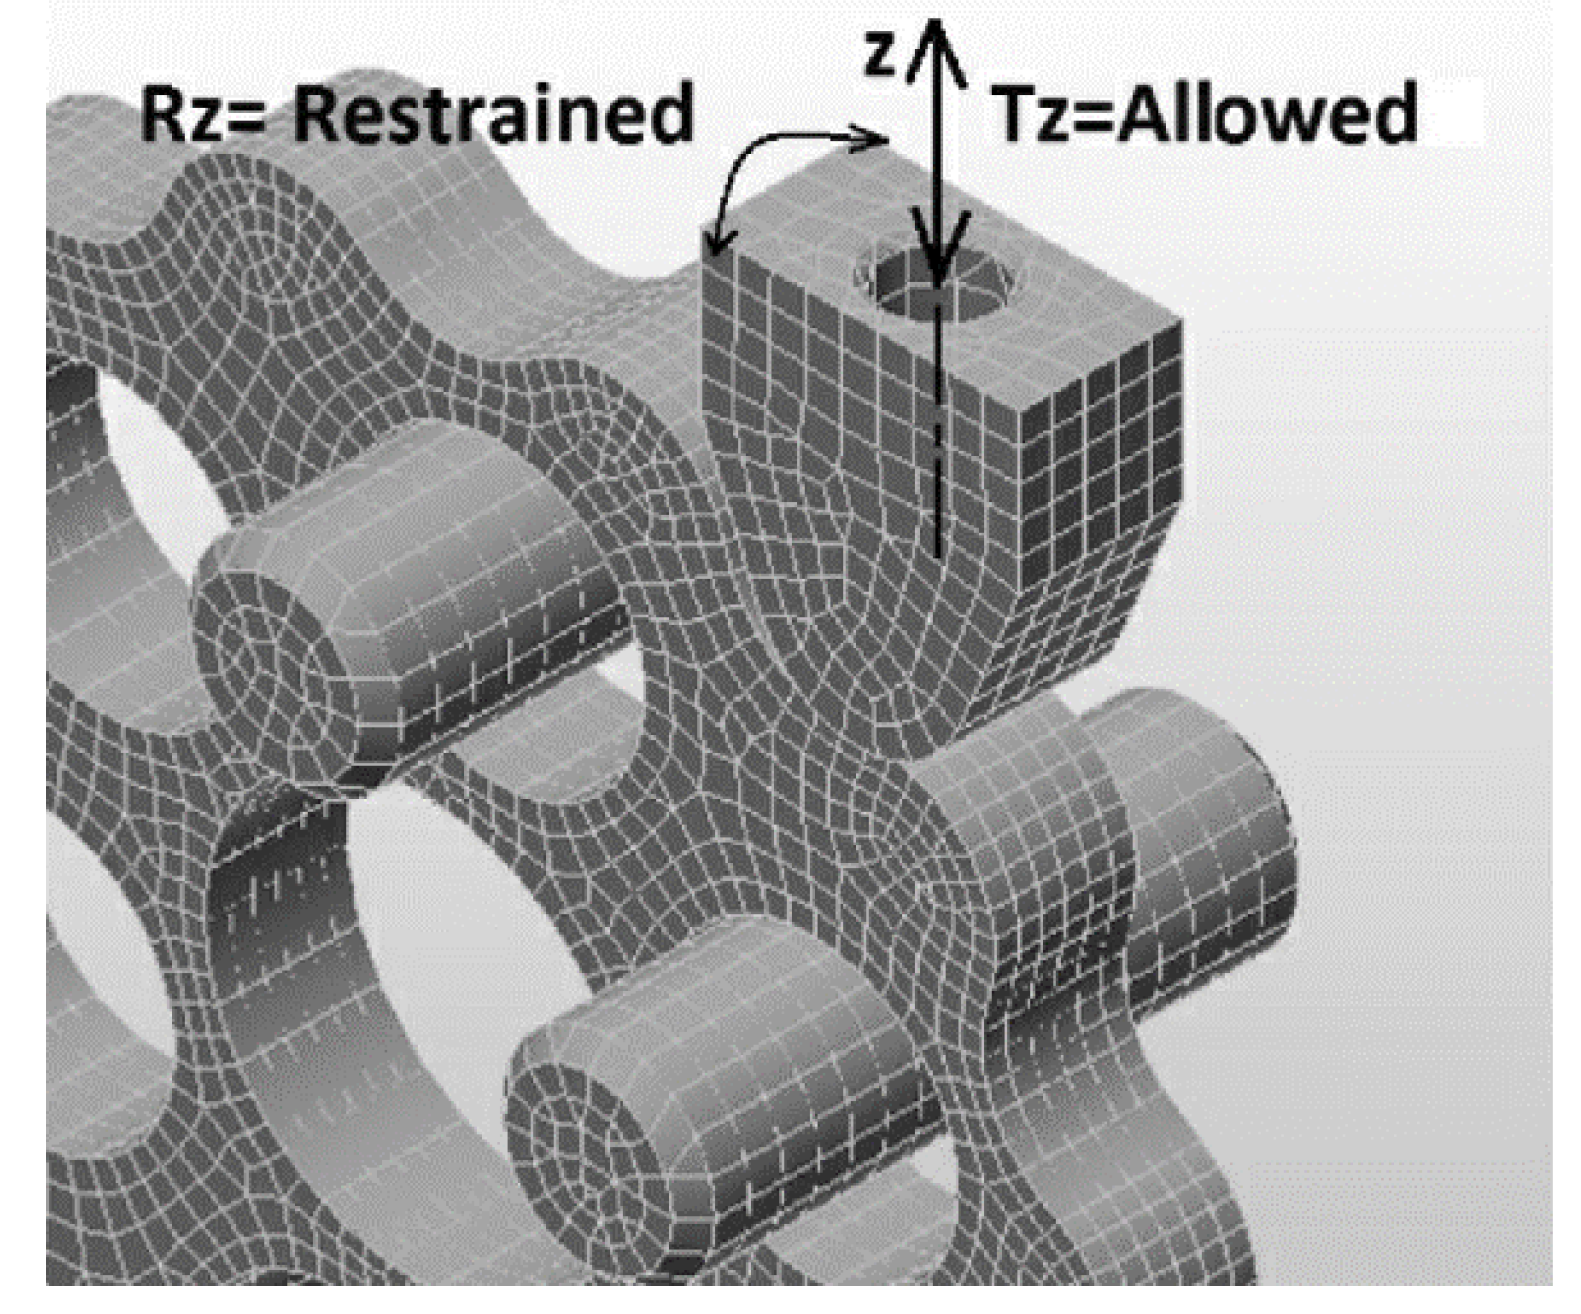
4. Numerical Analysis of the Stress-Strain State of the Cycloid Disc
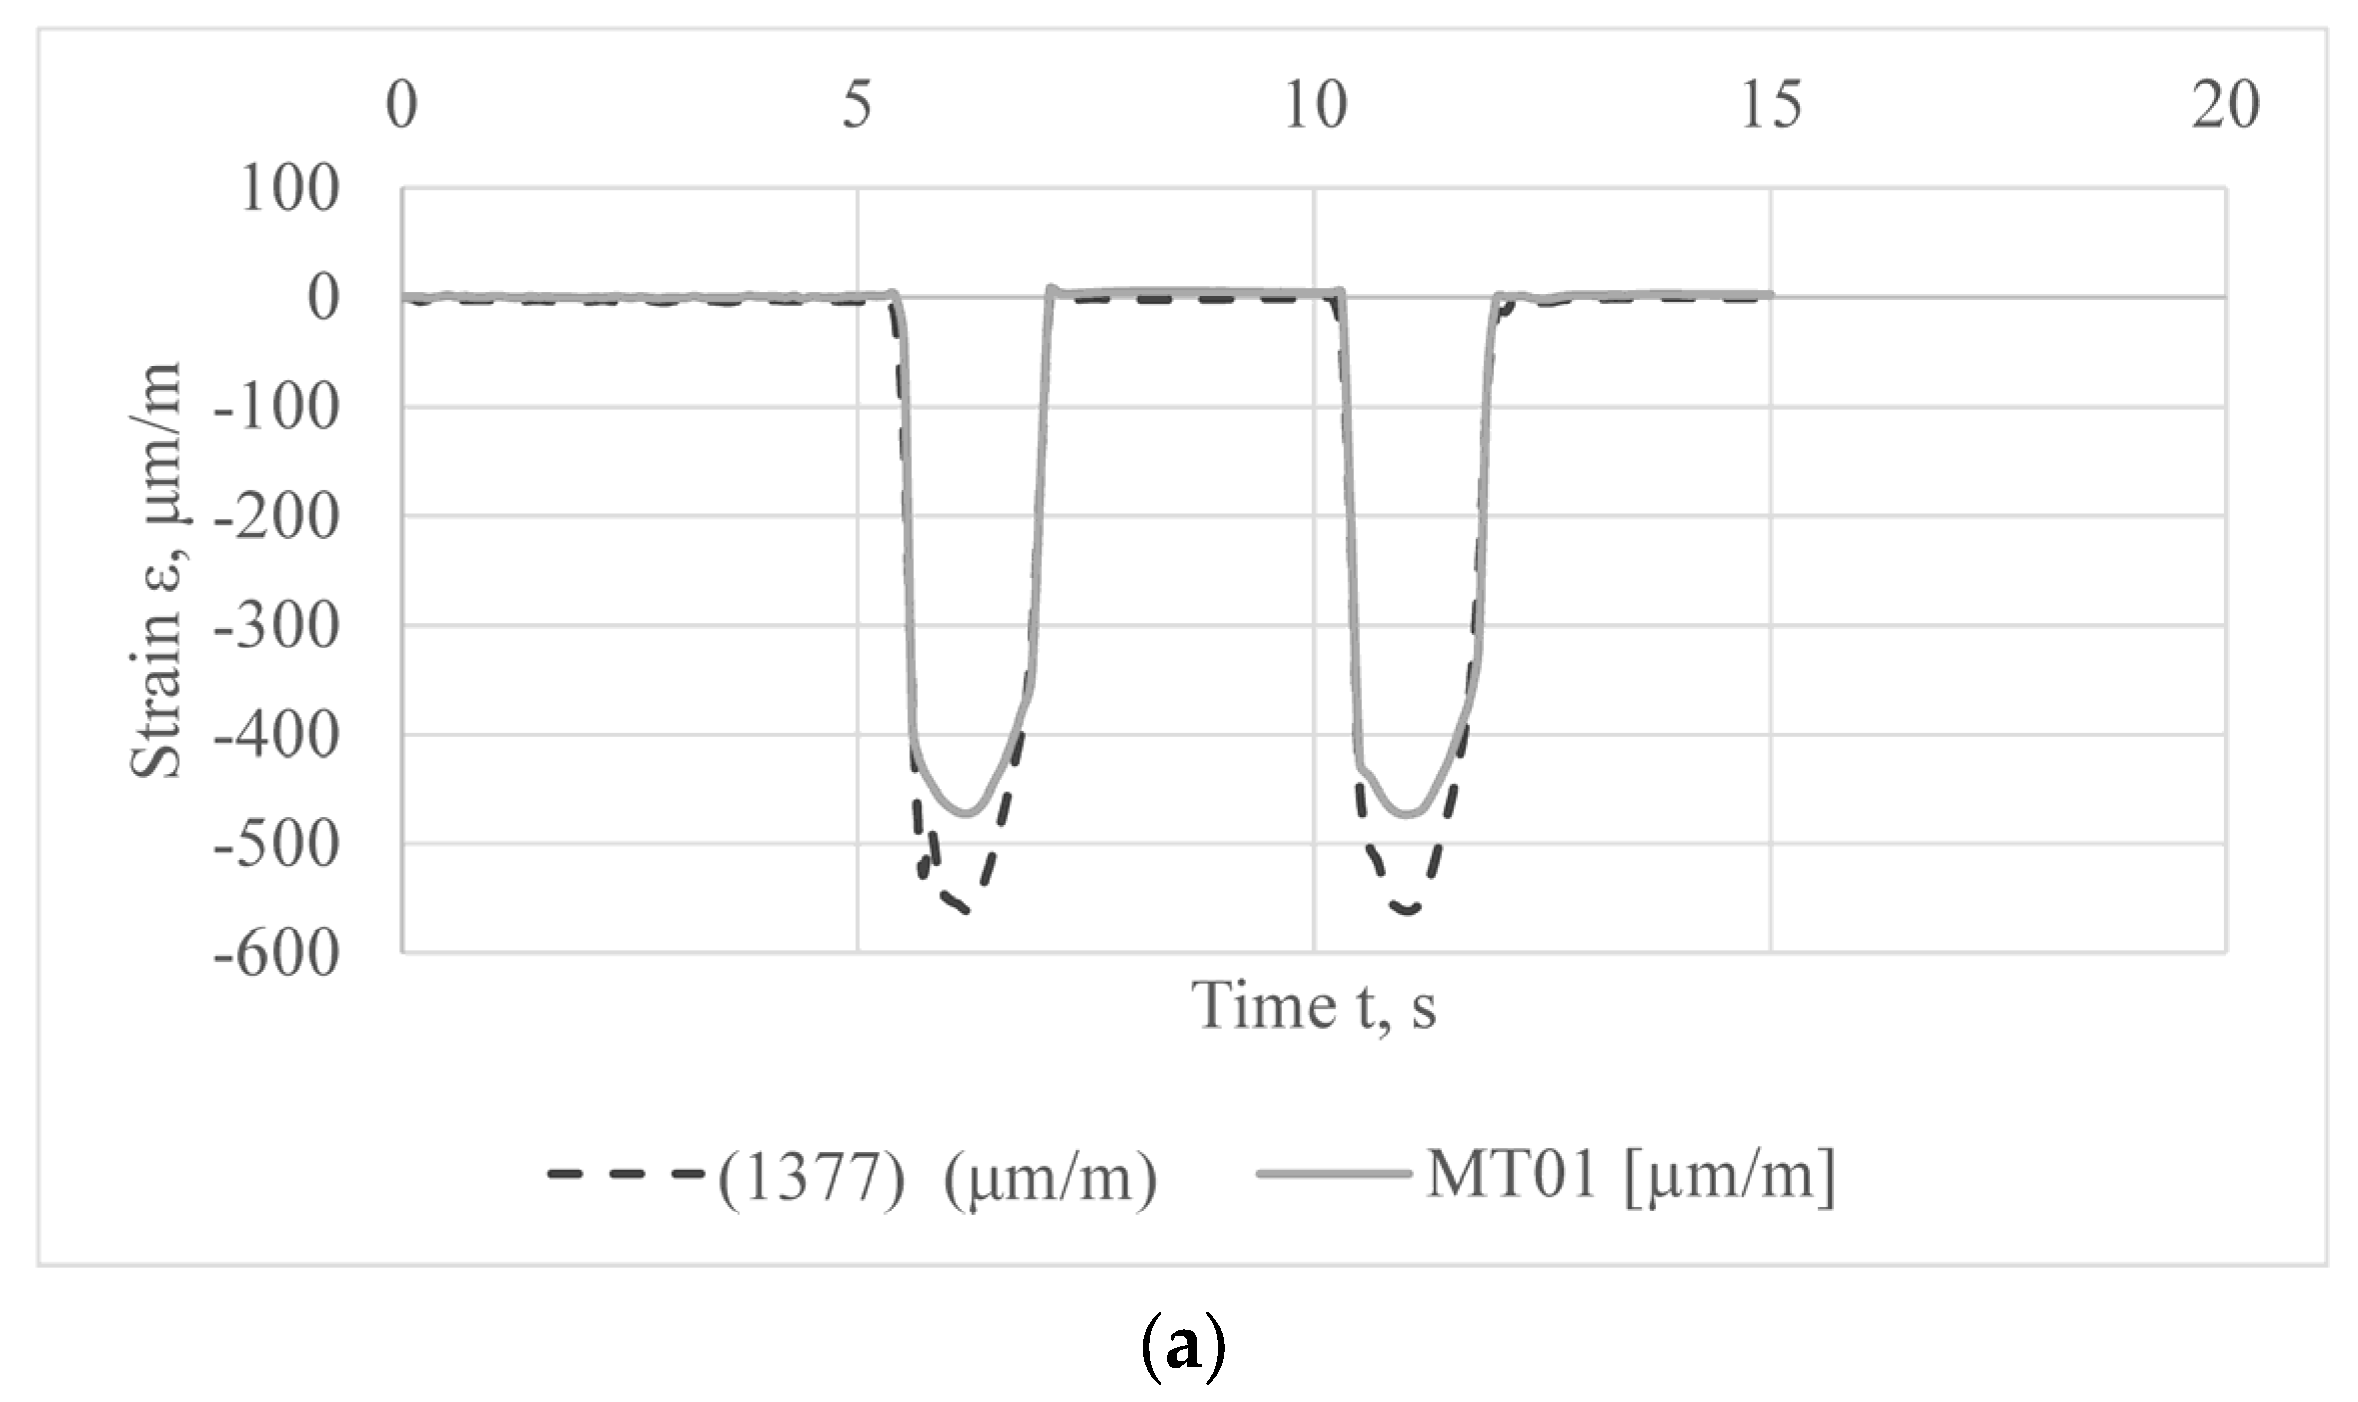
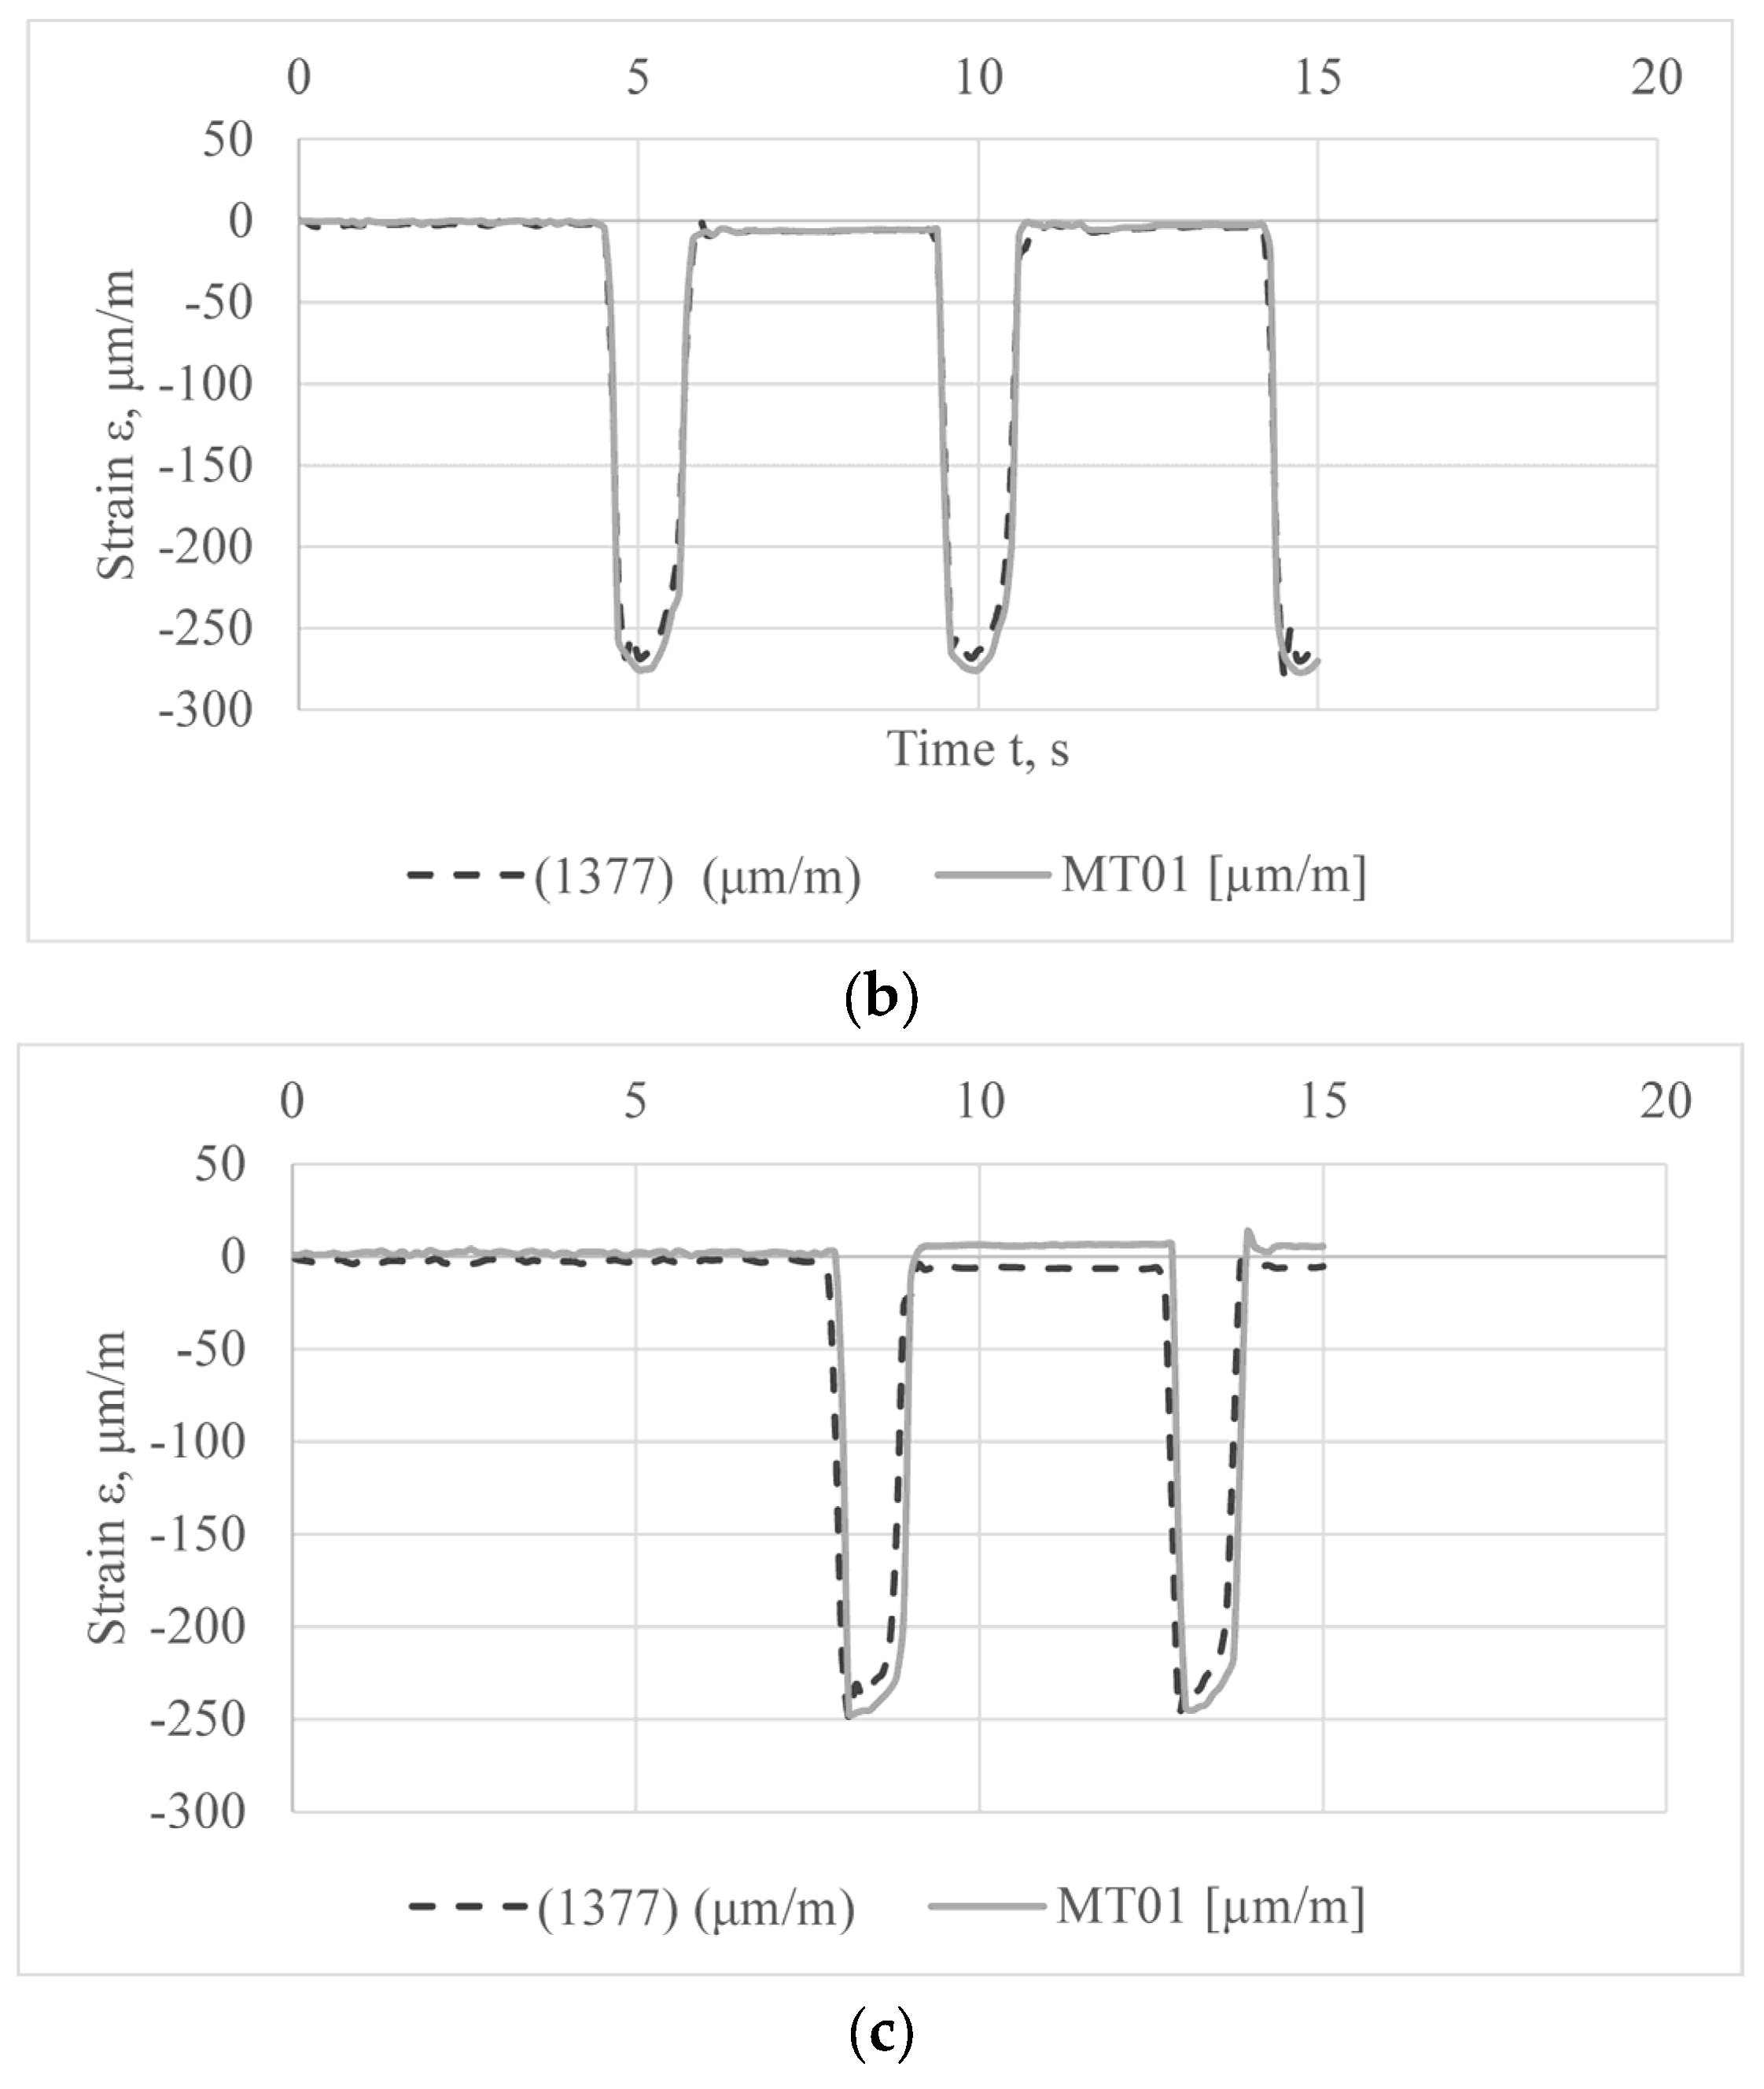
5. Experimental and Simulation Results Comparison
6. Conclusions
- -
- There is a high level of matching between the numerical and the experimental results. The level of mismatching for the strain gauge with the largest measured strain, MT1 (node 1377), is between 3% and 15%. This clearly shows that the boundary conditions set for the numerical model corresponded to the operating conditions in the experiment. The presented deviation between the results is in the acceptable interval.
- -
- As expected, the maximum stress occurs in the meshing zone of the cycloid disc and the ring gear. These stress values are far below the material yield stress.
- -
- There are two more places where the stress spikes occur: in the contact area between the cycloid disc and the eccentric cam and in the contact area between the cycloid disc and the output rollers, as shown in [23]. These are expected results, as shown in the literature review.
- -
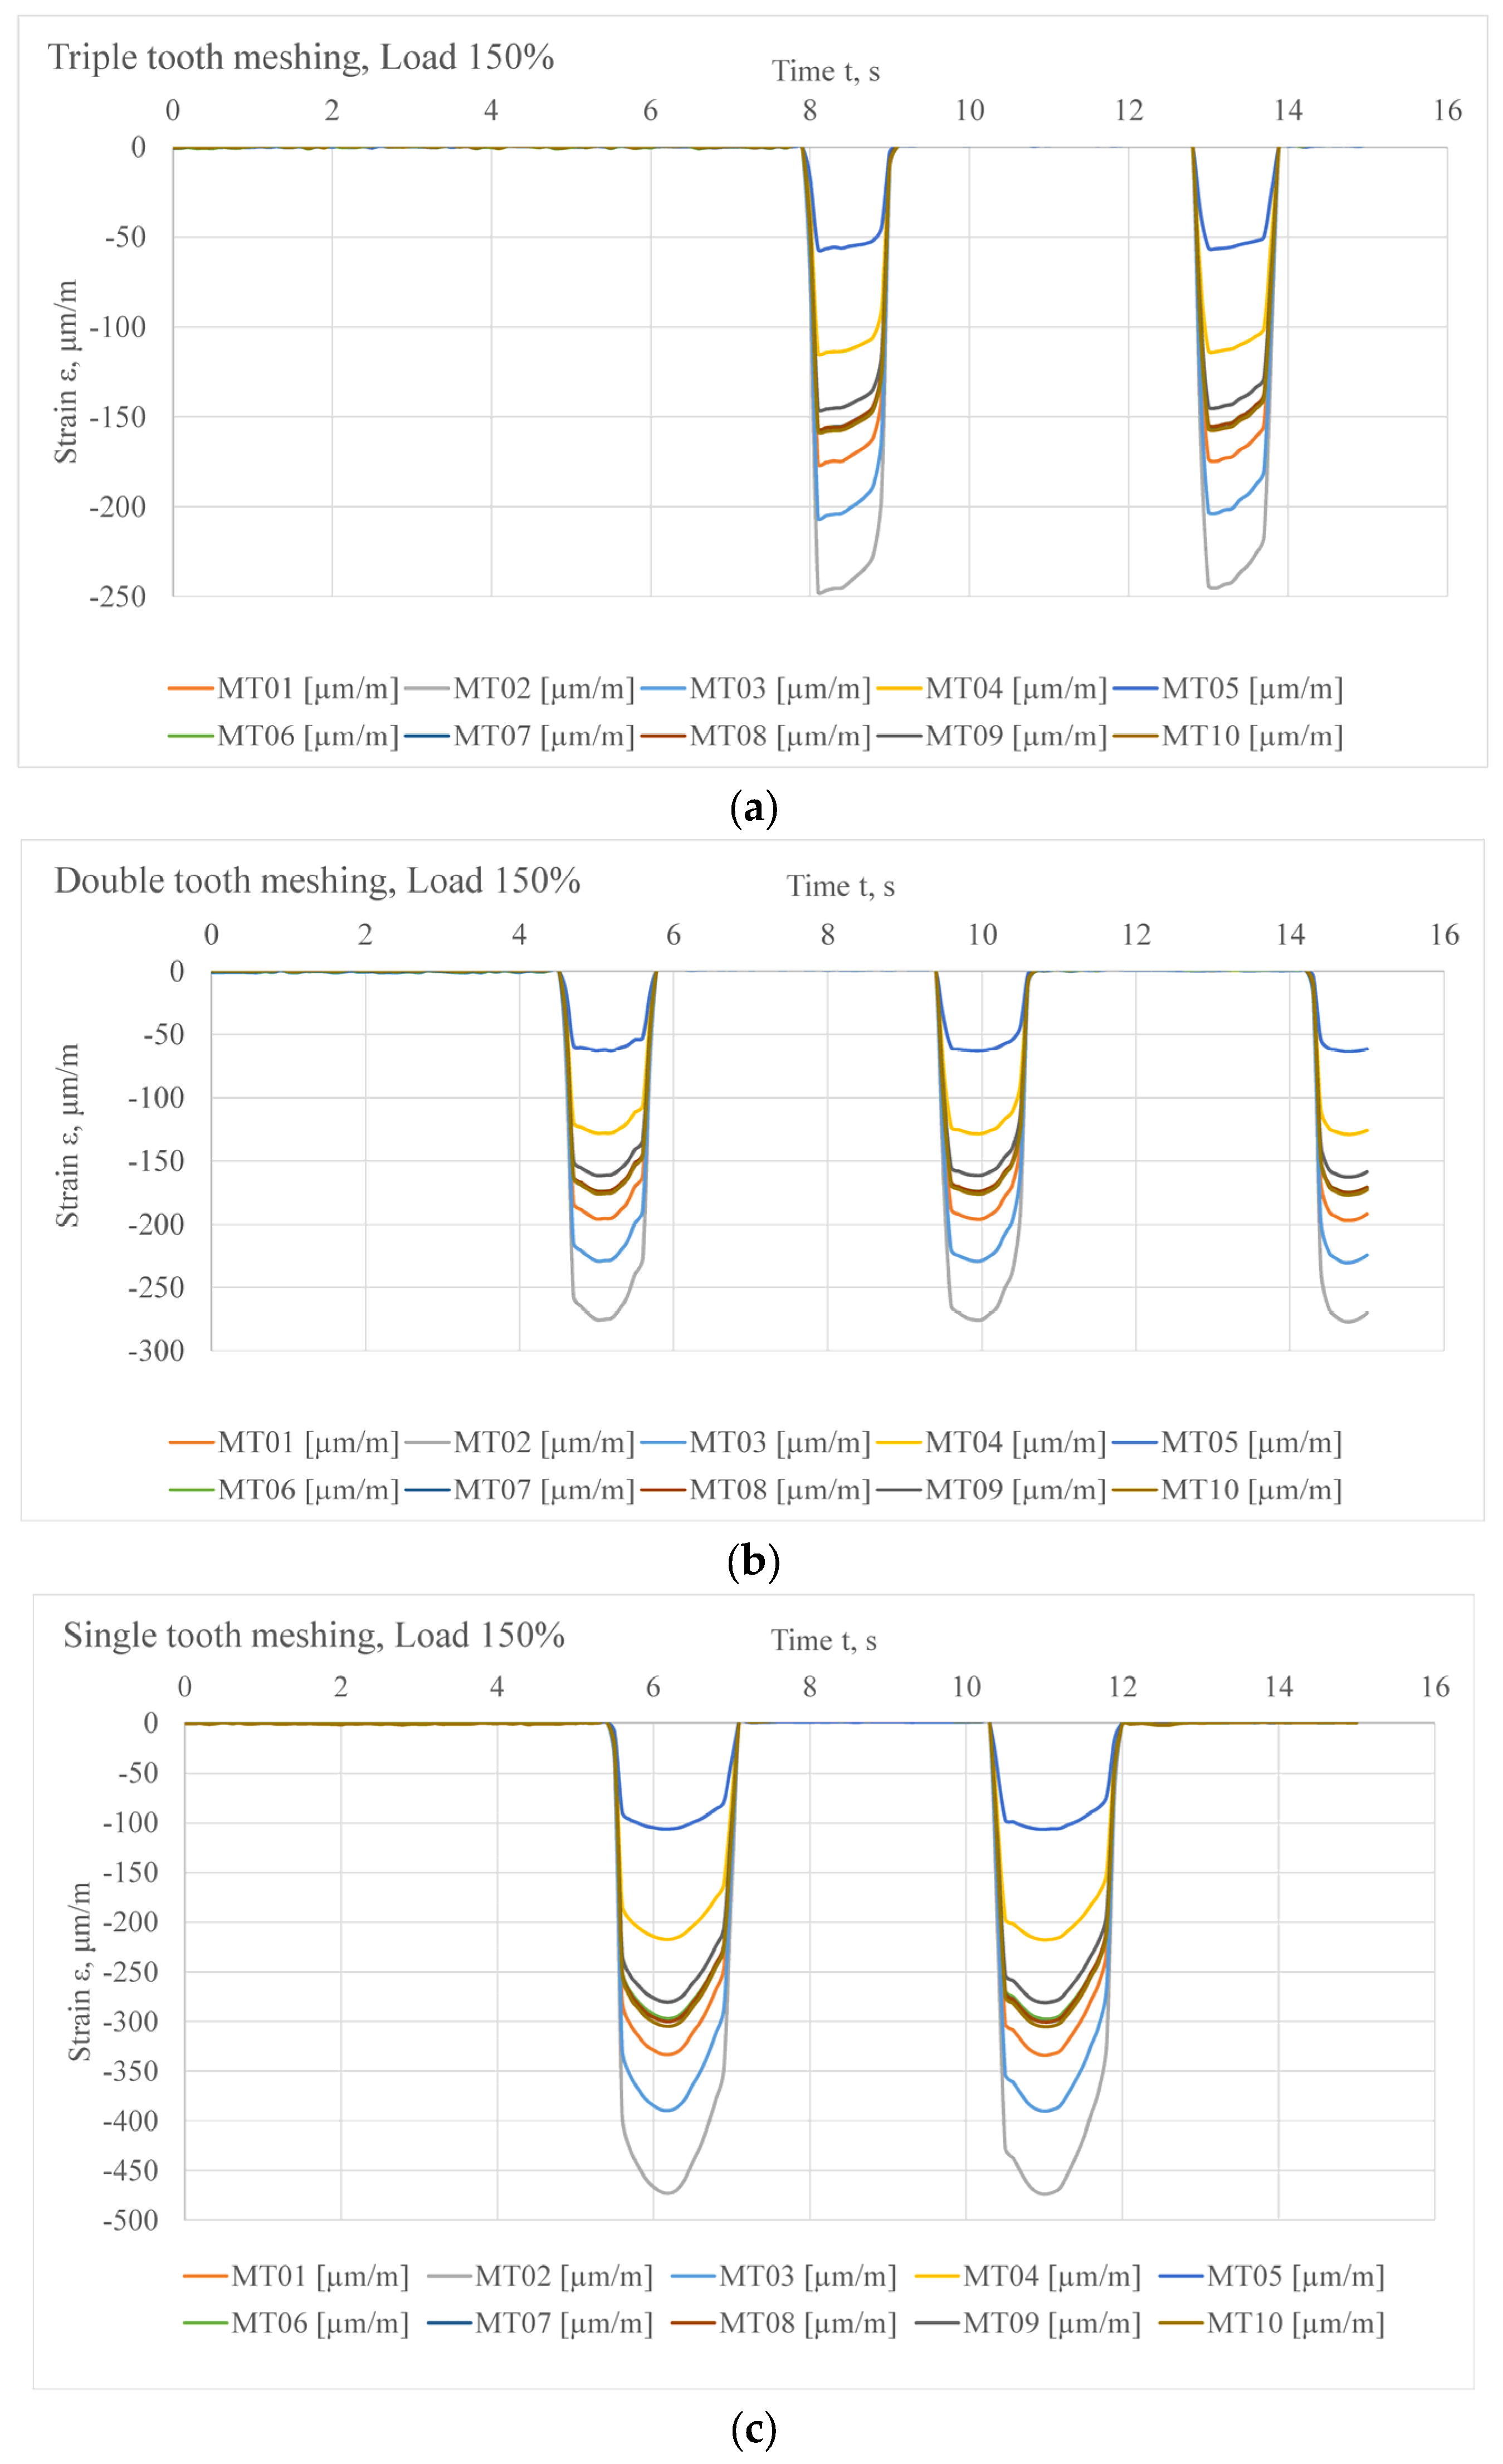
- The stress values are far below the yield stress value of the cycloid disc material at the double-tooth and triple-tooth meshing, while in the case of the single-tooth meshing, the stress values are close to the yield stress value (the most unfavorable case being when the load was up to 150% of the force FNmax). Overload is included in this research for the cases of shock forces or increased friction forces occurring during the cycloid drive operation to cover those possibilities as well.
- -
- Based on the performed analysis, it can be concluded that the output rollers of the cycloid speed reducer need to be further studied in more detail since the contact area between the output rollers and the cycloid disc is one of the places where the highest stresses occur. This is the place that requires further analyses and possible new experimental setups.
- -
- Manufacturing tolerances for cycloid speed reducers should be kept as low as possible, as shown in [21] so that at least a double-tooth meshing can be achieved. This would considerably decrease the stresses occurring during interactions between the elements of the cycloid speed reducer.
Author Contributions
Funding
Institutional Review Board Statement
Informed Consent Statement
Data Availability Statement
Conflicts of Interest
References
- Kudrijavcev, V.N. Planetary Gear Train; Leningrad: Moscow, Russia, 1966. (In Russian) [Google Scholar]
- Lehmann, M. Calculation and Measurement of Forces Acting on Cycloid Speed Reducer; Technical University Munich: Munich, Germany, 1976. (In German) [Google Scholar]
- Malhotra, S.K.; Parameswaran, M.A. Analysis of a cycloid speed reducer. Mech. Mach. Theory 1983, 18, 491–499. [Google Scholar] [CrossRef]
- Thube, S.V.; Bobak, T.R. Dynamic Analysis of a Cycloidal Gearbox Using Finite Element Method; American Gear Manufacturers Association (AGMA): Alexandria, VA, USA, 2012; pp. 241–253. [Google Scholar]
- Kniazeva, A.; Goman, A. Definition of a loading zone of a planetary pin reducer eccentric. Meh. Mashin Meh. I Mater. 2012, 3, 40–52. [Google Scholar]
- Wang, S.; Tian, G.; Jiang, X. Estimation of sliding loss in a cycloid gear pair. Int. J. Adv. Comput. Technol. 2012, 4, 462–469. [Google Scholar] [CrossRef]
- Li, S. Design and strength analysis methods of the trochoidal gear reducers. Mech. Mach. Theory 2014, 81, 140–154. [Google Scholar] [CrossRef]
- Hsieh, C.F. Dynamics analysis of cycloidal speed reducers with pinwheel and nonpinwheel designs. J. Mech. Des. Trans. ASME 2014, 136, 091008. [Google Scholar] [CrossRef]
- Hsieh, C.F. The effect on dynamics of using a new transmission design for eccentric speed reducers. Mech. Mach. Theory 2014, 80, 1–16. [Google Scholar] [CrossRef]
- Zhang, L.; Wang, Y.; Wu, K.; Sheng, R.; Huang, Q. Dynamic modeling and vibration characteristics of a two-stage closed-form planetary gear train. Mech. Mach. Theory 2016, 97, 12–28. [Google Scholar] [CrossRef]
- Zhang, F.; Li, P.; Zhu, P.; Yang, X.; Jiang, W. Analysis on dynamic transmission accuracy for RV reducer. MATEC Web Conf. 2017, 100, 01003. [Google Scholar] [CrossRef] [Green Version]
- Ren, Z.Y.; Mao, S.M.; Guo, W.C.; Guo, Z. Tooth modification and dynamic performance of the cycloidal drive. Mech. Syst. Signal Process. 2017, 85, 857–866. [Google Scholar] [CrossRef]
- Song, L.; Shunke, L.; Zheng, Z.; Chen, F. Analysis of the key structures of rv reducer based on finite element method. IOP Conf. Ser. Mater. Sci. Eng. 2019, 544, 012005. [Google Scholar] [CrossRef]
- Bao, H.Y.; Jin, G.H.; Lu, F.X. Nonlinear dynamic analysis of an external gear system with meshing beyond pitch point. J. Mech. Sci. Technol. 2020, 34, 4951–4963. [Google Scholar] [CrossRef]
- Król, R. Resonance phenomenon in the single stage cycloidal gearbox. Analysis of vibrations at the output shaft as a function of the external sleeves stiffness. Arch. Mech. Eng. 2021, 68, 303–320. [Google Scholar] [CrossRef]
- Tsai, Y.T.; Lin, K.H. Dynamic Analysis and Reliability Evaluation for an Eccentric Speed Reducer Based on Fem. J. Mech. 2020, 36, 395–403. [Google Scholar] [CrossRef]
- Tchufistov, E.A.; Tchufistov, O.E. Loading of satellite bearing of planetary cycloid gear by forces acting in meshing. IOP Conf. Ser. Mater. Sci. Eng. 2020, 862, 032042. [Google Scholar] [CrossRef]
- Efremenkov, E.A.; Efremenkova, S.K.; Dyussebayev, I.M. Determination of Geometric Parameter of Cycloidal Transmission from Contact Strength Condition for Design of Heavy Loading Mechanisms. IOP Conf. Ser. Mater. Sci. Eng. 2020, 795, 012024. [Google Scholar] [CrossRef]
- Zhang, T.; Li, X.; Wang, Y.; Sun, L. A semi-analytical load distribution model for cycloid drives with tooth profile and longitudinal modifications. Appl. Sci. 2020, 10, 4859. [Google Scholar] [CrossRef]
- Liu, C.; Shi, W.; Xu, L. A Novel Approach to Calculating the Transmission Accuracy of a Cycloid-Pin Gear Pair Based on Error Tooth Surfaces. Appl. Sci. 2021, 11, 8671. [Google Scholar] [CrossRef]
- Jiang, N.; Wang, S.; Yang, A.; Zhou, W.; Zhang, J. Transmission Efficiency of Cycloid–Pinion System Considering the Assembly Dimensional Chain. Appl. Sci. 2022, 12, 11917. [Google Scholar] [CrossRef]
- Efremenkov, E.A.; Shanin, S.A.; Martyushev, N.V. Development of an Algorithm for Computing the Force and Stress Parameters of a Cycloid Reducer. Mathematics 2023, 11, 993. [Google Scholar] [CrossRef]
- Kumar, N.; Kosse, V.; Oloyede, A. A new method to estimate effective elastic torsional compliance of single-stage Cycloidal. Mech. Mach. Theory 2016, 105, 185–198. [Google Scholar] [CrossRef]
- Chen, C.; Yang, Y. Structural Characteristics of Rotate Vector Reducer Free Vibration. J. Vibroeng. 2016, 18, 3089–3103. [Google Scholar] [CrossRef] [Green Version]
- Yang, Y.H.; Chen, C.; Wang, S.Y. Response sensitivity to design parameters of RV reducer. Chin. J. Mech. Eng. 2018, 31, 49. [Google Scholar] [CrossRef] [Green Version]
- Lin, T.C.; Schabacker, M.; Ho, Y.L.; Kuo, T.C.; Tsay, D.M. Geometric Design and Dynamic Analysis of a Compact Cam Reducer. Machines 2022, 10, 955. [Google Scholar] [CrossRef]
- Blagojević, M. Stress and Strain State of Cycloreducer’s Elements under Dynamic Loads. Ph.D. Thesis, University of Kragujevac, Faculty of Mechanical Engineering, Kragujevac, Serbia, 2008. [Google Scholar]
- Blagojevic, M.; Nikolic-Stanojevic, V.; Marjanovic, N.; Veljovic, L. Analysis of Cycloid Drive Dynamic Behavior. Sci. Tech. Rev. 2009, 59, 52–56. [Google Scholar]
- Blagojevic, M.; Marjanovic, N.; Djordjevic, Z.; Stojanovic, B.; Disic, A. A new design of a two-stage cycloidal speed reducer. J. Mech. Des. Trans. ASME 2011, 133, 085001. [Google Scholar] [CrossRef]
- Blagojevic, M.; Marjanovic, N.; Djordjevic, Z.; Stojanovic, B.; Marjanovic, V.; Vujanac, R.; Disic, A. Numerical and experimental analysis of the cycloid disc stress state. Teh. Vjesn. 2014, 21, 377–382. [Google Scholar]
- Blagojevic, M.; Matejic, M. Stress and strain state of cycloid gear under dynamic loads. Mach. Des. 2016, 8, 129–132. [Google Scholar]
- Blagojević, M.; Matejić, M.; Kostić, N. Dynamic behaviour of a two-stage cycloidal speed reducer of a new design concept. Teh. Vjesn. 2018, 25, 291–298. [Google Scholar] [CrossRef]
- Blagojevic, M.; Matejic, M.; Vasic, M. Comparative Overview of Calculation of Normal Force on Cycloidal Gear Tooth. In Proceedings of the International Congress Motor Vehicles & Motors—Conference Porceedings, Kragujevac, Serbia, 9 October 2020; University of Kragujevac, Faculty of Engineering: Kragujevac, Serbia, 2020; pp. 131–137. [Google Scholar]
- Blagojevic, M.; Kocic, M.; Marjanovic, N.; Stojanovic, B.; Dordevic, Z.; Ivanov; Marjanovic, V. Influence of the Friction on the Cycloidal Speed Reducer Efficeicncy. J. Balk. Tribol. Assoc. 2012, 18, 217–227. [Google Scholar]
- SHIMADZU Dynamic and Fatigue Testing Systems Your Partner for Dynamic and Fatigue Tests. Shimadzu Cat. 2021. Available online: https://www.ssi.shimadzu.com/products/materials-testing/fatigue-testing-impact-testing/index.html (accessed on 20 February 2023).
- HBM Strain Gauges: Absolute Precision from HBM. Straing Gauges Accessories Cat. 2014. Available online: https://www.straingauges.cl/images/blog/catalogo%20de%20strain%20gages.pdf (accessed on 15 January 2023).
- EN 10250-3:2000; Open Steel Die Forgings for General Engineering Purposes Alloy Special Steels. British Standards Institution: London, UK, 1999.


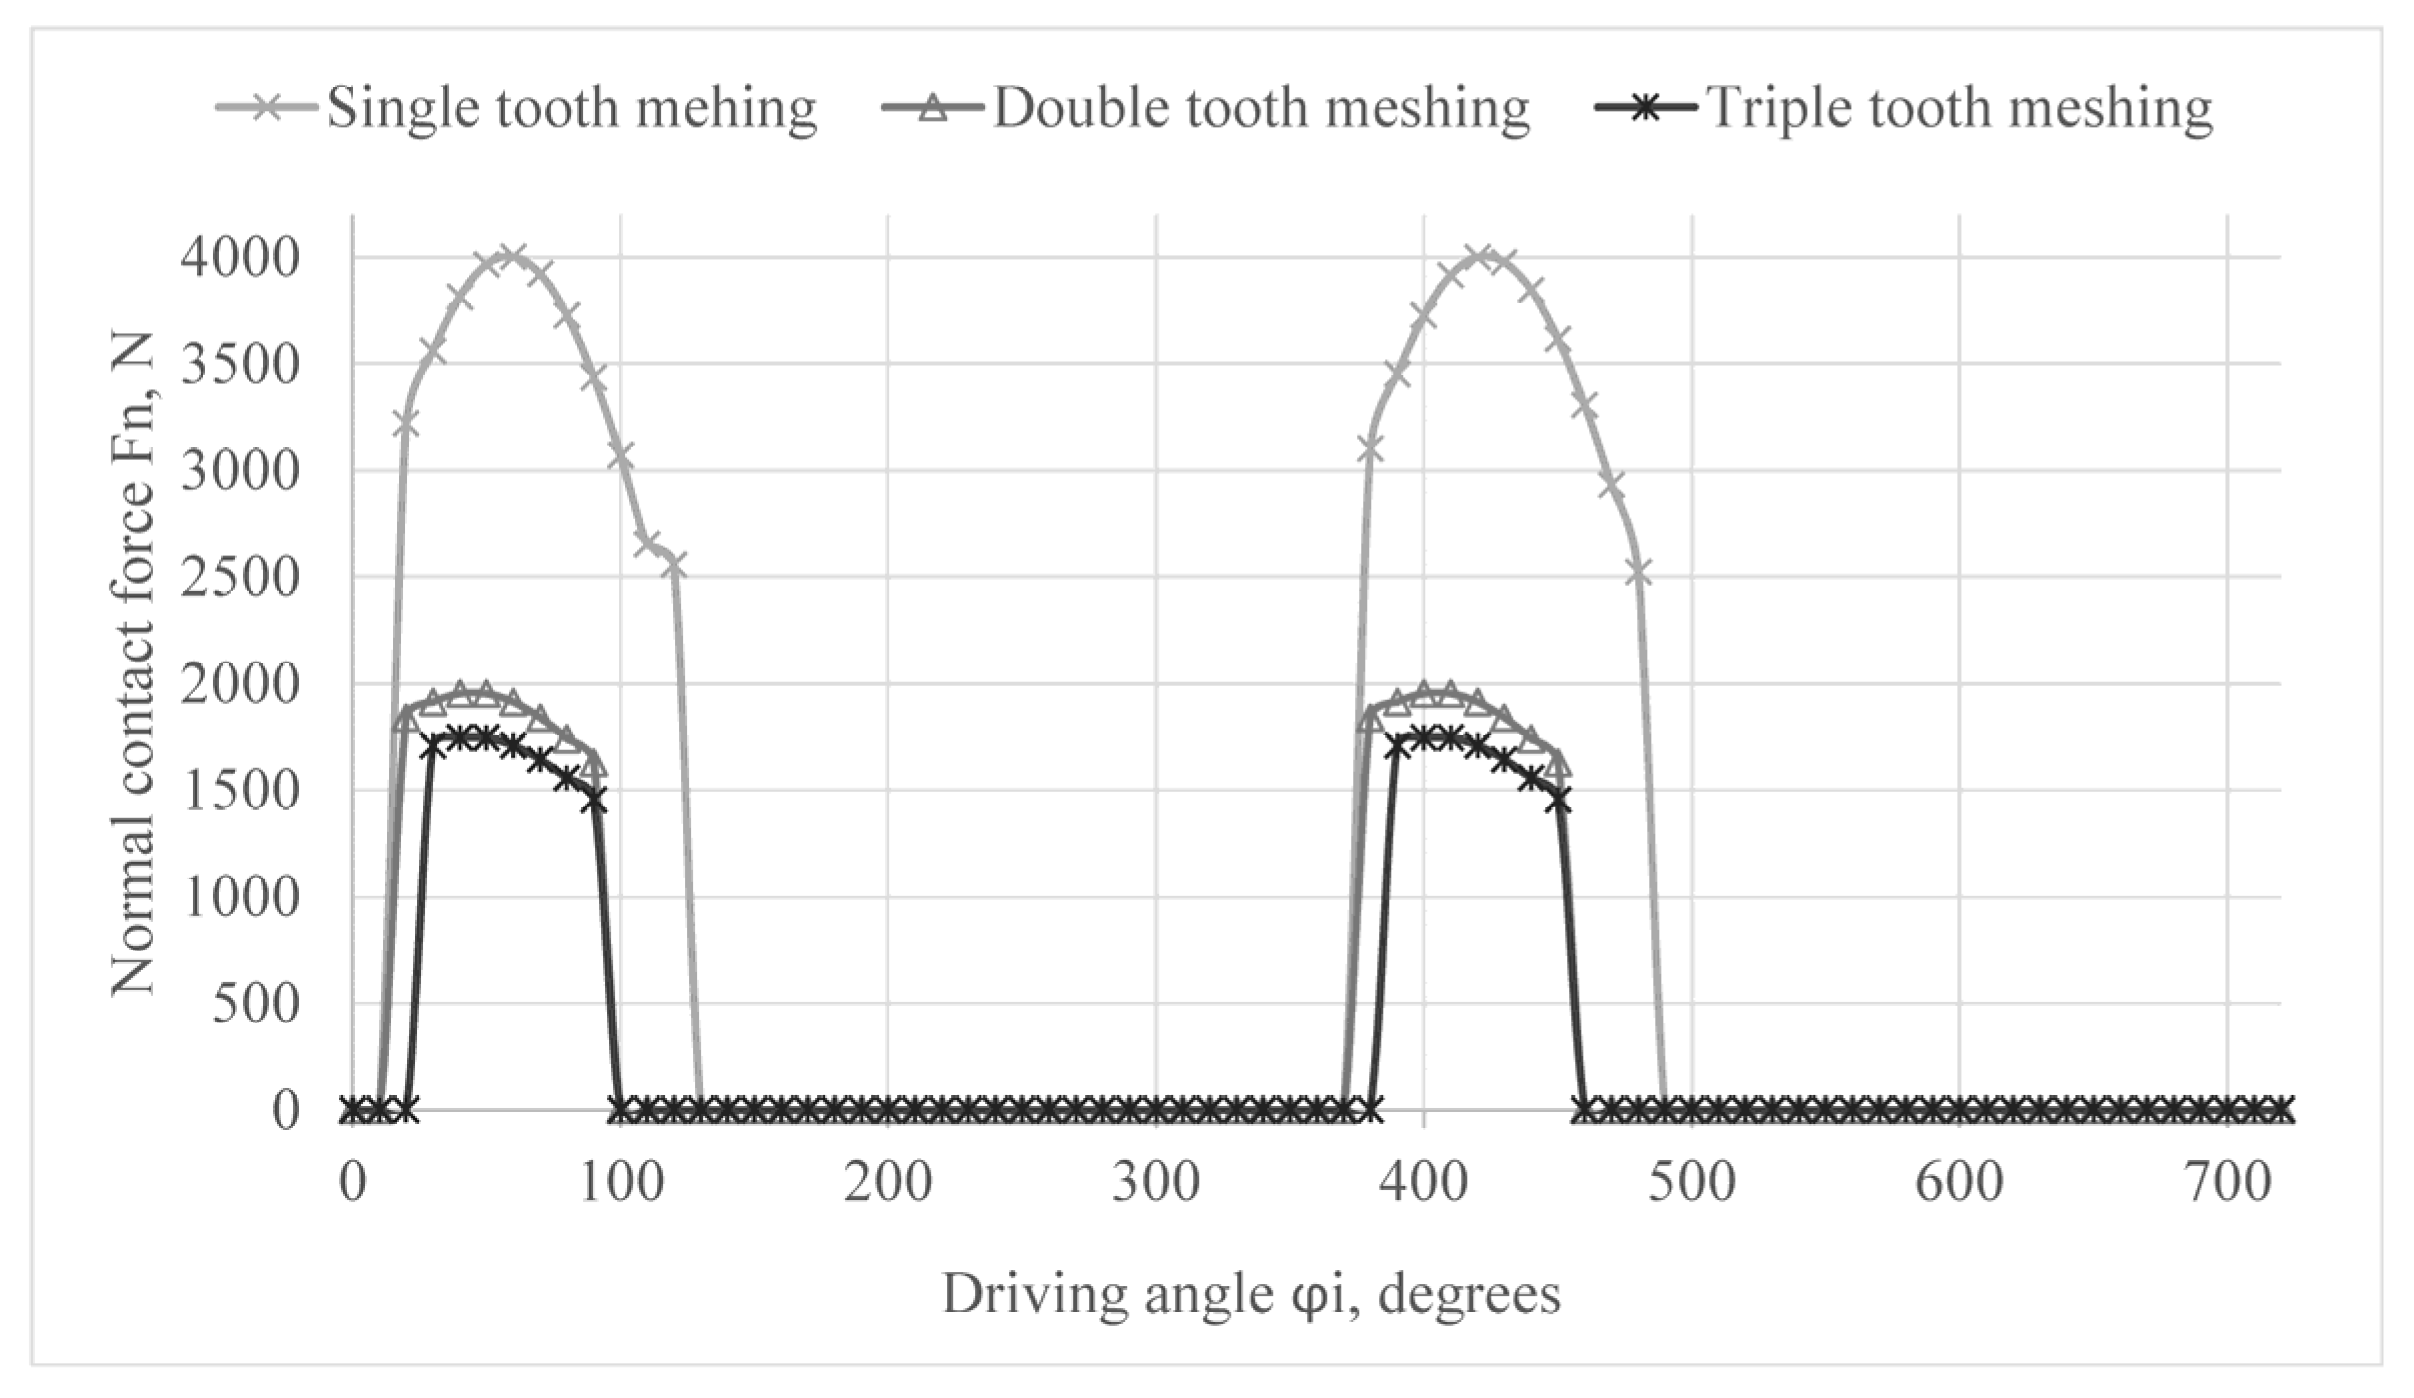
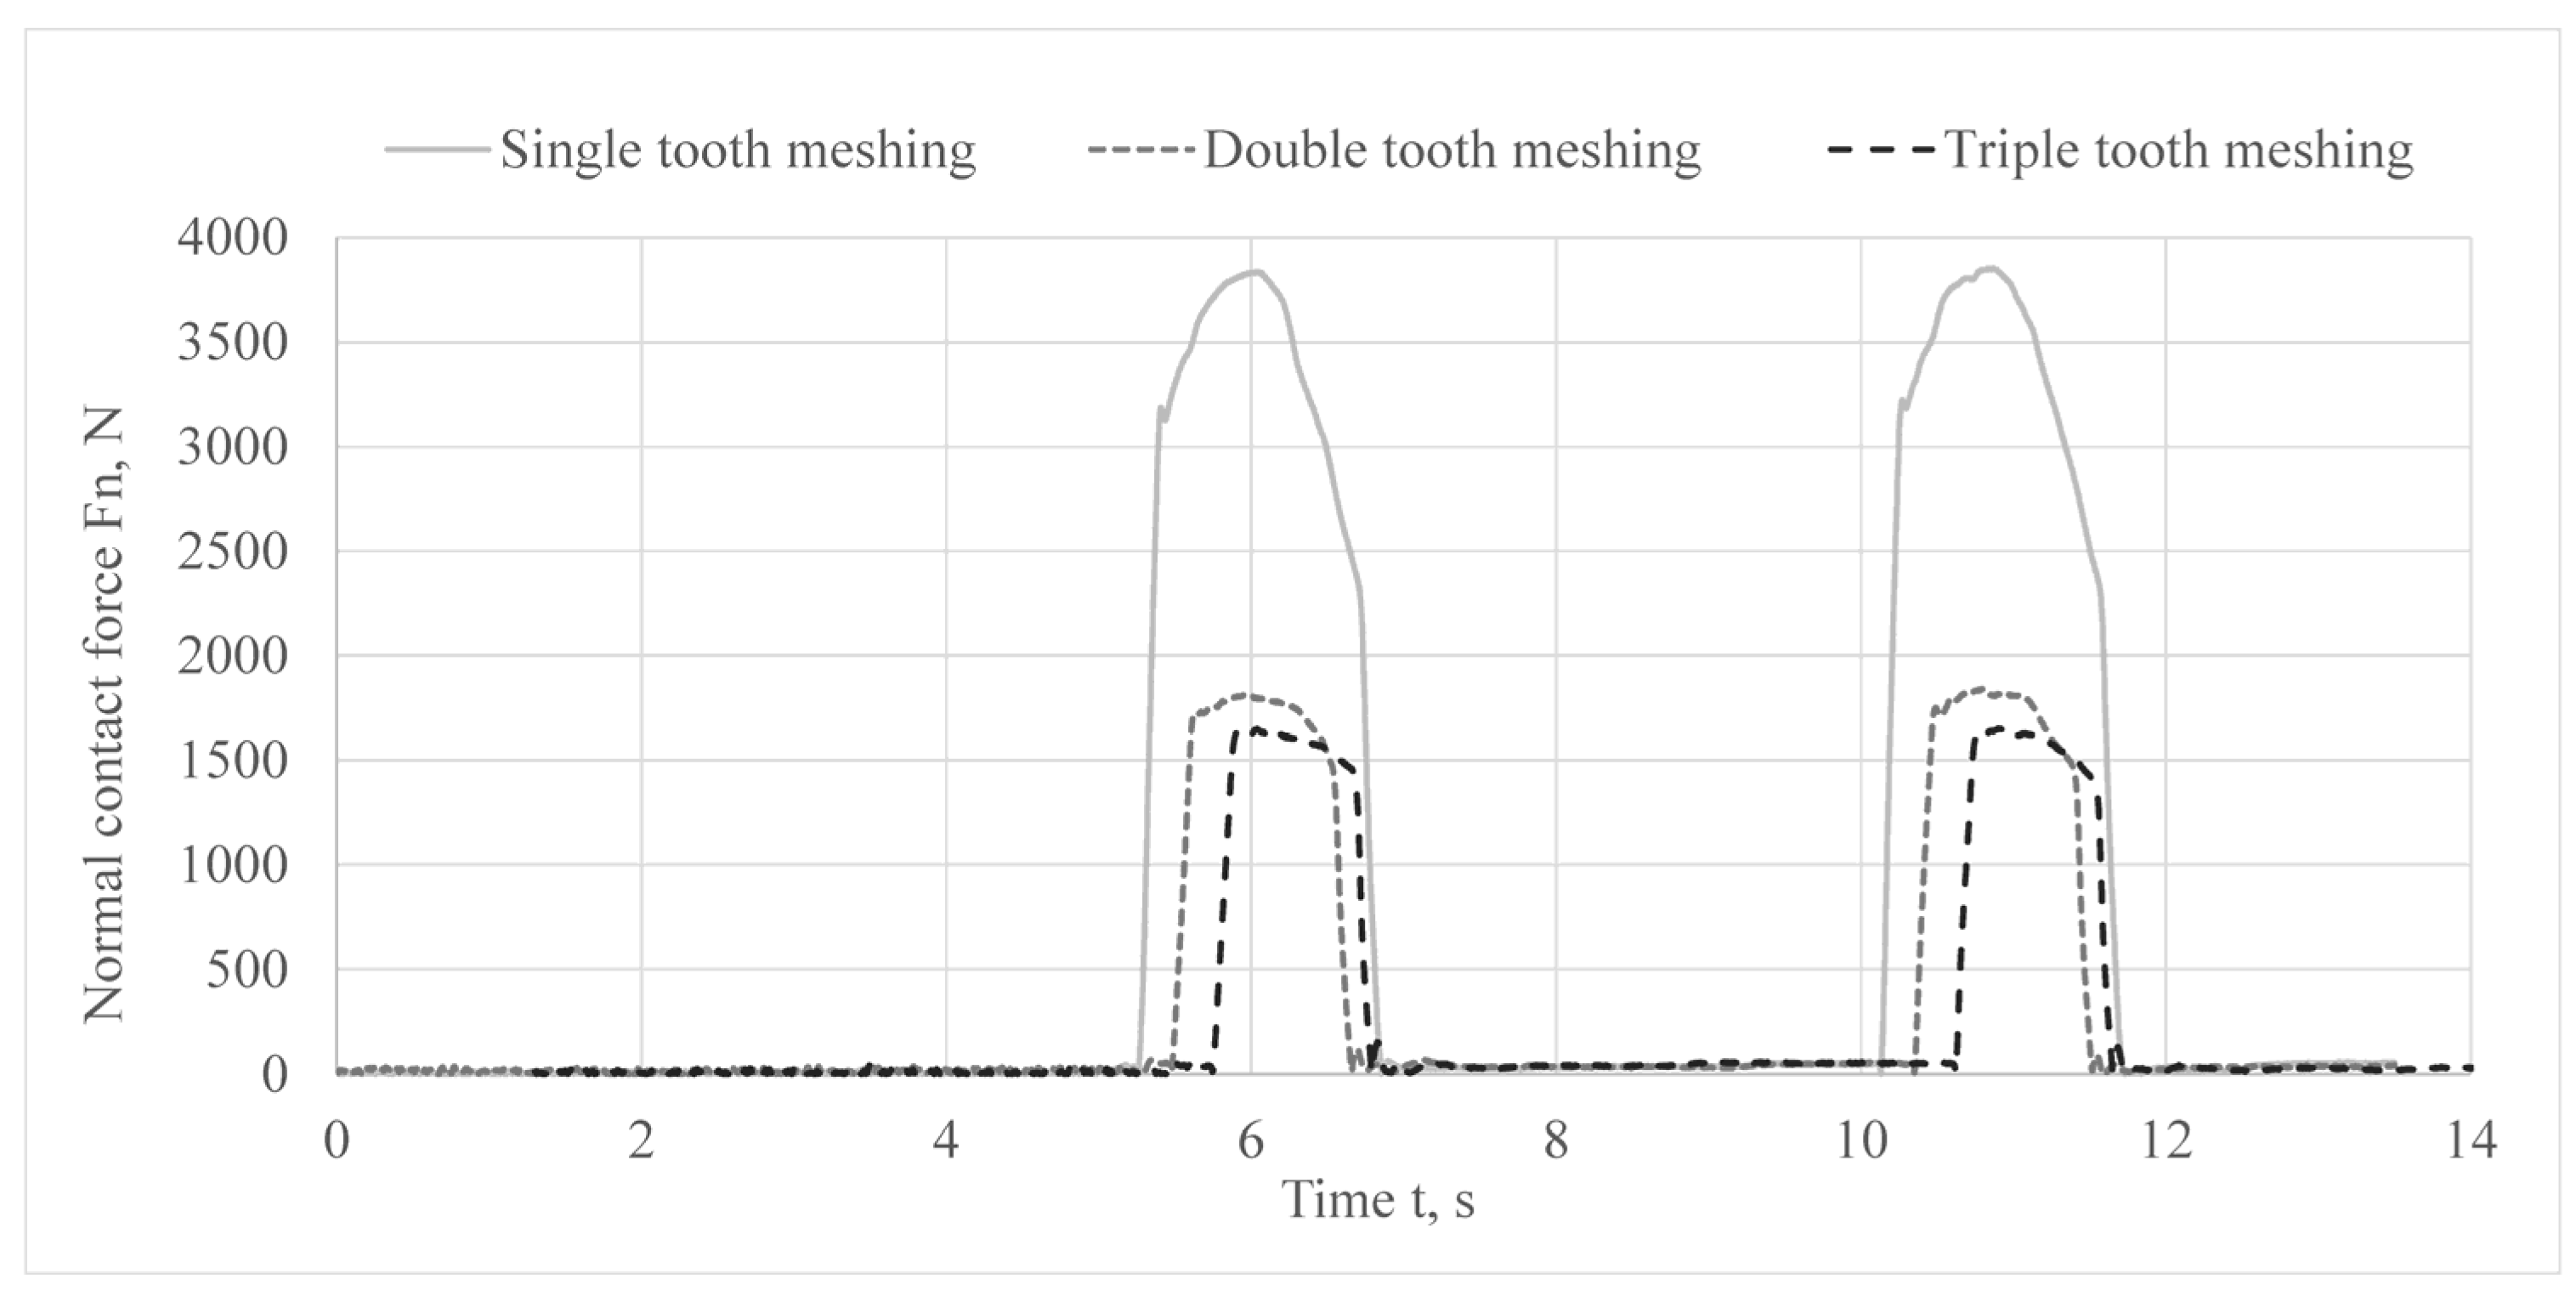
| Meshing Type | Approximate Function of the Normal Force for a Single Revolution of the Input Shaft | Flow, N | Famp, N |
|---|---|---|---|
| Single tooth meshing | [20,120] | 2387 | 1616.8 |
| Double tooth meshing | [20,90] | 1530 | 427.7 |
| Triple tooth meshing | [30,90] | 1456 | 293.9 |
| Meshing | Load 50% FNmax, N | Load 100% FNmax, N | Load 150% FNmax, N |
|---|---|---|---|
| Triple tooth | 872.5 | 1745 | 2617.5 |
| Double tooth | 975.5 | 1951 | 2926.5 |
| Single tooth | 2000.5 | 4001 | 6001.5 |
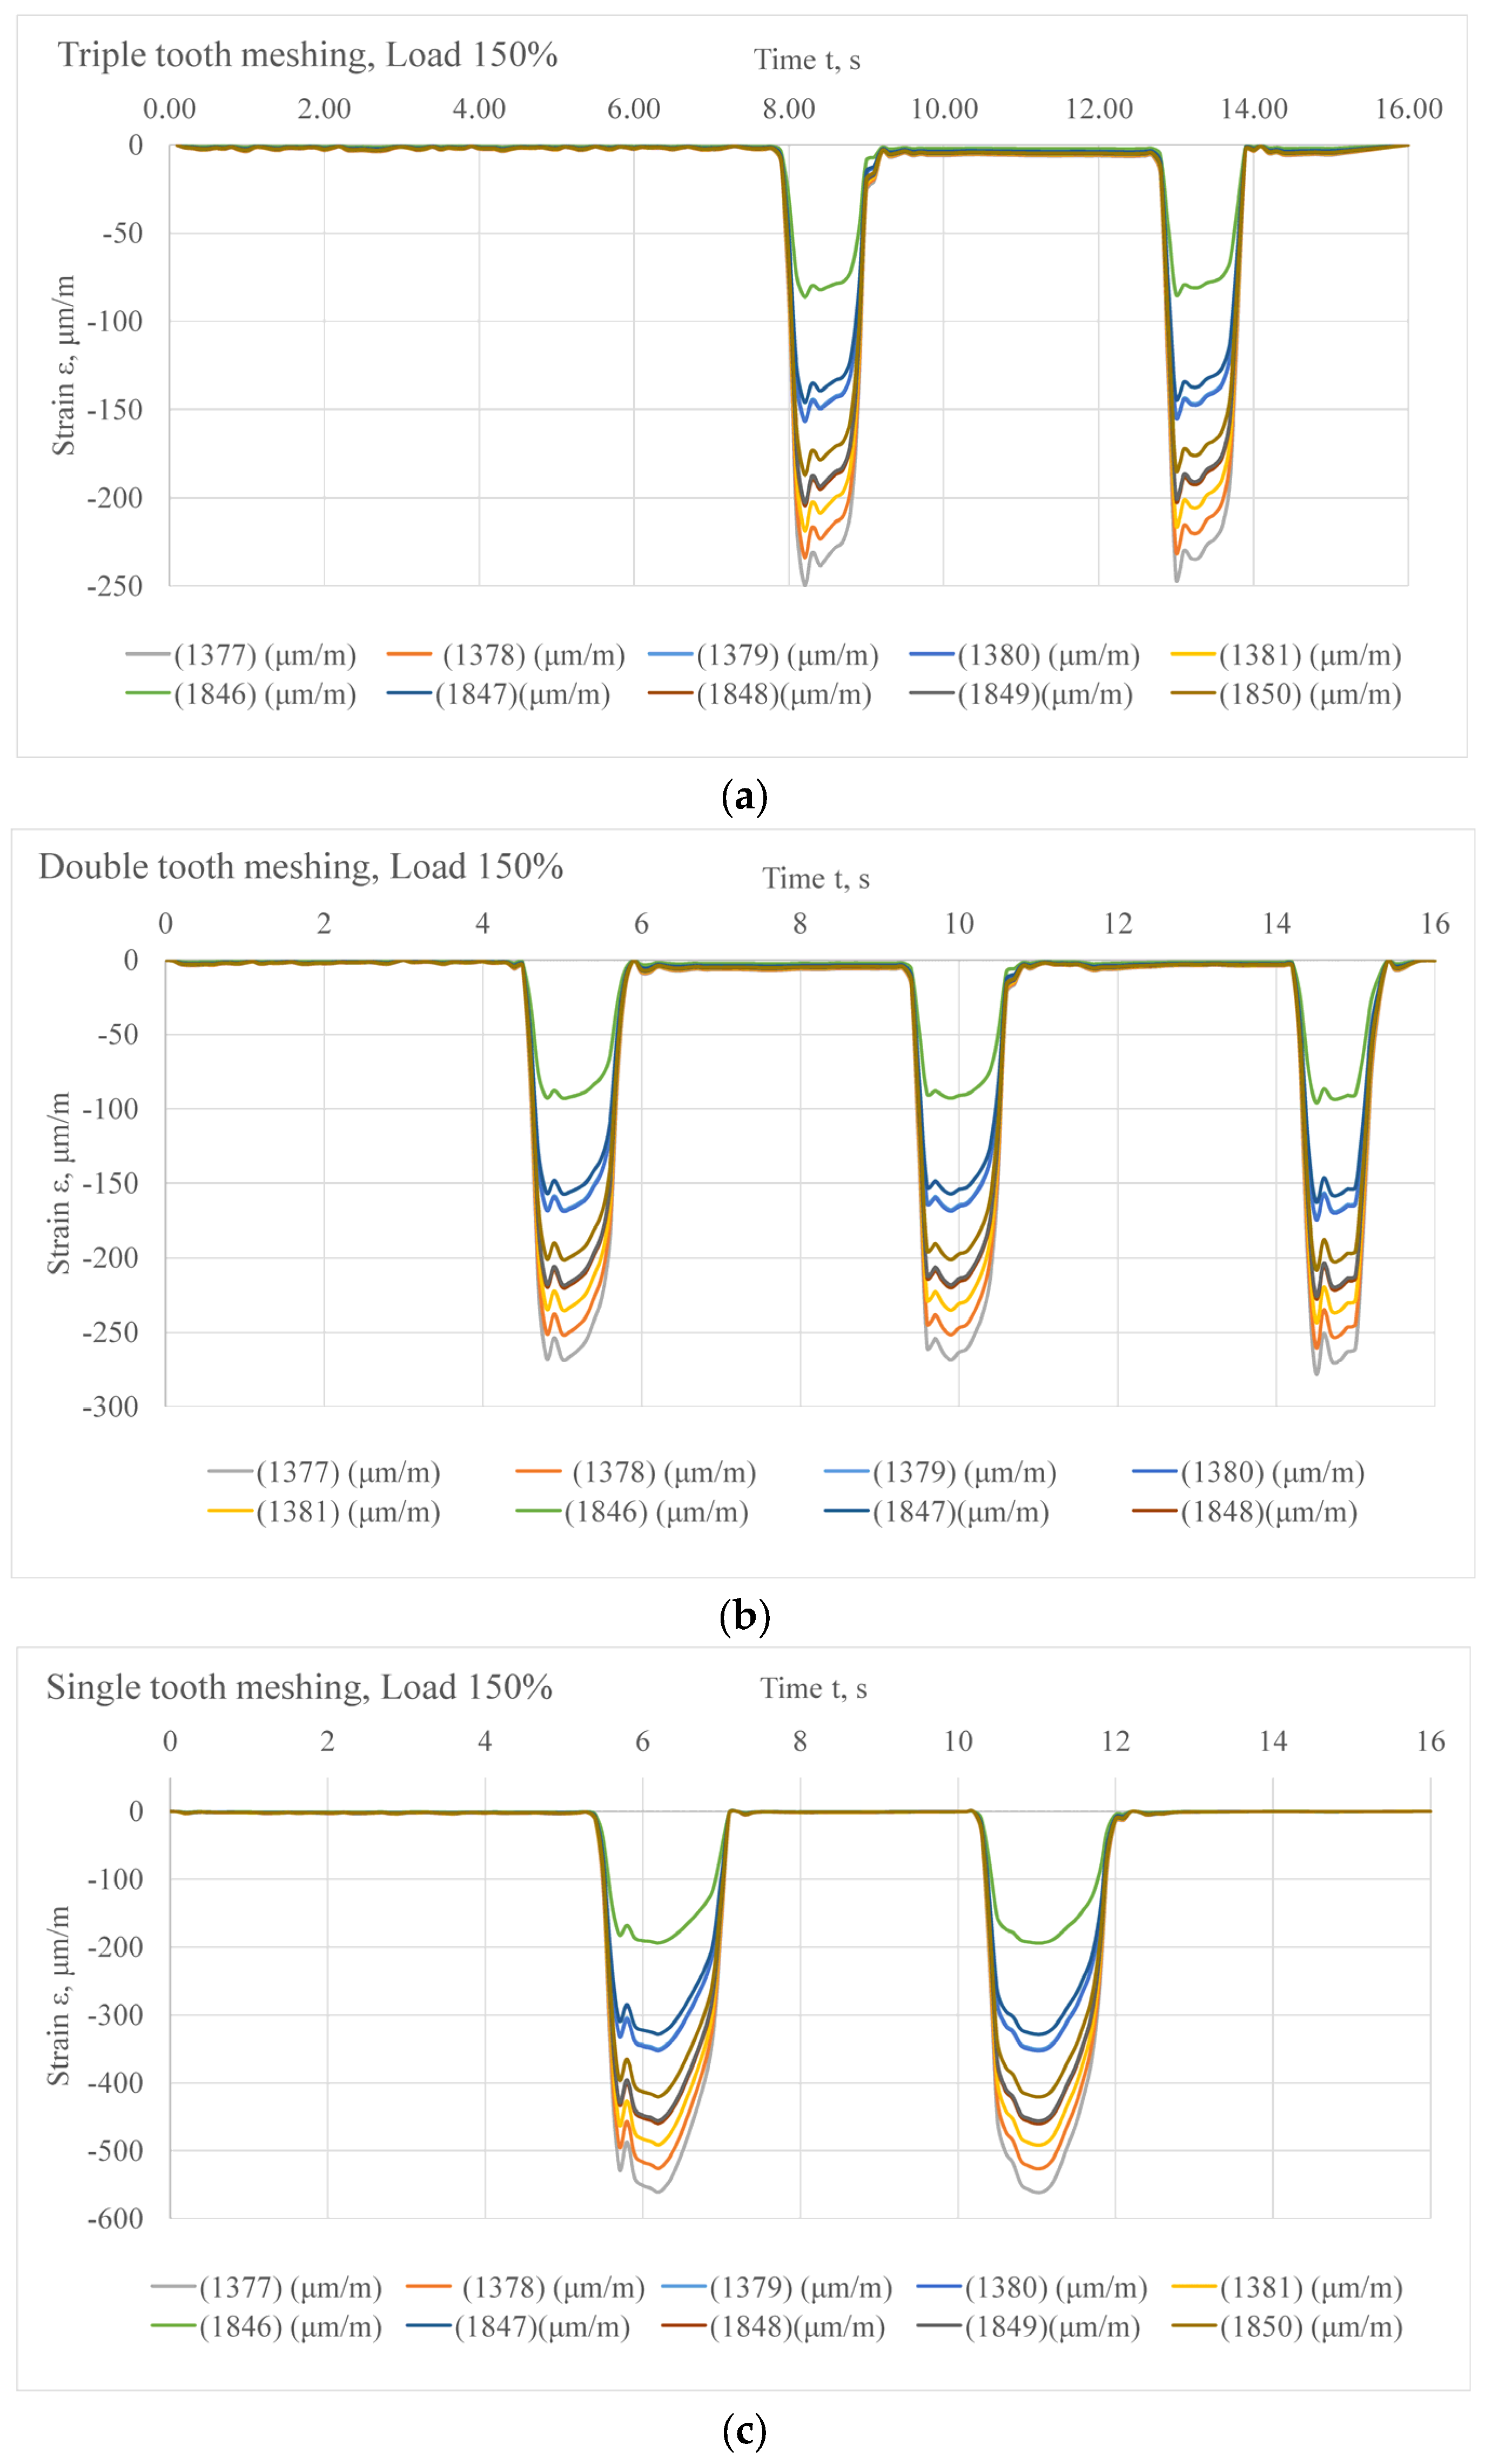
| Node Number | MT Number | Node Number | MT Number |
|---|---|---|---|
| Strain von Misses (1377) | MT1 | Strain von Misses (1846) | MT6 |
| Strain von Misses (1378) | MT2 | Strain von Misses (1847) | MT7 |
| Strain von Misses (1379) | MT3 | Strain von Misses (1848) | MT8 |
| Strain von Misses (1380) | MT4 | Strain von Misses (1849) | MT9 |
| Strain von Misses (1381) | MT5 | Strain von Misses (1850) | MT10 |
| Single-tooth meshing—Load 150% | ||||||||||
| MT1 | MT2 | MT3 | MT4 | MT5 | MT6 | MT7 | MT8 | MT9 | MT10 | |
| ε—ex., μm m−1 | 473.75 | 390.26 | 333.91 | 218.09 | 106.51 | 297.37 | 300.36 | 300.63 | 280.83 | 305.38 |
| σ—ex., MPa | 98.07 | 80.78 | 69.12 | 45.14 | 22.05 | 61.56 | 62.18 | 62.23 | 58.13 | 63.21 |
| ε—num.,μm m−1 | 561.52 | 526.12 | 491.68 | 352.50 | 350.36 | 193.95 | 328.17 | 459.80 | 455.71 | 420.51 |
| σ—num., MPa | 116.24 | 108.91 | 101.78 | 72.97 | 72.52 | 40.15 | 67.93 | 95.18 | 94.33 | 87.04 |
| Double-tooth meshing—Load 150% | ||||||||||
| MT1 | MT2 | MT3 | MT4 | MT5 | MT6 | MT7 | MT8 | MT9 | MT10 | |
| ε—ex., μm m−1 | 276.69 | 230.16 | 196.74 | 128.87 | 63.27 | 174.69 | 175.92 | 174.99 | 162.58 | 176.74 |
| σ—ex., MPa | 57.28 | 47.64 | 40.73 | 26.68 | 13.10 | 36.16 | 36.42 | 36.22 | 33.65 | 36.59 |
| ε—num.,μm m−1 | 277.21 | 259.73 | 242.73 | 174.02 | 172.96 | 95.75 | 162.01 | 226.99 | 224.97 | 207.59 |
| σ—num., MPa | 57.38 | 53.76 | 50.25 | 36.02 | 35.80 | 19.82 | 33.54 | 46.99 | 46.57 | 42.97 |
| Triple-tooth meshing—Load 150% | ||||||||||
| MT1 | MT2 | MT3 | MT4 | MT5 | MT6 | MT7 | MT8 | MT9 | MT10 | |
| ε—ex., μm m−1 | 247.28 | 206.24 | 176.15 | 114.69 | 56.69 | 156.37 | 156.53 | 156.46 | 145.70 | 157.98 |
| σ—ex., MPa | 51.19 | 42.69 | 36.46 | 23.74 | 11.73 | 32.37 | 32.40 | 32.39 | 30.16 | 32.70 |
| ε—num.,μm m−1 | 249.47 | 233.74 | 218.45 | 156.61 | 155.66 | 86.17 | 145.80 | 204.28 | 202.47 | 186.82 |
| σ—num., MPa | 51.64 | 48.39 | 45.22 | 32.42 | 32.22 | 17.84 | 30.18 | 42.29 | 41.91 | 38.67 |
Disclaimer/Publisher’s Note: The statements, opinions and data contained in all publications are solely those of the individual author(s) and contributor(s) and not of MDPI and/or the editor(s). MDPI and/or the editor(s) disclaim responsibility for any injury to people or property resulting from any ideas, methods, instructions or products referred to in the content. |
© 2023 by the authors. Licensee MDPI, Basel, Switzerland. This article is an open access article distributed under the terms and conditions of the Creative Commons Attribution (CC BY) license (https://creativecommons.org/licenses/by/4.0/).
Share and Cite
Matejic, M.; Blagojevic, M.; Disic, A.; Matejic, M.; Milovanovic, V.; Miletic, I. A Dynamic Analysis of the Cycloid Disc Stress-Strain State. Appl. Sci. 2023, 13, 4390. https://doi.org/10.3390/app13074390
Matejic M, Blagojevic M, Disic A, Matejic M, Milovanovic V, Miletic I. A Dynamic Analysis of the Cycloid Disc Stress-Strain State. Applied Sciences. 2023; 13(7):4390. https://doi.org/10.3390/app13074390
Chicago/Turabian StyleMatejic, Milos, Mirko Blagojevic, Aleksandar Disic, Marija Matejic, Vladimir Milovanovic, and Ivan Miletic. 2023. "A Dynamic Analysis of the Cycloid Disc Stress-Strain State" Applied Sciences 13, no. 7: 4390. https://doi.org/10.3390/app13074390