1. Introduction
The increase in energy demand was driven by economic recovery after the pandemic lockdown and several occasions of extreme weather events [
1]. Of various energy sources, natural gas is still the preferred energy source, displaying the highest portion of 36% of total energy production and energy consumption [
2]. Natural gas pipelines are a crucial component of the general energy infrastructure as they supply natural gas from upstream sectors to downstream consumers, and the reliability and safety of these pipelines are essential [
3]. Currently, many pipelines in the United States (U.S.) are often operated near capacity due to the increase in demand and global population in general. Therefore, they are occasionally subjected to structural or nonstructural failures when this demand coupled with extreme environmental conditions [
4]. Understanding the causes of pipeline failures and the impact of the incidents is essential for preventing the occurrence of future incidents [
5]. Based on past incidents in 2022, failures of pipeline infrastructure in the United States were commonly caused by corrosion (18%), material/weld/equipment failure (35%), excavation damage (18%), incorrect operation (8%), other outside force damage (5%), natural force damage (3%), and other causes due to harsh climatic and operational conditions [
6]. Gas pipeline failures can also potentially result in more severe operator injuries, including fatalities and other substantial economic losses. Thus, pipeline structural health monitoring and modeling are crucial for avoiding these undesirable adverse effects caused by incidents of pipeline failure [
7,
8].
Various fields of research aim to enhance pipeline reliability and safety from physical, operational, and environmental perspectives. Efforts to improve physical characteristics involve analyzing material structures and understanding the complex physical phenomena that lead to failure. For example, Lecuyer and Rice (2017) computed natural gas losses from damaged pipelines from a complex physics phenomena approach, using a combination of analytical discharge equations and computational fluid dynamics modeling software [
9]. Ozdemir et al. (2011) presented a numerical prediction model for pipeline response to vibration induced by ground activities, such as earthquakes, construction, traffic, explosions, or industrial activities [
10], in addition to corrosion, which has been found to be another important cause inducing pipeline failure [
11,
12].
The pipeline damage risk is not only caused by physical phenomena such as internal and external corrosion. Since the pipeline infrastructure is spatially extensive, the location and the weather conditions at that location may influence the risk of pipeline damage. Azari and Karimi (2018) proposed a quantitative risk-based model to analyze the spatial patterns risk of urban natural gas pipelines [
13]. Cobanoglu et al. (2016) studied a pipeline network’s trend in reliability due to internal and external corrosion using the Homogeneous Poisson Process (HPP) and Non-Homogeneous Poisson Process (NHPP) stochastic models [
3]. Their results showed the two most significant failure characteristics were the age in decades of installation and previous failures [
3]. With the current demanding pipeline operating conditions and the reliability of most pipeline infrastructure perpetually declining, pipelines require regular maintenance to ensure they are operating safely and efficiently. This can be challenging in remote areas where access is limited or in harsh environments where weather conditions are extreme. Thus, pipeline operation should emphasize seeking a balance between the increasing operational demand, aging infrastructure, and the occasional effects of extreme weather conditions.
With sensor advancements, data collection has become more accessible, enabling data-driven analysis with machine learning, artificial intelligence, or big data. This has advanced pipeline analysis with various data sources [
7]. Some examples of the application of database or data-driven algorithms in pipeline assessment are as follows. Iesmantas and Alzbutas (2016) developed a criteria-dependent Poisson model as a quantitative integration method for various pipeline databases to improve pipeline reliability [
14]. Seghier et al. (2020) developed a hybrid AI model for the prediction of stress intensity factors [
15]. The continuation of work from Seghier et al. (2021) compared various AI models (artificial neural network, M5 tree, multivariate adaptive regression splines, locally weighted polynomials, kriging, and extreme learning machines) for predicting the maximum pitting corrosion depth in oil and gas pipelines [
16]. Li et al. (2021) fused a spatiotemporal modeling approach with text mining to analyze the emergency severity in the natural gas distribution pipeline [
17]. Popescu and Gabor (2021) analyzed pipeline incidents from a statistical perspective by determining a hierarchy for the causes of the incident, assigning weights for the effect posed by the incidents and establishing correlations between various parameters [
18]. Naik and Kiran (2018) performed data mining on the last 21 years of pipeline accident data from the United States and found that pipeline accidents due to natural force damage increase during the winter season [
19].
Natural force damage is often referred to as outside force damage, which includes incidents caused by acts of nature such as earth movement, heavy rains, high winds, and extreme hot or cold temperatures [
20]. Fluctuations in temperature can cause physical changes in materials, such as expansion and contraction, which can impact the integrity of pipelines. Although only a small percentage, approximately 3% of the overall pipeline incidents, were caused by natural forces in 2022 [
6], their effect is often debilitating and may cause catastrophic failure across the energy industry [
21]. The study presented in this paper aims to address the critical need to accurately forecast the natural force failure causes that impact natural gas pipelines. By incorporating comprehensive data on climate change into the analysis of pipeline incidents, this research represents a significant advancement in our ability to predict and mitigate the effects of natural force failures on pipeline infrastructure. This study leverages cutting-edge data-driven analysis and sophisticated artificial intelligence (AI) or machine learning algorithms to provide actionable insights into the potential impact of natural force failure on pipeline infrastructure.
AI algorithms can be used to predict pipeline damage caused by natural forces by analyzing various features such as pipeline characteristics, environmental conditions, and geographical location [
22]. By analyzing these factors, AI algorithms can identify patterns and correlations that humans may not be able to detect, allowing for more accurate predictions of pipeline damage. Additionally, AI can be used to optimize pipeline maintenance schedules by predicting when and where pipeline damage is most likely to occur, allowing for proactive maintenance and potentially reducing the likelihood of damage occurring in the first place [
23]. Finally, AI approaches can also be used to monitor pipelines in real time, identifying potential damage as soon as it occurs and alerting operators to take appropriate action.
Although not all of the above-mentioned factors will be addressed in this paper, the main contributions of this paper include: (1) the proposed approach of incorporating climate change data into pipeline incident data, using artificial intelligence algorithms to predict pipeline failures caused by natural forces, (2) the high prediction accuracy achieved by the proposed model for natural gas pipeline damage caused by natural forces, and (3) the emphasis on the importance of enhancing the understanding of the complex interactions between climate change and pipeline infrastructure monitoring and maintenance. By improving our ability to anticipate and respond to natural-force-related failures, this research holds the promise of minimizing environmental damage, reducing infrastructure downtime, and increasing public safety. The rest of this paper is organized as follows:
Section 2 details the proposed methodology, including the data collection, data pre-processing, and model selection of the machine learning algorithm, and
Section 3 demonstrates the effectiveness of the proposed method by elaborating on the results obtained from the pipeline incidents analysis. Other discussions for the proposed methodology are detailed in
Section 4, and the conclusions are summarized in
Section 5.
2. Methodology
Natural gas pipeline failures caused by natural forces such as landslides, earthquakes, and floods can have severe consequences on pipeline operators, nearby communities, and the environment. These incidents can lead to major disruptions in the supply of natural gas, property damage, injuries, and even fatalities. Moreover, predicting these incidents is challenging due to the complexity of the underlying factors involved. Therefore, there is a need to develop a natural force damage modeling framework to classify the causes of natural force damage to pipelines in the U.S.
The proposed methodology involves collecting a dataset of pipeline incident data points and a corresponding dataset of climate change data points. These datasets contain various features related to pipeline failure, including location, time, pipeline age, pipeline material, temperature, humidity, and wind speed. The pipeline incident data undergoes pre-processing, feature selection, and descriptive statistical analysis. Supervised machine learning algorithms are utilized using the scikit-learn software machine learning library for the Python ecosystem [
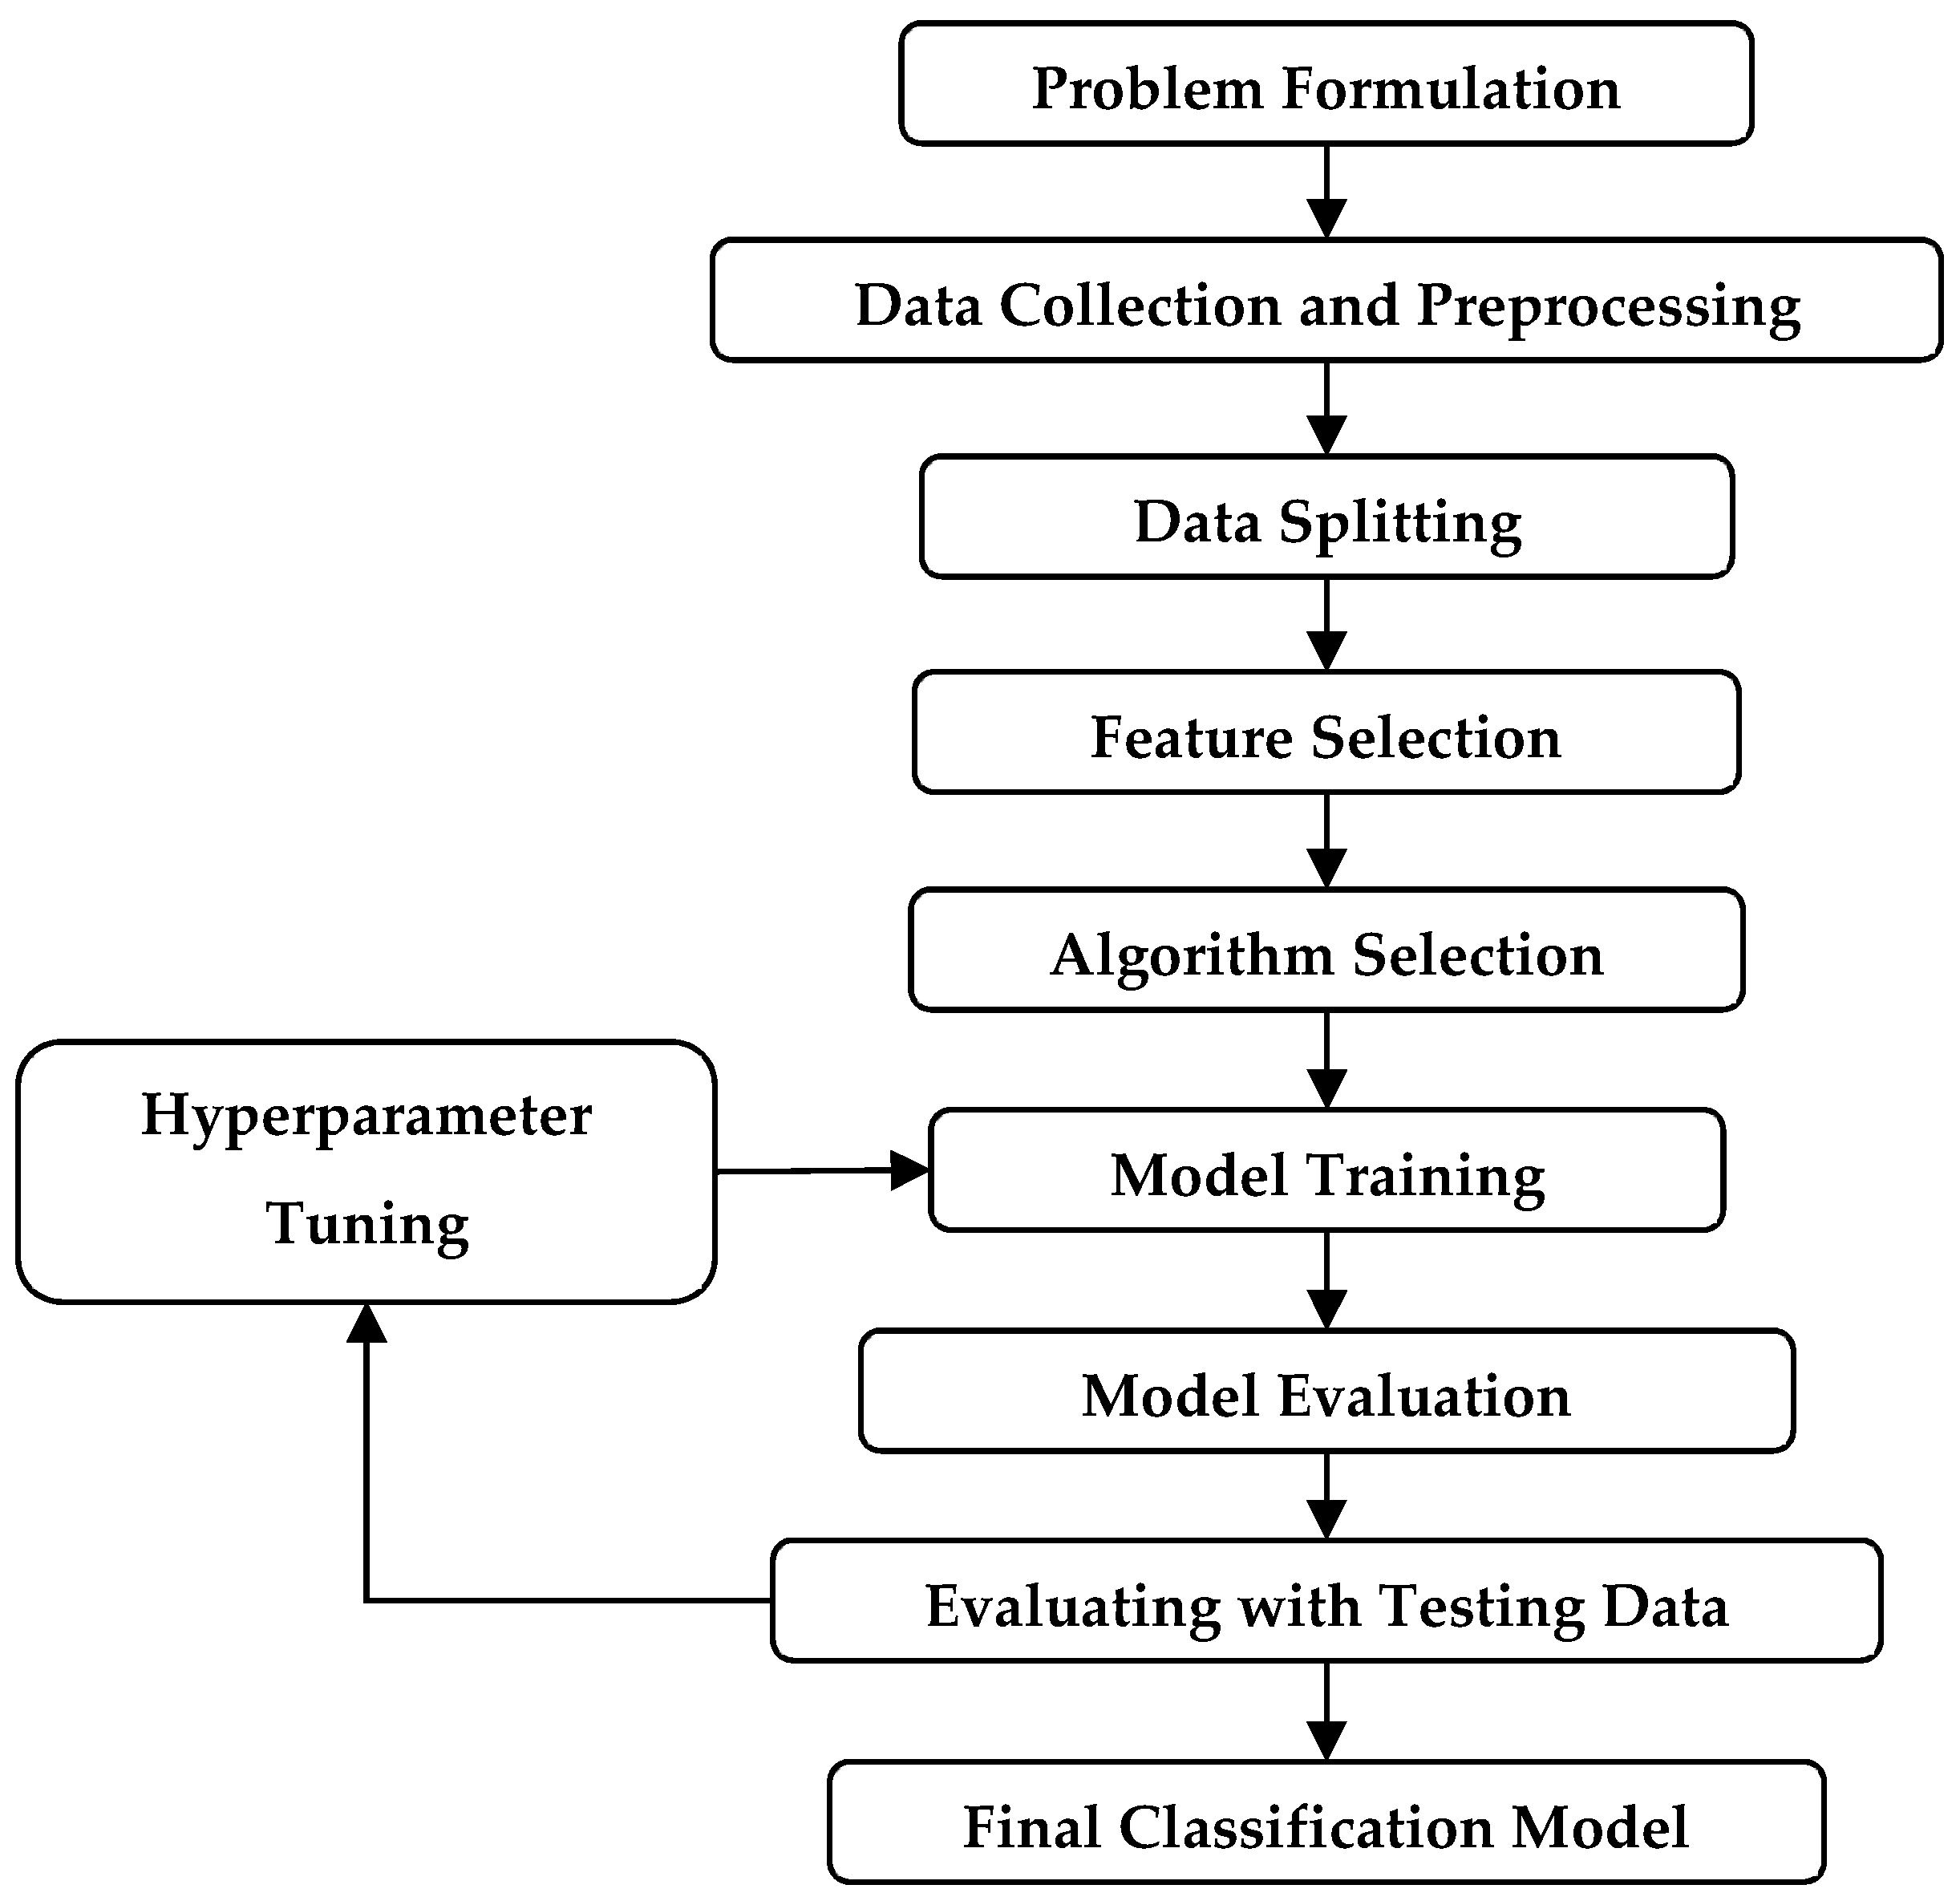
24]. The algorithms used in this study include the k-nearest neighbors (KNN), multilayer perceptron neural network (MLPNN), random forest, multiclass support vector machine (multiclass SVM), and extra gradient boosting classifier (XGBoost). These algorithms are widely used in supervised learning applications. The model is trained on a subset of the collected dataset, and its accuracy is evaluated by comparing the predicted outcomes with actual outcomes from a testing set. If necessary, adjustments are made to the model to ensure accurate predictions. Finally, the model is integrated into a production pipeline that inputs pipeline incident data and climate change data and outputs the probability of natural gas pipeline failures caused by natural forces.
The proposed AI algorithm shown in
Figure 1, is expected to contribute to preventing future incidents and minimizing the catastrophic losses associated with natural gas pipeline failures caused by natural forces. By predicting the likelihood of pipeline failures, the algorithm will help operators take proactive measures to address potential issues before they become critical. Additionally, the algorithm will enable regulators to make more informed decisions on safety regulations, thereby improving safety for both operators and the public. In short, the proposed natural force damage modeling framework, which uses machine learning algorithms, can accurately predict the likelihood of natural gas pipeline failures caused by natural forces. This framework will aid in proactive measures to prevent pipeline failures, minimize catastrophic losses, and improve safety for both operators and the public.
2.1. Data Description
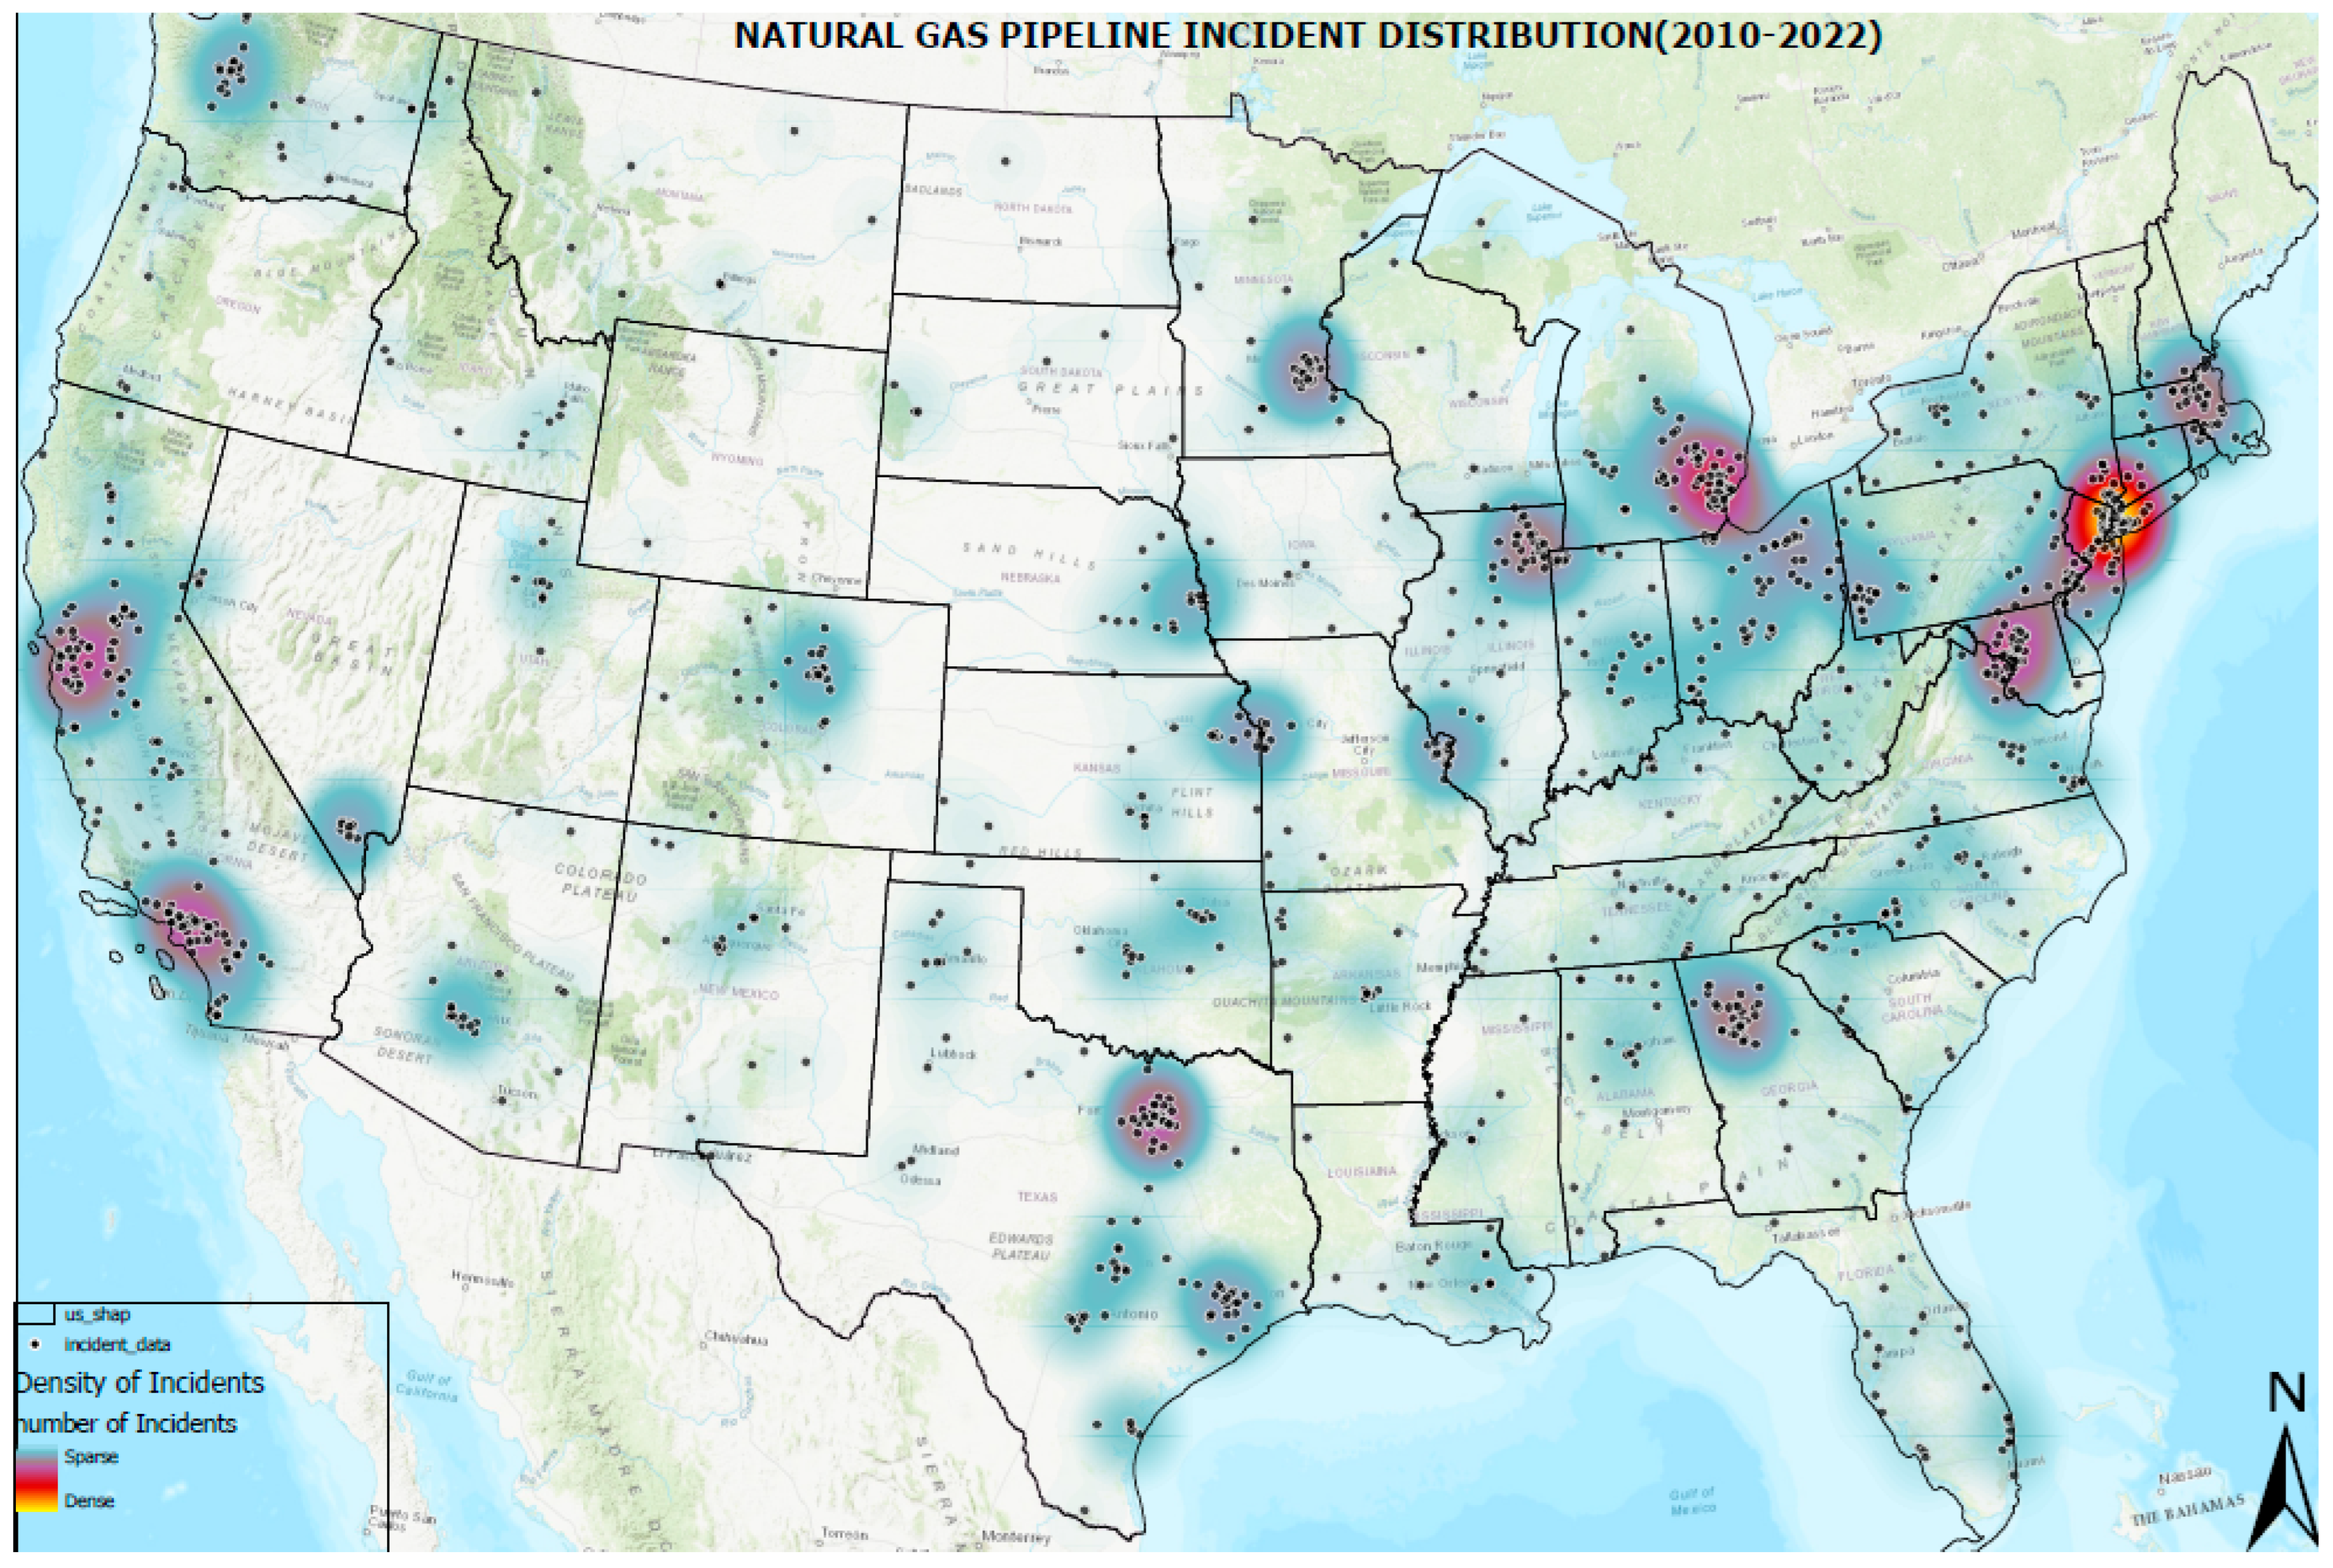
In this study, data on pipeline incidents were obtained from publicly available sources provided by the Pipeline and Hazardous Material Safety Administration (PHMSA), a division of the United States Department of Transportation. The data pertained to incidents involving natural gas transmission pipelines and spanned from 2010 to 2022, yielding 1321 data points across the U.S., as shown in
Figure 2. Various causes can induce natural gas pipeline incidents such as excavation, incorrect operation, corrosion, material failure, and natural forces. Among these different causes, natural force incidents can significantly impact pipeline infrastructure, causing pipeline damage and failure. Natural forces, such as landslides, earthquakes, floods, and hurricanes, can lead to pipeline failure, resulting in environmental damage, injury, and even loss of life. The economic impact of pipeline damage caused by natural forces can also be substantial, with costs associated with repair, cleanup, and the potential loss of revenue due to service interruptions. Therefore, understanding the impact of natural force incidents on pipeline infrastructure is crucial for ensuring pipeline safety and resiliency in climate-change-induced extreme weather events [
4].
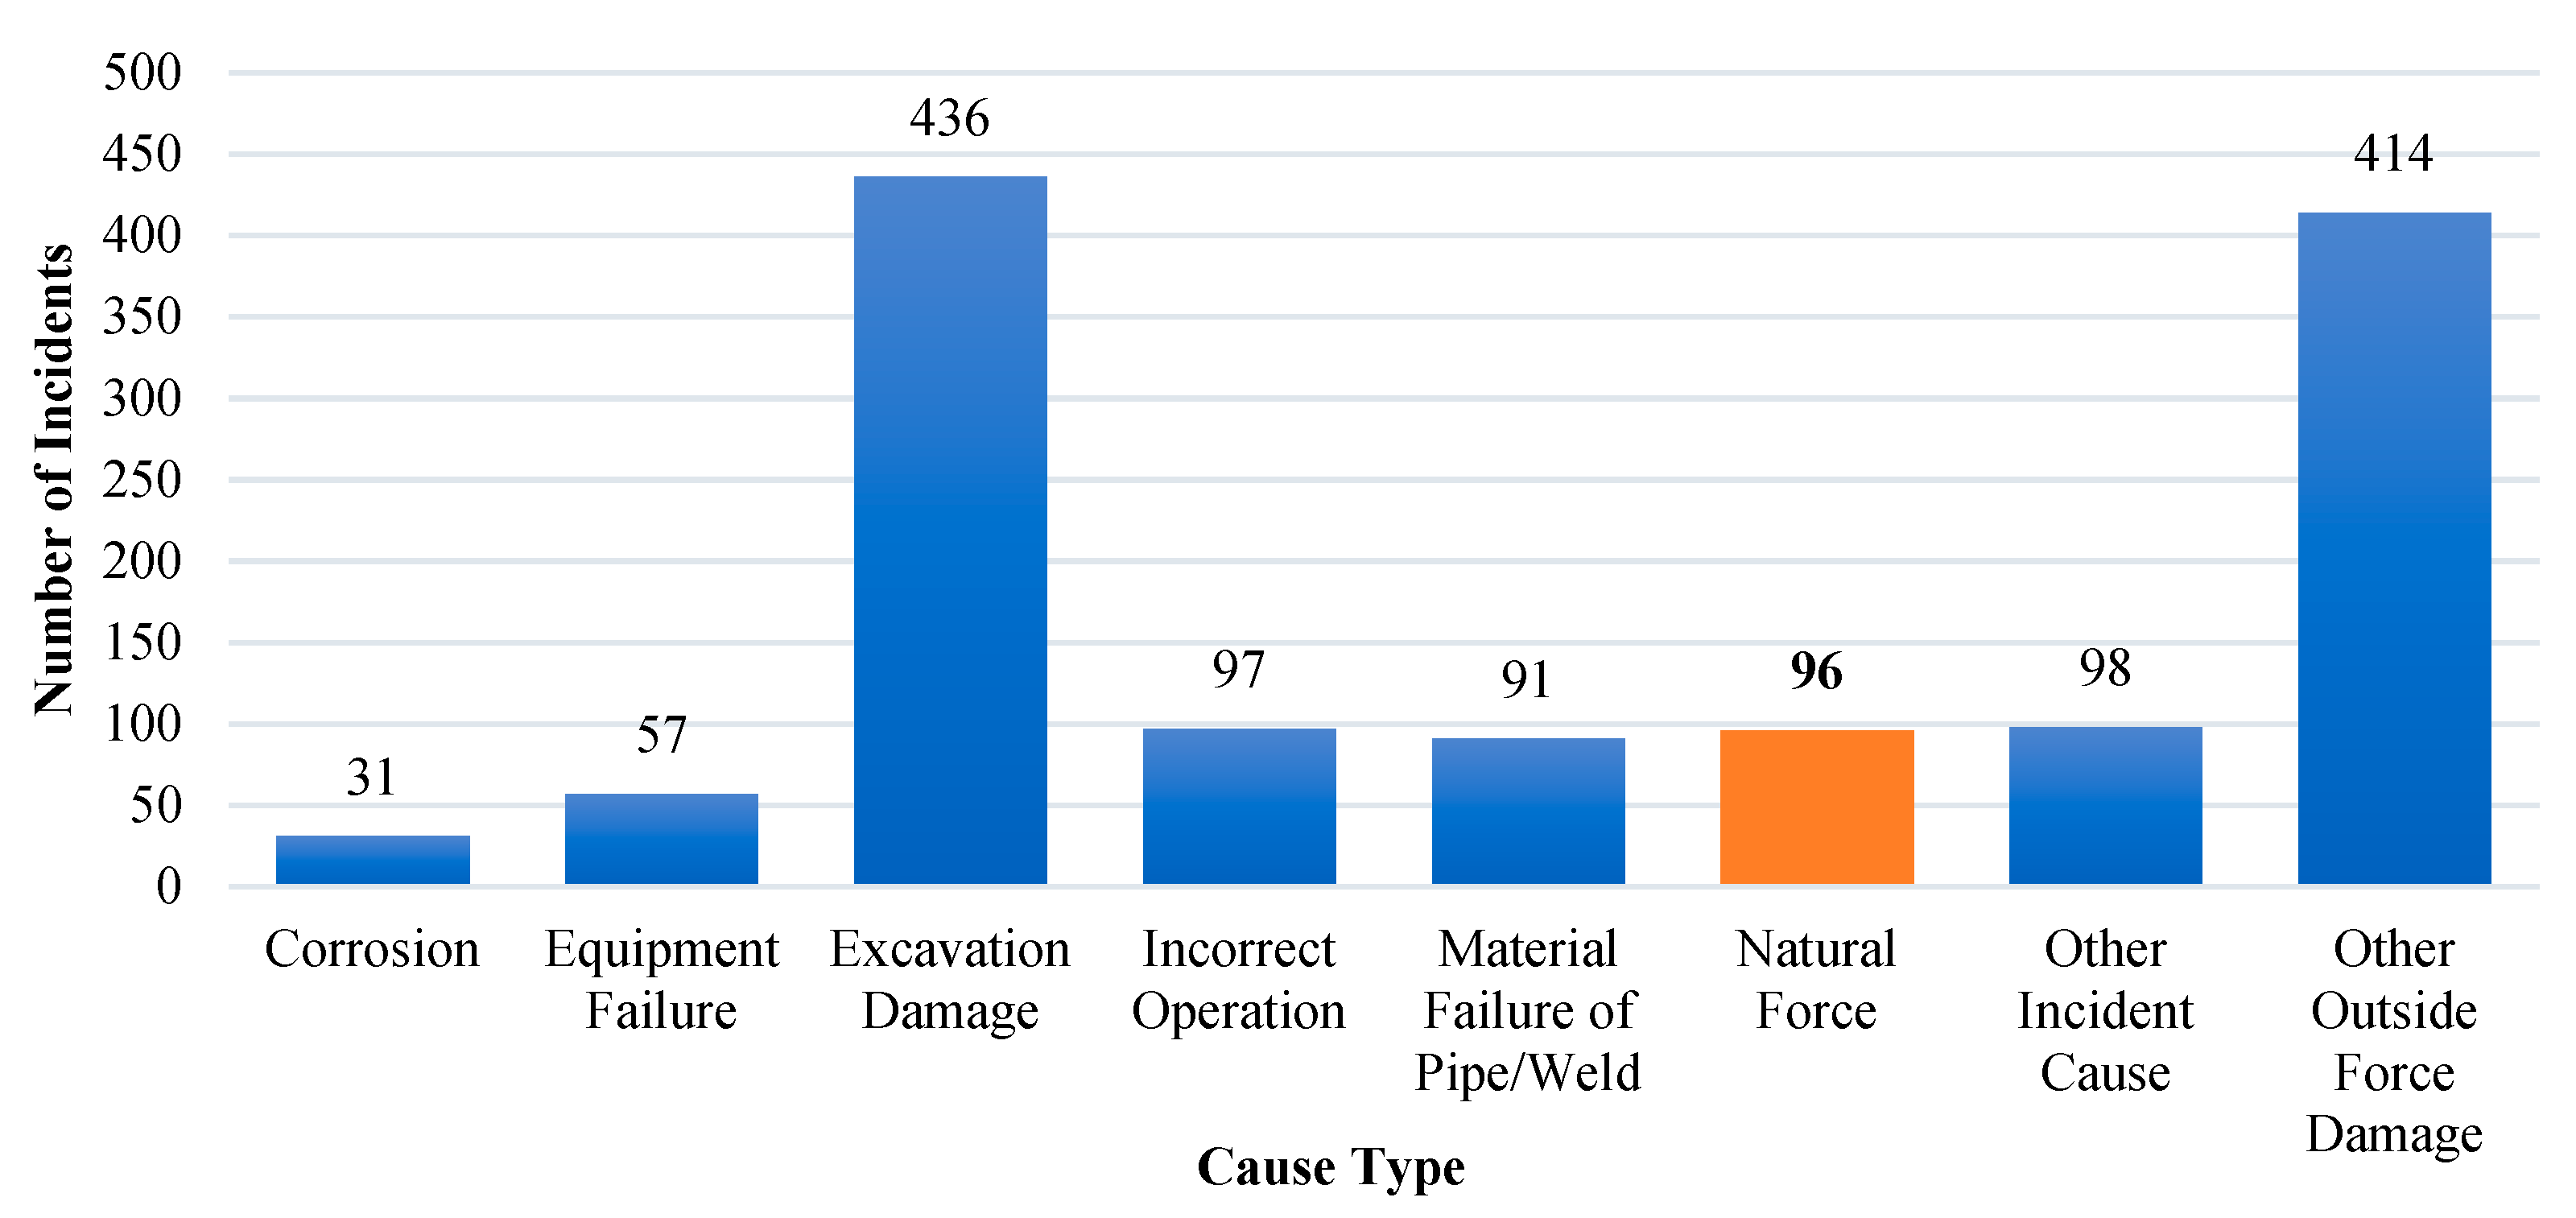
Figure 3 shows the number of incidents induced by different causes, indicating that there were 96 incidents caused by natural forces from 2010 to 2022.
The causes of natural force damage to pipelines in the U.S. are diverse and can be characterized in different ways. This calls for the formulation of natural force damage modeling as a classification problem. This study developed and evaluated classification machine learning algorithms to address this issue. The different types of natural force damage were encoded into ordinal data to streamline the modeling process, as shown in
Table 1. The integration of weather data into the PHMSA database was achieved by combining the location and time components as a common denominator.
2.2. Coding and Software Libraries
Data pre-processing and post-processing of the pipeline data were carried out using the Python programming language. The classification machine learning algorithms were implemented using scikit-learn, a free machine learning library.
2.2.1. Data Selection and Pre-Processing
Data pre-processing is essential for ensuring that the data are suitable for analysis, and it can help to improve the accuracy and effectiveness of machine learning models. Data pre-processing is essential for several reasons. First, it improves data quality. Pre-processing helps identify and correct errors, missing values, and inconsistent data, which can improve the data quality. Second, it facilitates better feature selection. Data pre-processing can also be used to ensure the most relevant features are selected during the feature selection process, which is detailed in the following subsections. Lastly, it enhances model performance. By pre-processing the data, the performance of the models can be enhanced by ensuring that the data are consistent, complete, and relevant to the problem at hand [
24].
Table 2 presents the pipeline damage data and their respective descriptions based on the merged report formats to create pipeline incident trends, which PHMSA publishes in their pipeline incident 20 year trend dataset.
After screening 96 data points to remove incomplete and missing instances, the resulting dataset consisted of 81 data points.
Table 2 also contains a set of features with varying magnitudes, units, and ranges; for example, the age of the pipeline is measured in years, whereas the pipe diameter is measured in meters. These various features create a magnitude discrepancy and may significantly impact the accuracy and interpretability of machine learning models. If the features are not properly scaled or normalized, those with larger values or a wider range of values can dominate the prediction outcome. Thus, it is necessary to standardize the features to a consistent level of magnitude with methods such as
z-score normalization, min–max scaling, and logarithmic [
25].
This paper employed the
z-score approach to scale the numerical features in the dataset, as shown in Equation (1). The benefit of using the
z-scores approach is that it allows for the standardized comparison of data points across different datasets with different means and standard deviations [
26]. By converting the data points into a standard scale, it becomes easier to compare the relative position of a data point within its dataset and between different datasets.
where
z represents the scaled value of
x, which is an unscaled variable with a mean of
μ and a standard deviation of
σ.
Table 2 contains some categorical variables, such as pipe material, crossing, and incident area type. Most artificial intelligence or machine learning algorithms cannot process categorical variables as these data types are non-numerical data representing a group or category. Thus, these numerical data must be transformed into numerical values. PHMSA does not provide an ordinal or numerical scale for these categorical variables; therefore, they were converted into an ordinal scale to be interpreted by the machine learning algorithms. For example, in
Table 2, the categorical variable “crossing” was converted to 0, 1, 2, and 3, representing bridge, railroad, road, and water crossings, respectively. Similarly, the rest of the categorical variables in
Table 2 were also transformed into an ordinal scale of 0, 1, 2, …,
n in which
n is the number of categories available for a variable.
2.2.2. Feature Selection
Feature selection, a crucial step in data pre-processing, has demonstrated its effectiveness and efficiency in readying high-dimensional data for various data analysis and machine learning tasks. The primary goals of feature selection are to simplify models, enhance predictive accuracy, enhance comprehensibility, and make inferences about the data [
27]. Generally, various methods for feature selection can be categorized into three categories: filter, wrapper, and embedded methods [
28]. The filter approach leverages the inherent features of the training data without relying on the specific predictive algorithm being used [
28,
29]. On the other hand, the wrapper method evaluates the correlation between feature relevance and optimal feature subset selection by searching for the best subset of features that aligns with the chosen predictive algorithm [
28,
29]. Lastly, the embedded approach integrates feature selection within the training process by utilizing a learning algorithm specifically designed for this purpose [
28].
The Boruta feature selection method was selected for this study. Boruta is a wrapper method of feature selection, meaning it uses a model to evaluate the importance of each feature and select the most relevant features. The Boruta was selected because it implements an all-relevant approach, considering all features that impact the outcome variable. It is designed to handle datasets that have a large number of variables, including variables that may be correlated or redundant. In contrast, many other variable-selection algorithms follow a minimal optimal strategy, selecting only a small subset of features that produce a minimal error when using a specific classifier [
30]. The pseudocode for implementing the Boruta feature selection is given as follows in Algorithm 1.
| Algorithm 1: Boruta Feature Selection. | |
| 1: | Create a copy of the original training data set and call it shadow features. | |
| 2: | Initialize the feature importance of all features to zero. | |
| 3: | | For each feature in the original data set: | |
| 4: | | | Create a random permutation of the feature values. | |
| 5: | | | Replace the feature values in the shadow features with the permuted values. | |
| 6: | | | Calculate the feature importance using a decision tree (e.g., Random Forest). | |
| 7: | | | If the feature importance of the permuted feature is higher than the original feature, mark it as “not important”. | |
| 8: | | | Repeat steps 4 to 7 for a predetermined number of iterations. |
| 9: | |
End. | |
| 10: | Keep only the features that are marked “important”and discard the rest. | |
2.2.3. AI Approach: Machine Learning Algorithms
Numerous AI or machine learning algorithms have been documented in the literature in the domain of machine learning. However, an exhaustive examination of all algorithms is beyond the scope of this research. Thus, the authors focused on reviewing the most commonly employed multi-classification algorithms that have demonstrated superior performance compared to alternative approaches. In this paper, a comparison was conducted between the predictive performance of five commonly utilized machine learning classifiers in several domains to solve classification problems. The selected classifiers used in this paper included (1) k-nearest neighbors (KNN), (2) multilayer perceptron neural network (MLPNN), (3) random forest, (4) multiclass support vector machine (multiclass SVM), and (5) extra gradient boosting classifier (XGBoost). The summary of each of the classifiers is provided as follows.
K-nearest neighbor (KNN): In practice, the KNN machine learning algorithm exhibits excellent performance compared to more complex machine learning algorithms [
31]. This is due to its ability to determine similarities among data, enabling it to make predictions on unseen data [
32]. Furthermore, it does not make additional assumptions and is flexible, making it suitable for a variety of applications [
31]. The KNN algorithm is widely considered to be one of the top 10 machine learning algorithms [
33] and is often used as the baseline algorithm in several domain problems [
34]. Additionally, KNN is capable of generalizing unseen data with potentially complex geometries compared to other algorithms [
31].
The KNN machine learning algorithm uses the k-closest data points in the feature space as inputs, and it outputs a classification of pipeline damage caused by natural forces. The damage type is determined by the majority vote of its k nearest neighbors in which k is a positive integer that is chosen based on the data. The KNN classifier operates by finding the nearest neighbors of each query point, with k being specified by the user. However, the optimal value of k is highly dependent on the data, which is why different values, ranging from 1 to 50, were explored in this study. The best value of k was determined using the grid search method, based on the scikit-learn 2019a user’s guide.
Random forest: The concept of random forests was introduced by Leo Breiman in the early 2000s as a method for constructing a predictive ensemble using a collection of decision trees grown in randomly selected subspaces of the data [
35]. The method involves utilizing multiple randomized decision trees and averaging their predictions, resulting in exceptional performance in scenarios in which the number of variables exceeds the number of observations [
34]. Additionally, this approach is flexible and can be applied to complex problems or customized to specific learning tasks and provides assessments of variable significance. Its adaptability makes it a valuable tool for large-scale projects [
35].
Multiclass support vector machine (SVM): SVM is predominantly used to solve binary classification problems by identifying a separating hyperplane for the data points [
36]. For a multiclass classification problem, SVM has two methods: the one-versus-rest approach, which involves training
m classifiers: one for each class in a dataset with
m classes. During classification, each classifier predicts the probability of a specific class, and the class with the highest probability is selected. The one-versus-one classifier approach trains a classifier for each pair of classes, considering all possible combinations. During classification, each classifier predicts the probability of one class, and the class with the most votes is chosen as the final classification [
36]. SVM was selected as one of the algorithms because it generally performs well in high-dimensional spaces and can effectively classify new, unseen data [
37]. SVMs can handle both linear and non-linear data, making them suitable for a wide range of classification tasks.
Extra gradient boosting classifier (XGBOOST): XGBoost is a highly efficient implementation of gradient-boosted decision trees that prioritizes optimized memory usage and harnesses the full potential of hardware computing power. This results in a faster execution time and improved performance compared to many traditional machine learning algorithms and deep learning models. The core concept behind boosting is to construct subsequent sub-trees from the original tree in a sequential manner, with each new tree reducing the errors of the previous one. The new sub-trees modify the residuals from the previous iteration to minimize the error in the cost function [
38].
Multilayer perceptron neural network (MLPNN): MLPNN is a supervised learning algorithm that learns a function
by training on a dataset in which
m is the number of input dimensions and
o is the number of dimensions for output (Scikit-Learn 2007). An MLPNN operates in three stages. Firstly, during the forward pass, the model inputs are multiplied by the weights, the bias is applied to each layer, and the model output is calculated. This predicted output is then evaluated against the given inputs, and the loss is determined at the output. The output model provides predicted results based on the input parameters, and a backpropagation algorithm is used to compare the predicted results with the actual results. Different loss functions may be employed, depending on the desired performance and requirements [
39].
During the backward pass, partial derivatives of the cost function that concern various parameters are propagated back into the network [
40]. This process involves the backpropagation of loss, and the model weights are updated using gradient descent. An MLPNN typically consists of at least three layers of nodes: an input layer, a hidden layer, and an output layer [
38]. Given a set of features
and a target
, an MLPNN can learn a non-linear function approximator for a classification problem [
40].
The MLPNN was selected as one of the algorithms because of its capabilities of modeling complex, non-linear relationships between input and output variables with a wide range of input data types [
40]. Additionally, MLPNNs can generalize well to new data and adapt to changes in the input data by adjusting their internal parameters, making them useful for applications in which the data are subject to change over time. With regard to handling complex data, an MLPNN can be scaled up by adding more layers or nodes to the overall neural network architecture [
41].
Model Evaluation: After employing the five algorithms on the training data, the models were evaluated using an independent testing dataset to assess their performance. The confusion matrix was calculated, and performance metrics, including accuracy, recall, and precision, were measured using the following equations:
where
TP = true positives;
TN = true negatives;
FP = false positives; and
FN = false negatives. Accuracy measures the model’s overall prediction correctness, recall measures the prediction sensitivity, and precision is known as positive predictive value. A way to balance the trade-off between precision and recall is the
F1
score.
3. Results
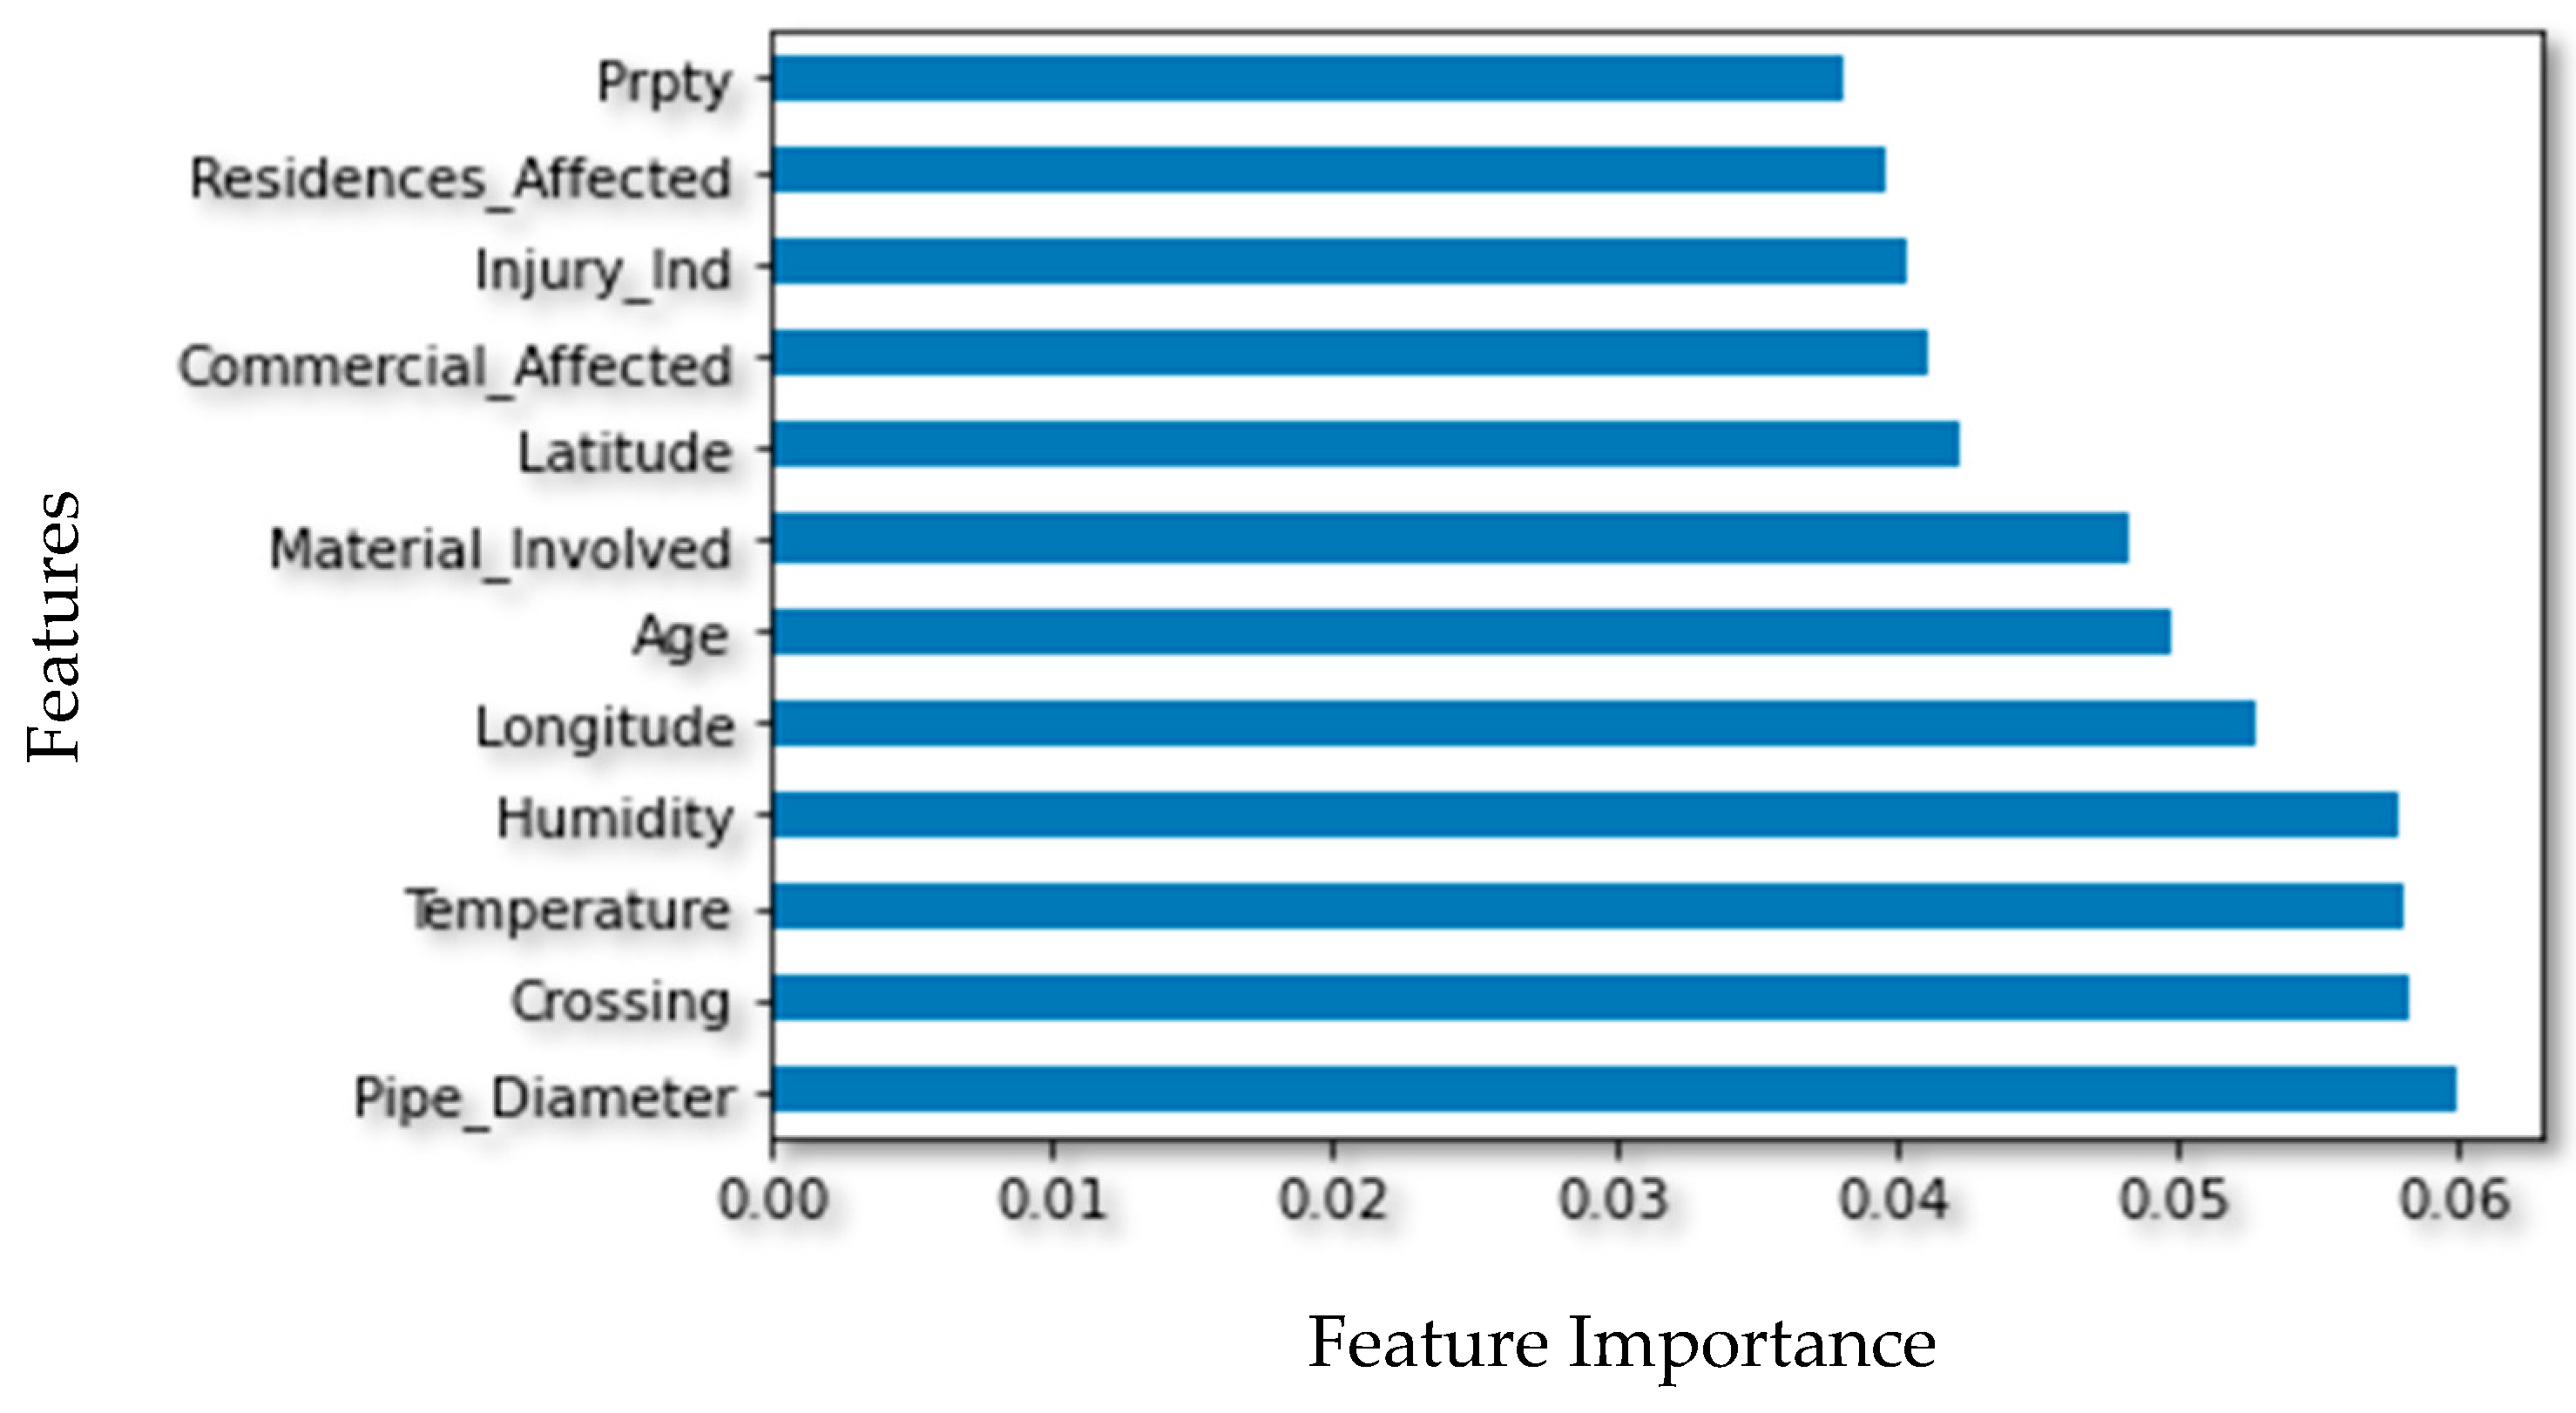
As outlined in the “Feature Selection” of the research methodology section, the Boruta algorithm was utilized for feature selection. The top 12 features that influence pipeline damage are shown in
Figure 4. The Boruta algorithm was employed for feature selection on the pipeline damage dataset. The dataset consisted of 27 features. After running the Boruta algorithm, 12 relevant features were identified, including the pipe diameter, crossing, temperature, humidity, longitude, pipe age, type of pipe material, latitude, soil type, depth of the pipe, and others. These 12 features were considered important predictors for pipeline damage due to natural forces and align with previous research findings [
42]. The Boruta algorithm also successfully identified the redundant features, which did not significantly impact pipeline damage. These features were removed from the dataset.
The diameter of a gas pipeline plays a significant role in its susceptibility to natural force damage and subsequent deterioration. A pipeline with a larger diameter is typically more resistant to damage caused by natural forces, such as earthquakes, landslides, and soil erosion, as it has a greater mass and more structural integrity. On the other hand, a pipeline with a smaller diameter may be more vulnerable to damage as it may be more susceptible to deformation and stress due to natural forces. Moreover, the diameter of a pipeline also affects the pressure level at which the gas is transported. Suppose the pipeline diameter is too small for the anticipated amount of gas. In that case, the pressure required to meet demand may exceed the maximum operating pressure, leading to increased stress on the pipeline and a greater likelihood of deterioration over time [
43]. Therefore, it is important to carefully consider the appropriate diameter of a gas pipeline to ensure its safety and longevity in the face of natural force damage.
Other important features for pipeline damage are temperature and humidity. The PHMSA classifies natural force damage to pipelines into distinct categories, which are outlined in
Table 1. Temperature is among the natural forces that can cause pipeline damage in multiple ways. Extremely cold temperatures can cause water to freeze, leading to ice buildup and pressure on pipelines, which results in cracks. Similarly, high temperatures can cause materials to expand, leading to stress and the potential failure of the pipeline structure. Additionally, temperature changes can cause ground movement or shifting, leading to instability and the potential damage to or rupture of pipelines. Therefore, temperature is an important factor to consider when assessing the risk of pipeline damage due to natural forces.
Given the various ways temperature can impact pipeline infrastructure, it is essential to assess the risk of natural force damage and consider climate change parameters in the prediction of such incidents. In this context, Naik and Kiran (2018) used data mining algorithms to explore the effects of temperature on pipeline damage incidents. Their analysis showed that natural force damage was the most frequent type of pipeline accident when temperatures were below 266.5 Kelvin [
19]. Notably, unlike other types of pipeline accidents, natural force damage was not susceptible to a specific range of temperatures. This highlights the importance of incorporating climate change parameters into the prediction of natural force-induced pipeline damage and adopting a comprehensive approach that considers the effects of changing temperatures on infrastructure and natural systems.
The outcome of the feature selection process highlighted the importance of incorporating the impacts of climate change stressors on natural gas pipeline damages induced by natural forces. The natural gas pipeline systems are vulnerable to various effects of climate change, including alterations in temperature ranges, heightened thermal stress, increased runoff leading to heavy precipitation and flooding, and more frequent occurrences of hurricanes, landslides, and land subsidence [
44]. This will enable a more comprehensive understanding of their effects and help to prevent disruptions to the distribution of gas products to consumers. The complex and interconnected nature of natural gas pipelines, coupled with the prolonged economic lifetime of the infrastructure, makes it crucial to address and adapt to the challenges posed by climate change [
45].
The selected features were used in the subsequent modeling process to develop a predictive model for pipeline damage. Overall, the results from the Boruta feature selection process provided valuable insights into the most important features that affected pipeline damage and improved the accuracy of the predictive model.
Table 3 shows a statistical summary of the response and the obtained predictive variables.
The K-nearest neighbor (KNN) algorithm was used with the grid search method to classify the pipeline damage dataset. The dataset consisted of 12 relevant features obtained through the Boruta feature selection process. The grid search technique was employed to find the optimal hyperparameters for the KNN model, which included the number of neighbors (
k) and the distance metric for classification. The results of the grid search showed that
k = 3 and the Manhattan distance metric were the optimal hyperparameters for the KNN model. After training the KNN model using the optimal hyperparameters, the model was evaluated using the testing data. The model achieved an accuracy of 74% (
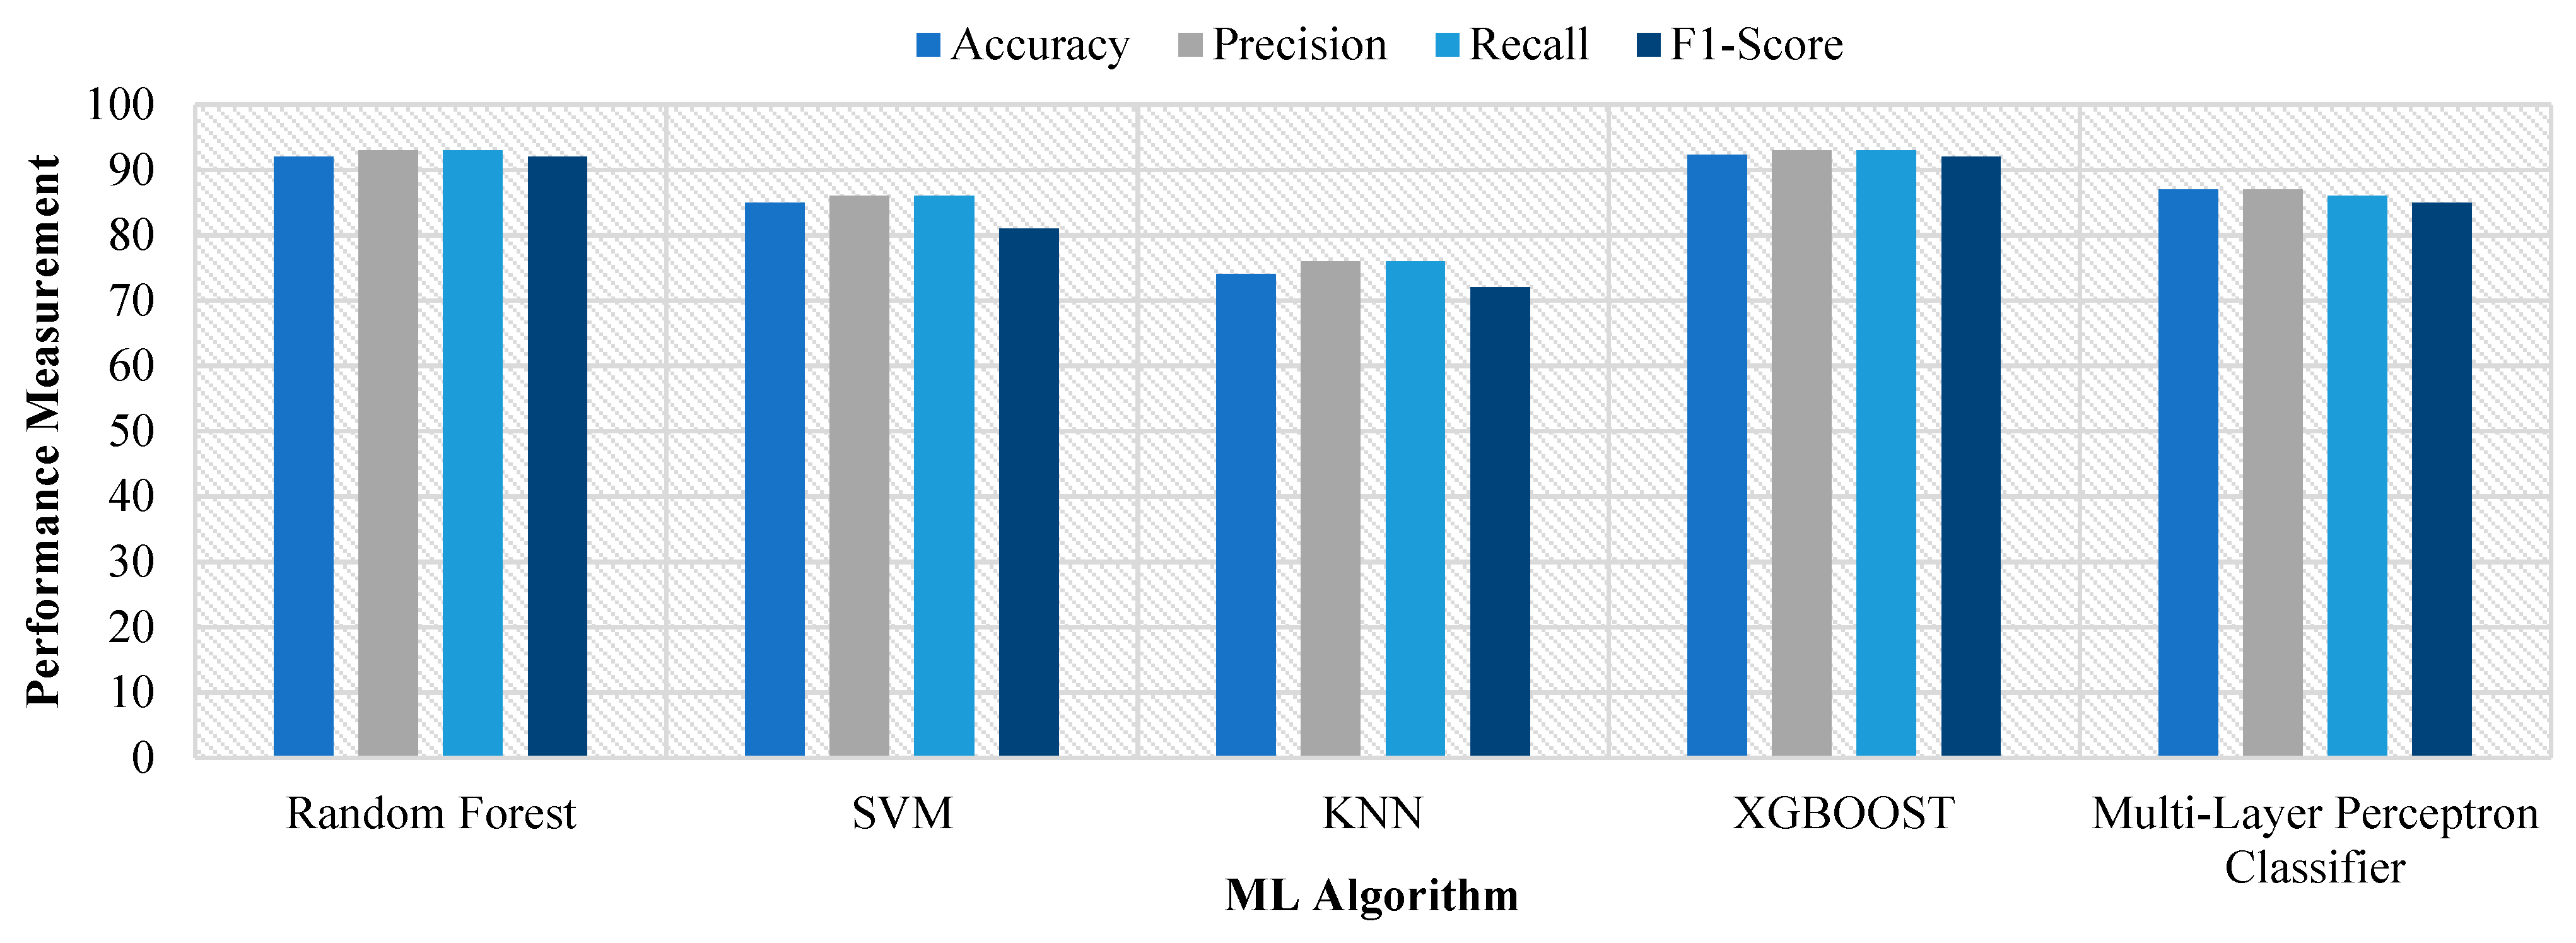
Figure 5) on the testing dataset, indicating that it was able to classify pipeline damage instances with acceptable accuracy. However, accuracy alone does not provide a comprehensive picture of the model’s performance, especially in the case of imbalanced classes.
To further assess the model’s performance, precision (Equation (3)) and recall (Equation (4)) values were computed for each class. In a classification problem, a class refers to a category or label that an observation or data point belongs to. The model showed a precision and recall of 76% on average for each class, indicating that the model was reasonably effective in identifying pipeline damage instances caused by natural forces across all classes. The precision and recall values provide insights into the model’s ability to accurately predict positive instances and capture all relevant instances, respectively. Overall, the results from the KNN algorithm with the grid search method demonstrate that the KNN model, with the identified optimal hyperparameters, can classify pipeline damage instances with acceptable accuracy. Therefore, this model could potentially be used as a valuable tool for predicting pipeline damage. In addition to the KNN algorithm, four other machine learning algorithms were implemented to classify the pipeline damage data: the support vector machine (SVM), random forest, XGBoost, and multilayer perceptron neural network (MLPN) algorithms. The comparison results of these five algorithms are shown in
Figure 5.
The grid search technique was also used to identify the optimal hyperparameters for each algorithm, and the optimal hyperparameters varied between algorithms. For SVM, the optimal values tested were kernel type, gamma, and C. For XGBoost, the objective type, maximum depth, and the number of estimators were tested. Lastly, for MLPN, the number of neurons per layer, learning rate, and activation function were tested. The results from the grid search revealed that the optimal hyperparameters for each algorithm were as follows: for SVM, kernel type = ‘rbf’, gamma = 0.01, and C = 1000; for XGBoost, maximum depth = 3, objective = multisoftmax, and the number of estimators = 100; and for MLPN, the number of neurons per layer = 100, learning rate = 0.01, and activation function = ReLU.
The random forest algorithm’s hyperparameter was not tuned since the model employs randomization when creating trees to avoid increasing the complexity of the algorithm. The algorithms were trained using the optimal hyperparameters and evaluated using testing data. The results indicated that the XGBoost algorithm had the highest accuracy of 92.3% on the validation dataset. The random forest was the second-best-performing algorithm with an accuracy of 92.0%, followed by SVM with 89.74% and MLPN with 87.18%. Precision and recall values were calculated for each class, and the results showed that XGBoost had the highest precision and recall values for all the classes, as shown in
Figure 5.
Overall, XGBoost was found to be the most suitable algorithm for classifying pipeline damage instances with high accuracy. However, the random forest and SVM algorithms also showed promising results and can be considered alternative options. The results demonstrate the effectiveness of machine learning algorithms in classifying pipeline damage instances and suggest that these models can be used as valuable tools for predicting pipeline damage.
4. Discussion
Pipeline damage caused by natural forces is a serious problem that affects various industries, including oil and gas, water management, and transportation. The development of predictive models that can help identify potential natural gas pipeline damage before it occurs, thus preventing costly repairs and minimizing the impact on the environment, is essential. This study utilized various machine learning techniques, the random forest, SVM, XGBoost, MLPN, and KNN algorithms, to predict pipeline damage caused by natural forces. The findings indicate that all the models display a high predictive accuracy, with the XGBoost and random forest algorithms performing exceptionally well. By utilizing these machine learning models, natural gas pipeline operators can proactively manage their infrastructure and prevent potential hazards, leading to cost savings, improved safety, and environmental protection. By identifying key factors that contribute to natural gas pipeline damage, future pipeline design and maintenance practices can be improved, leading to the overall safety and reliability of pipeline operations.
This study aligns with the existing literature on the potential of machine learning techniques to predict pipeline damage. Previous studies have demonstrated the effectiveness of these techniques in predicting failures of natural gas and oil gas pipelines. For example, Manan et al. (2021) utilized the support vector machine (SVM) algorithm, backpropagation neural networks, and statistical techniques to predict natural gas pipeline failures [
6] accurately. Similarly, Aljameel et al. (2022) employed five machine learning models to detect anomalies in oil and gas pipelines, reporting impressive accuracy levels [
22]. Ihsan and Astuti (2022) utilized deep learning algorithms for anomaly detection in natural gas pipelines, highlighting the versatility of machine learning in the industry [
46]. These studies provided an important context for the potential impact of this study.
Furthermore, the presented research indicates that machine learning techniques can provide a valuable tool for predicting pipeline damage in the oil and gas industry. Our focus on predicting pipeline damage caused by natural forces extends the current literature, which has primarily focused on predicting damage due to corrosion. This study highlights the potential of integrating climate data into the prediction of pipeline damage caused by natural forces. This integration can assist operators in identifying pipelines that are at high risk of damage and prioritize their inspection and maintenance activities. By incorporating climate data and using various machine learning techniques, including the random forest, SVM, XGBoost, MLPN, and KNN algorithms, we have shown that machine learning models can effectively predict pipeline damage caused by natural forces with high accuracy. The implications of the present study are significant for the pipeline industry, as it provides a reliable tool for predicting pipeline damage induced by natural forces and implementing appropriate measures to prevent or mitigate such damage. For example, the models developed in this study can be used to identify pipelines that are at high risk of damage due to natural forces and prioritize them for inspection and maintenance.
In terms of future research directions, it would be interesting to investigate the performance of other machine learning techniques, such as deep learning and reinforcement learning, in predicting pipeline damage caused by natural forces. Researchers can potentially develop more accurate predictive models for pipeline damage due to natural forces. These advanced AI algorithms can further improve the accuracy of prediction and enable the development of proactive measures to prevent pipeline damage. Additionally, it would be useful to explore the impact of different variables on pipeline damage, such as soil type, pipeline material, and weather conditions. Incorporating these variables into the predictive models can create more comprehensive predictive models that consider various factors influencing pipeline damage, leading to more effective solutions. The broader impact of this work is significant, as it can positively impact a range of industries that rely on natural gas pipelines. This work also aids in minimizing the risk of environmental damage and ensuring the continued supply of natural gas to society.


