Article

The Prediction of Abrasion Resistance of Mortars Modified with Granite Powder and Fly Ash Using Artificial Neural Networks

Department of Materials Engineering and Construction Processes, Wroclaw University of Science and Technology, 50-370 Wrocław, Poland
*
Author to whom correspondence should be addressed.
Appl. Sci. 2023, 13(6), 4011; https://doi.org/10.3390/app13064011
Submission received: 21 February 2023 / Revised: 20 March 2023 / Accepted: 21 March 2023 / Published: 21 March 2023
(This article belongs to the Special Issue Advanced Structural Health Monitoring: From Theory to Applications II)

Abstract

:
This paper predicts the abrasion resistance of a cementitious composite containing granite powder and fly ash replacing up to 30% of the cement weight. For this purpose, intelligent artificial neural network (ANN) models were used and compared. A database was built based on mix composition, curing time, and curing method. The model developed to predict the abrasion resistance of the cementitious composites containing granite powder and fly ash was shown to be accurate. It was proved by the very high values of the accuracy parameters that were above 0.93 in the case of the coefficient of the determination R2 and very low values of the errors, which were about 10% in the case of mean average percentage error. This method can be used especially for designing cement mortars with granite powder and fly ash additives replacing cement in a range from 0 to 30% of its weight. These mortars can be used for floors in industrial buildings.

1. Introduction

There is no doubt that cementitious composites shape the civil engineering industry, as they are the most widely used materials, more than steel and wood combined, for construction purposes [1]. Due to their physical–mechanical parameters, concrete and mortar provide architects and builders with a wide range of applications. There is a great need and interest in research aiming at reducing the carbon footprint of cementitious composites. Mortar, on which this research is focused, can be defined as a composite material, consisting of small-size aggregates and a binder (a mixture of hydraulic cement and water). Among its components, the greatest threat to the environment is the production of Portland cement, upon which most hydraulic types of cement employed today are based [2]. Additionally, cement plants generating power cause cement production to be a leading source of carbon dioxide atmospheric emissions. It is estimated that cement production is responsible for 5% of global emissions of carbon dioxide [3]. Due to the global warming problem, the cement industry is facing the problem of improvement and adaptation to new conditions of reducing its carbon footprint.
One of the possibilities for making mortar more eco-friendly is the partial replacement of cement with fly ash. Fly ash can be collected in the dust collection systems that remove particles from the exhaust gases of power plants that burn pulverized coal. It is generally finer than Portland cement and consists mostly of small spheres of a glass of complex composition involving silica, ferric oxide, and alumina [4]. Due to control standards, fly ash cannot be released into the atmosphere and must be stored at coal power plants or placed in landfills. This creates the opportunity for recycling and a reduction in waste. The replacement of cement with fly ash can be beneficial for mortar parameters, decreasing the shrinkage and increasing its resistance to aggressive factors, frost resistance, fracture toughness, and the interfacial zone around the aggregate [5]. Usually, the replacement does not exceed 30% of the binder because of the longer setting time, lower early strength, and altered durability. Higher fly ash contents (high volume fly ash concrete, cementless ash concrete) require alkalization of the hardening process [6].
Another step into sustainable mortars is the addition of granite powder, which is waste arising from the rock-crushing process, as a partial cement replacement. In accordance with the literature survey, there is a huge potential for granite powder as a replacement for natural fine aggregates [7]. Granite powder application in concrete can contribute not only to reducing landfills but also improving workability, stiffness, strength, and the packing density of the aggregate [8] compared to ordinary aggregates and Portland cement mortars. Similarly to fly ash, the addition of granite powder beyond 30% caused a strength decrease, according to the literature [9].
The conscious choice of ingredient type and amount, additives, and admixtures allows us to obtain different types of mortar, prepared for a specific task to fulfill. This research is focused on studying mortar with its surface subjected to dynamic loading with fly ash and/or granite powder as the partial cement replacement. One of the most important parameters when dealing with scuffing, scratching, wearing down, marring, or rubbing away the surface is abrasion resistance [10]. The significant impact of it on mortar’s surface durability has been proved by several pieces of research [11,12]. The abrasion resistance of mortar depends on parameters such as paste hardness, aggregate hardness, aggregate/paste bond, and most importantly, compressive strength [13]. Other practices such as curing and surface finishing techniques can also have a strong influence on it [14]. Knowledge of the abrasion mechanism may be useful in the design of elements exposed to contact with moving objects such as industrial floors, slabs, pavement, roads, airport aprons, etc. For the purpose of this work, the Bőhme disc method that complies with European Standard EN 13892-3 [15] was used to determine the depth of wear. The samples used were mortars containing fly ash, granite powder, and their combinations as partial substitutes for cement, aiming for reducing cement content, together with carbon footprint [16]. According to the literature, abrasion resistance of concrete with fly and/or granite powder addition has already been examined by some researchers in cases as follows the influence on abrasion resistance such as replacing 50 and 70% of the cement with fly ash [17,18], replacing up to 100% of the cement with granite waste in self-compacting concrete [19], using waste granite as a coarse aggregate [20], and a combination of using granite as a coarse aggregate and replacing 10% of the cement with fly ash [21]. Unfortunately, because of the fact that granite powder rarely increases the compressive strength of concrete, the granite added to the concrete is more often a coarse aggregate than the replacing cement eco-admixture. Additionally, investigating things other than compressive strength, the mechanical properties of the cementitious composite modified with granite powder is not the point of interest of other researchers.
Another important fact is that the current methods of determining abrasion resistance share similar disadvantages, including damaging sample surfaces and time-consuming testing. The possible transformation of some tests into prediction methods is performed and, therefore, optimization can be achieved by artificial intelligence (AI). Due to the increasing value of using AI to solve various problems in civil engineering, algorithms of artificial neural networks became very popular for predicting the mechanical properties of cementitious composites with eco-friendly admixtures, such as compressive strength [22], elastic modulus [23], and the wear of a modified cementitious composite [24]. Unfortunately, only a few researches have been focused on predicting abrasion resistance using neural networks [25,26]. Reducing the amount of destructive test methods in favor of prediction is important and, therefore, a sustainable approach should be studied deeply and more complexly.

2. Materials and Methods

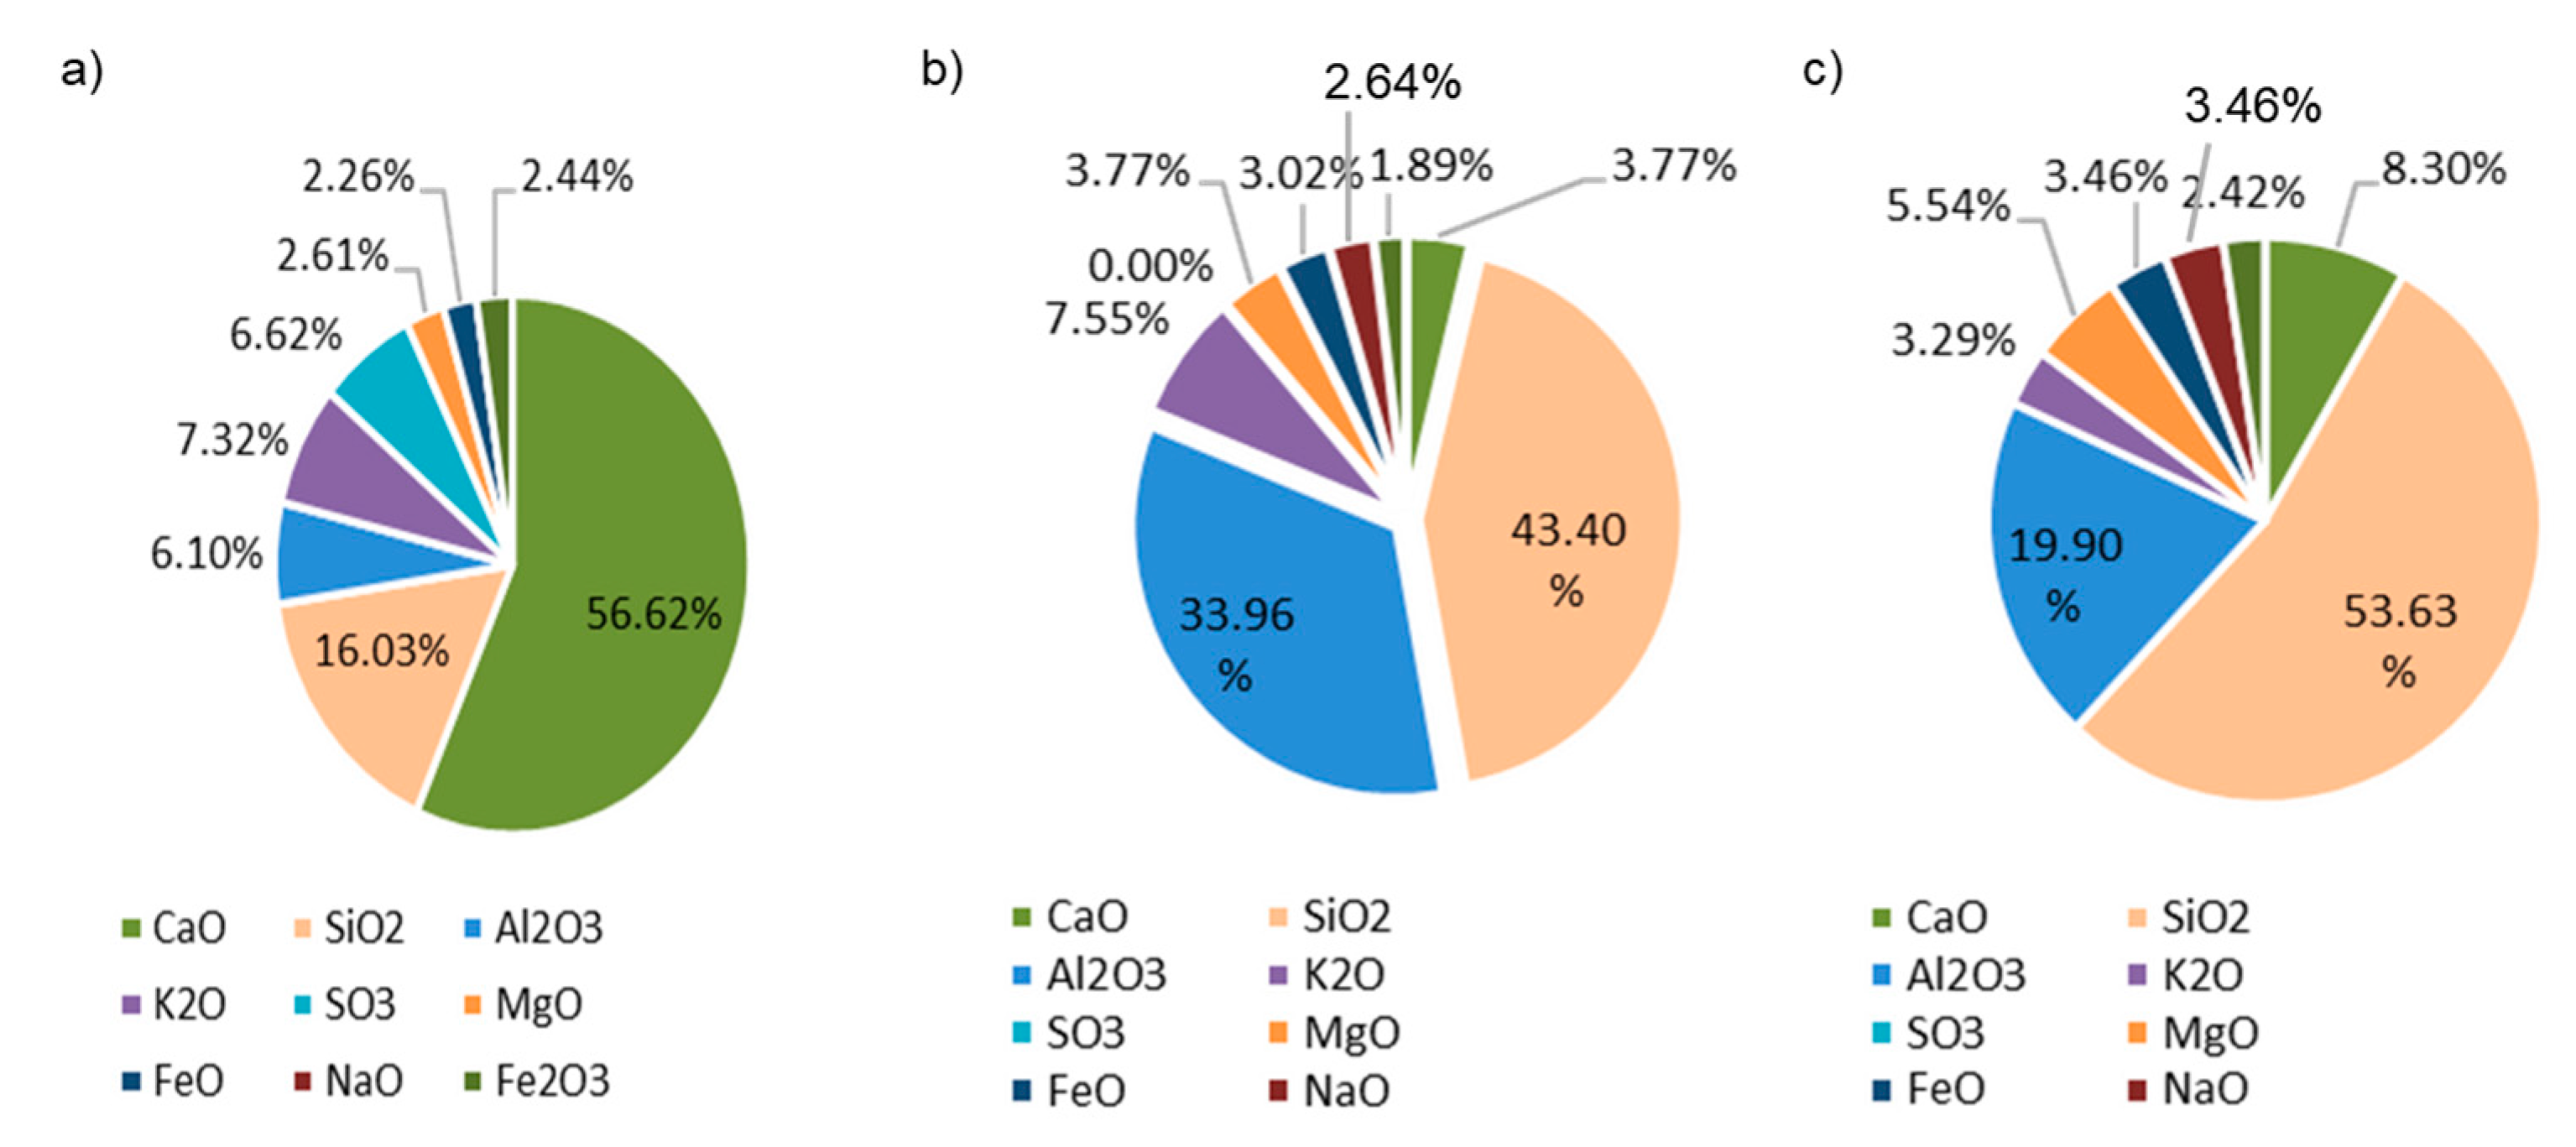
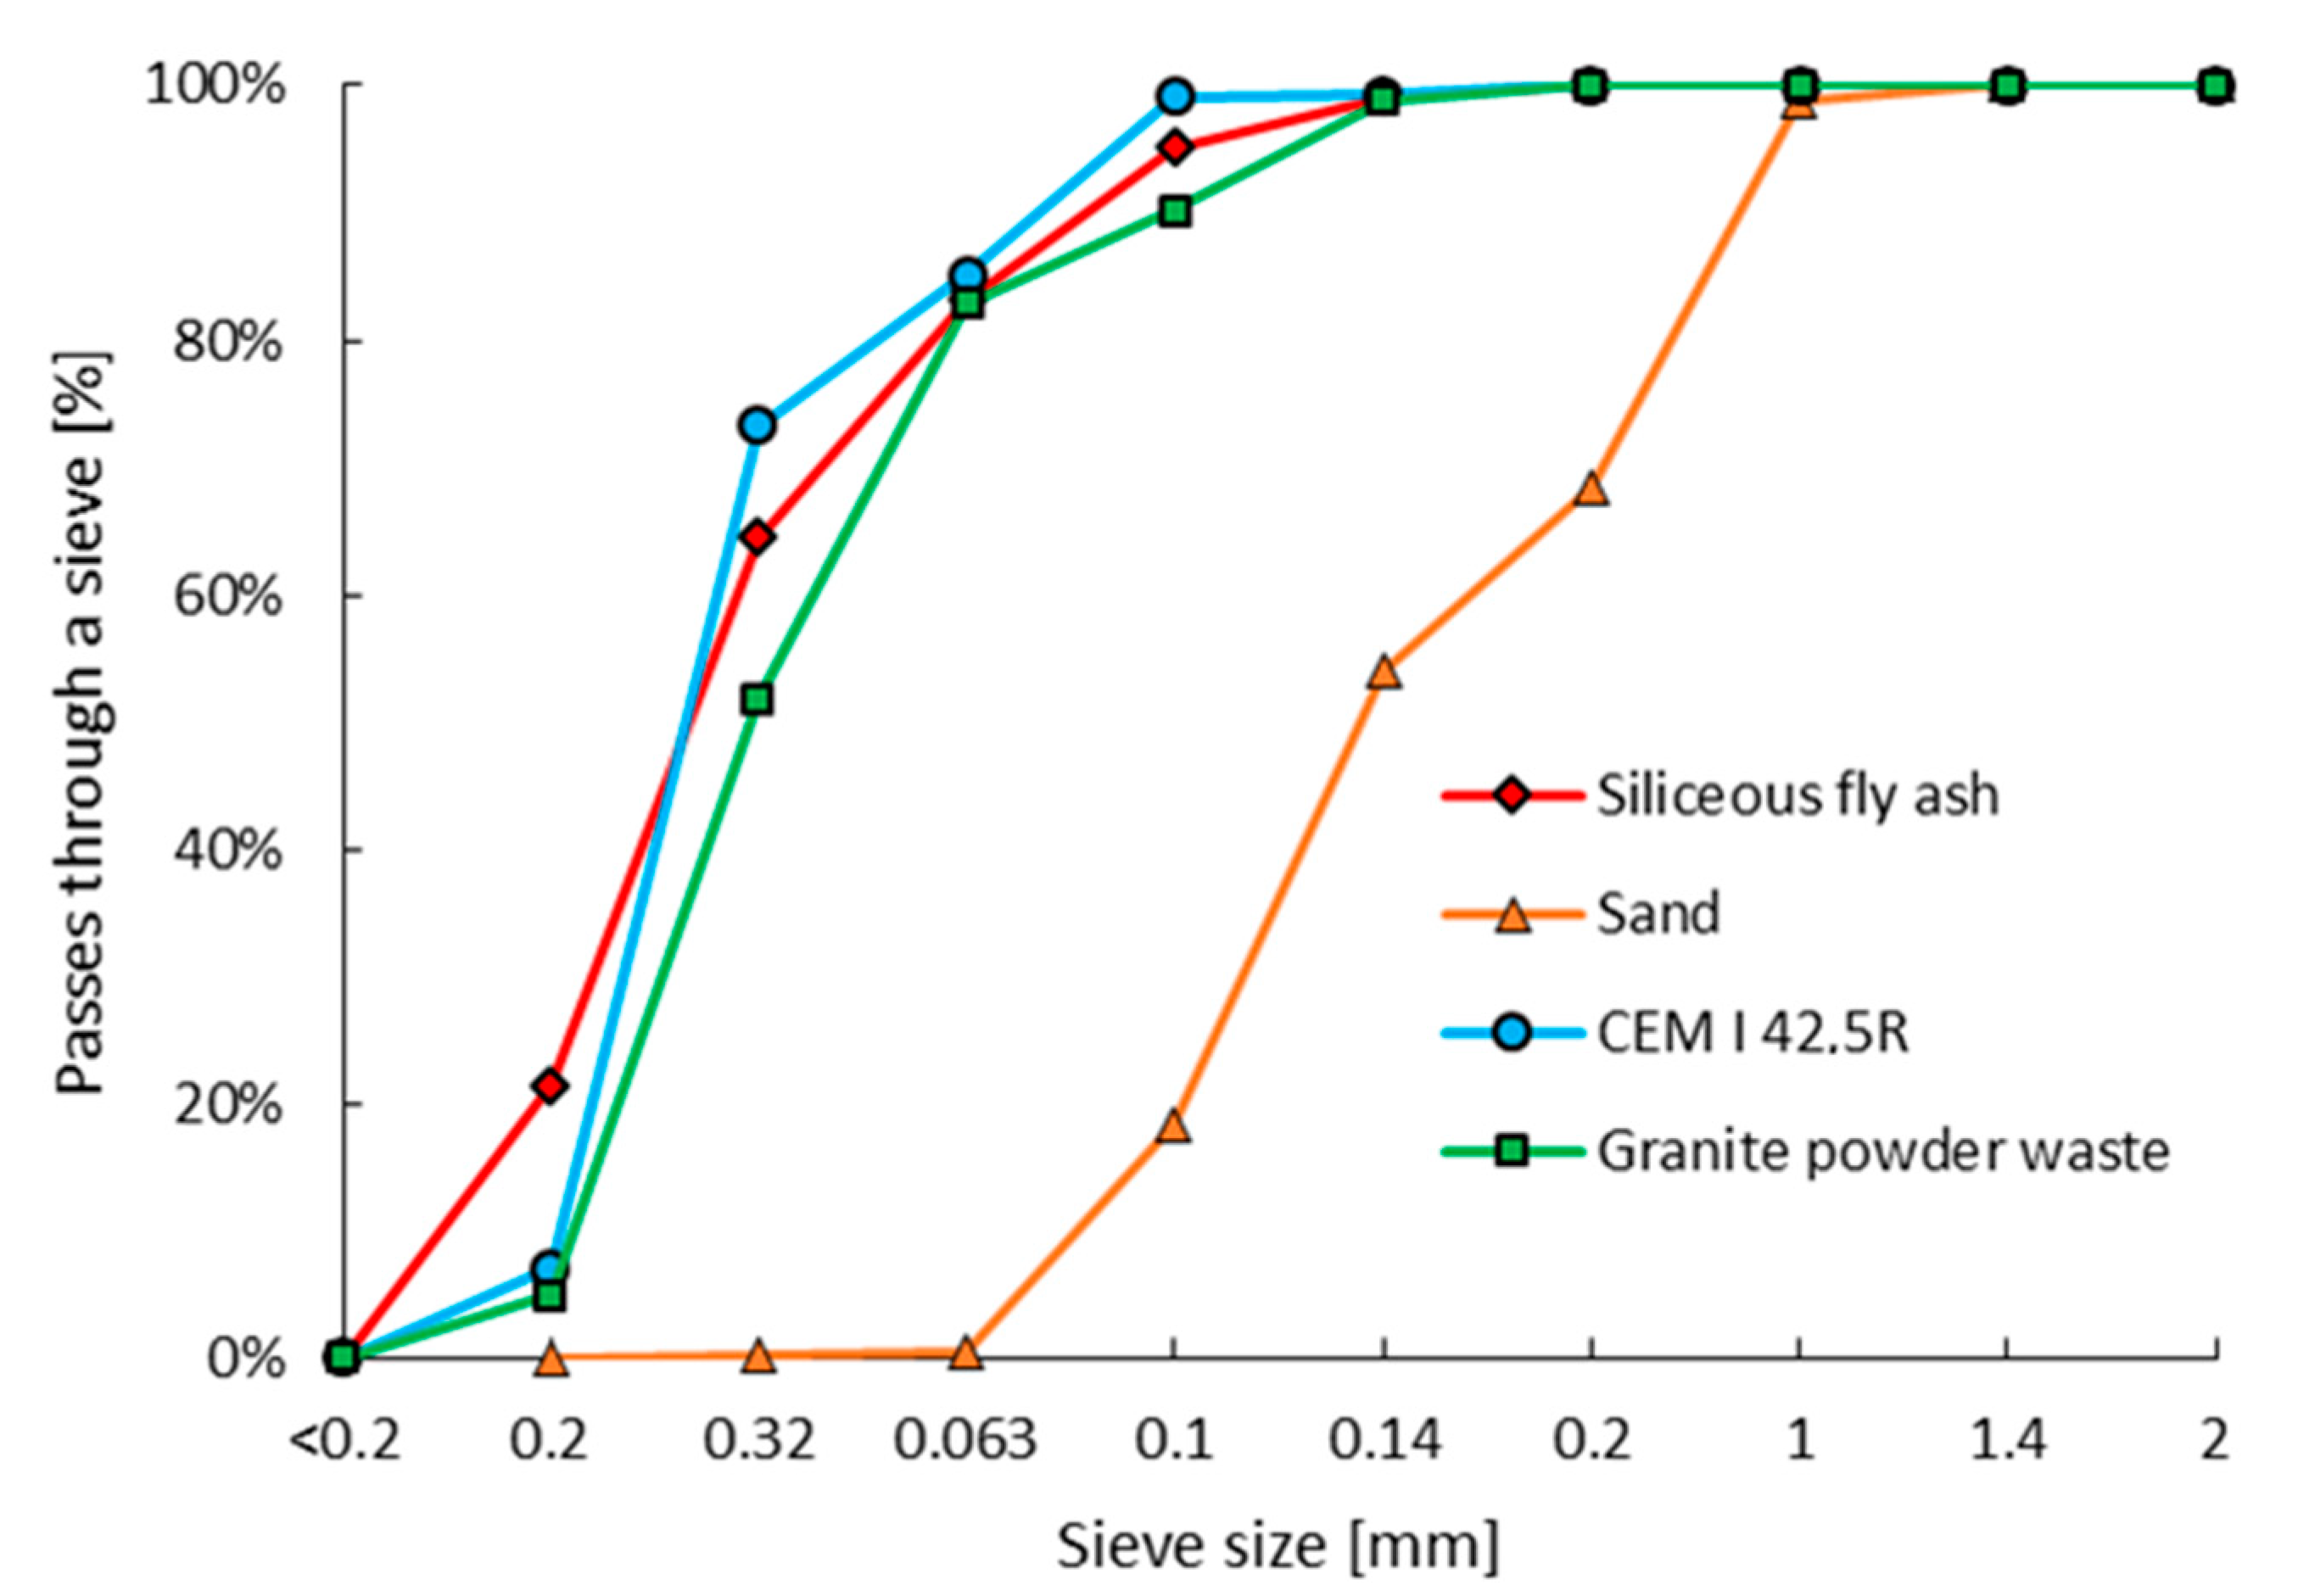
2.1. Materials Used to Build the Database

Research was carried out for cementitious mortars modified with different types and amounts of additives. A reference mortar was modified with siliceous fly ash and granite powder waste in a 0–30% amount of cement mass. Figure 1 presents the chemical composition of the cement, fly ash, and granite powder used in the research, which was obtained by performing SEM analyses. The 11 different series compositions, whose composition is shown in Table 1, were prepared for the study. The tests were performed and analyzed after 4, 8, 12, and 16 cycles for two samples of each series to prevent outlier results. Overall, 88 sets of results were subjected to the study.
Cementitious mortars were prepared using a cement CEM I 42.5R (Górażdże, Poland), fine aggregate (Byczeń, Poland), water from a water supply, granite powder waste (Strzegom, Poland), and siliceous fly ash (Hranice, Czech Republic). The lowest value of the bulk density was obtained for fly ash and was approximately 1.15 g/cm2, and it was lower than for cement, which was 1.18 g/cm2, and for granite powder, which was 1.22 g/cm2. It was quite different in the case of the specific surface area, as the cement was about 3700 cm2/g and was lower than the specific surface area of granite powder, for which it was 3950 cm2/g, and for fly ash, which was approximately 4150 cm2/g. Sieve size development of granular materials used is shown in Figure 2.

2.2. Methods of Investigating the Abrasion Resistance

Measured dry ingredients of the cementitious mix were placed in the mixer and mixed for 3 min. After that, a measured amount of water was added to the mix and was mixed for 5 min. A plasticizer was not used in the mixing process. After mixing, the fresh mortar was placed in the prepared molds. Cubic specimens with dimensions 71 × 71 × 71 mm3 were prepared. After 24 h, samples were put into water and water-cured for 28 days. After this time, the following tests were performed.
To determine the bulk density of hardened cementitious mortars, the authors used the test described in standard PN-EN 12350-6 [27]. The mix is compacted in a rigid, waterproof container of known volume and weight, and then weighed.
To determine the abrasion resistance of hardened cementitious mortars, the authors used the test described in standard PN-EN 13892-3 [15] (Bőhme method). The prepared samples were abraded on a Bőhme machine. This test consists in measuring the change in height and weight of a cubic sample with a 71 mm long side. The sample is placed on a disc sprinkled with abrasive powder and then pressed and put into rotation by means of a grinding machine, as is presented in Figure 3. First, the initial abrasion was performed (4 cycles with 22 rounds) and after that, the samples were weighed. Next, the abrasion resistance tests were investigated. A total of 4 stages of the test were performed, consisting of an abrasion resistance evaluation after 4, 8, 12, and 16 cycles of 22 rounds each. After every stage, samples were weighed and measured.

2.3. Soft Computing Techniques

Machine learning algorithms recently played a vital role in solving engineering problems. Recently, the most commonly and successfully used are neural networks and tree-based algorithms, such as random forest. Therefore, these two were used for this study.

2.3.1. Neural Networks

Neural networks are computer imitations of neural connections in the human brain consisting of units called neurons. These neurons are grouped into three types of layers, which are the input consisting of parameters used during the prediction process, hidden, and output, which provides the solution to the problem. Hidden and output layers are activated using activation functions which commonly are:
Linear function: f(x) = ax + b
Tangh   function :   f ( x ) = e x e x e x + e x
Logisitc   function :   f ( x ) = e x e x + 1
Exponential   function :   f ( x ) = d x
Sinus function: f(x) = sin x
The iterative process of obtaining the solution to the problem is performed by training and testing the neural network using learning algorithms. For this purpose, in this work, quasi-Newton, Levenberg–Marquardt, and conjugate gradient learning algorithms have been used [28]. In this work, the authors used different variants of neural networks in terms of their topology, as well as the activation functions and learning algorithms. Table 2 presents different variants of analyzed topologies of the neural networks.

2.3.2. Random Forest

Random forest is a decision tree-based algorithm that is able to solve both regression and classification problems. Such trees consist of units called nodes in which the binary decisions are made. Based on the end of each tree, the solution to the problem is proposed. The overall solution of the problem is very often the average value of the solutions from each tree for regression problems or the most commonly appeared class for the trees. The algorithm may vary in terms of the number of trees in the forest and also the trees may vary in terms of the minimum splitting subset or the minimum number of instances in the leaves [29]. The analyzed variants of the random forest algorithm are presented in Table 3.

2.3.3. Cross-Validation

The numerical analyses for both algorithms were performed using fivefold cross-validation (presented in Figure 4) with a division into an independent data set of 70 data sets (about 80%) for the training process and eighteen data sets (about 20%) for the testing process. The topologies of the neural network and random forest algorithms were chosen after analyzing various numbers of inputs, learning algorithms, and the number of hidden neurons or trees. Schematically, the cross-validation test is presented in Figure 4. In each fold, different data are used for training and testing processes. It is very beneficial to avoid overfitting the algorithm.

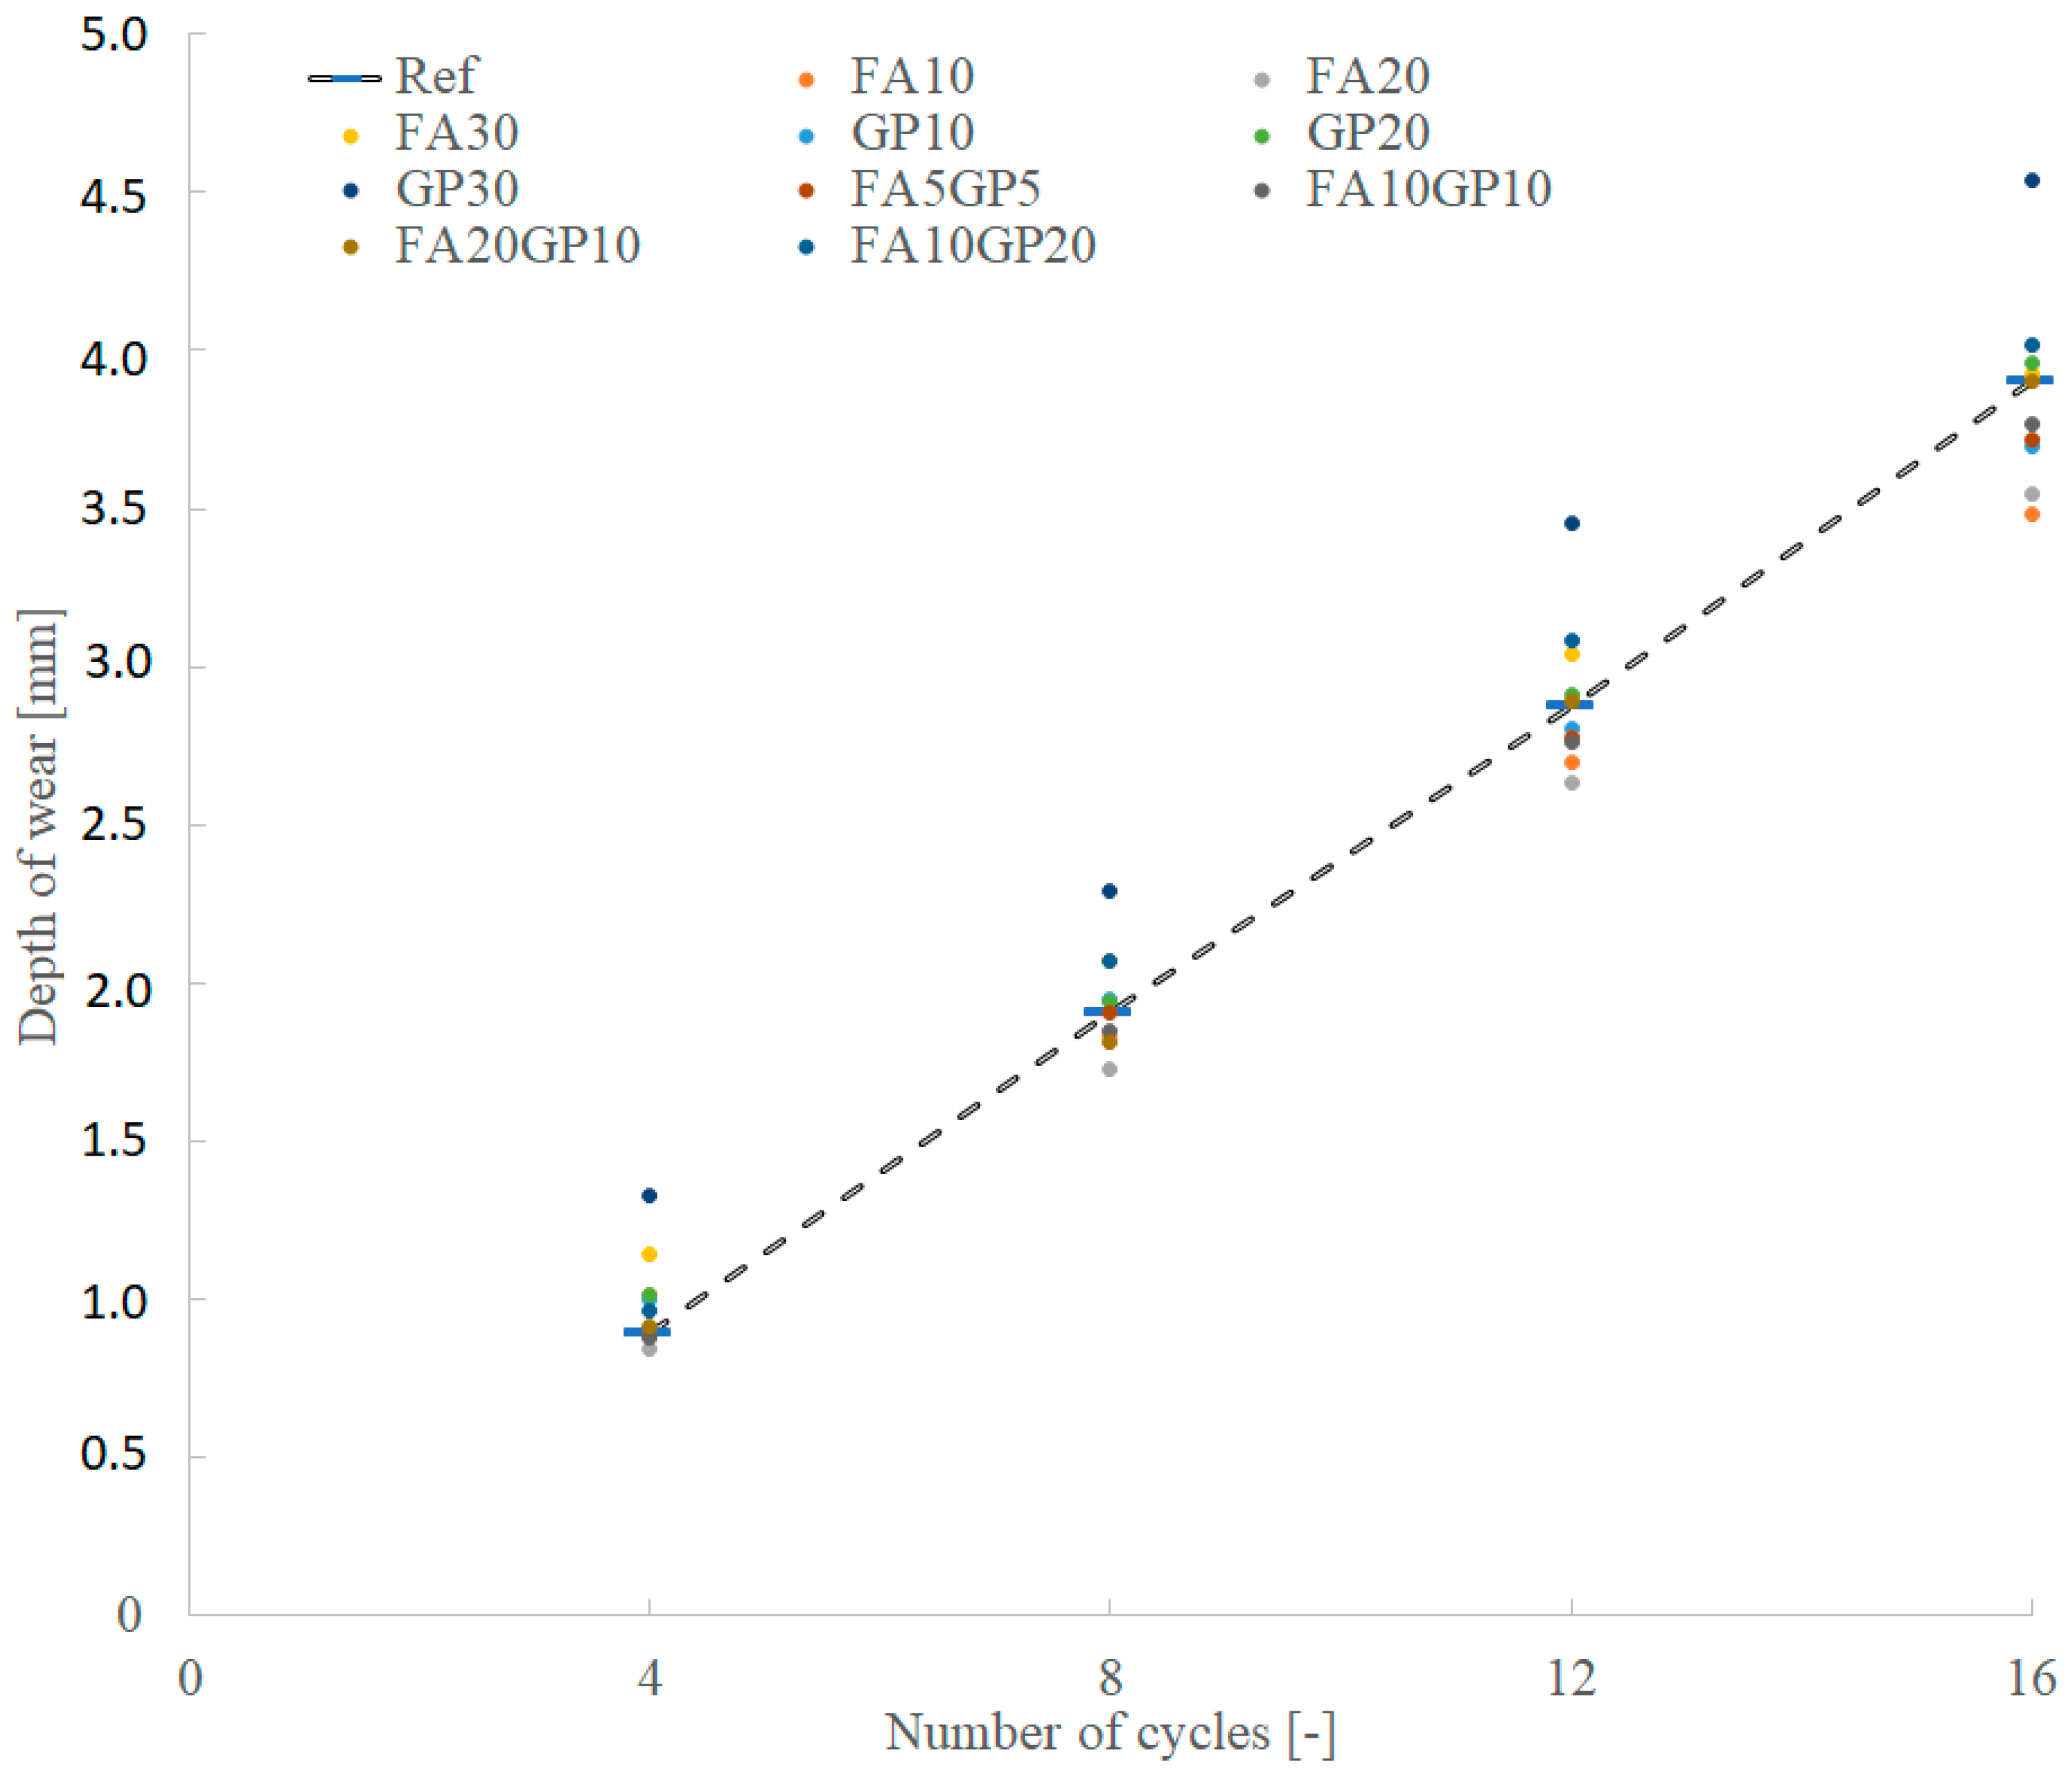
3. Results of Measurements and Their Short Analyses

Figure 5 and Figure 6 present the depth of wear as a function of time after 4, 8, 12, and 16 cycles. Because two samples were prepared for each configuration, the graph shows the average value of the depth of wear.
The results presented in Figure 5 and Figure 6 were based on the depth of wear parameter. According to these Figures, it can be seen that the number of cycles does not affect the linear increase in the depth of wear. According to Figure 6, it can be seen that the highest increase in the depth of wear values obtained experimentally was achieved for the specimens containing 30% of granite powder as a substitution for cement. Conversely, the lowest increase in the values of the depth of wear was obtained for the samples containing 10% of siliceous fly ash, and these values were also lower than for reference samples, which can be seen in Figure 6. According to Figure 5b, it can be observed that other samples, containing different proportions of granite powder (10% and 20% as substitutes of cement) were characterized with similar depth of wear values as the reference samples. However, according to Figure 5c, it can be seen that using both materials, fly ash and granite powder, in the mixtures combined does not affect the depth of wear in comparison to the reference samples. These differences are statistically not significant. While comparing the results in Figure 7, it also can be seen that most of the samples containing fly ash and fly ash with granite powder were characterized by a lower depth of wear when the number of cycles increases to more than the reference sample. These differences were the greatest for the measurements performed after 16 cycles. Again, the application of fly ash with granite powder for all configurations gives promising results.

4. Prediction

Current methods of determining abrasion resistance share similar disadvantages, including damaging sample surfaces and time-consuming testing. The possible transformation of some tests into prediction methods and, therefore, the optimization can be achieved by the ANN and RF. This can contribute to reducing the amount of destructive test methods in favor of prediction and, therefore, produce a sustainable approach. Created prediction algorithms were based on selected mortar components with the cycles of testing and mass of a sample after drying (Table 4). The output was assumed as the depth of wear. Water and sand were omitted, as the content for all samples stays the same. The total database consisted of 88 cases. One has to remember that the abrasion resistance of cementitious composites depends on several factors, including paste hardness, aggregate hardness, aggregate/paste bond, and compressive strength. Even when having perfect ingredients, other factors such as curing and surface finishing techniques can “spoil” the end result of abrasion resistance. Machine learning algorithms should not be treated as infallible tools. However, they can be helpful in terms of choosing amounts of ingredients to obtain desired abrasion resistance properties. It is recommended that the final mortar quality should be verified with additional methods, such as non-destructive tests (NDT).

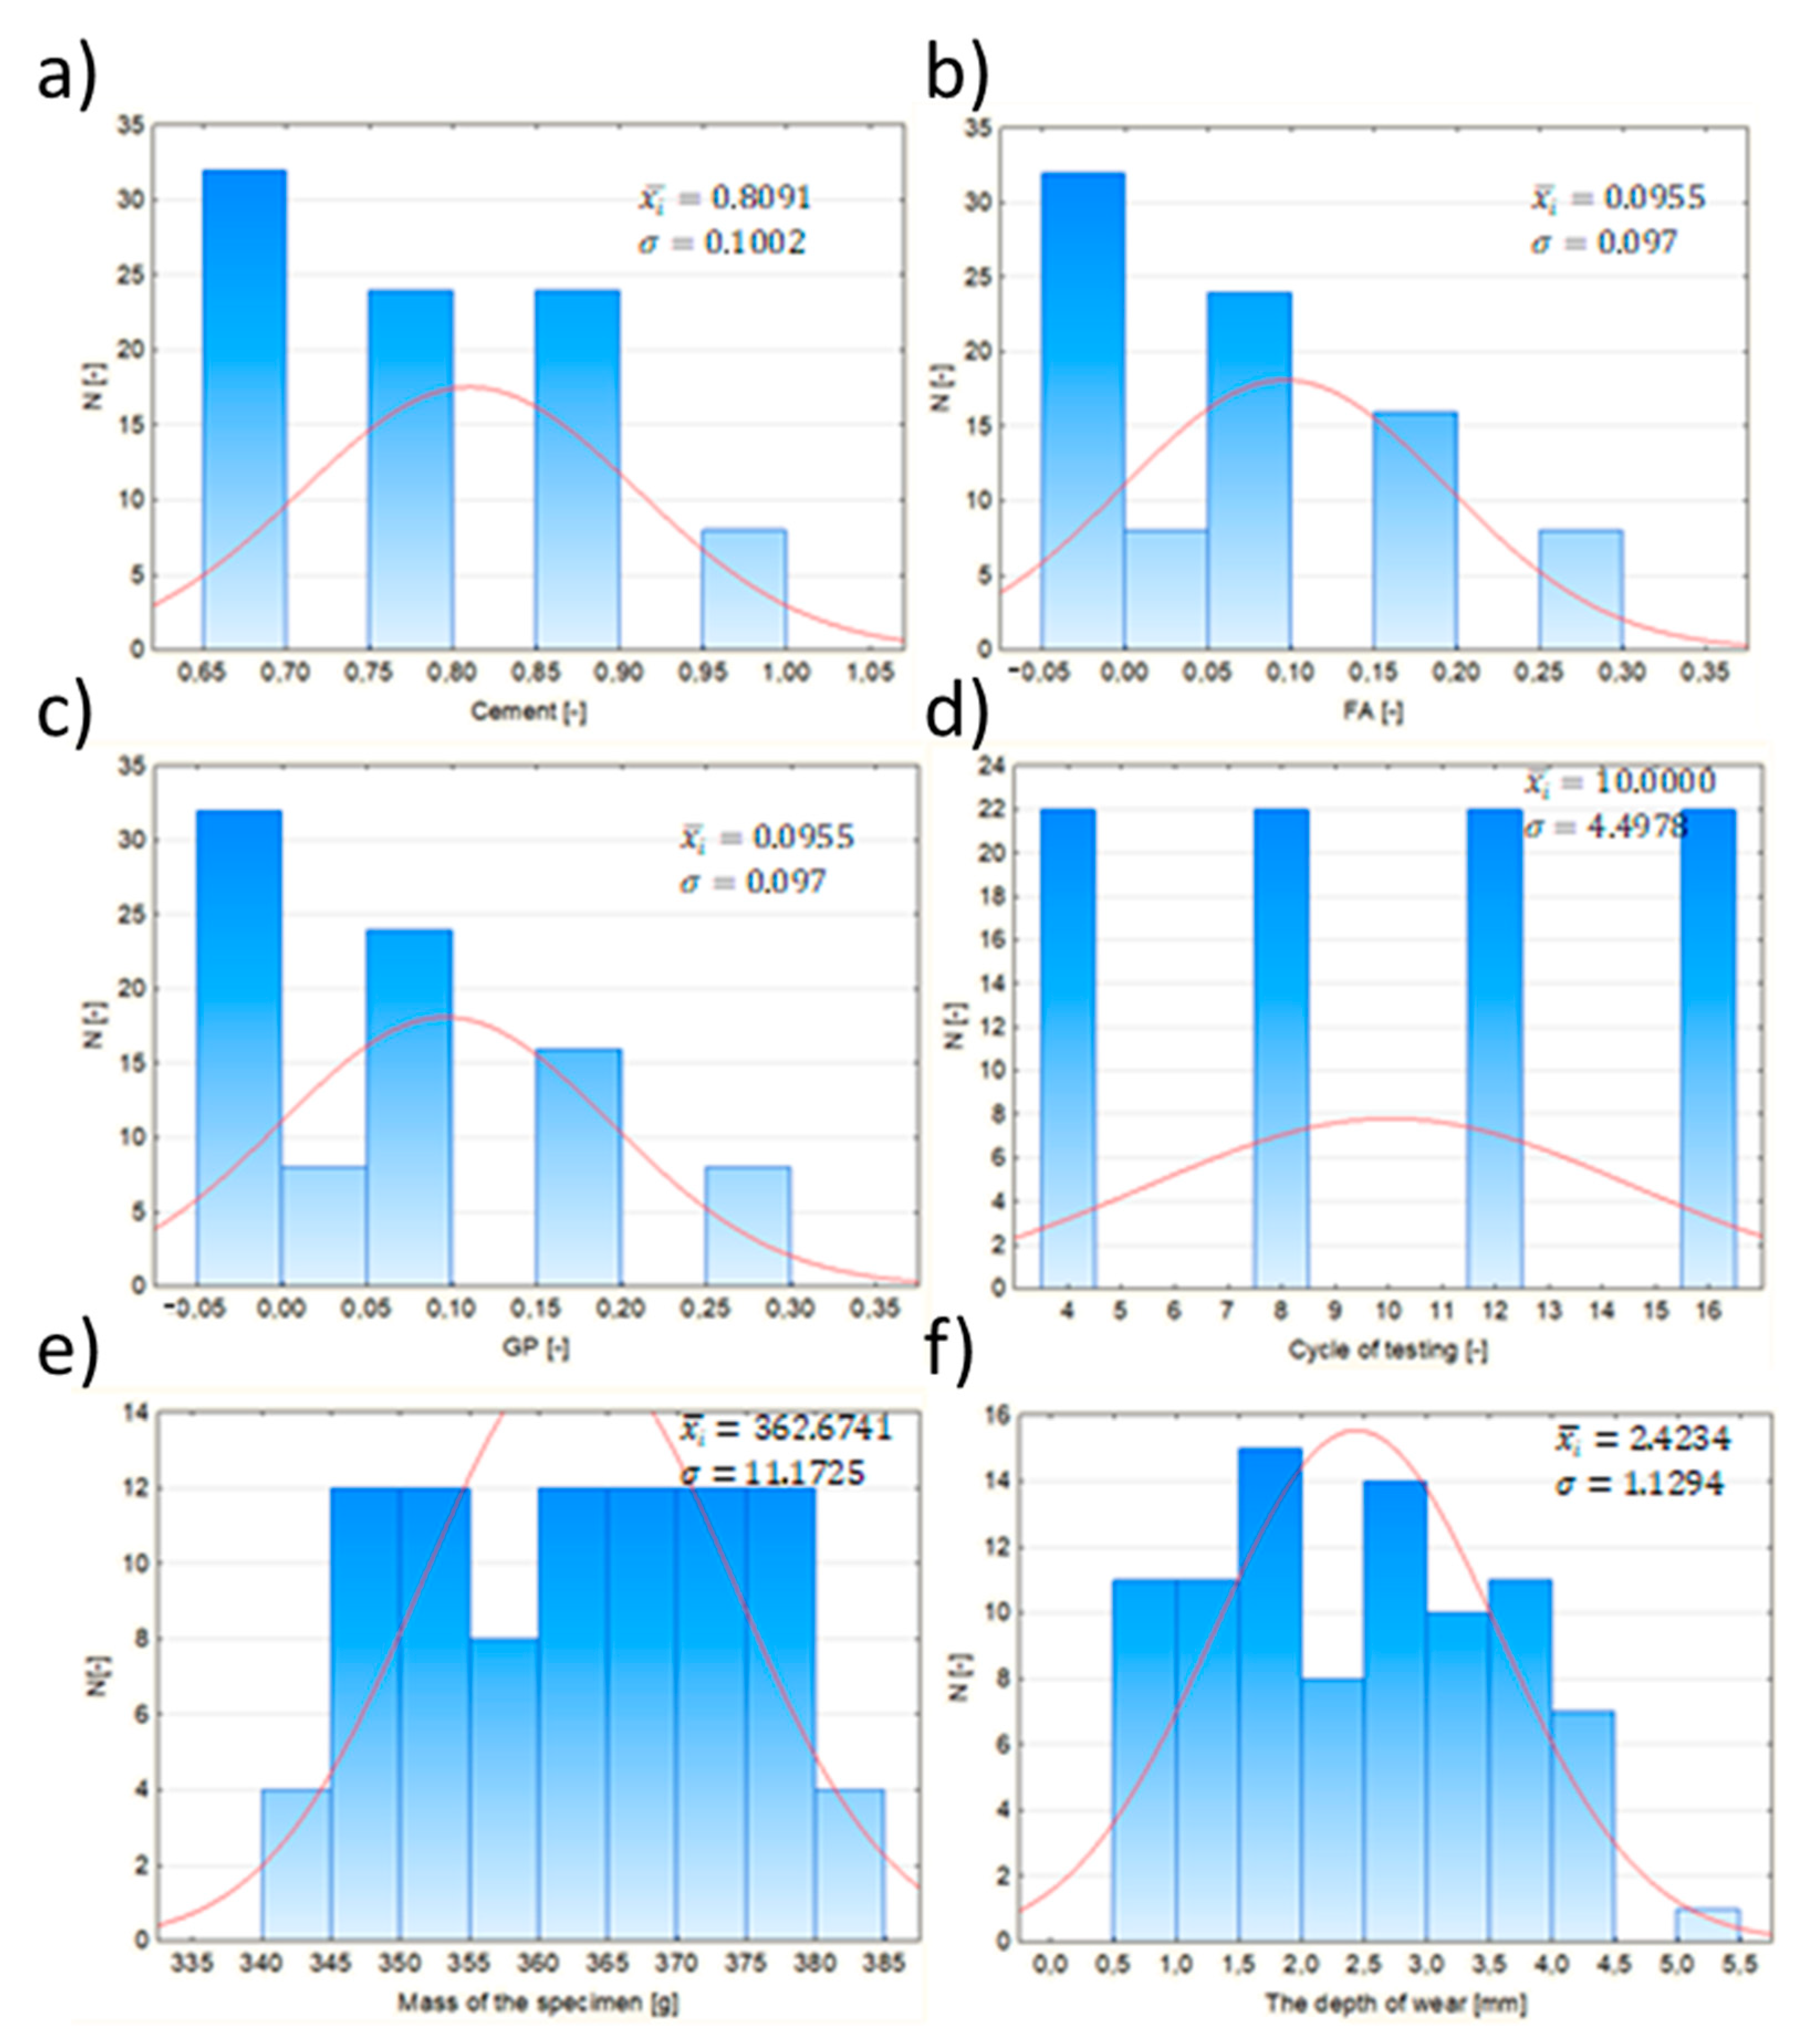
Statistical Analysis

Choosing the “right” inputs is a very important issue regarding the artificial neural network. In order to verify parameter chosen in the previous paragraph, statistical analysis was performed to establish whether samples came from a normally distributed population. This includes histograms (Figure 8) with a mean average (xi), standard deviation (σ), and the Shapiro–Wilk test.
For a chosen alpha level and significance α = 0.01, according to the null hypothesis of the Shapiro-Wilk test, if the p-value is less than the alpha level, the null hypothesis is rejected and the data tested are not normally distributed. If the p-value is greater than the chosen alpha level, the null hypothesis that the data came from a normally distributed population cannot be rejected [30]. The results of the Shapiro-Wilk test are presented in Table 5.
Based on these analyses, the most efficient ANN was the one with six input variables, thirteen neurons of one hidden layer, logistic activation functions of the layers (hidden and output), and the quasi-Newton learning algorithm. Using the random forest algorithm, the most efficient was the one with six input variables and two hundred trees. The results of the prediction of the depth of wear using a neural network and random forest are presented in Figure 9.
The results (Figure 9) were presented using the ANN and random forest. The coefficient of determination R2 represents the quality of the algorithms and, as seen from the graphs, it has not dropped below 0.935. Values of the root-mean-square errors equal to 0.278 for the ANN and equal to 0.281 for RF were relatively low, as were the values of the mean average percentage error, which were equal to 10.61% and 10.58% for the ANN and RF, respectively. The results confirm that it is possible to create a model predicting the abrasion resistance of mortars with granite powder and fly ash with satisfactory accuracy, as proved by others for concrete [24].

5. Discussion

In this article, the authors presented numerical models using machine learning algorithms for the prediction of abrasion resistance expressed as the depth of wear for cementitious composites containing waste materials, such as fly ash and granite powder. Comparing these two materials with similar ones used in other articles, it can be seen that in the case of siliceous fly ash, it has a lower amount of SiO2 (about 45%) in its composition than, for example, the work of [31], where this percentage amount is higher than 50%. Taking into account that in both works the CaO content in the composition is similar, it should be noted that the fly ash used in this study is more affected by different compounds.
Comparing granite powder’s composition, it should be emphasized that Lower Silesian granite is characterized by a lower percentage of SiO2 content (less than 55%) than, for example, those obtained in Spain (about 60%) [32] or China (about 70%) [33].
Comparing the influence of the addition of granite powder, fly ash, or both of them to the cementitious composites mixtures, we did not observed an influence on abrasion resistance like, for example, when adding silica fume, which increases this resistance, as denoted in [34].
While comparing the prediction models with others in the field, it can be seen that they are very accurate. For example, models evaluating the wear of the material of milling [35] and drilling [36] tools were treated as accurate when obtaining values of the coefficient of determination R2 between 0.86 and 0.96. Other parameters, that are veryimportant in construction practice and are used in describing the accuracy of the model, such as the mean average percentage error, which is equal to 10% or less and is treated as very accurate [37].

6. Conclusions

According to gathered sources, only a few attempts have been made to predict abrasion resistance for cementitious composites. As proven by a similar study [2], it is possible to predict the abrasion resistance for self-consolidating concrete based on the component’s content. However, no research on the prediction of the abrasion resistance for mortars with fly ash and/or granite powder as a partial cement replacement was found. The modeling of such material is important and is becoming more popular recently. Fly ash can contribute to the improvement of several mortar properties while granite powder can contribute to a reduction in the cement content, together with carbon footprint, which is in compliance with the circular economy.
Current knowledge of examining abrasion resistance for such mortars involves several disadvantages, including the application of devices that destroy the surface with the need to repair it afterward and examining samples created especially for testing to avoid damaging the pavement, which makes them differ in properties from the main structure or long-lasting laboratory tests. The application of an artificial neural network in abrasion resistance prediction can contribute to the optimization of the process. The assumption of input values into the network or random forest algorithm as mainly mortar components avoid much of the experimental part and allow the end result to be predicted even before the mix is made. These input parameters were the content ratio of cement, granite powder, and fly ash, combined with the number of cycles and the mass of the standardized sample before the test. The accuracy of the model is similar to other models in the field characterized by a good performance of prediction.
Taking into account that there are minor differences in the results of the tests between the reference samples and the samples of the mixtures containing granite powder and fly ash, it can be stated that in terms of abrasion resistance, these two materials do not deteriorate the property of the material. It is very beneficial when designing eco-friendly cementitious composites. Further research might be conducted by implementing other mineral materials suitable as additives for cementitious composites. It might be beneficial in terms of reducing the carbon footprint and getting closer to the zero-emission goal in the future.

Author Contributions

Conceptualization, S.C. and S.M.; methodology, A.C., S.C. and S.M.; software, S.C.; validation, S.C.; formal analysis, S.C.; investigation, A.C., S.M. and S.C.; resources, L.S.; data curation, S.C.; writing—original draft preparation, S.C., A.C., S.M. and L.S.; writing—review and editing, S.C. and L.S.; visualization, S.M. and S.C.; supervision, L.S.; project administration, L.S.; funding acquisition, L.S. All authors have read and agreed to the published version of the manuscript.

Funding

The authors received funding from the project supported by the National Centre for Research and Development, Poland (grant No. LIDER/35/0130/L-11/19/NCBR/2020 “The use of granite powder waste for the production of selected construction products”).

Institutional Review Board Statement

Not applicable.

Informed Consent Statement

Not applicable.

Data Availability Statement

The data are available upon request.

Conflicts of Interest

The authors declare no conflict of interest.

References

  1. Monteiro, P.J.M.; Miller, S.A.; Horvath, A. Towards sustainable concrete. Nat. Mater. 2017, 16, 698–699. [Google Scholar] [CrossRef] [PubMed]
  2. Maddalena, R.; Roberts, J.J.; Hamilton, A. Can Portland cement be replaced by low-carbon alternative materials? A study on the thermal properties and carbon emissions of innovative cements. J. Clean. Prod. 2018, 186, 933–942. [Google Scholar] [CrossRef]
  3. Barcelo, L.; Kline, J.; Walenta, G.; Gartner, E. Cement and carbon emissions. Mater. Struct. 2014, 47, 1055–1065. [Google Scholar] [CrossRef]
  4. Halstead, W.J. Use of fly ash in concrete. In NCHRP Synthesis of Highway Practice; Transportation Research Board: Washington, DC, USA, 1986. [Google Scholar]
  5. Golewski, G.L. Green concrete composite incorporating fly ash with high strength and fracture toughness. J. Clean. Prod. 2018, 172, 218–226. [Google Scholar] [CrossRef]
  6. Giergiczny, Z. Fly ash and slag. Cem. Concr. Res. 2019, 124, 105826. [Google Scholar] [CrossRef]
  7. Singh, S.; Nagar, R.; Agrawal, V. A review on Properties of Sustainable Concrete using granite dust as replacement for river sand. J. Clean. Prod. 2016, 126, 74–87. [Google Scholar] [CrossRef]
  8. Gerasimova, E.; Kapustin, F.; Rogante, M.; Kochnev, D. Granite Dust is the Possible Component of the Dry Construction Mixtures. In Proceedings of the International Conference with Elements of School for Young Scientists on Recycling and Utilization of Technogenic Formations, Ekaterinburg, Russia, 5–8 June 2017; Knowledge E: Dubai, United Arab Emirates, 2017; pp. 109–115. [Google Scholar]
  9. Abukersh, S.A.; Fairfield, C.A. Recycled aggregate concrete produced with red granite dust as a partial cement replacement. Constr. Build. Mater. 2011, 25, 4088–4094. [Google Scholar] [CrossRef]
  10. Horszczaruk, E. Abrasion resistance of industrial concrete floors. Mater. Bud. 2014, 9, 4–6. [Google Scholar]
  11. Scott, B.D.; Safiuddin, M. Abrasion resistance of concrete–Design, construction and case study. Concr. Res. Lett. 2015, 6, 136–148. [Google Scholar]
  12. Naik, T.R.; Singh, S.S.; Ramme, B.W. Effect of source of fly ash on abrasion resistance of concrete. J. Mater. Civ. Eng. 2012, 14, 417–426. [Google Scholar] [CrossRef] [Green Version]
  13. Yazici, Ş.; Sezer, G.İ. Abrasion Resistance Estimation of High Strength Concrete. J. Eng. Sci. 2007, 13, 1–6. [Google Scholar]
  14. Amini, K.; Sadati, S.; Ceylan, H.; Taylor, P.C. Effects of mixture proportioning, curing, and finishing on concrete surface hardness. ACI Mater. J. 2019, 116, 119–126. [Google Scholar] [CrossRef]
  15. EN 13892-3:2015-02; Methods of Test for Screed Materials—Part 3: Determination of Wear Resistance—Böhme. PKN: Warsaw, Poland, 2015.
  16. Li, L.G.; Wang, Y.M.; Tan, Y.P.; Kwan, A.K.H. Filler technology of adding granite dust to reduce cement content and increase strength of mortar. Powder Technol. 2019, 342, 388–396. [Google Scholar] [CrossRef]
  17. Atiş, C.D. High volume fly ash abrasion resistant concrete. J. Mater. Civ. Eng. 2002, 14, 274–277. [Google Scholar] [CrossRef]
  18. Naik, T.R.; Singh, S.S.; Hossain, M.M. Abrasion resistance of concrete as influenced by inclusion of fly ash. Cem. Concr. Res. 1994, 24, 303–312. [Google Scholar] [CrossRef]
  19. Jain, A.; Choudhary, R.; Gupta, R.; Chaudhary, S. Abrasion resistance and sorptivity characteristics of SCC containing granite waste. Mater. Today Proc. 2020, 27, 524–528. [Google Scholar] [CrossRef]
  20. Binici, H.; Shah, T.; Aksogan, O.; Kaplan, H. Durability of concrete made with granite and marble as recycle aggregates. J. Mater. Process. Technol. 2008, 208, 299–308. [Google Scholar] [CrossRef]
  21. Felixkala, T.; Partheeban, P. Granite powder concrete. Indian J. Sci. Technol. 2010, 3, 311–317. [Google Scholar] [CrossRef]
  22. Czarnecki, S.; Shariq, M.; Nikoo, M.; Sadowski, L. An intelligent model for the prediction of the compressive strength of cementitious composites with ground granulated blast furnace slag based on ultrasonic pulse velocity measurements. Measurement 2021, 172, 108951. [Google Scholar] [CrossRef]
  23. Golafshani, E.M.; Behnood, A. Application of soft computing methods for predicting the elastic modulus of recycled aggregate concrete. J. Clean. Prod. 2018, 176, 1163–1176. [Google Scholar] [CrossRef]
  24. Malazdrewicz, S.; Sadowski, Ł. An intelligent model for the prediction of the depth of the wear of cementitious composite modified with high-calcium fly ash. Compos. Struct. 2021, 259, 113234. [Google Scholar] [CrossRef]
  25. Heidari, A.; Hashempour, M.; Javdanian, H.; Karimian, M. Investigation of mechanical properties of mortar with mixed recycled aggregates. Asian J. Civ. Eng. 2018, 19, 583–593. [Google Scholar] [CrossRef]
  26. Lau, C.K.; Lee, H.; Vimonsatit, V.; Huen, W.Y.; Chindaprasirt, P. Abrasion resistance behaviour of fly ash based geopolymer using nanoindentation and artificial neural network. Constr. Build. Mater. 2019, 212, 635–644. [Google Scholar] [CrossRef]
  27. PN-EN 12350-6:2019-08; Testing Fresh Concrete—Part 6: Density. PKN: Warsaw, Poland, 2019.
  28. Işık, E.; Ademović, N.; Harirchian, E.; Avcil, F.; Büyüksaraç, A.; Hadzima-Nyarko, M.; Akif Bülbül, M.; Işık, M.F.; Antep, B. Determination of Natural Fundamental Period of Minarets by Using Artificial Neural Network and Assess the Impact of Different Materials on Their Seismic Vulnerability. Appl. Sci. 2023, 13, 809. [Google Scholar] [CrossRef]
  29. Yari, M.; Armaghani, D.J.; Maraveas, C.; Ejlali, A.N.; Mohamad, E.T.; Asteris, P.G. Several Tree-Based Solutions for Predicting Flyrock Distance Due to Mine Blasting. Appl. Sci. 2023, 13, 1345. [Google Scholar] [CrossRef]
  30. Ghafoori, N.; Najimi, M.; Sobhani, J. Modelling the abrasion resistance of self-consolidating concrete. Mag. Concr. Res. 2015, 67, 938–953. [Google Scholar] [CrossRef]
  31. Waqas, R.M.; Butt, F.; Zhu, X.; Jiang, T.; Tufail, R.F. A Comprehensive Study on the Factors Affecting the Workability and Mechanical Properties of Ambient Cured Fly Ash and Slag Based Geopolymer Concrete. Appl. Sci. 2021, 11, 8722. [Google Scholar] [CrossRef]
  32. Gayarre, F.L.; Suárez González, J.; Lopez Boadella, I.; López-Colina Pérez, C.; Serrano López, M. Use of Waste from Granite Gang Saws to Manufacture Ultra-High Performance Concrete Reinforced with Steel Fibers. Appl. Sci. 2021, 11, 1764. [Google Scholar] [CrossRef]
  33. Luo, Y.; Bao, S.; Zhang, Y. Recycling of granite powder and waste marble produced from stone processing for the preparation of architectural glass–ceramic. Constr. Build. Mater. 2022, 346, 128408. [Google Scholar] [CrossRef]
  34. Wang, Q.; Liu, R.; Liu, P.; Liu, C.; Sun, L.; Zhang, H. Effects of silica fume on the abrasion resistance of low-heat Portland cement concrete. Constr. Build. Mater. 2022, 329, 127165. [Google Scholar] [CrossRef]
  35. He, Z.; Shi, T.; Xuan, J. Milling tool wear prediction using multi-sensor feature fusion based on stacked sparse autoencoders. Measurement 2022, 190, 110719. [Google Scholar] [CrossRef]
  36. Hu, S.; Liu, H.; Feng, Y.; Cui, C.; Ma, Y.; Zhang, G.; Huang, X. Tool Wear Prediction in Glass Fiber Reinforced Polymer Small-Hole Drilling Based on an Improved Circle Chaotic Mapping Grey Wolf Algorithm for BP Neural Network. Appl. Sci. 2023, 13, 2811. [Google Scholar] [CrossRef]
  37. Czarnecki, S.; Sadowski, Ł.; Hoła, J. Evaluation of interlayer bonding in layered composites based on non-destructive measurements and machine learning: Comparative analysis of selected learning algorithms. Autom. Constr. 2021, 132, 103977. [Google Scholar] [CrossRef]
Figure 1. Chemical composition of ingredients used in the research. (a) Cement, (b) siliceous fly ash, and (c) granite powder.
Applsci 13 04011 g001
Figure 2. Sieve size development of granular materials used in this research.
Applsci 13 04011 g002
Figure 3. Photos from research conducting the (a) sample before the abrasion resistance test, the (b) abrasion resistance test, and the (c) sample after the abrasion resistance test.
Applsci 13 04011 g003
Figure 4. Data set division in fivefold cross-validation.
Applsci 13 04011 g004
Figure 5. The results of the depth of wear as a function of the number of cycles for samples with (a) fly ash, (b) granite powder, and (c) fly ash and granite powder.
Applsci 13 04011 g005
Figure 6. The results of the depth of wear in comparison with the reference sample.
Applsci 13 04011 g006
Figure 7. Results presenting the average (a) depth of wear and the (b) loss of mass for all samples.
Applsci 13 04011 g007
Figure 8. Histograms with mean average ( x i _ ) and standard deviation ( σ ) for (a) cement, (b) fly ash, (c) granite powder, (d) cycle of testing, (e) mass of the specimen, and (f) the depth of wear.
Applsci 13 04011 g008
Figure 9. Results of the prediction for the (a) ANN and (b) random forest.
Applsci 13 04011 g009
Table 1. The series compositions of the cementitious mortar mixes.
No.SeriesCementWaterw/cw/bFAGPBinderSand
1Ref10.50.500.500013
2FA100.90.50.560.500.1013
3FA200.80.50.630.500.2013
4FA300.70.50.710.500.3013
5GP100.90.50.560.5000.113
6GP200.80.50.630.5000.213
7GP300.70.50.710.5000.313
85FA + 5GP0.90.50.560.500.050.0513
910FA + 10GP0.80.50.630.500.10.113
1020FA + 10GP0.70.50.710.500.20.113
1110FA + 20GP0.70.50.710.500.10.213
Table 2. Variants of the analyzed topologies of the artificial neural network (ANN).
Number of InputsNumber of Hidden LayersNumber of Hidden NeuronsActivation FunctionsLearning Algorithms
From 1 to 51 or 2From 1 to 20Linear
Sinus
Tanh
Logistic
Exponential
Quasi-Newton
Levenberg–Marquardt, Conjugate Gradient
Table 3. Variants of the analyzed topologies of the random forest (RF).
Variants of InputsNumber of TreesMinimum Splitting SubsetMinimum Number of Instances in Leaves
From 1 to 5Up to 50052
Table 4. Selected input and output parameters.
No.SeriesCement [-]Fly Ash [-]Granite Powder [-]Number of CyclesMass of the Sample [g]Depth of Wear [mm]
1REF1004356.560.79
2REF1004373.211.00
3FA100.90.104362.150.98
4FA100.90.104354.241.05
5FA200.80.204370.630.74
6FA200.80.204357.840.95
7FA300.70.304362.151.01
8FA300.70.304354.241.29
9GP100.900.14378.541.08
10GP100.900.14345.970.92
11GP200.800.24368.280.89
12GP200.800.24345.821.14
13GP300.700.34366.041.16
14GP300.700.34343.561.50
15FA5GP50.90.050.054380.161.08
16FA5GP50.90.050.054349.80.70
17FA10GP100.80.10.14373.290.60
18FA10GP100.80.10.14365.791.16
19FA20GP100.70.20.14375.290.94
20FA20GP100.70.20.14361.130.89
21FA10GP200.70.10.24379.720.66
22FA10GP200.70.10.24354.421.27
23REF1008356.561.87
24REF1008373.211.94
25FA100.90.108362.151.81
26FA100.90.108354.241.86
27FA200.80.208370.631.64
28FA200.80.208357.841.81
29FA300.70.308362.151.86
30FA300.70.308354.242.28
31GP100.900.18378.542.19
32GP100.900.18345.971.71
33GP200.800.28368.281.77
34GP200.800.28345.822.12
35GP300.700.38366.041.91
36GP300.700.38343.562.67
37FA5GP50.90.050.058380.162.01
38FA5GP50.90.050.058349.81.80
39FA10GP100.80.10.18373.291.50
40FA10GP100.80.10.18365.792.20
41FA20GP100.70.20.18375.292.00
42FA20GP100.70.20.18361.131.63
43FA10GP200.70.10.28379.721.65
44FA10GP200.70.10.28354.422.48
45REF10012356.562.89
46REF10012373.212.86
47FA100.90.1012362.152.72
48FA100.90.1012354.242.67
49FA200.80.2012370.632.54
50FA200.80.2012357.842.73
51FA300.70.3012362.152.80
52FA300.70.3012354.243.28
53GP100.900.112378.542.98
54GP100.900.112345.972.62
55GP200.800.212368.282.69
56GP200.800.212345.823.14
57GP300.700.312366.043.01
58GP300.700.312343.563.90
59FA5GP50.90.050.0512380.162.93
60FA5GP50.90.050.0512349.82.62
61FA10GP100.80.10.112373.292.30
62FA10GP100.80.10.112365.793.23
63FA20GP100.70.20.112375.293.31
64FA20GP100.70.20.112361.132.48
65FA10GP200.70.10.212379.722.58
66FA10GP200.70.10.212354.423.58
67REF10016356.563.96
68REF10016373.213.84
69FA100.90.1016362.153.52
70FA100.90.1016354.243.44
71FA200.80.2016370.633.41
72FA200.80.2016357.843.68
73FA300.70.3016362.153.62
74FA300.70.3016354.244.22
75GP100.900.116378.544.02
76GP100.900.116345.973.37
77GP200.800.216368.283.60
78GP200.800.216345.824.32
79GP300.700.316366.044.06
80GP300.700.316343.565.02
81FA5GP50.90.050.0516380.163.84
82FA5GP50.90.050.0516349.83.60
83FA10GP100.80.10.116373.293.13
84FA10GP100.80.10.116365.794.40
85FA20GP100.70.20.116375.294.41
86FA20GP100.70.20.116361.133.40
87FA10GP200.70.10.216379.723.57
88FA10GP200.70.10.216354.424.47
Table 5. Results of the Shapiro–Wilk test.
ParameterW [-]α [-]Alpha Level [-]
Cement0.84310.010.955
Fly ash0.83630.010.955
Granite powder0.83630.010.955
Cycle of testing0.85580.010.955
Mas of the specimen0.94710.010.955
The depth of wear0.96200.010.955
Disclaimer/Publisher’s Note: The statements, opinions and data contained in all publications are solely those of the individual author(s) and contributor(s) and not of MDPI and/or the editor(s). MDPI and/or the editor(s) disclaim responsibility for any injury to people or property resulting from any ideas, methods, instructions or products referred to in the content.

