
Methodological Issues in Evaluating Machine Learning Models for EEG Seizure Prediction: Good Cross-Validation Accuracy Does Not Guarantee Generalization to New Patients

 ,
,  , , , , , and
Abstract
:1. Introduction
2. Materials and Methods
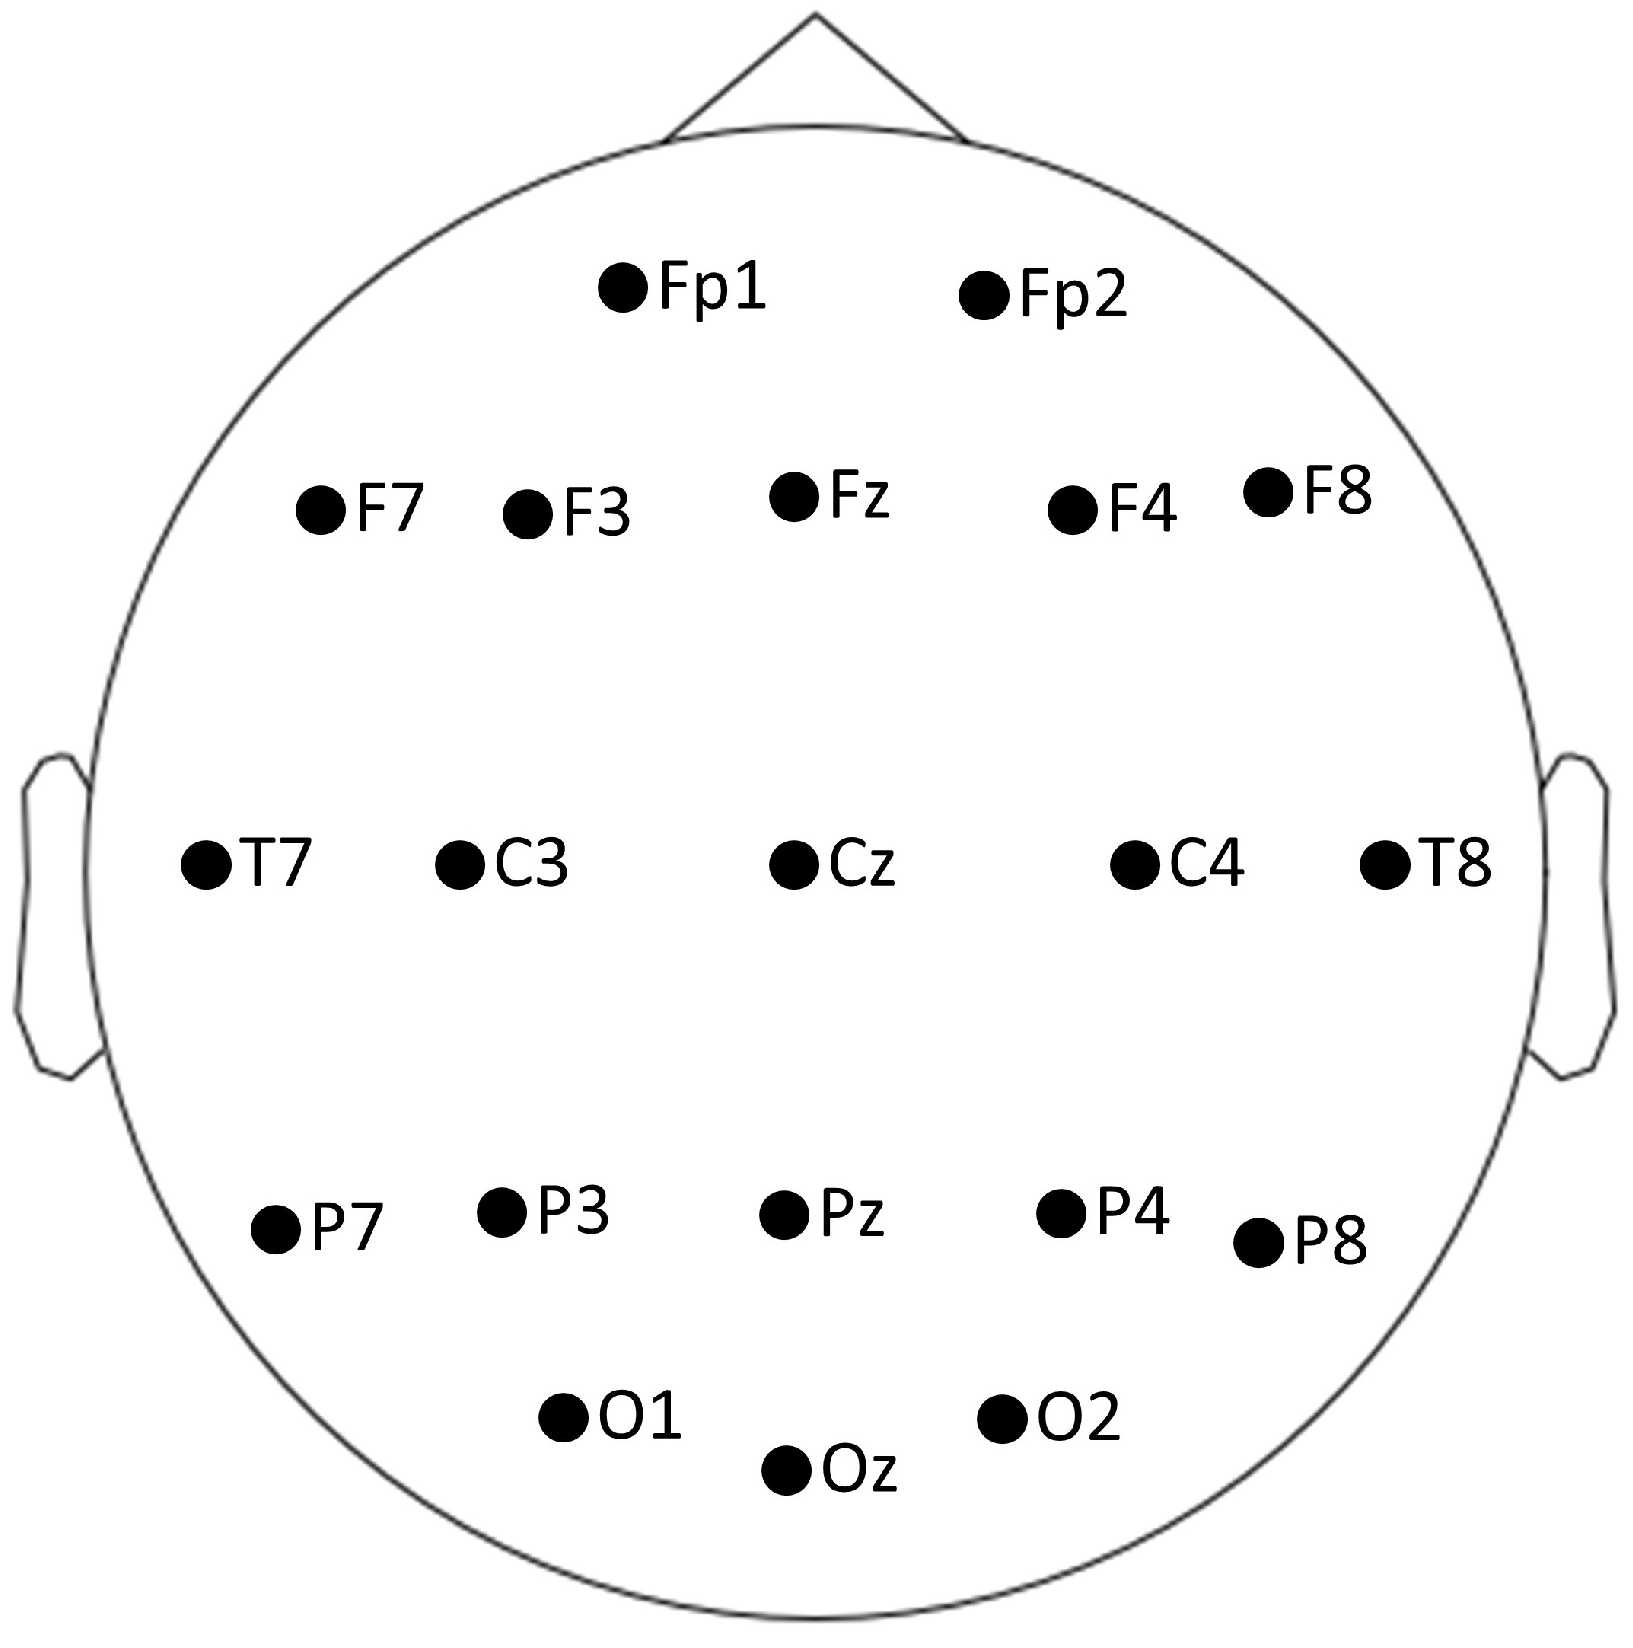
2.1. EEG Data Sets
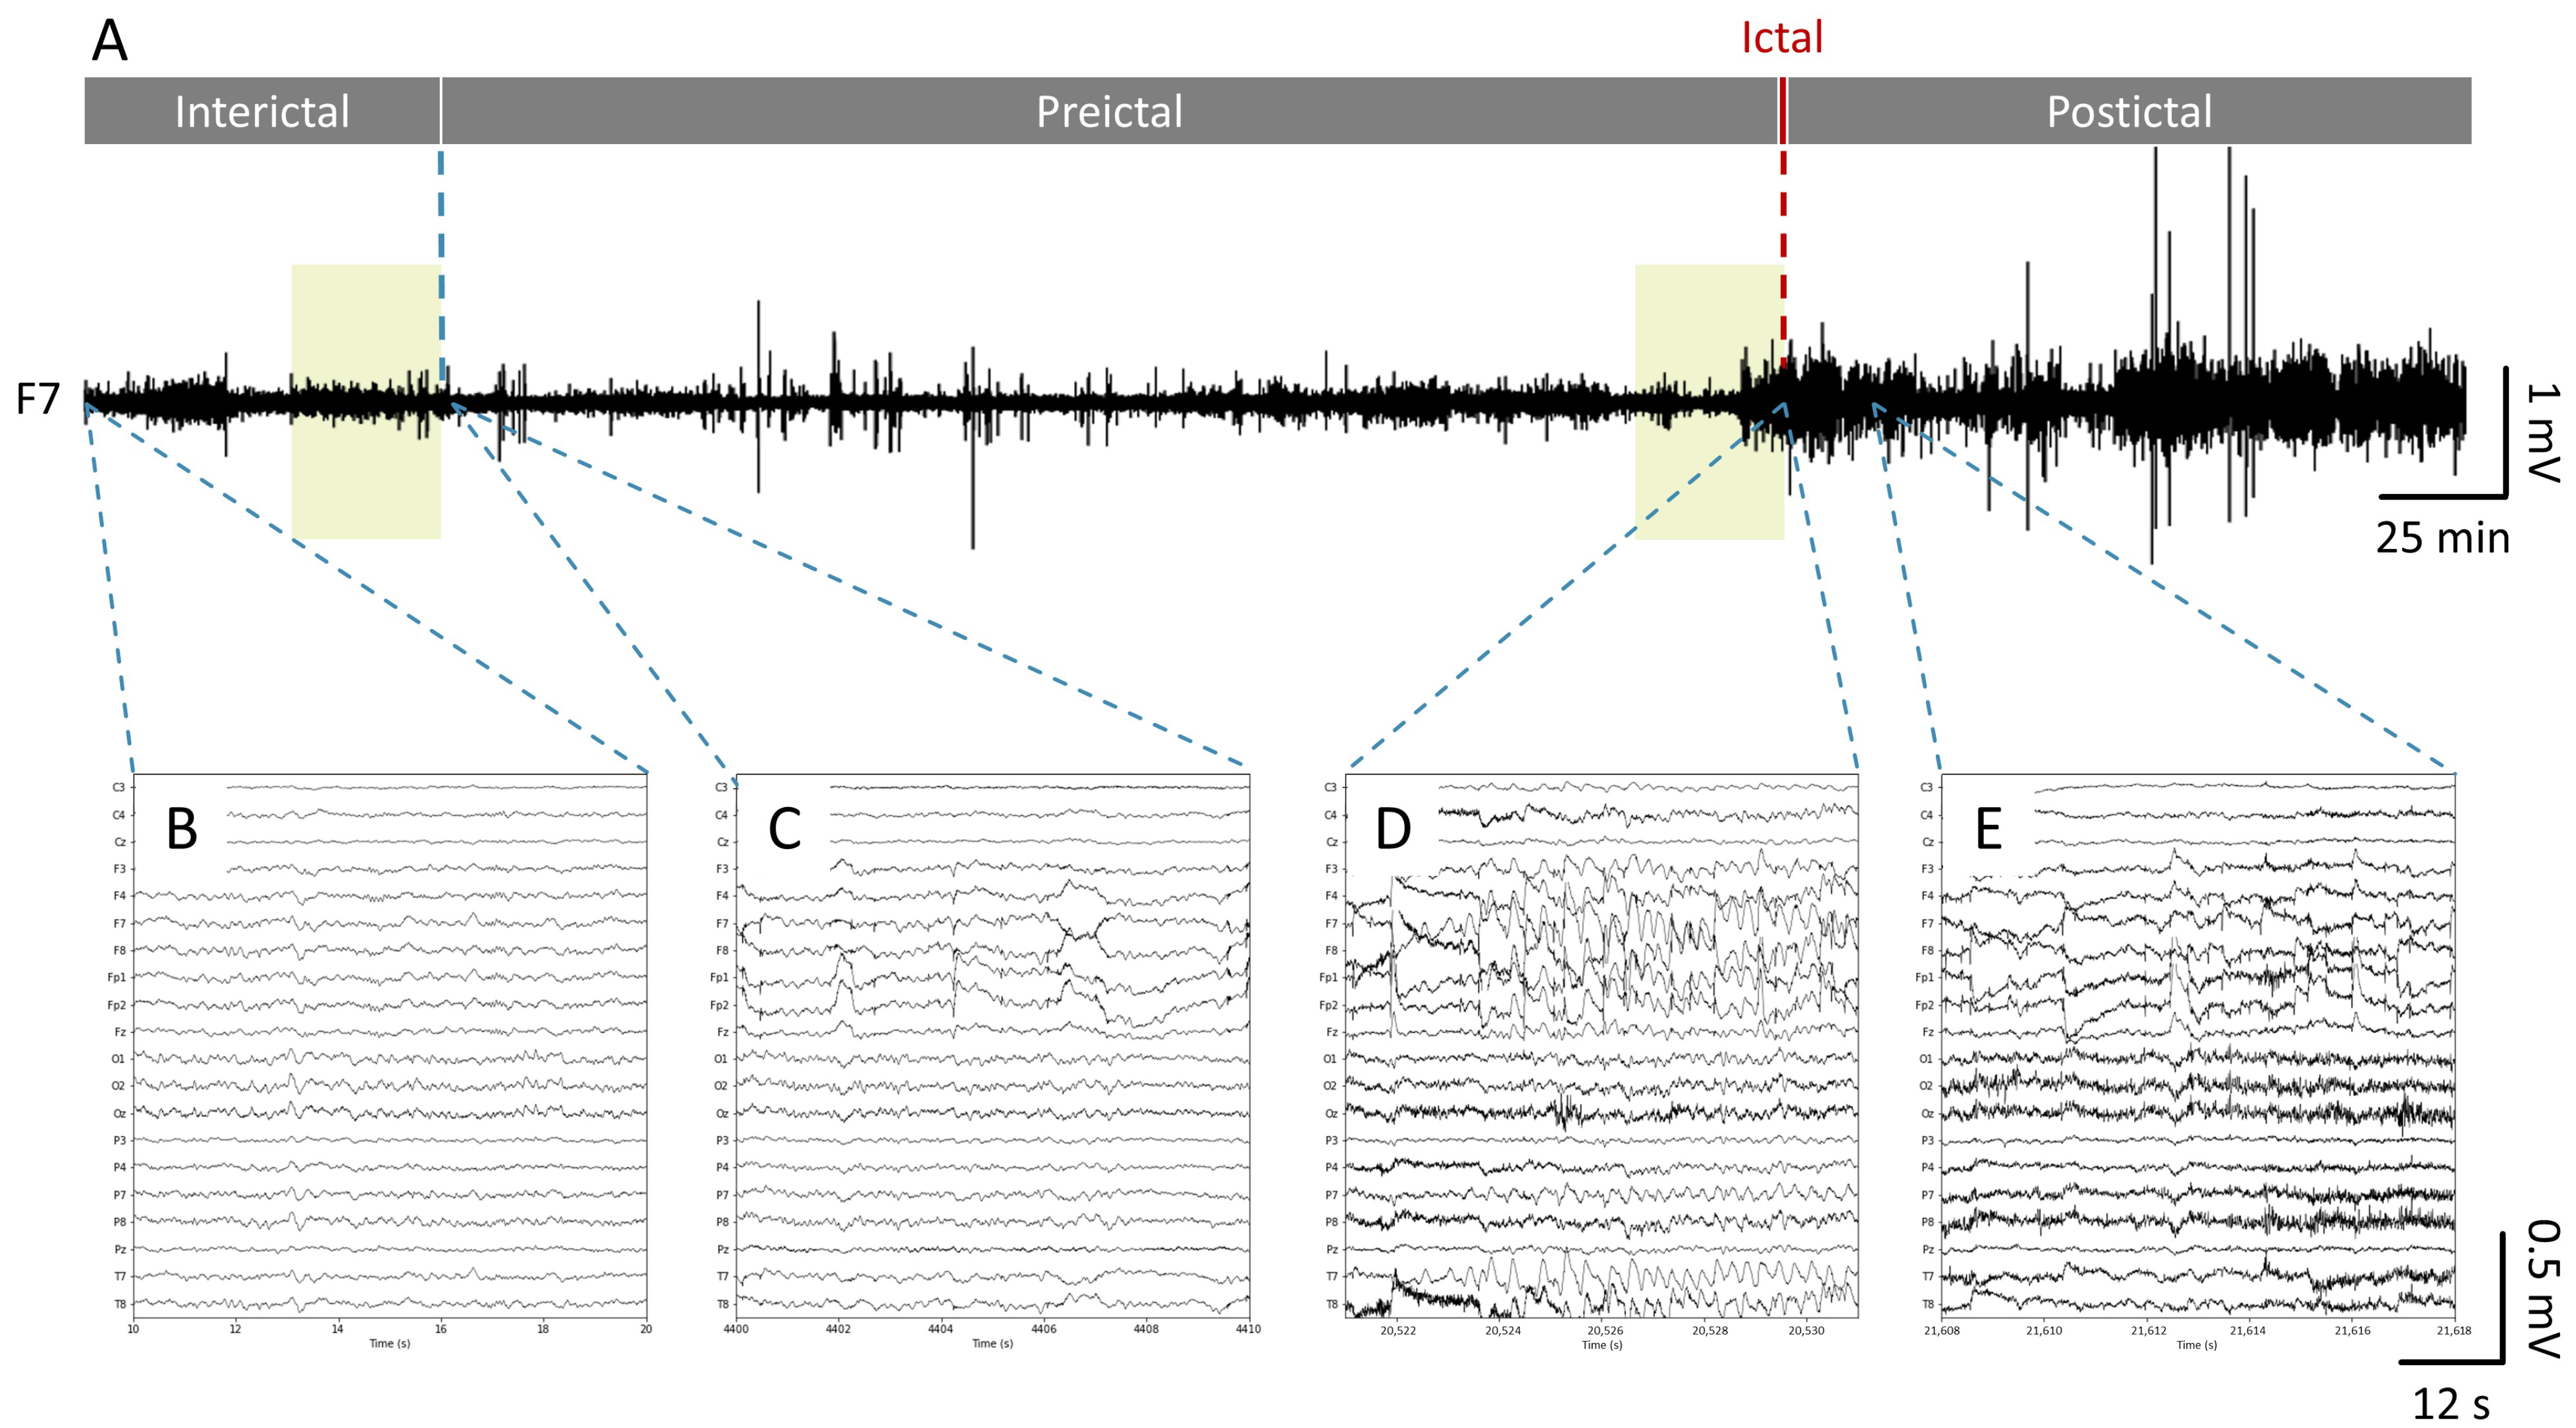
2.2. Data Labeling
2.3. Data Preprocessing and Feature Extraction
2.4. Machine Learning Models
2.5. Model Evaluation
3. Results
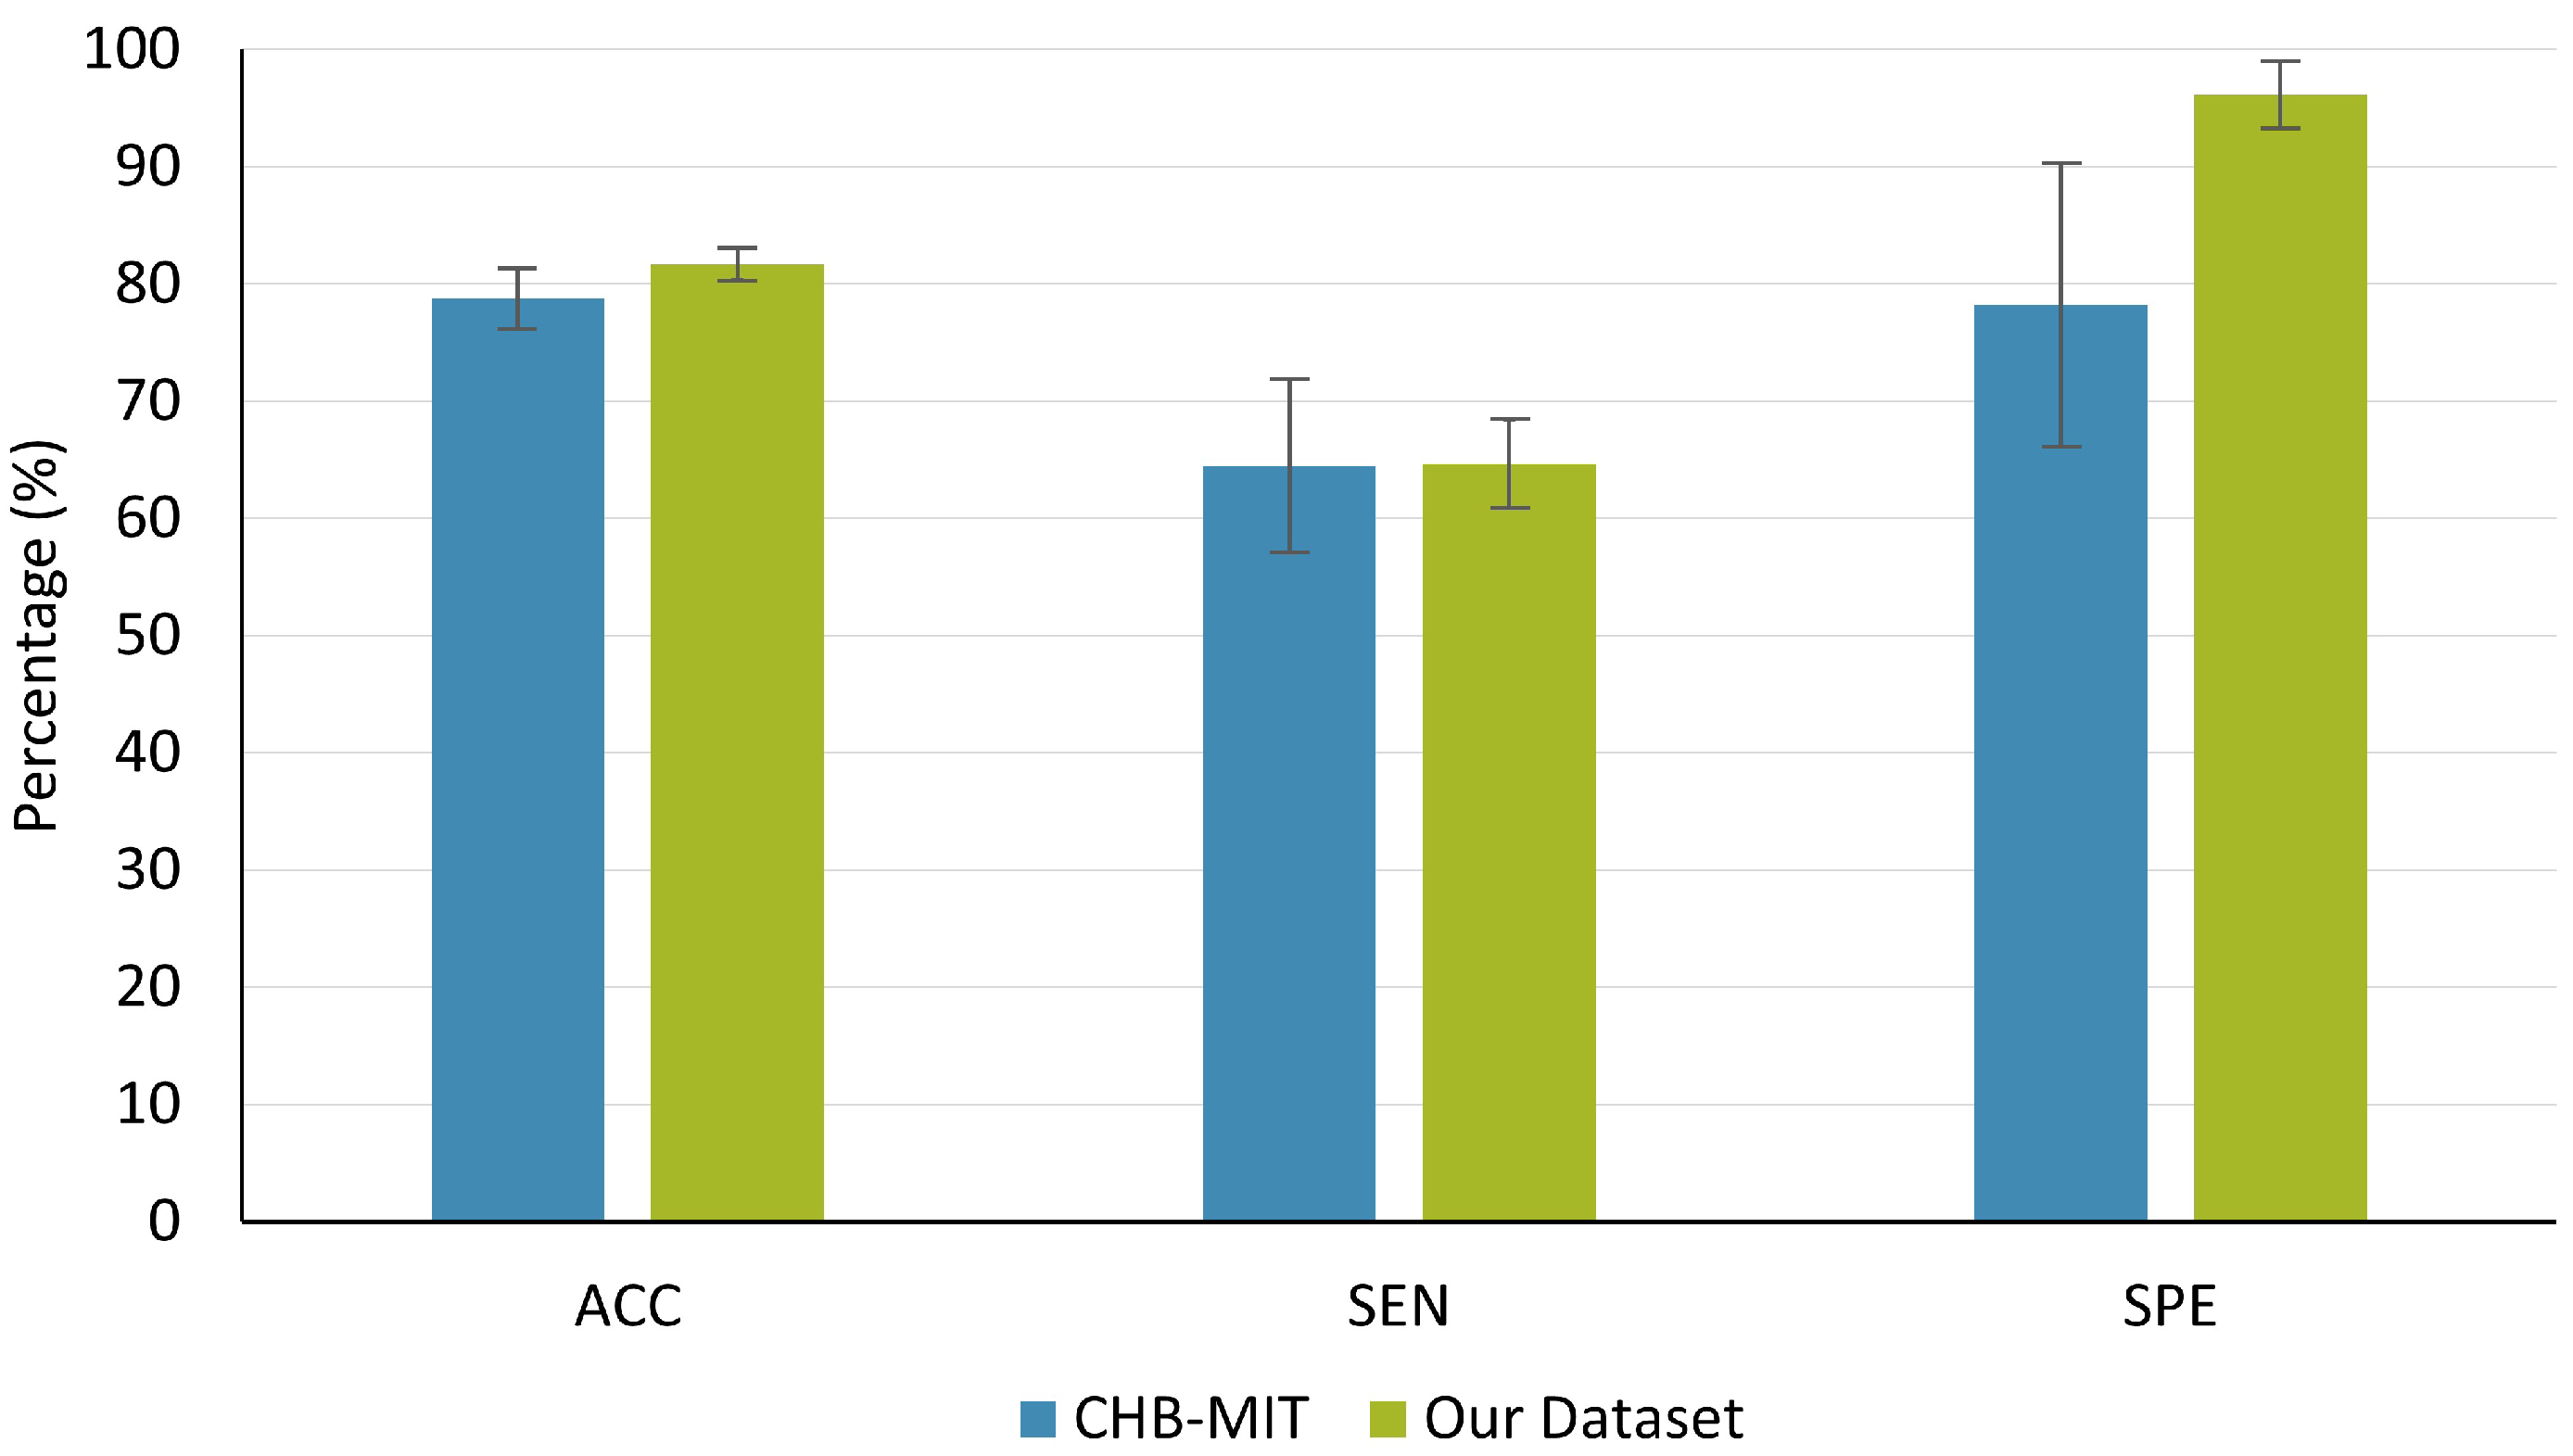
3.1. RCV
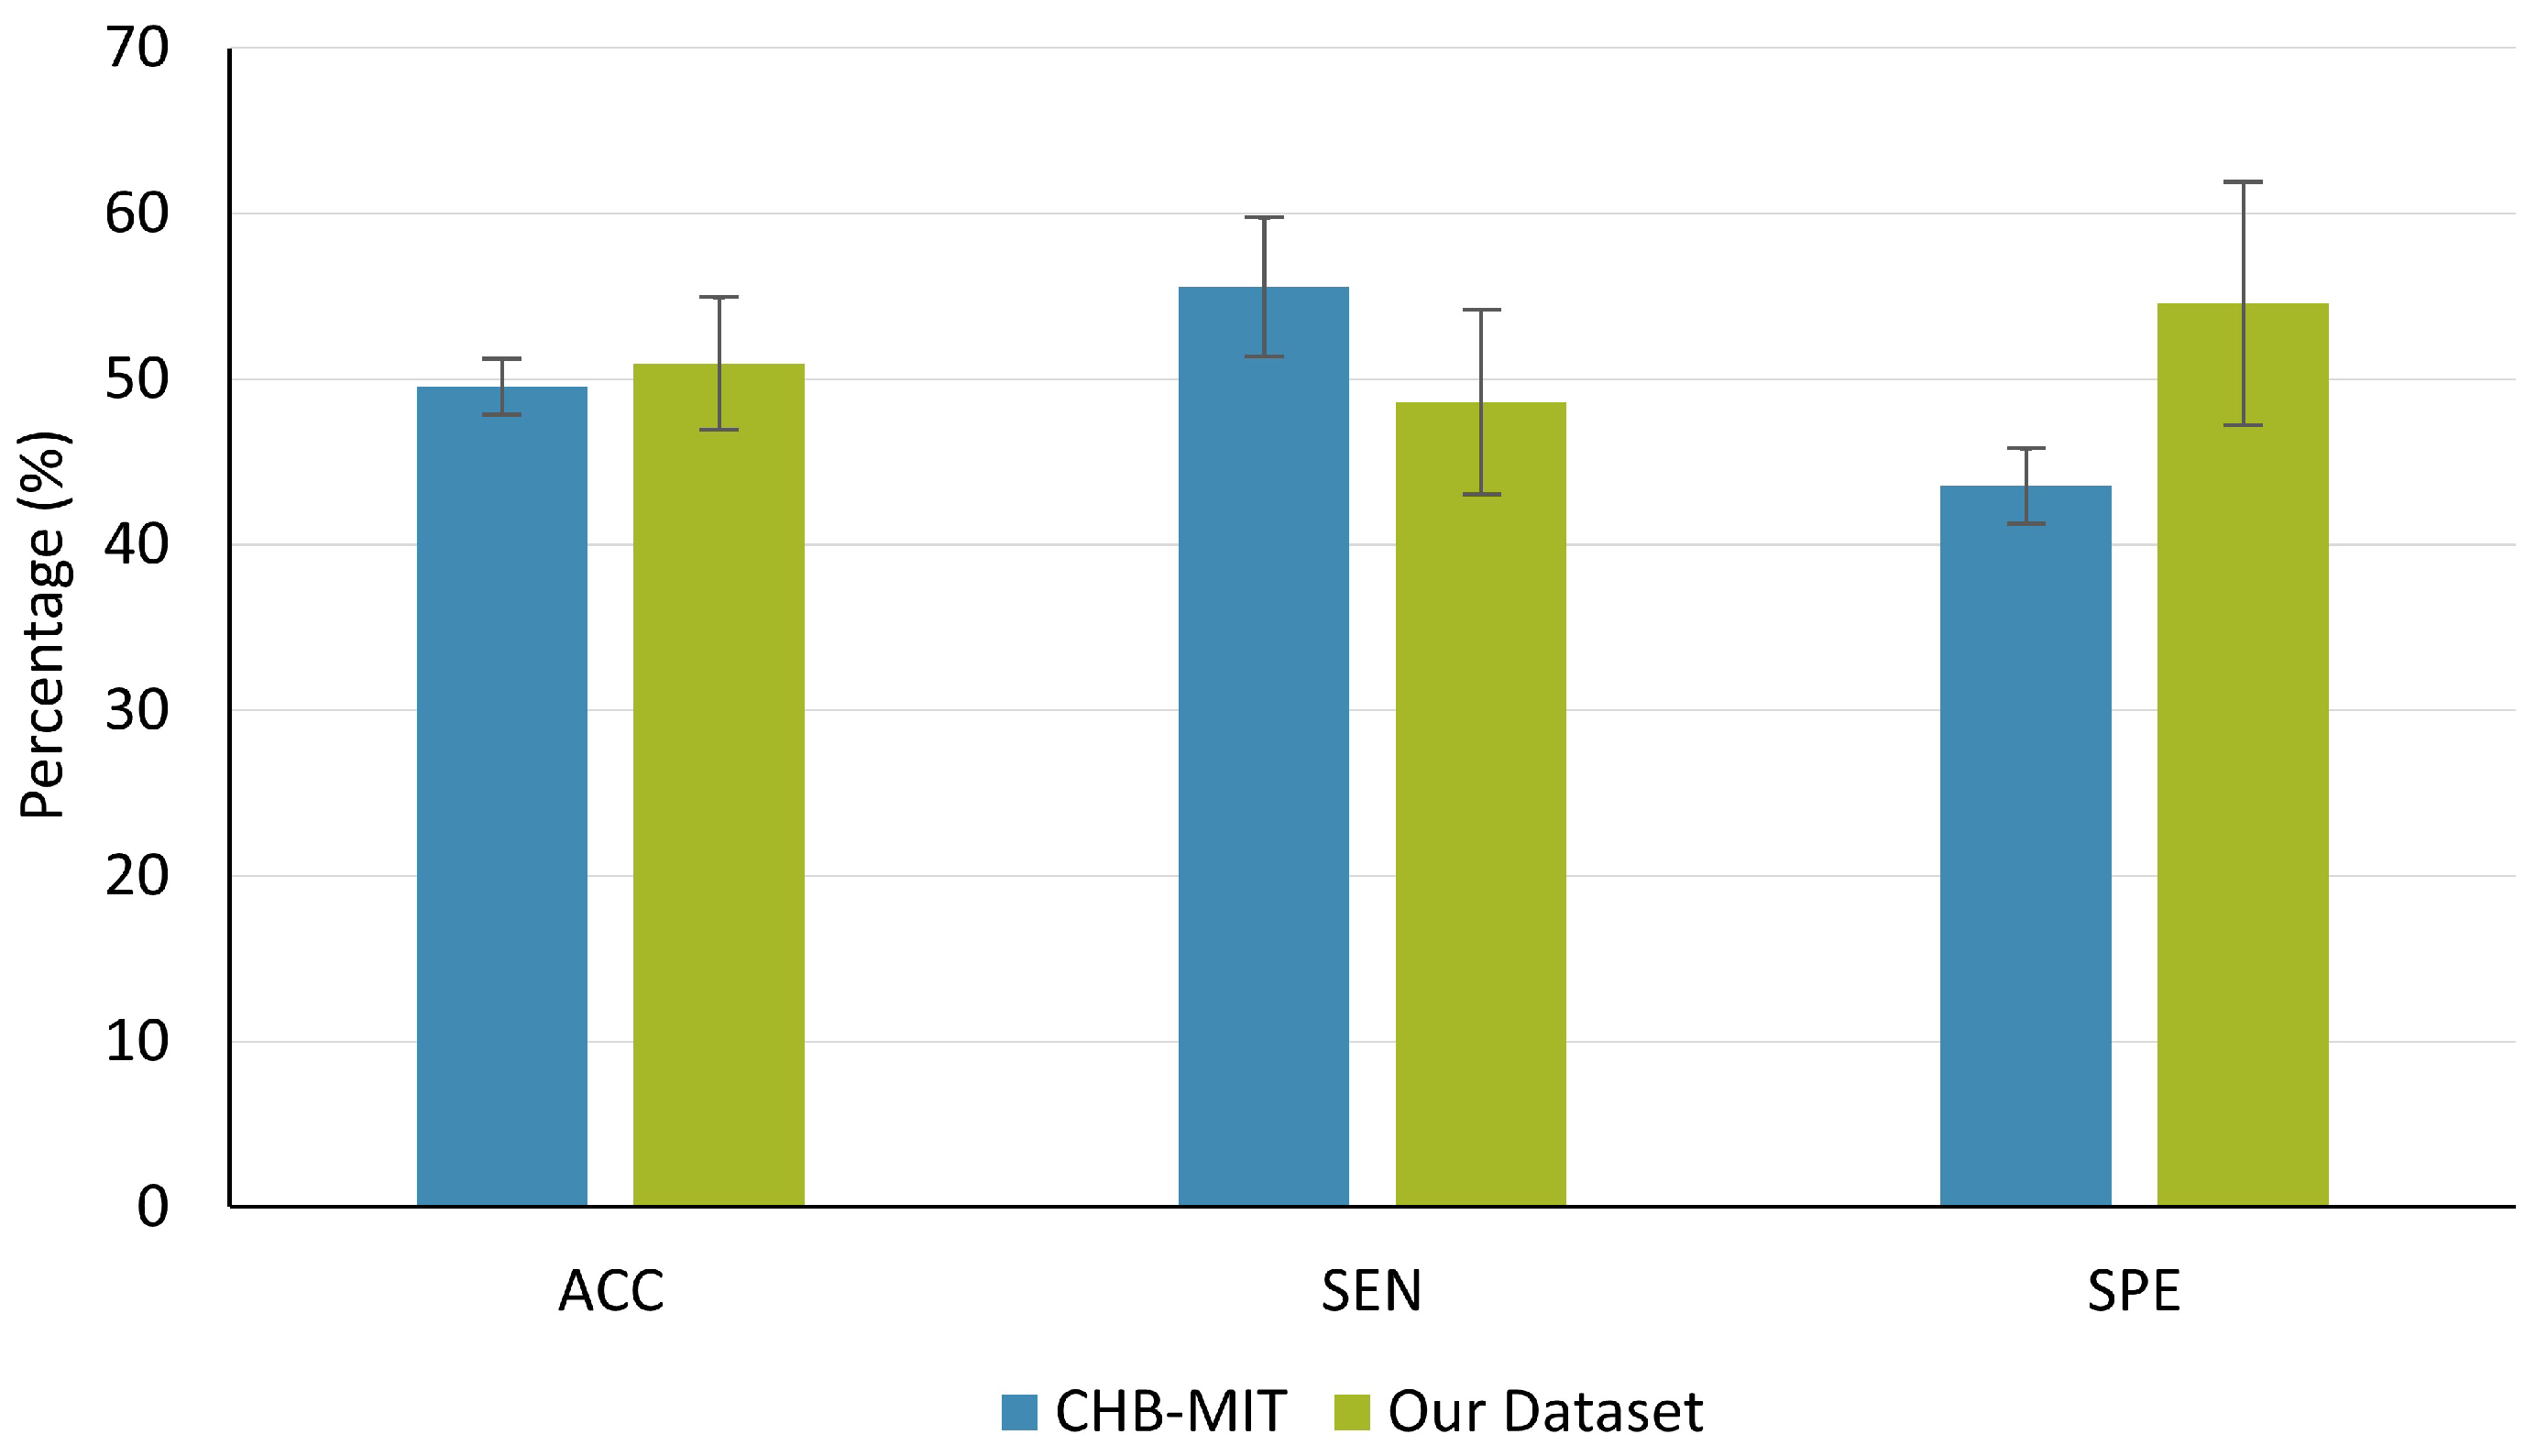
3.2. LOO
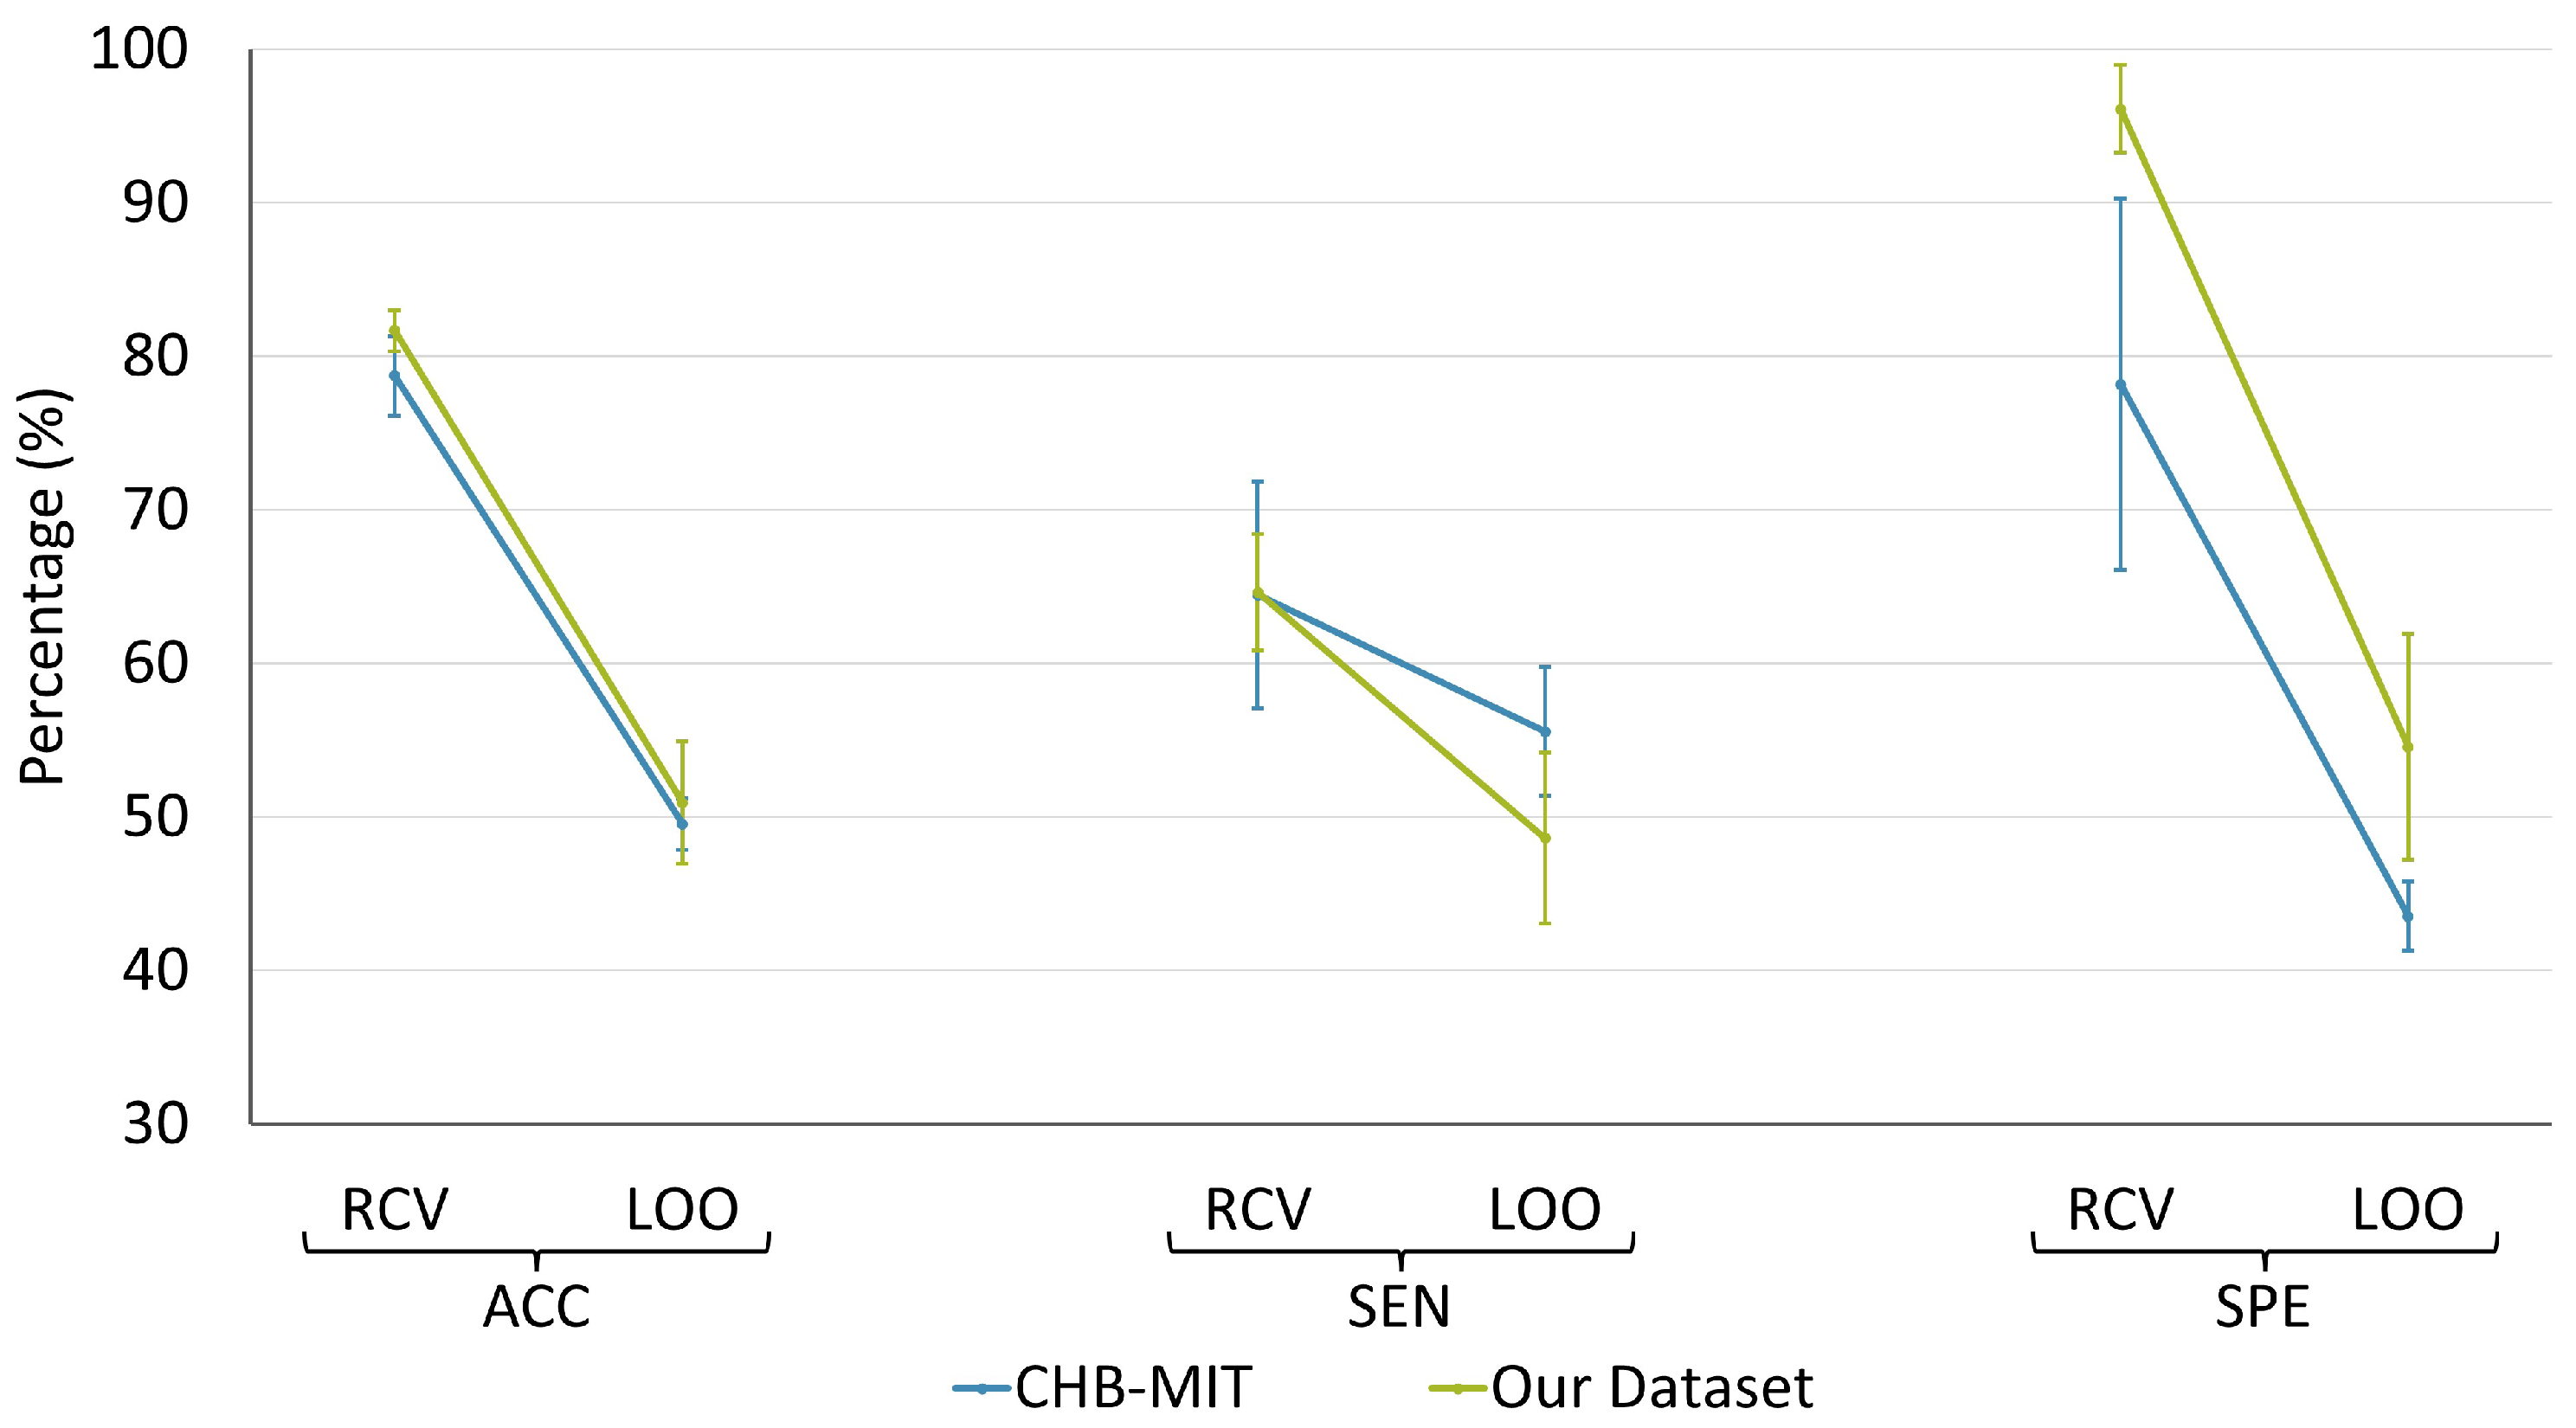
3.3. Comparison between RCV and LOO
4. Discussion
5. Conclusions
Author Contributions
Funding
Institutional Review Board Statement
Informed Consent Statement
Data Availability Statement
Conflicts of Interest
Abbreviations
| EEG | Electroencephalography |
| XGBoost | eXtreme Gradient Boosting |
| SVM | Support vector machine |
| RCV | Randomized cross-validation |
| LOO | Leave-one-patient-out |
| ACC | Accuracy |
| SEN | Sensitivity |
| SPE | Specificity |
Appendix A

| Data Set | Channel Names |
|---|---|
| CHB-MIT | FP1-F7, F7-T7, T7-P7, P7-O1, FP1-F3, F3-C3, C3-P3, P3-O1, FP2-F4, F4-C4, C4-P4, P4-O2, FP2-F8, F8-T8, T8-P8, P8-O2, FZ-CZ, CZ-PZ, P7-T7, T7-FT9, FT9-FT10, FT10-T8 |
| Feature Type | API Names |
|---|---|
| Univariate features | compute_mean, compute_variance, compute_std, compute_ptp_amp, compute_skewness, compute_kurtosis, compute_rms, compute_quantile, compute_decorr_time, compute_pow_freq_bands, compute_hjorth_mobility_spect, compute_hjorth_complexity_spect, compute_hjorth_mobility, compute_hjorth_complexity, compute_higuchi_fd, compute_katz_fd, compute_zero_crossings, compute_line_length, compute_spect_slope, compute_spect_entropy, compute_energy_freq_bands, compute_spect_edge_freq, compute_wavelet_coef_energy, compute_teager_kaiser_energy |
| Bivariate features | compute_max_cross_corr, compute_phase_lock_val, compute_nonlin_interdep |
References
- Beghi, E. The epidemiology of epilepsy. Neuroepidemiology 2020, 54, 185–191. [Google Scholar] [CrossRef] [PubMed]
- Fisher, R.S.; Boas, W.V.E.; Blume, W.; Elger, C.; Genton, P.; Lee, P.; Engel, J., Jr. Epileptic seizures and epilepsy: Definitions proposed by the International League Against Epilepsy (ILAE) and the International Bureau for Epilepsy (IBE). Epilepsia 2005, 46, 470–472. [Google Scholar] [CrossRef] [PubMed]
- Kwan, P.; Schachter, S.C.; Brodie, M.J. Drug-resistant epilepsy. N. Engl. J. Med. 2011, 365, 919–926. [Google Scholar] [CrossRef] [PubMed] [Green Version]
- Fisher, R.S.; Vickrey, B.G.; Gibson, P.; Hermann, B.; Penovich, P.; Scherer, A.; Walker, S. The impact of epilepsy from the patient’s perspective I. Descriptions and subjective perceptions. Epilepsy Res. 2000, 41, 39–51. [Google Scholar] [CrossRef]
- Andrzejak, R.G.; Lehnertz, K.; Mormann, F.; Rieke, C.; David, P.; Elger, C.E. Indications of nonlinear deterministic and finite-dimensional structures in time series of brain electrical activity: Dependence on recording region and brain state. Phys. Rev. E 2001, 64, 061907. [Google Scholar] [CrossRef] [Green Version]
- Lehnertz, K.; Mormann, F.; Kreuz, T.; Andrzejak, R.G.; Rieke, C.; David, P.; Elger, C.E. Seizure prediction by nonlinear EEG analysis. IEEE Eng. Med. Biol. Mag. 2003, 22, 57–63. [Google Scholar] [CrossRef]
- Iasemidis, L.D. Epileptic seizure prediction and control. IEEE Trans. Biomed. Eng. 2003, 50, 549–558. [Google Scholar] [CrossRef]
- Cook, M.J.; O’Brien, T.J.; Berkovic, S.F.; Murphy, M.; Morokoff, A.; Fabinyi, G.; D’Souza, W.; Yerra, R.; Archer, J.; Litewka, L.; et al. Prediction of seizure likelihood with a long-term, implanted seizure advisory system in patients with drug-resistant epilepsy: A first-in-man study. Lancet Neurol. 2013, 12, 563–571. [Google Scholar] [CrossRef]
- Van Mierlo, P.; Papadopoulou, M.; Carrette, E.; Boon, P.; Vandenberghe, S.; Vonck, K.; Marinazzo, D. Functional brain connectivity from EEG in epilepsy: Seizure prediction and epileptogenic focus localization. Prog. Neurobiol. 2014, 121, 19–35. [Google Scholar] [CrossRef]
- Esteva, A.; Kuprel, B.; Novoa, R.A.; Ko, J.; Swetter, S.M.; Blau, H.M.; Thrun, S. Dermatologist-level classification of skin cancer with deep neural networks. Nature 2017, 542, 115–118. [Google Scholar] [CrossRef]
- Calesella, F.; Testolin, A.; De Filippo De Grazia, M.; Zorzi, M. A comparison of feature extraction methods for prediction of neuropsychological scores from functional connectivity data of stroke patients. Brain Inform. 2021, 8, 1–13. [Google Scholar] [CrossRef]
- Abbasi, B.; Goldenholz, D.M. Machine learning applications in epilepsy. Epilepsia 2019, 60, 2037–2047. [Google Scholar] [CrossRef] [PubMed]
- Assi, E.B.; Nguyen, D.K.; Rihana, S.; Sawan, M. Towards accurate prediction of epileptic seizures: A review. Biomed. Signal Process. Control 2017, 34, 144–157. [Google Scholar] [CrossRef]
- Gadhoumi, K.; Lina, J.M.; Mormann, F.; Gotman, J. Seizure prediction for therapeutic devices: A review. J. Neurosci. Methods 2016, 260, 270–282. [Google Scholar] [CrossRef] [PubMed]
- Greene, B.R.; Faul, S.; Marnane, W.; Lightbody, G.; Korotchikova, I.; Boylan, G.B. A comparison of quantitative EEG features for neonatal seizure detection. Clin. Neurophysiol. 2008, 119, 1248–1261. [Google Scholar] [CrossRef] [PubMed]
- Temko, A.; Thomas, E.; Marnane, W.; Lightbody, G.; Boylan, G. EEG-based neonatal seizure detection with support vector machines. Clin. Neurophysiol. 2011, 122, 464–473. [Google Scholar] [CrossRef] [Green Version]
- Rasekhi, J.; Mollaei, M.R.K.; Bandarabadi, M.; Teixeira, C.A.; Dourado, A. Preprocessing effects of 22 linear univariate features on the performance of seizure prediction methods. J. Neurosci. Methods 2013, 217, 9–16. [Google Scholar] [CrossRef]
- Teixeira, C.A.; Direito, B.; Bandarabadi, M.; Le Van Quyen, M.; Valderrama, M.; Schelter, B.; Schulze-Bonhage, A.; Navarro, V.; Sales, F.; Dourado, A. Epileptic seizure predictors based on computational intelligence techniques: A comparative study with 278 patients. Comput. Methods Programs Biomed. 2014, 114, 324–336. [Google Scholar] [CrossRef]
- Bandarabadi, M.; Teixeira, C.A.; Rasekhi, J.; Dourado, A. Epileptic seizure prediction using relative spectral power features. Clin. Neurophysiol. 2015, 126, 237–248. [Google Scholar] [CrossRef]
- Zandi, A.S.; Tafreshi, R.; Javidan, M.; Dumont, G.A. Predicting epileptic seizures in scalp EEG based on a variational Bayesian Gaussian mixture model of zero-crossing intervals. IEEE Trans. Biomed. Eng. 2013, 60, 1401–1413. [Google Scholar] [CrossRef]
- Shazadi, K.; Petrovski, S.; Roten, A.; Miller, H.; Huggins, R.M.; Brodie, M.J.; Pirmohamed, M.; Johnson, M.R.; Marson, A.G.; O’Brien, T.J.; et al. Validation of a multigenic model to predict seizure control in newly treated epilepsy. Epilepsy Res. 2014, 108, 1797–1805. [Google Scholar] [CrossRef] [PubMed]
- Dietterich, T. Overfitting and undercomputing in machine learning. ACM Comput. Surv. 1995, 27, 326–327. [Google Scholar] [CrossRef]
- Mutasa, S.; Sun, S.; Ha, R. Understanding artificial intelligence based radiology studies: What is overfitting? Clin. Imaging 2020, 65, 96–99. [Google Scholar] [CrossRef] [PubMed]
- Tamanna, T.; Rahman, M.A.; Sultana, S.; Haque, M.H.; Parvez, M.Z. Predicting seizure onset based on time-frequency analysis of EEG signals. Chaos Solitons Fractals 2021, 145, 110796. [Google Scholar] [CrossRef]
- Kitano, L.A.S.; Sousa, M.A.A.; Santos, S.D.; Pires, R.; Thome-Souza, S.; Campo, A.B. Epileptic seizure prediction from EEG signals using unsupervised learning and a polling-based decision process. In Proceedings of the Artificial Neural Networks and Machine Learning–ICANN 2018: 27th International Conference on Artificial Neural Networks, Rhodes, Greece, 4–7 October 2018; Proceedings, Part II 27. Springer: Berlin/Heidelberg, Germany, 2018; pp. 117–126. [Google Scholar]
- Abdelhameed, A.M.; Bayoumi, M. An Efficient Deep Learning System for Epileptic Seizure Prediction. In Proceedings of the 2021 IEEE International Symposium on Circuits and Systems (ISCAS), Daegu, Republic of Korea, 22–28 May 2021; pp. 1–5. [Google Scholar]
- Shoeb, A.H. Application of Machine Learning to Epileptic Seizure Onset Detection and Treatment. Ph.D. Thesis, Massachusetts Institute of Technology, Cambridge, MA, USA, 2009. [Google Scholar]
- Selim, S.; Elhinamy, E.; Othman, H.; Abouelsaadat, W.; Salem, M.A.M. A review of machine learning approaches for epileptic seizure prediction. In Proceedings of the 2019 14th International Conference on Computer Engineering and Systems (ICCES), Cairo, Egypt, 17–18 December 2019; pp. 239–244. [Google Scholar]
- Usman, S.M.; Khalid, S.; Bashir, Z. Epileptic seizure prediction using scalp electroencephalogram signals. Biocybern. Biomed. Eng. 2021, 41, 211–220. [Google Scholar] [CrossRef]
- Patel, V.; Buch, S.; Ganatra, A. A review on EEG based epileptic seizure prediction using machine learning techniques. In Proceedings of the International Conference on Intelligent Computing, Information and Control Systems; Springer: Cham, Switzerland, 2019; pp. 384–391. [Google Scholar]
- Niknazar, H.; Maghooli, K.; Nasrabadi, A.M. Epileptic seizure prediction using statistical behavior of local extrema and fuzzy logic system. Int. J. Comput. Appl. 2015, 113. [Google Scholar] [CrossRef]
- Thangavel, P.; Thomas, J.; Peh, W.Y.; Jing, J.; Yuvaraj, R.; Cash, S.S.; Chaudhari, R.; Karia, S.; Rathakrishnan, R.; Saini, V.; et al. Time–frequency decomposition of scalp electroencephalograms improves deep learning-based epilepsy diagnosis. Int. J. Neural Syst. 2021, 31, 2150032. [Google Scholar] [CrossRef]
- Allen, P.; Fish, D.; Smith, S. Very high-frequency rhythmic activity during SEEG suppression in frontal lobe epilepsy. Electroencephalogr. Clin. Neurophysiol. 1992, 82, 155–159. [Google Scholar] [CrossRef]
- Arroyo, S.; Uematsu, S. High-frequency EEG activity at the start of seizures. J. Clin. Neurophysiol. 1992, 9, 441–448. [Google Scholar] [CrossRef]
- Chen, T.; Guestrin, C. Xgboost: A scalable tree boosting system. In Proceedings of the 22nd ACM Sigkdd International Conference on Knowledge Discovery and Data Mining, San Francisco, CA, USA, 13–17 August 2016; pp. 785–794. [Google Scholar]
- Akiba, T.; Sano, S.; Yanase, T.; Ohta, T.; Koyama, M. Optuna: A Next-generation Hyperparameter Optimization Framework. In Proceedings of the Proceedings of the 25rd ACM SIGKDD International Conference on Knowledge Discovery and Data Mining, Anchorage, AK, USA, 4–8 August 2019. [Google Scholar]
- Gadhoumi, K.; Lina, J.M.; Gotman, J. Discriminating preictal and interictal states in patients with temporal lobe epilepsy using wavelet analysis of intracerebral EEG. Clin. Neurophysiol. 2012, 123, 1906–1916. [Google Scholar] [CrossRef] [Green Version]
- Peng, P.; Song, Y.; Yang, L.; Wei, H. Seizure prediction in EEG signals using STFT and domain adaptation. Front. Neurosci. 2022, 15, 1880. [Google Scholar] [CrossRef] [PubMed]
- Rajpurkar, P.; Chen, E.; Banerjee, O.; Topol, E.J. AI in health and medicine. Nat. Med. 2022, 28, 31–38. [Google Scholar] [CrossRef] [PubMed]
- Shoeibi, A.; Khodatars, M.; Ghassemi, N.; Jafari, M.; Moridian, P.; Alizadehsani, R.; Panahiazar, M.; Khozeimeh, F.; Zare, A.; Hosseini-Nejad, H.; et al. Epileptic seizures detection using deep learning techniques: A review. Int. J. Environ. Res. Public Health 2021, 18, 5780. [Google Scholar] [CrossRef] [PubMed]


| Patient Number | Gender | Total Seizures | ACC (%) | SEN (%) | SPE (%) |
|---|---|---|---|---|---|
| chb01 | f | 3 | 91.33 | 100.00 | 0.00 |
| chb04 | m | 3 | 68.85 | 66.59 | 71.29 |
| chb05 | f | 3 | 72.18 | 33.28 | 89.38 |
| chb06 | f | 5 | 81.81 | 60.05 | 97.37 |
| chb07 | f | 2 | 75.95 | 49.90 | 100.00 |
| chb12 | f | 4 | 86.05 | 75.08 | 100.00 |
| chb15 | m | 6 | 76.53 | 80.73 | 67.57 |
| chb24 | - | 2 | 77.32 | 50.20 | 100.00 |
| Average | 78.75 | 64.48 | 78.20 |
| Patient Number | Gender | Total Seizures | ACC (%) | SEN (%) | SPE (%) |
|---|---|---|---|---|---|
| p1 | m | 10 | 82.90 | 68.99 | 100.00 |
| p2 | f | 3 | 85.75 | 66.61 | 100.00 |
| p3 | m | 2 | 79.49 | 49.91 | 100.00 |
| p4 | f | 6 | 85.92 | 83.40 | 88.82 |
| p5 | f | 3 | 84.20 | 62.08 | 100.00 |
| p6 | f | 4 | 80.36 | 69.19 | 100.00 |
| p7 | f | 5 | 76.95 | 79.99 | 72.39 |
| p8 | m | 3 | 86.23 | 66.68 | 100.00 |
| p9 | m | 2 | 81.77 | 49.97 | 100.00 |
| p10 | f | 2 | 73.24 | 49.80 | 100.00 |
| Average | 81.68 | 64.66 | 96.12 |
| Patient Number | Gender | Total Seizure | ACC (%) | SEN (%) | SPE (%) |
|---|---|---|---|---|---|
| chb01 | f | 3 | 43.23 | 39.88 | 46.58 |
| chb04 | m | 3 | 48.19 | 49.54 | 46.85 |
| chb05 | f | 3 | 55.28 | 62.31 | 48.24 |
| chb06 | f | 5 | 46.86 | 57.11 | 36.61 |
| chb07 | f | 2 | 57.64 | 79.31 | 35.97 |
| chb12 | f | 4 | 49.38 | 47.22 | 51.53 |
| chb15 | m | 6 | 49.15 | 51.34 | 46.96 |
| chb24 | - | 2 | 46.67 | 57.78 | 35.56 |
| Average | 49.55 | 55.56 | 43.54 |
| Patient Number | Gender | Total Seizure | ACC (%) | SEN (%) | SPE (%) |
|---|---|---|---|---|---|
| p1 | m | 10 | 44.93 | 52.80 | 36.26 |
| p2 | f | 3 | 43.09 | 59.81 | 32.00 |
| p3 | m | 2 | 56.02 | 52.78 | 58.04 |
| p4 | f | 6 | 37.64 | 51.30 | 24.08 |
| p5 | f | 3 | 79.20 | 77.79 | 80.09 |
| p6 | f | 4 | 59.57 | 48.21 | 77.61 |
| p7 | f | 5 | 54.27 | 44.22 | 67.34 |
| p8 | m | 3 | 50.41 | 20.56 | 68.93 |
| p9 | m | 2 | 35.48 | 59.31 | 23.32 |
| p10 | f | 2 | 48.68 | 19.44 | 78.07 |
| Average | 50.93 | 48.62 | 54.58 |
| Data Sets | Metrics | RCV | LOO | p-Value |
|---|---|---|---|---|
| ACC | 78.75 ± 7.34 | 49.55 ± 4.72 | <0.001 | |
| CHB-MIT | SEN | 64.48 ± 20.88 | 55.56 ± 11.87 | 0.31 |
| SPE | 78.2 ± 34.21 | 43.54 ± 6.40 | <0.05 | |
| ACC | 81.68 ± 3.45 | 50.93 ± 12.80 | <0.001 | |
| Our data set | SEN | 64.66 ± 10.34 | 48.62 ± 15.96 | <0.05 |
| SPE | 96.12 ± 9.99 | 54.58 ± 21.81 | <0.001 |
Disclaimer/Publisher’s Note: The statements, opinions and data contained in all publications are solely those of the individual author(s) and contributor(s) and not of MDPI and/or the editor(s). MDPI and/or the editor(s) disclaim responsibility for any injury to people or property resulting from any ideas, methods, instructions or products referred to in the content. |
© 2023 by the authors. Licensee MDPI, Basel, Switzerland. This article is an open access article distributed under the terms and conditions of the Creative Commons Attribution (CC BY) license (https://creativecommons.org/licenses/by/4.0/).
Share and Cite
Shafiezadeh, S.; Duma, G.M.; Mento, G.; Danieli, A.; Antoniazzi, L.; Del Popolo Cristaldi, F.; Bonanni, P.; Testolin, A. Methodological Issues in Evaluating Machine Learning Models for EEG Seizure Prediction: Good Cross-Validation Accuracy Does Not Guarantee Generalization to New Patients. Appl. Sci. 2023, 13, 4262. https://doi.org/10.3390/app13074262
Shafiezadeh S, Duma GM, Mento G, Danieli A, Antoniazzi L, Del Popolo Cristaldi F, Bonanni P, Testolin A. Methodological Issues in Evaluating Machine Learning Models for EEG Seizure Prediction: Good Cross-Validation Accuracy Does Not Guarantee Generalization to New Patients. Applied Sciences. 2023; 13(7):4262. https://doi.org/10.3390/app13074262
Chicago/Turabian StyleShafiezadeh, Sina, Gian Marco Duma, Giovanni Mento, Alberto Danieli, Lisa Antoniazzi, Fiorella Del Popolo Cristaldi, Paolo Bonanni, and Alberto Testolin. 2023. "Methodological Issues in Evaluating Machine Learning Models for EEG Seizure Prediction: Good Cross-Validation Accuracy Does Not Guarantee Generalization to New Patients" Applied Sciences 13, no. 7: 4262. https://doi.org/10.3390/app13074262