Article

Study of the Effect of Gas Baffles on the Prevention and Control of Gas Leakage and Explosion Hazards in aUtility Tunnel

1
School of Safety Science and Engineering, Henan Polytechnic University, Jiaozuo 454003, China
2
State Key Lab Cultivat Base Gas Geol & Gas Control, Henan Polytechnic University, Jiaozuo 454003, China
3
Henan Key Laboratory of Underground Engineering and Disaster Prevention, Jiaozuo 454003, China
*
Author to whom correspondence should be addressed.
Appl. Sci. 2023, 13(7), 4264; https://doi.org/10.3390/app13074264
Submission received: 22 February 2023 / Revised: 14 March 2023 / Accepted: 15 March 2023 / Published: 28 March 2023
(This article belongs to the Special Issue Urban Underground Engineering: Excavation, Monitoring, and Control)

Abstract

:
This paper takes the gas cabin in the utility tunnel in the Xuwei District of Lianyungang as the study object. Based on the computational fluid dynamics (CFD) theory, a simulation model of the gas cabin in the utility tunnel is established. The propagation law of methane leakage and diffusion and the characteristics of methane explosion shock wave propagation were simulated under different conditions of the gas cabin. These conditions are the presence or absence, spacing and height of the air baffle. The results show that: (1) the gas baffle can limit the propagation of methane at the top of the gas cabin and slow down the velocity of diffusion so as to increase the concentration of methane near the baffle and speed up the time for the monitor to reach the alarm concentration; (2) the first peak pressure and the second peak pressure generated in the middle of the gas cabin are smaller than that when the gas baffle is installed. The gas baffle has the function of blocking the propagation of shock waves. However, due to the installation of the gas baffle, the superposition of the shock wave will make the pressure surge at the gas baffle; and (3) combined with the simulation results, it is recommended that the gas baffle spacing is not less than 50 m and the height setting is not greater than 0.5 m.

1. Introduction

The gas cabin of the utility tunnel hosting the natural gas pipelines has raised concerns about potential gas explosions as the gas cabin is a confined space. The installation of gas baffles on top of the gas cabin is one way to improve the efficiency of monitoring gas leaks and to initiate preventive and control measures in time to avoid subsequent disasters. In the literature review, published scientific papers, master’s theses, patents, and national standards are cited. The Web of Science and CNKI literature database were used to search the literature. Most of the literature cited include open papers published in China and other countries in the last five years. The keywords of the literature are utility tunnel, leakage and diffusion, confined space, gas explosion, Fluent numerical simulation, etc.
In recent years, with the continuous promotion of new urbanisation construction, the Chinese government has promoted the construction of underground urban utility tunnels on a large scale to solve the problem of “urban diseases” [1]. A utility tunnel is a pipeline system with electricity, communication, water supply, drainage, heat, natural gas, and other municipal pipelines in one integrated system. As the utility tunnel is a confined space, the utility tunnel, which houses the natural gas pipeline, raises concerns about the possibility of a gas explosion. According to GB 50838-2015 Technical Specification for Urban Utility Tunnel Engineering [2] and GB 50058-2014 Code for Design of Electrical Installation in Explosive Atmospheres [3], the natural gas compartment of a utility tunnel must be a separate compartment and equipped with an alarm monitoring system and the lighting system must also be arranged in accordance with the specifications. Although there are some safety barriers, such as gas sensors, a mechanical ventilation system (ventilation inlet and outlet are also pressure relief vents), extinguishers, and fire doors, the delay effect of barrier activation may also result in an explosion [4,5]. At present, the natural gas monitoring system for utility tunnels that have been built in China usually uses distributed fixed-point detection and concentration detection to achieve the monitoring of natural gas. This method is more effective in situations where the gas spread has already occurred. However, it is difficult to detect this in time before it becomes widespread. Particularly in the case of small holes and weak leaks, untimely detection can be a major safety hazard.
There are many analyses by academics of the leakage, dispersion, and explosion of natural gas inside utility tunnels. Most of the recent research on natural gas pipeline leakages and explosions in utility tunnels is focused on CFD simulation and risk analysis. Computational Fluid Dynamics (CFD) tools and experiments have been widely used and integrated to analyse natural gas dispersion [6,7,8], explosion overpressure [9,10,11], and corresponding optimisation strategies [12,13,14]. In addition, the CFD simulation software Fluent is more realized as a feasible tool for modelling gas leakage and explosions in a utility tunnel.
Fang et al. [15] used experiments to derive a time response equation for the 50% lower explosive limit of the diffusion concentration of a leak in a gas chamber and simulated it with Fluent to demonstrate the accuracy of the numerical analysis and to provide a reference for the arrangement of monitoring probes. Deng et al. [16] used Fluent to simulate the relationship between the gas leakage diffusion and alarm time of a 20 mm leakage hole in the gas cabin under different ventilation speeds and gas pipeline pressure. The results showed that the relationship between alarm removal time and wind speed of the inlet is approximately linear. Zhang et al. [17] used Fluent to simulate the scenarios of gas leakage and diffusion under different ventilation velocities and ventilation outlet sizes, respectively. The results showed that the optimal ventilation velocity was between 5 m/s and 7 m/s, and the optimal side length of the ventilation outlet was between 1 m and 1.25 m in practical engineering. By comparing the crude oil explosion experiment results with the Fluent simulation results, Gao et al. [18] found that the two results are basically consistent. Xia et al. [19] adopted Fluent to establish the coupling relationship between the first velocity peak, the first overpressure peak, and the filling length of the shock wave propagated by the gas explosion in the utility tunnel. Xu et al. [20], Zhang et al. [21], and Zhang et al. [22] proved by numerical simulation or experiment that the presence of obstacles in the pipeline or utility tunnel increased the maximum pressure peak of shock wave overpressure.
In recent years, risk assessment models for leakage, explosion, and other disaster coupling situations of utility tunnels have been studied by scholars. Generally, there are three main kinds of approaches for assessing the risks of natural gas accidents in utility tunnels: graphical methods, numerical simulations, and experiments. Graphical methods such as fault tree, event tree, Bow-tie diagram, and Bayesian network (BN) were applied to illustrate the causation topology and quantify the probability of different accidents in utility tunnels [23,24]. Bai et al. [25] proposed a Bayesian network (BN) and computational fluid dynamics (CFD)-based quantitative risk assessment of natural gas explosions in utility tunnels. The results indicated that the failure of the emergency shutdown system (ESD) is the most fatal of all safety barriers, and significant attention should be paid to prevent its failure. Wu et al. [26] proposed an integrated model based on dynamic hazard scenario identification (DHSI), Bayesian network (BN) modeling, and risk analysis for the risk assessment of urban utility tunnels. The results indicated that the integrated quantitative risk assessment framework is an alternative and effective tool for safety assessment and land-use planning of urban utility tunnels. Zheng et al. [27] conducted a large-scale 3D combined geomechanical model test to investigate the mechanical characteristics of linings of asymmetrically closely spaced twin tunnels constructed in sandy ground.
In summary, research on natural gas leaks, dispersion, and explosions in utility tunnels has mostly focused on the distribution of natural gas after leaks and the risk analysis of each hazard, with little consideration given to construction solutions that enhance monitor detection and optimise monitor placement while ensuring safety. In response to this problem, Huang et al. [28] proposed an optimisation scheme for combustible gas detection systems involving the addition of gas baffles, but the technical parameters given have large work differences. The gas cabin is a restricted space, and the additional gas baffle is an added obstacle. The effect of the gas baffle on the propagation law of the explosion shock wave in the gas cabin is not clear, and it is not known whether the gas baffle can improve the monitoring efficiency of the monitor and whether it can take into account the role of explosion isolation. Therefore, it is necessary to verify its effectiveness through numerical simulations and further study the effect of gas baffles on the diffusion of gas leaks in the utility tunnel and the propagation law of explosion shock waves in order to better guide the optimal arrangement of the combustible gas monitoring system in the gas compartment of the utility tunnel.

2. Numerical Model Settings

2.1. Gas Leak Model

2.1.1. Physical Model

According to the relevant provisions in the Technical Code for Urban Utility Engineering (GB50838-2015), one fire protection compartment is set up every 200 m in the gas compartment of the utility tunnel. Both ends of the fire compartment are equipped with firewalls and fire doors, and the top of the utility tunnel is equipped with air inlets and ventilation openings, respectively. Ventilation fans are installed in the ventilation openings to provide regular mechanical ventilation to the fire compartments. Under normal working conditions, the frequency of mechanical ventilation in the common tunnel must not be less than 6 times an hour. In case of pipe leakage, the frequency of mechanical ventilation shall not be less than 12 times an hour.
The research object in this study is a chamber of the utility tunnel in Xuwei, Lianyugang, with a natural gas pipeline inside. The gas compartment has a section height of 3.8 m, the gas pipe is DN350 steel pipe, the pipe height is 510 mm from the ground, and the length and width of the air inlet and outlet are 1 m.
According to the actual arrangement in the gas compartment of the utility in Xu Wei, some unnecessary factors were ignored while satisfying the engineering reality. The software Design Moder was used to build a 2D geometric model, and the structure of the gas cabin of the utility tunnel is appropriately simplified. The corresponding two-dimensional simplified physical model of the gas cabin with additional gas baffles for a single fire protection partition is shown in Figure 1.

2.1.2. Mathematical Model

After the gas leaks from the pipeline into the gas compartment of the utility tunnel, there will be energy and material conversion with the external environment. The overall satisfaction of the three controlling equations of fluid mechanics and the turbulent component transport equations without chemical reactions constitute the set of flow equations for the diffusion of gas leaks in the gallery, satisfying the physical situation to be simulated and by giving specific initial boundary conditions, special solutions can be obtained in different situations. The specific equations are applied as follows.
(1) Continuity equation
Treating the gas flow in the pipe as a one-dimensional flow, the continuity equation can be expressed as follows:
ρ t + ρ u x = 0
where ρ is the density of the gas, the unit is kg/m3; t is flow time, the unit is s; and u is the velocity of the fluid in the direction of the axis, the unit is m/s.
(2) Conservation of momentum equation
The Navier–Stokes equations are expressed specifically in a two-dimensional coordinate system as follows:
( ρ u x ) t + ( ρ u x u y ) x = p x + τ x y x + ρ g + F
where u x , u y is the component of the velocity on the X- and Y-axis, the units are m/s; p is the static pressure and τ x y is the stress tensor, the units are Pa; and ρ g is Gravity body forces and F is external body forces, the units are N.
(3) Energy conservation equation
In the 2D simplified physical model, conservation of energy is specifically expressed as follows:
( ρ T ) t + d i v ( ρ u T ) = d i v ( k C p g r a d T ) + S T
where T is the thermodynamic temperature of the fluid, the unit is K; k is the heat transfer coefficient of the fluid; C p is the isobaric specific heat capacity, the unit is J/(kg·K); and S T is the viscous dissipative term, the unit is Pa·s.

2.1.3. Simulation Setup of Leakage

(1) Mesh Setting
ANSYS19.2 Mesh software was used to mesh the model and generate unstructured mesh. The local mesh quality will determine the reliability of the simulation results, and the location of the leakage holes and air inlet and outlet compared to the fire interval length of 200 m is a large difference in magnitude, so the leakage holes and air inlet and outlet needed a local mesh refinement process. The total number of grids delineated is 50,138, with a grid quality of approximately 0.7.
(2) Grid independency test
Under the condition that the gas cabin has no ventilation and no baffle and the leakage speed is 50 m/s, the gas concentration at a monitoring point 7.5 m downstream of the leak and 2.7 m high is taken as the basis. The influence of mesh sizes of 0.5 m, 0.3 m, 0.15 m, and 0.1 m on the calculation results were tested, respectively. The result is shown in Figure 2. When the mesh size is 0.15 m, the mesh size is further reduced, and the change in the calculation result is not obvious. When the mesh size is 0.15 m, grid division will not affect the calculation result.
(3) Solver Setup
Fluent calculations are based on a pressure solver, which considers the convective diffusion of the leaking gas component in the cabin air in a turbulent state. k-ε models are the most commonly used turbulence models, which have a wide range of applications and high accuracy. The standard k-ε turbulence model is the most commonly used turbulence model with a wide range of applications and high accuracy. The results of the standard k-ε turbulence model meet the engineering accuracy requirements and are less expensive to calculate. Therefore, the standard k-ε model is used to simulate turbulent flow. The SIMPLE solution method is used. The unsteady calculation is adopted, and the time step is 0.5 s. The Species Transport model is also used to simulate the diffusion of gas leaks in the atmosphere, defining the component as methane-air, taking into account the effect of full buoyancy.
(4) Boundary Conditions
In gas pipeline leaks, the probability of a small bore leak is higher than that of a large bore leak as well as a pipe break [29]. Small-hole leaks are more likely to cause gas accumulation because of their small flow rates and low concentrations. This model uses a small-hole leak model with a 10 mm leak opening and makes the following assumptions: ① the pressure inside the pipe is neglected by the influence of the leak, while the frictional influence of the gas inside the pipe is not considered; ② the leak source is a continuous leak source, and the leak rate remains constant throughout the process, i.e., equal to the starting maximum leak rate.
The simulation conditions are set as follows.
(1)
Initial conditions: methane normally accounts for more than 90% of the gas, and the leak component is chosen to be simulated as CH4. At a time of t = 0, the leak has not started, the gas chamber is full of air, the CH4 concentration is 0, and the pressure is 0.1 MPa at one standard atmosphere.
(2)
Leak source conditions: the CH4 and air components involved in the simulation process do not occur during the chemical reaction, only the diffusion of components. The small hole leakage aperture was selected to be 10 mm, and the CH4 component at the leak source was set to 1. The leak port was set to be a velocity inlet, and the leak volume was adjusted by changing the leak velocity, which was set to 50 m/s and 100 m/s.
(3)
Inlet conditions: assume that the wind direction and wind speed do not change with the vertical height of the gas leak diffusion space, that is, the wind speed involved is parallel to the ground and constant, and the component is air. According to the needs of different working conditions, the air inlet is set to speed inlet, and the ventilation wind speed is set to 0 m/s, 1.38 m/s.
(4)
Outlet-wind conditions: the outlet is connected to the outside atmosphere and set as a pressure outlet.
(5)
Other conditions: ignore the changes in heat transfer, no slip in the wall, standard wall function solution selected, room temperature of 300 K.

2.2. Gas Explosion Model

2.2.1. Physical Model

The gas cabin model is also based on the actual situation in the gas cabin of Xuwei, with a 200 m fire protection partition as the research object. Under the premise of meeting the engineering reality, minus some unnecessary factors, using DM software to establish a 3D geometric model, the gas chamber section size is 1.8 m × 3.8 m, the gas pipe diameter DN = 350 mm, the pipe height from the ground is 510 mm, the width from the nearest wall is 350 mm, and the inlet and outlet vent size is 1.0 m × 1.0 m.
The lower left vertex of the model is used as the coordinate origin to create the 3D axes. A 20 m methane-air premixing area is set up on the left side. A spherical ignition point is set up with a diameter DN = 1 m, and the centre of the sphere is located at x = 1 m, y = 0.9 m, and z = 1.9 m. There are two sets of monitoring points depending on the Z-axis height: (1) Monitoring group 1 (G1 for short), they are represented as star shapes, is set up at the top of the gas cabin at Y = 0.9 m and Z = 3.7 m, with each monitoring point spaced 10 m apart in the X-axis; (2) Monitoring group 2 (G2 for short), they are represented as black circles shapes, is set up in the middle of the gas cabin at Y = 0.9 m, Z = 1.9 m, with each monitoring point spaced 10 m apart in the X-axis. The diagram is shown in Figure 3.

2.2.2. Mathematical Model

Gas explosion is a combustion reaction process, and the reaction is rapid. The conservation equation satisfied by the selected process is as follows.
Equation of continuity:
p t + ( p u ) x + ( p v ) y + ( p w ) z = 0
Energy of continuity:
e t + u e x + v e y + w e z = 0
Momentum of continuity:
{ u t + u u x + v u y + w u z = 1 p p x ; v t + u v x + v v y + w v z = 1 p p y ; w t + u w x + v w y + w w z = 1 p p z .
Equation of state:
p = p ( ρ , T ) = ρ R T .
where P is pressure; x, y, and z are the parameters of the rectangular coordinate system; u, v, and w are the velocities in each of the three coordinate directions; ρ is the fluid density; T is the temperature; R is the gas constant; and e is the specific energy, e = p / ( γ 1 ) + ρ ( u 2 + v 2 + w 2 ) / 2 (γ is Gas Index).

2.2.3. Simulation Setup of Leakage

(1) Mesh settings
The meshing was carried out using ANSYS 19.0 MESH software with an unstructured mesh, with the number of meshes varying from 214533–398134 depending on the working conditions, with an average mesh mass of 0.82.
In addition, a grid independency test was completed. Take the spacing of 50 m between the gas baffle as an example, when the mesh size is equal to 0.2 m, the element number is 200280, and the peak pressure at the gas baffle is 1.7 MPa. The size of the grid continues to decrease, and the peak pressure does not change obviously, so the grid is considered to be independent. When the mesh size is 0.2 m, grid division will not affect the calculation result.
(2) Solution setup
Fluent calculations are based on a pressure solver, which uses the Large Eddy Simulation (LES) turbulence equation and standard wall functions. The combustion model uses the Eddy-Dissipation (ED) model based on turbulent combustion. The SIMPLE solution methods is used. The method of unsteady state calculation is adopted, the time step is 0.001 s, the number of iterations is 30, the number of steps is 600, and the calculation of the gas chamber explosion process is 0.6 s.
(3) Boundary and initial conditions
The boundary conditions and initial conditions are set as follows. ① Boundary conditions: the walls around the gas cabin and the pipes are wall surfaces. ② Initial conditions: the methane-air premixing zone has a temperature of 300 K, a methane volume fraction of 9.5%, and an oxygen volume fraction of 21.2%. At the initial moment, a spherical high-temperature zone is set up at the left end of the gas chamber with an initial temperature of 1600 K, a CO2 mass concentration of 0.1456, and an H2O mass concentration of 0.11925.
(4) Basic assumptions
Combined with the actual engineering situation and the need for numerical simulation calculations, the numerical simulation of the explosion process requires the following assumptions:
The combustible gas explosion process is an irreversible single-step reaction.
Gas to meet the ideal gas state.
Methane-air premixing zone mixing uniformity.
The gas chamber walls are adiabatic, rigid, non-slip, and do not exchange energy with the outside world.

3. Analysis of Results and Discussion

3.1. Analysis of the Influence of the Gas Baffle on Gas Leakage Monitoring

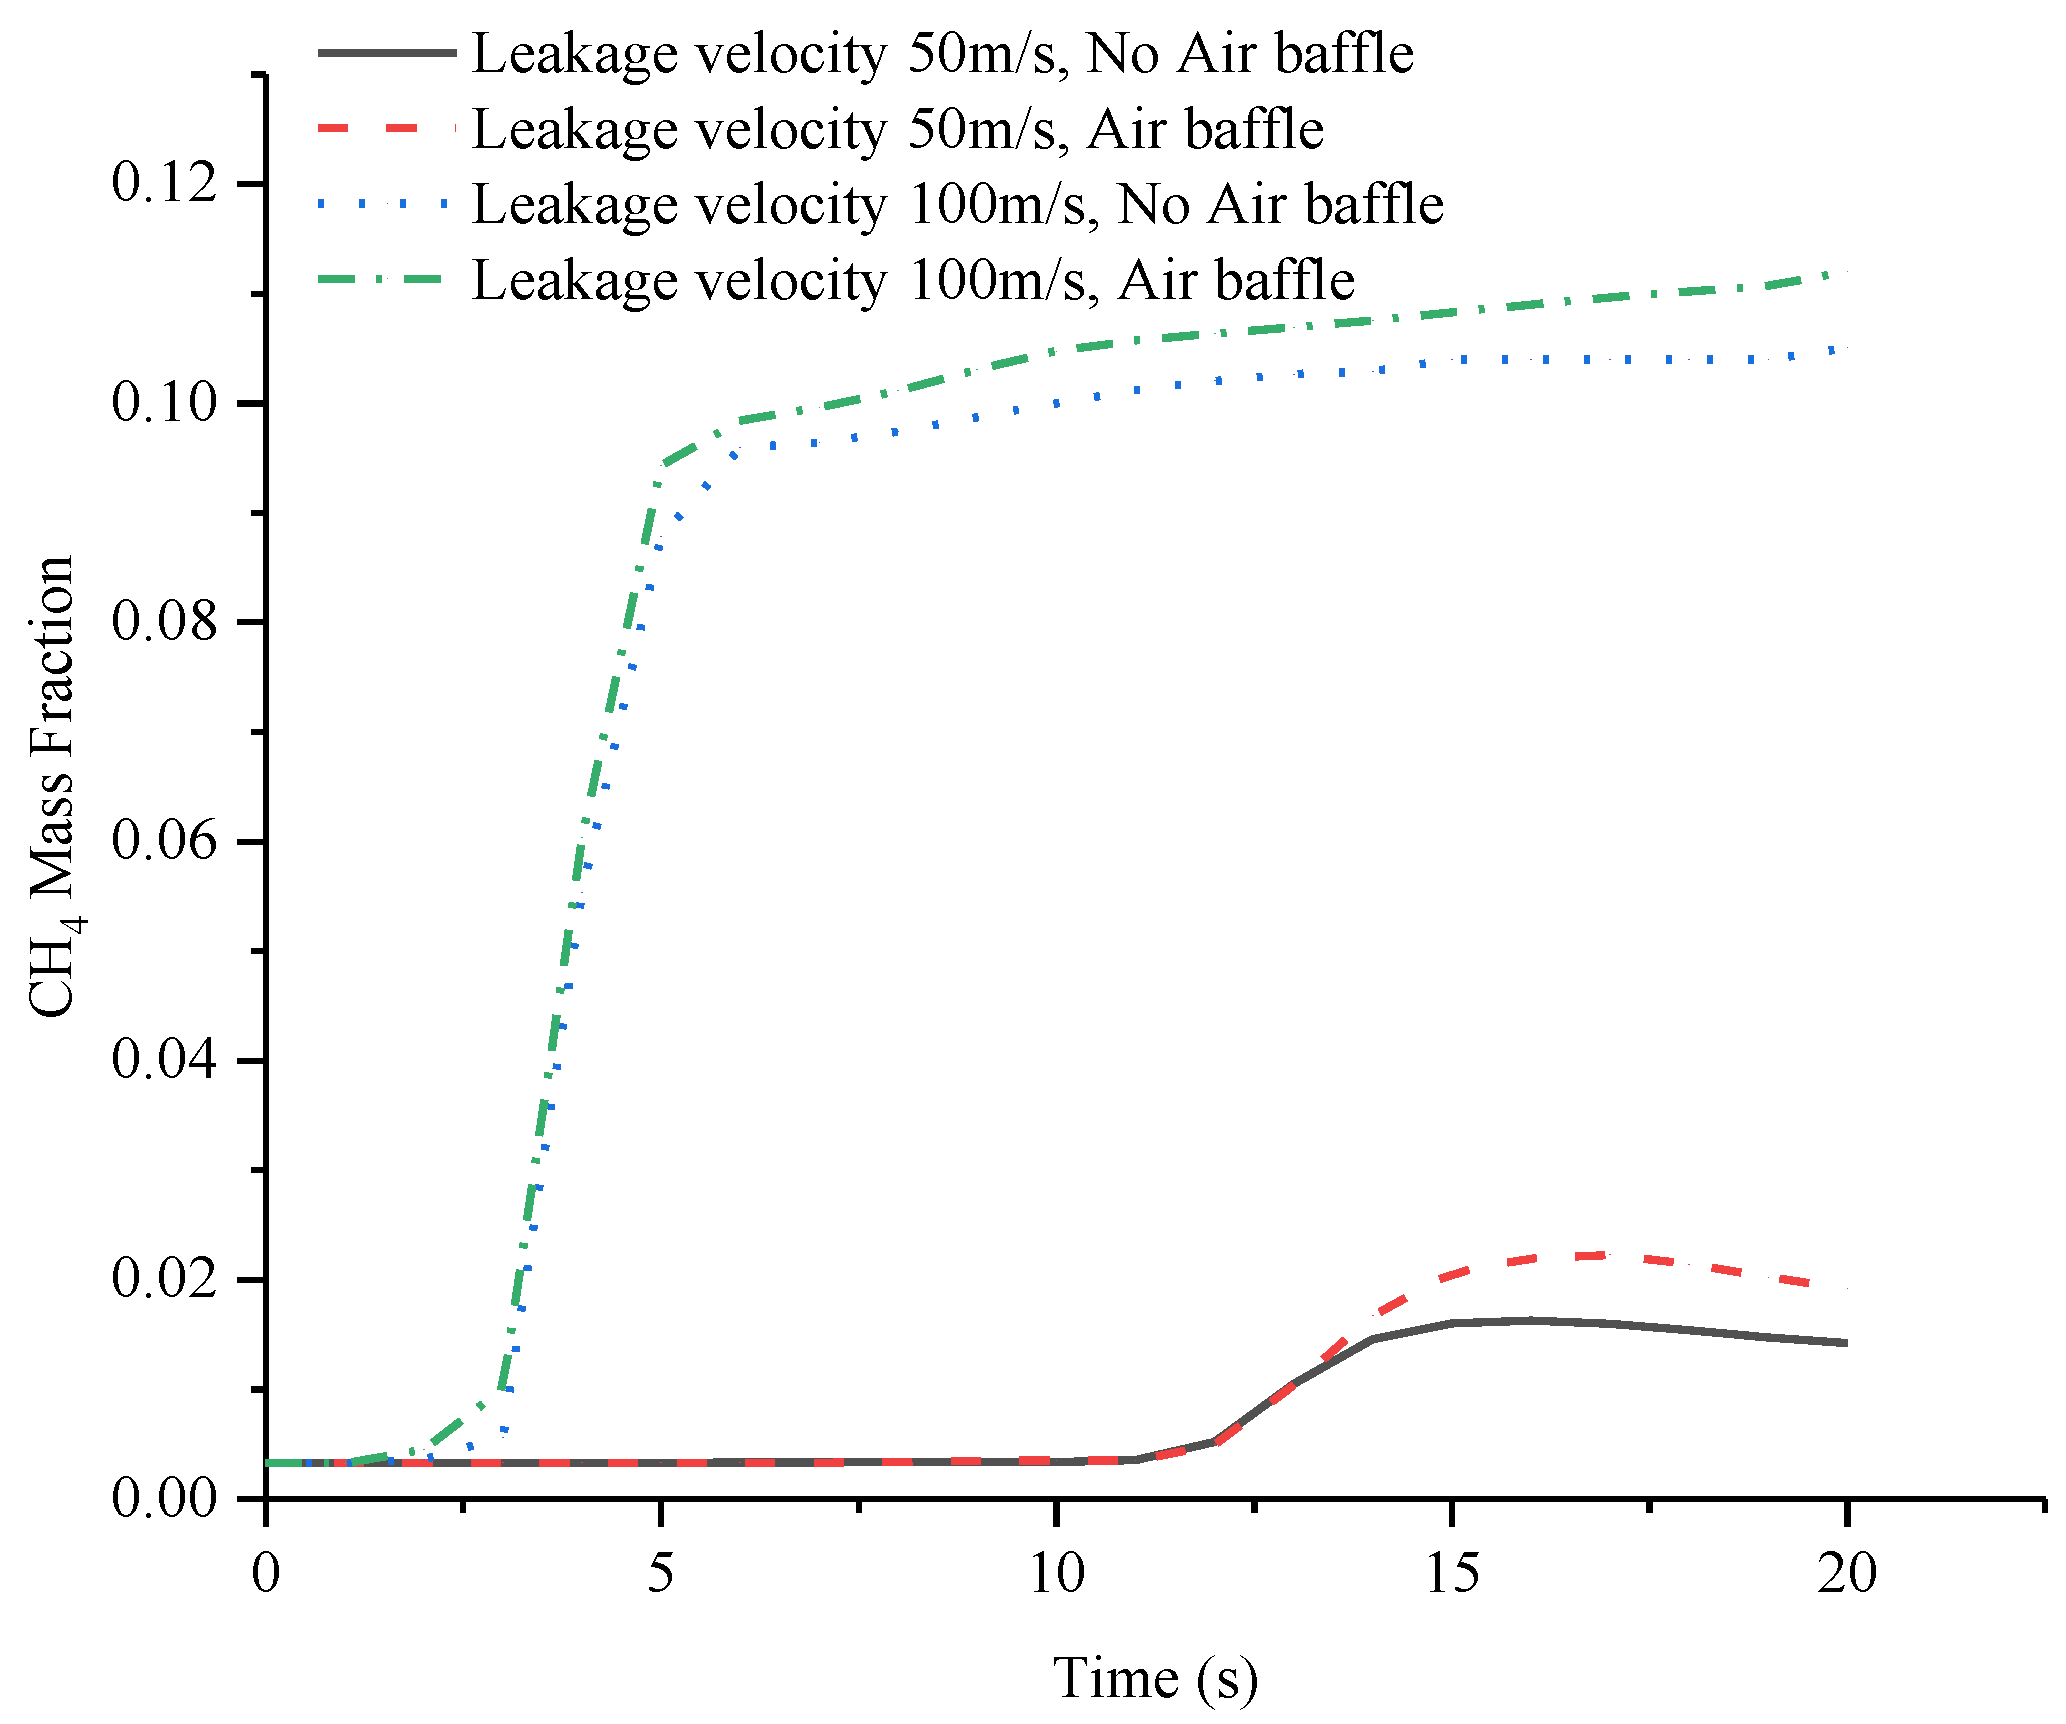
3.1.1. Leak Response Time Effect Analysis

Based on the nature of methane, its lower explosion limit can be considered to be 5% (volume fraction), corresponding to a mass fraction of 2.82%. The set value of the gas monitoring alarm concentration in the utility tunnel should not be greater than 20% of its lower explosive limit value. Therefore the monitor alarm concentration value can be set to 0.005 (mass fraction) [30]. In order to examine the longest alarm response time, the leak hole was located at the midpoint of the two gas monitors. One gas monitor was installed every 15 m in accordance with the Xu Wei utility tunnel. The gas baffle is set on the leeward side of the monitor, and the horizontal distance from the monitor is controlled at 1 m. The width of the gas baffle is set at 0.25 m, and the height is set at 0.5 m. The width of the gas baffle is set at the width of the gas cabin.
(1) The effect of the gas baffle under different leakage volumes
In order to study the effect of the gas baffle on the detection effect under different leakage volume (leakage velocity) conditions, the ventilation air velocity of 0 m/s and the leakage velocity of 50 m/s and 100 m/s, respectively, were selected for analysis. The variation of CH4 concentration with time at the detection point before and after the addition of the baffle is shown in Figure 4.
In order to study the effect of installing gas baffles on the monitoring effect under different leakage volume (leakage speed) conditions, the calculated results of the working conditions with a ventilation wind speed of 0 m/s, a leakage speed of 50 m/s and 100 m/s respectively were selected for analysis. The methane concentration (mass fraction) at the monitoring points before and after the addition of the baffle is shown in Figure 4.
According to the monitoring data corresponding to Figure 4, with the mass fraction of 0.005 as the alarm response concentration, the alarm response times were 4.6 s for no air baffle and 4.0 s for air baffle for a leak rate of 50 m/s; the alarm response times were 2.2 s for no air baffle and 1.9 s for air baffle for a leak rate of 100 m/s. At the same time, the mass fraction of CH4 was 0.078 at the monitoring point with the gas baffle and 0.087 at the monitoring point without the gas baffle for a continuous leak of 10 s and a leak velocity of 50 m/s, compared to 0.103 and 0.136 for a leak velocity of 100 m/s, respectively. The results showed that the detection effect was influenced by the blocking effect of the detection zone formed between the baffles. The results show that, due to the blocking effect of the detection zone formed between the gas baffles, the detection effect was improved after the addition of the gas baffles for different leakage volumes, and the peak CH4 concentration at the detection point increased, but the overall improvement effect was not significant.
(2) Effect of the gas baffle under normal ventilation
In order to study the effect of the gas baffle on the monitoring effect under normal ventilation conditions, the ventilation air velocity of 1.38 m/s (induced air volume 6 times/h) and the leakage velocity of 50 m/s and 100 m/s were selected to continue the calculation and analysis. The variation of CH4 concentration at the monitoring point with time is shown in Figure 5.
According to Figure 5 and the corresponding monitoring data, under normal ventilation conditions, the peak CH4 concentration at the location of the monitoring point still increased after 20 s of continuous leakage with the addition of the gas baffle, but the alarm response time did not advance. Through several simulations, it was found that due to the blocking effect of the gas baffle, a vortex would be formed on the windward side of the gas baffle, and the location near the windward side of the gas baffle would be a safe concentration area for a period of time. In other words, under normal ventilation conditions, if the gas baffle is set close to the monitor, there is a possibility of weakening the monitoring effect.
(3) Effect of the baffles at different heights of the gas baffle
According to the requirements of the relevant standards and specifications for the installation of obstructions and air intake and exhaust in the tunnel cabin, and taking into account the usual operation and maintenance and personnel activities, Huang et al. provided a range of 0.4, 0.5, and 0.6 m for the height of the air baffle. In order to investigate whether the height of the air baffle has an effect on the monitoring effect, the height of the air baffle was adjusted to 0.3 m, 0.5 m, and 0.7 m in order to simulate and analyse the situation with a ventilation wind speed of 0 m/s and a leakage velocity of 50 m/s. The variation of CH4 concentration at the monitoring point with time for different baffle heights was obtained, as shown in Figure 6.
As can be seen from Figure 6, the height of the gas baffle is adjusted from 0.3 m to 0.7 m, and the curve shows a slight difference as the height of the gas baffle increases, with no significant change in alarm response time or peak CH4 concentration. Combined with the height requirement of the top obstacle in the Zhengzhou Xuwei gas chamber (≤0.5 m) and the simulation calculation results, it can be seen that after the height of the gas baffle reaches 0.5 m, continuing to increase the height does not improve the effect significantly, but will increase the cost, so it is recommended that the height of the gas baffle should be set no greater than 0.5 m.
(4) Effect of the baffles at different leak locations
The location of the leakage source can always be considered to be between two monitors. Therefore, different leakage positions can be regarded as different spacings between the leakage hole and monitoring points. In order to study the different spacings between the leakage hole and the monitor and increase the influence of the baffle plate on the monitoring effect, the horizontal distance between the leakage hole and the downstream monitor was set as 5.0 m, 7.5 m, and 10.0 m successively. A ventilation wind speed of 0 m/s, leakage speed of 50 m/s, and baffle height of 0.5 m were selected for the calculation analysis. At different leakage locations, the concentration of CH4 at the monitoring point before and after adding a gas baffle varies with time, as shown in Figure 7.
As can be seen from Figure 7, in the section formed by two monitors without ventilation, the greater the horizontal distance between the leakage hole and the downstream monitor, the more obvious the monitoring effect improvement. Combined with the actual engineering, the monitor with the closest horizontal distance is usually the first to alarm under the condition of ensuring the normal operation of the monitor. Huang Jian et al. suggested that combustible gas detectors should be set on both sides of each baffle, and the spacing between two adjacent baffle plates should be set as 50 m. In accordance with the usual practice of setting an interval of about 15 m for combustible gas monitors in the gas compartment of the integrated corridor, at least 13 monitors will be arranged in the corridor section with a length of 200 m. By adopting the new layout scheme, the number of monitors can be reduced by 38%, thus reducing the project cost.

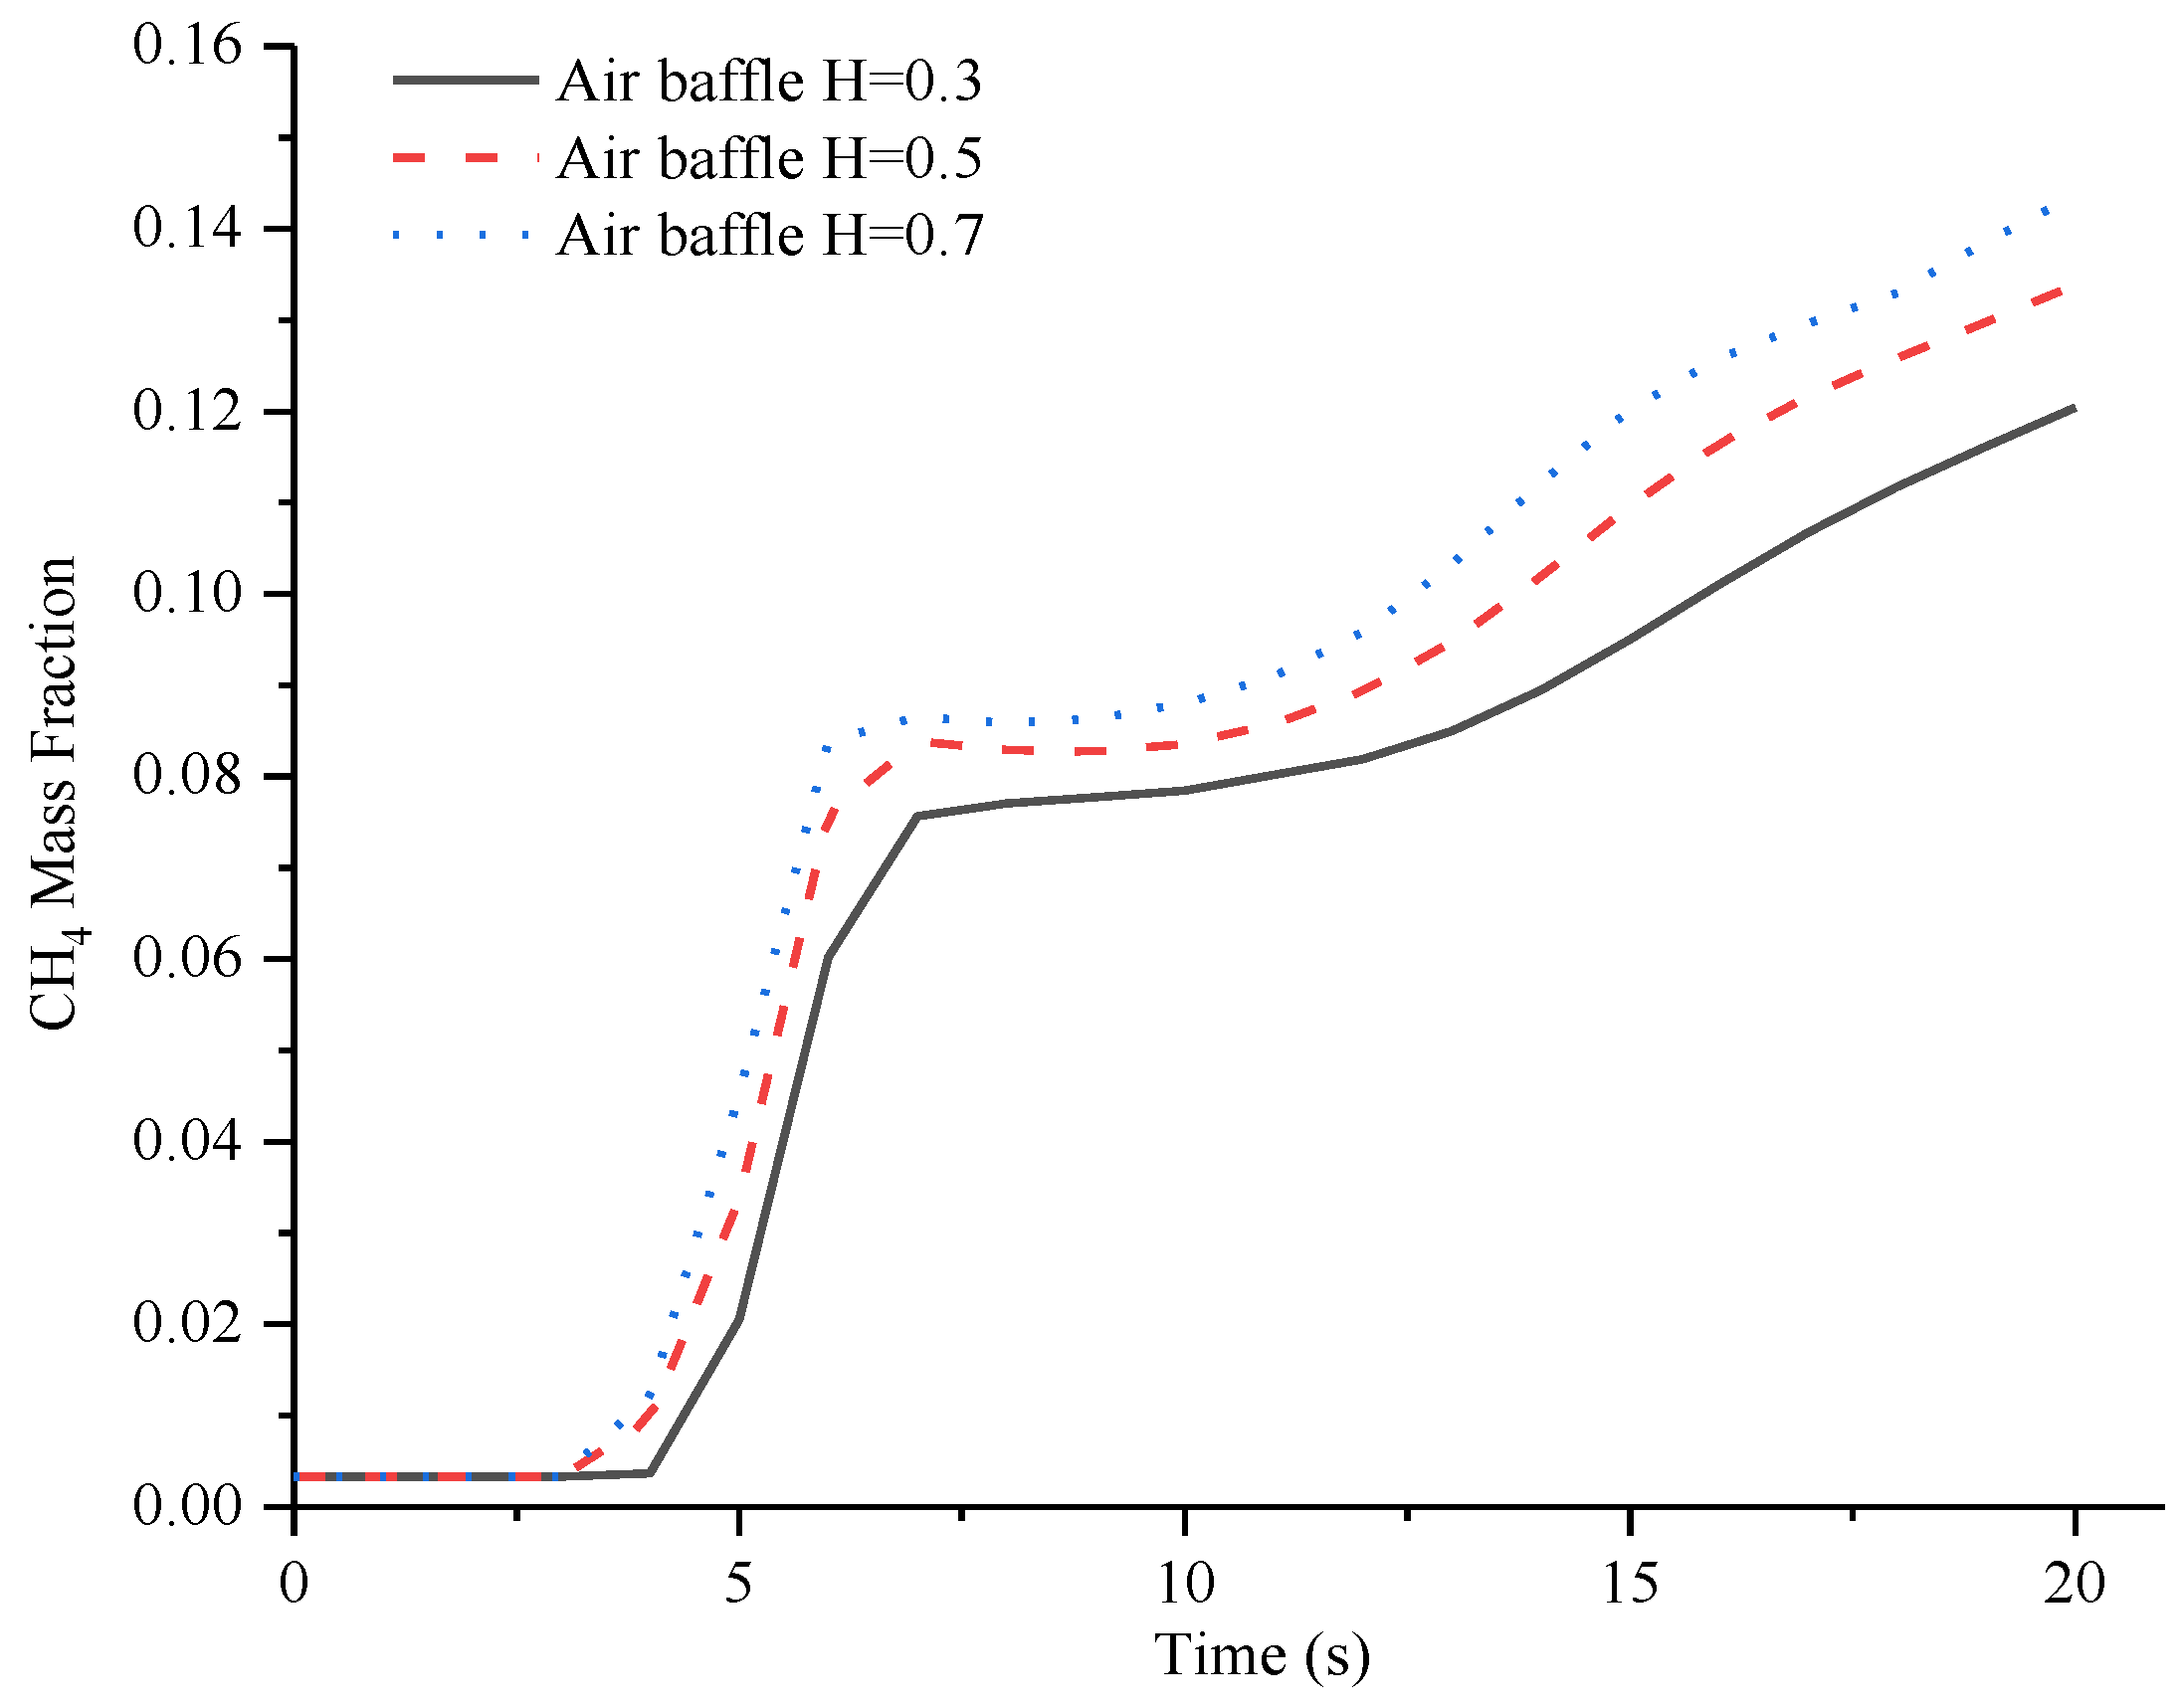
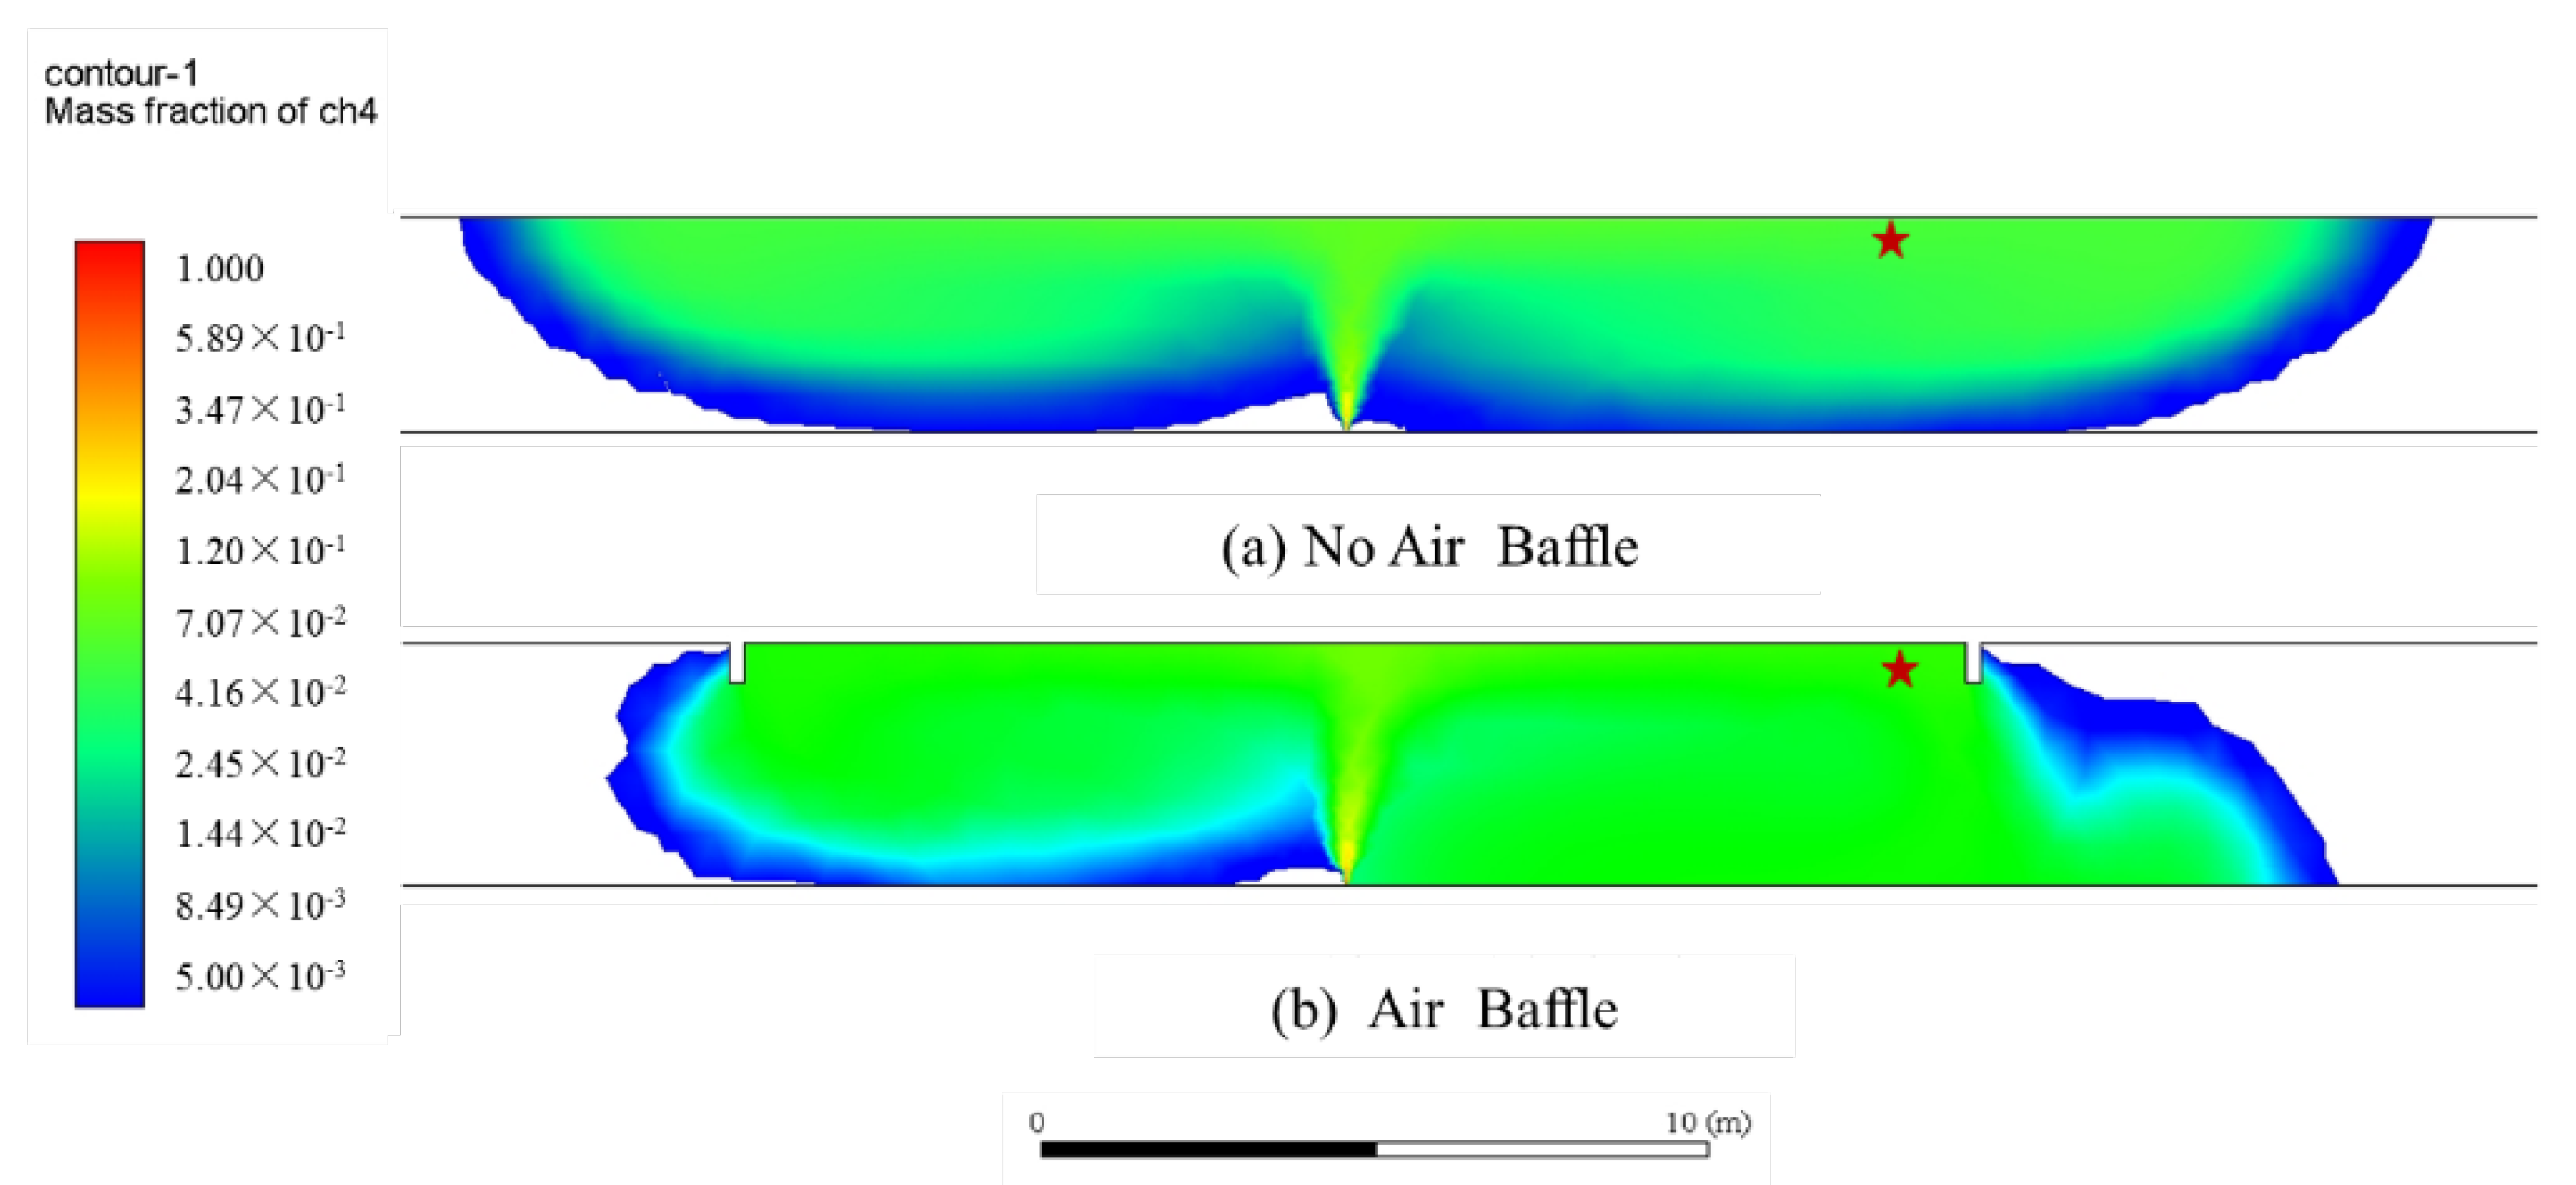
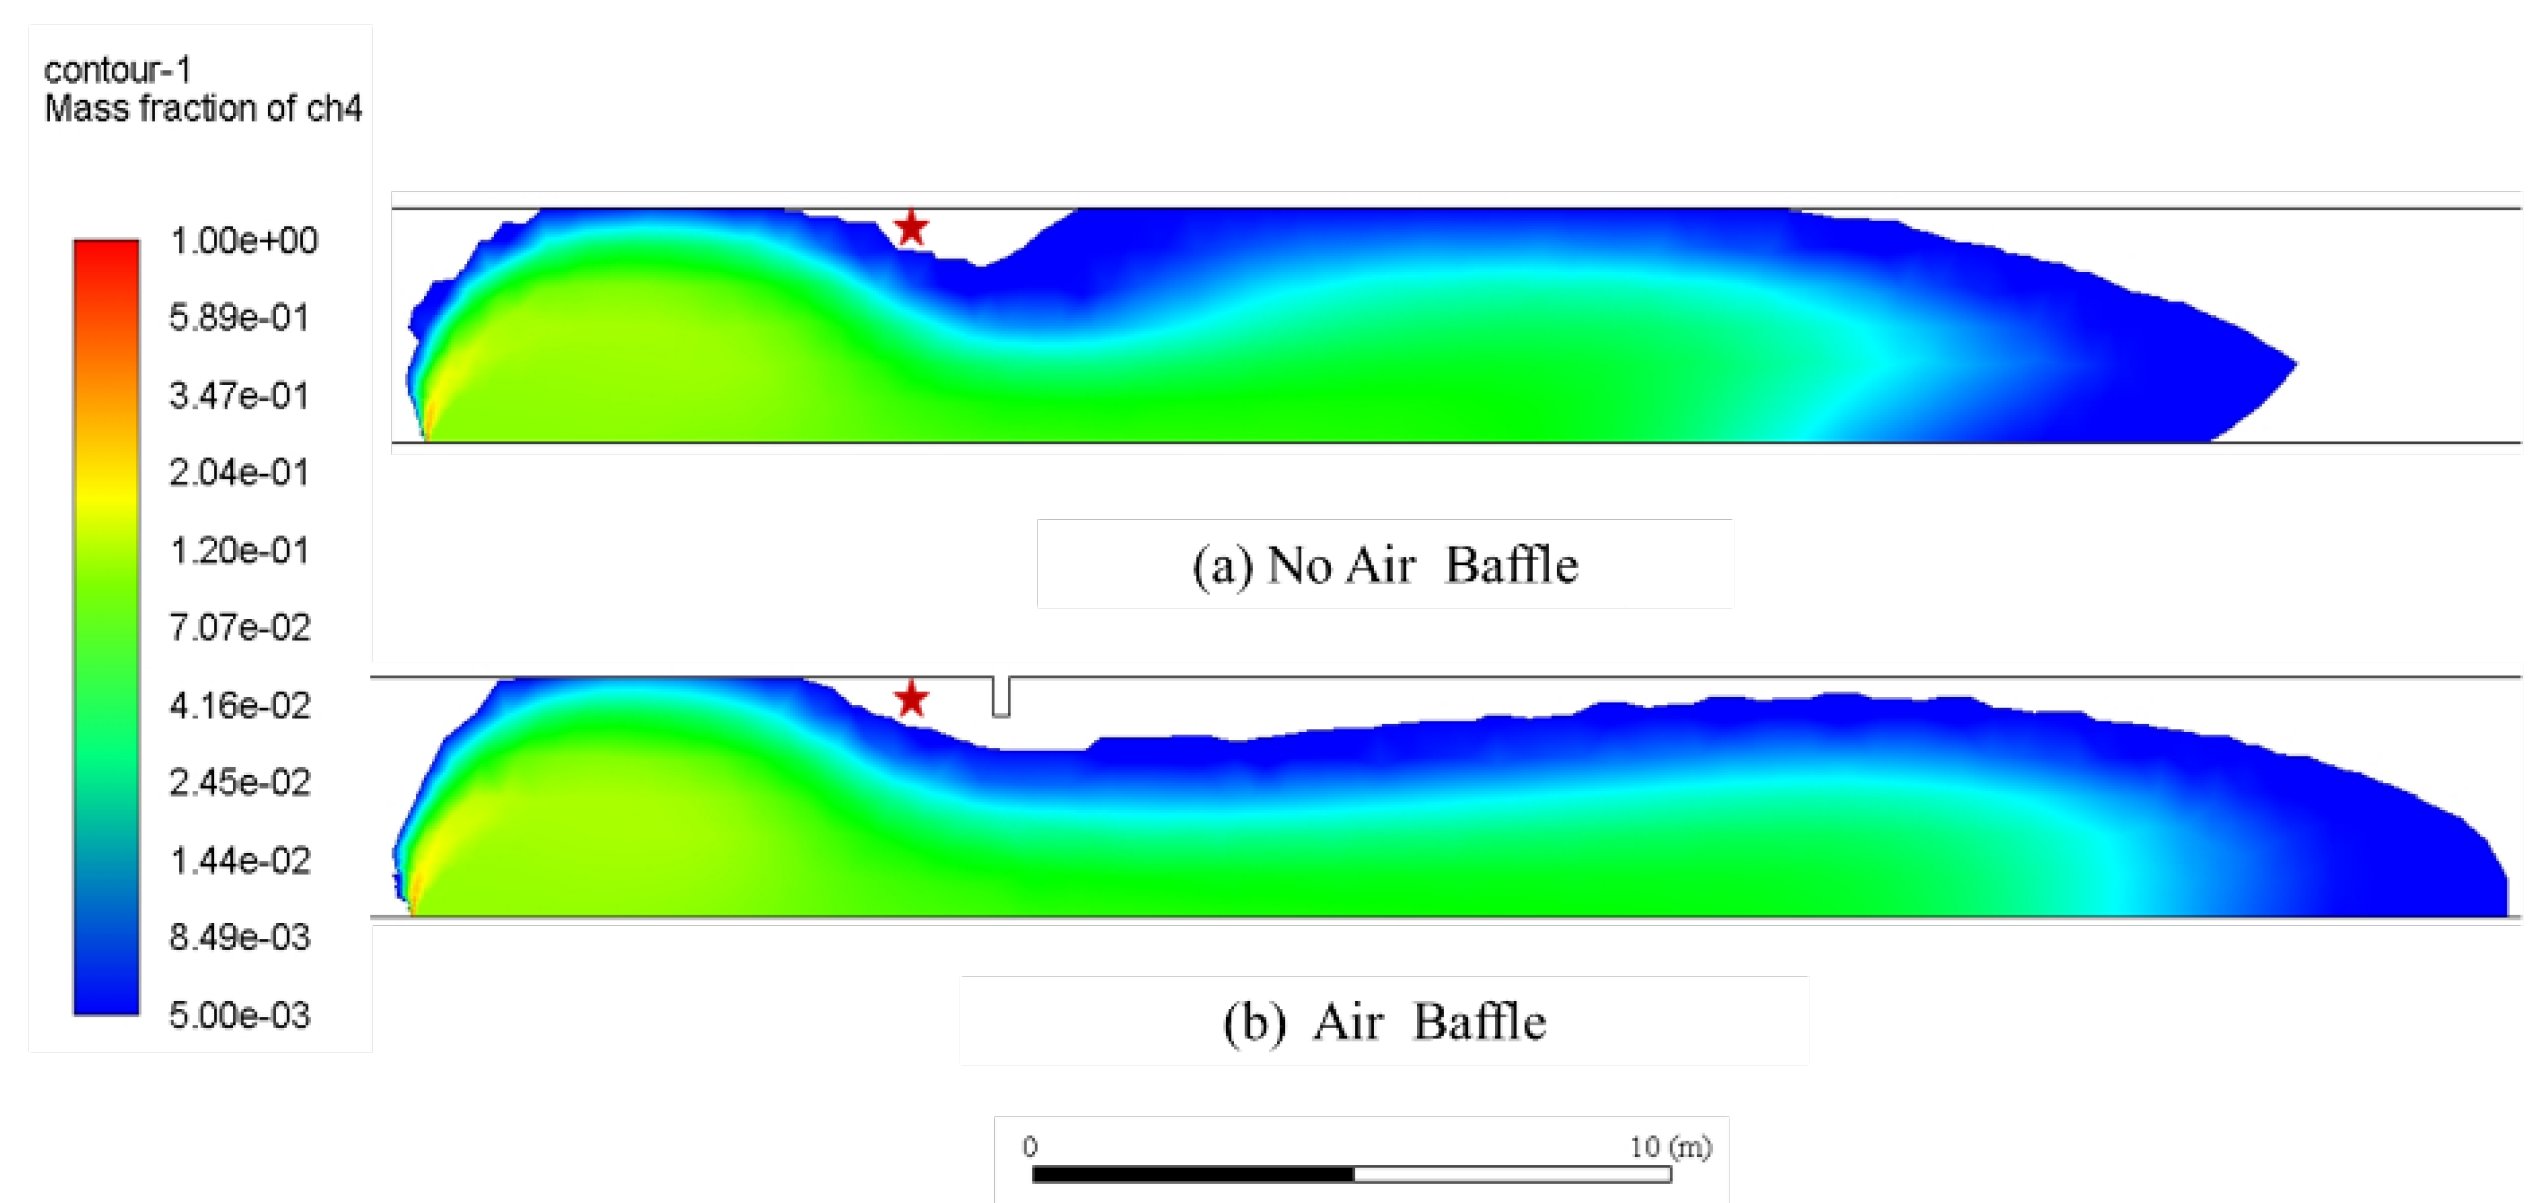
3.1.2. Analysis of the Impact of Air Baffles on Hazardous Areas

The spread of a gas leak will create a corresponding danger zone in the cabin. Under unventilated conditions, when the hazardous area of gas concentration in the cabin spreads to a certain extent, it usually increases the risk of explosion, so without ventilation, it is necessary to consider how to slow down the expansion of the hazardous area; while under ventilated conditions, it is desired that the gas in the hazardous area is discharged by the air outlet as soon as possible through the action of wind flow. In order to study the effect of the gas baffle on the hazardous area, the following simulations were carried out.
(1) No wind
In order to study the effect of adding a gas baffle on the CH4 hazardous area (mass fraction not less than 0.005) under non-ventilated conditions, the leak hole was located at the midpoint of the two monitors, and a simulation was carried out with a ventilation wind speed of 0 m/s, a leak velocity of 50 m/s, and a baffle height of 0.5 m. The distribution of the gas chamber danger zone for a leak duration of 10 s is shown in Figure 8 (marked at the downstream monitoring point in the figure).
By comparing Figure 8a,b, it can be seen that under unventilated conditions, the gas leak spreads uniformly to both sides after diffusion. With the addition of gas baffles, the dangerous area of gas concentration will be confined to the zone between the gas baffles for a certain period of time due to the blocking effect of the gas baffles, and the expansion rate of the dangerous area will be reduced. At the same time, with the addition of the gas baffle, in the event of a leak in the gas cabin, the leaking gas will be confined to the leak detection zone formed between two adjacent gas baffles, but as the zone does not constitute a confined space, the safety can be guaranteed to a certain extent. However, it should be noted that, depending on the requirements of the gas cabin, the air venting requirements, etc., the zone formed by the two gas baffles cannot be confined to the gas all the time and, at a certain length, the gas will continue to spread downstream outside the zone.
(2) Normal wind
Considering the effect of the additional gas baffle on the CH4 hazardous area under normal ventilation, the ventilation air velocity was adjusted to 1.38 m/s. The distribution of the hazardous area in the gas cabin when the leak lasts for 10 s is shown in Figure 8.
By comparing Figure 8 and 9, it can be seen that under normal ventilation conditions, as opposed to unventilated conditions, no dangerous areas of gas concentration appear upstream of the leak source, which also verifies the effectiveness of the ventilation measures. Additionally, based on the safe area that appears at the top in Figure 9, it can be judged that the position of the monitor that first alarms is subject to multiple factors such as ventilation wind speed, gas density, and the location of the leak hole, there is a possibility that the position of the monitor that first alarms is shifted back and may not be the closest downstream.
According to Figure 9a,b, under normal ventilation conditions, a continuous leak for 10 s will result in the hazard area spreading 31 m without the baffle and 37 m with the addition of the baffle, creating a larger safety zone on the leeward side of the baffle, while the gas that would have been stored in this area continues to spread downstream, to a certain extent facilitating the spread of the gas and preventing it from collecting inside the corridor. At the same time, the location of the second monitoring point where an alarm response occurs is shifted back due to the enlargement of the top safety zone. This provides a new idea and theoretical basis for optimising the arrangement scheme of the combustible gas monitoring system in the gas compartment of the integrated pipe corridor. Of course, considering the economics and practicality of gas baffles, this new optimised arrangement scheme also needs to consider the extent to which the selection of materials for gas baffles, installation issues, and technical parameters such as setting spacing can enhance the effect of gas monitoring. In conclusion, the effect of gas baffles on the diffusion of gas leaks in integrated pipeline corridors and their effectiveness still requires a large number of numerical simulations, experimental verification, and practical tests of specific projects.

3.2. Analysis of the Effect of Air Baffles on Explosion Shock Wave Propagation

According to the simulation results in Section 3.1, combined with the code requirements and engineering practice, the baffle height of 0.5 m and the baffle spacing of 50 m suggested by Huang et al. are appropriate. The addition of gas baffles is an obstacle in the gas cabin, so the effect of the addition of gas baffles on the propagation of the blast wave needs to be studied. To address this issue, this section sets up baffles at 30 m, 40 m, 50 m, and 70 m intervals in turn, as well as without baffles for comparison. The height of the baffle is set at 500 mm, the width at 1800 mm, and the thickness at 250 mm.

3.2.1. Time Variation of Overpressure at the Top and Middle of the Gas Chamber without Baffles

Figure 10 shows the contour of the overpressure change in the central section of the gas cabin without a gas baffle. After ignition, a combustion wave is generated in the cabin, which compresses the unburned gas to produce a compression wave, which propagates outwards as a spherical wave at the ignition point and is the first to come into contact with the upper and lower walls of the gas cabin and is reflected and superimposed, resulting in a greater overpressure at the top than at the centre. After the reflection and superposition of multiple compression waves, a plane shock wave is formed and propagates from the ignition end to the right. As shown in Figure 10, the overpressure in the gas cabin increases with time, showing a pattern of rising, then falling, and then rising again, and there are two obvious areas of overpressure. Due to the presence of the fire door, the shock wave propagates to the right side due to the superposition of reflections from the wall surface, resulting in a reflected wave in the opposite direction, and the overpressure value rises.
Figure 11 shows the time variation of the overpressure at the top and middle of the gas cabin without a baffle. As can be seen from Figure 11, when the filling length is 20 m, the overpressure at the top and middle of the gas cabin is basically the same: the overpressure changes with time showing a jagged repeated fluctuation, and there are multiple peaks at each monitoring point, and the time difference between the peaks is obvious. After ignition, the shock wave propagates to the right from the ignition end and reaches the G2-50 m monitoring point, where the overpressure rises to the first peak; after the antecedent shock wave passes, the overpressure drops, and the subsequent compression wave reaches the monitoring point, where the overpressure value rises again slightly and then drops. Due to the presence of fire doors, the gas cabin is closed at both ends, the pre-driven shock wave reaches the closed end and is reflected to form a reflected wave, which propagates to each monitoring point, and the overpressure at each monitoring point reaches the second peak; due to the superposition effect of the reflected wave and the shock wave leads to a surge of overpressure near the closed end, making the second peak overpressure near the closed end greater than the first peak, as shown in Figure 11b G2-170 m after the monitoring point, and the closer to the fire door, the more obvious the superimposed effect. According to Figure 11a,b comparison, at the beginning of the explosion, the overpressure at the top of the gas cabin was significantly greater than that at the middle, while when the shock wave was transmitted to the rightmost monitoring point at 190 m, the overpressure at the top and the middle was basically the same.

3.2.2. Variation of Overpressure with Time in the Top and Middle of the Gas Chamber for Different Baffle Spacing Conditions

Figure 12 shows the change in overpressure between the surface of the baffle and the wall of the nearby gas cabin when the pre-driven shock wave and the compression wave pass through the first baffle under 70 m baffle spacing conditions. As can be seen from Figure 12, after the explosion, the pre-driven shock wave first reaches the baffle because the gas cabin is 3.8 m high, the height of the baffle is 0.5 m, the pre-driven shock wave is divided into two parts by the baffle: the part above 3.3 m is reflected by the wall of the baffle to form a reflected wave, the reflected wave propagates in the opposite direction, and is superimposed with the shock wave, resulting in a surge of overpressure on the wall of the baffle and the top wall of the nearby gas cabin; the shock wave below 3.3 m continues to propagate to the right, and the pre-driven shock wave changes from a plane wave to a curved wave, resulting in increased flow disturbance, turbulence, and pressure near 3.3 m, especially at the bottom of the gas baffle. The reflected wave of the foreshock meets the subsequent compressional wave at the front of the baffle, and the superposition causes a sudden jump in the overpressure value, which then continues to propagate in their respective directions. The cloud diagram shows multiple overpressure regions propagating in front of and behind the baffle.
By comparing the overpressure variation curves under different working conditions in Figure 13, it is found that the overpressure variation law with time is basically the same as that of the working condition without a baffle. After the installation of the gas baffle, the number of jagged protrusions in the drop curve of each monitoring point of group 2 after reaching the peak overpressure increases as the distance between the gas baffles decreases, as shown in Figure 11b compared with the curve of the G2-10 m monitoring point in Figure 13a. When there is no baffle, the curve of G2-10 m is smooth after 0.05 s, compared to the 30 m baffle spacing, where there are obvious jagged protrusions during the descent of G2-10 m after 0.05 s. This is related to the wall reflection of the shock wave, the additional baffle case, the shock wave in the process of propagation, part of the shock wave is reflected by the top baffle wall, the formation of small strands of reflected waves to the opposite direction of propagation through the monitoring point, the formation of the descent process jagged protrusion, and with the reduction of the baffle spacing, the number of protrusions increased significantly. This indicates that the installation of additional gas baffles has a certain influence on the propagation of shock waves in the middle of the gas cabin. There is an increase in the airflow disturbance in the gas cabin, and as the distance between the gas baffles becomes smaller, this disturbance increases, which has a certain inhibiting effect on the propagation of shock waves in the middle of the gas cabin. The first overpressure peak and the second peak at the monitoring point of G2-190 m both decrease with the distance between the gas baffles, and the overall trend is decreasing, which indicates that the installation of additional gas baffles has a certain inhibiting effect on the propagation of shock waves in the middle of the gas cabin. This indicates that the installation of additional baffles has a certain effect on the suppression of shock wave propagation in the gas cabin.
Figure 14 shows the variation curve of overpressure at the top of the gas cabin under different baffle spacings. As can be seen from Figure 14, the baffle plate has a great influence on the overpressure change at the top of the gas cabin, but the general rule is basically the same: the monitoring points at the baffle plate cause the surge of the overpressure peak due to the superposition of reflection; the overpressure curve of the other monitoring points fluctuates repeatedly and gradually decreases with the increase in time in a zigzagged shape, and then spreads to the opposite direction after being reflected by the fire door. By comparing the variation curve of overpressure at the baffle under different working conditions, it is found that: the overpressure peak generated at the top of the gas cabin will increase with a decrease in the baffle spacing, and the baffle has a certain effect on inhibiting the shock wave propagation at the top of the gas cabin. By comparing the first and second overpressure peaks at the monitoring point of G1-190 m of the gas cabin under different working conditions, it can be found in Figure 11a and Figure 14. After the baffle is installed, the peak value of the first overpressure and the peak value of the second overpressure at the monitoring point of G1-190 m are smaller than those without the baffle.

4. Conclusions

A numerical model was established, and numerical simulations were carried out for the effect of the conditions of adding gas baffles to the top of the gas cabin of the utility tunnel on the diffusion of gas leaks and the propagation law of the explosion shock waves. A comparative analysis of the simulation results led to the following conclusions.
(1) In the absence of ventilation, methane leaks and accumulates on top of the gas cabin. As the amount of leakage increases, methane will travel along the roof of the gas cabin toward both sides of the leak hole. The baffle can limit the propagation of methane on the top of the gas cabin and slow down the diffusion velocity of the gas, thus increasing the concentration of methane near the gas baffle and speeding up the time for the monitor to reach the alarm concentration. Under normal ventilation, the gas baffle does not block methane discharge. The safety zone formed on the leeward side of the gas baffle indirectly accelerates methane discharge. After the height of the gas baffle has reached 500 mm, further increases in height do not significantly advance the alarm time. Taking into account the setting of the separator and the requirements of the exhaust air, it is recommended that the height of the gas baffle should be set at no greater than 500 mm.
(2) When the gas cabin is installed with the gas baffle, the first and secondary pressure peaks generated in the middle are smaller than those without the gas baffle. The gas baffle has the function of blocking the propagation of shock waves. However, due to the installation of the gas baffle, the superposition of the shock wave will make the pressure surge at the gas baffle. By comparing the simulation results of pressure change at the top of the gas cabin under different conditions with different gas baffle spacings, a distance of 50 m is recommended.
(3) Overall, the gas baffle has a certain effect on improving the efficiency of leak monitoring and inhibiting the propagation of explosion shock waves. The greater the horizontal distance between the leak hole and the downstream monitor, the more obvious the improvement in monitoring efficiency, and the smaller the peak overpressure at the top baffle of the gas cabin will be. Combined with the simulation results, it is recommended that the air baffle spacing is not less than 50 m and the height setting is not greater than 0.5 m.

Author Contributions

Conceptualisation, W.Z. and B.G.; methodology, W.Z. and B.G.; software, W.Z., S.S. and C.R.; validation, W.Z., B.G. and C.R.; formal analysis, B.G. and C.G.; investigation, W.Z. and C.R.; resources, B.G.; writing—original draft preparation, W.Z.; writing—review and editing, B.G., C.R. and S.S. All authors have read and agreed to the published version of the manuscript.

Funding

This research is supported by the “Strategic Consulting Research Project of Henan Re-search Institute of China Engineering Science and Technology Development Strategy (2023 HENZDB 05)”, the “NSFC- Shanxi Coal-based Low-Carbon Joint Fund Key Project (U1810203)” and the “Key R&D and promotion projects in Henan Province: (212102310013)” and the “Science and Technology R&D Plan Joint Fund in Henan Province (222103810098)”.

Institutional Review Board Statement

Not applicable.

Informed Consent Statement

Not applicable.

Data Availability Statement

Not applicable.

Conflicts of Interest

The authors declare no conflict of interest.

Abbreviations

ρ gas density (kg/m3)
t flow time (s)
u velocity of the fluid in the direction of the axis (m/s)
u x , u y the component of the velocity on the X- and Y-axis (m/s)
p static pressure (Pa)
τ x y stress tensor (Pa)
ρ g gravity body force
F external body force (N)
T thermodynamic temperature of the fluid (K)
k heat transfer coefficient
C p equipressure specific heat capacity (J/(kg·K))
S T viscosity damping term (Pa·s)
Ppressure (Pa)
ttime (s)
x, y, zrectangular coordinate system parameter
u, v, wthe velocities in each of the three coordinate directions
ρ fluid density
Ttemperature
Rgas constant
especific energy
γgas index

References

  1. Zhang, S.; Peng, S.; Du, J.; Zhao, W. Summary of Research on Safety of Gas Compartment in Domestic Utility Tunnel. Gas Heat 2019, 39, 1–9+44. [Google Scholar] [CrossRef]
  2. GB50838-2015; Technical Specification for Urban Utility Tunnel Engineering. Ministry of Housing and Urban-Rural Development: Beijing, China, 2015.
  3. GB 50058-2014; Code for Design of Electrical Installation in Explosive Atmospheres. Ministry of Housing and Urban-Rural Development: Beijing, China, 2014.
  4. Bai, Y.; Wu, J.; Yuan, S.; Reniers, G.; Yang, M.; Cai, J. Dynamic resilience assessment and emergency strategy optimization of natural gas compartments in utility tunnels. Process Saf. Environ. Protect. 2022, 165, 114–125. [Google Scholar] [CrossRef]
  5. Yang, K.; Hu, Q.; Sun, S.; Lv, P.; Pang, L. Research progress on multi-overpressure peak structures of vented gas explosions in confined spaces. J. Loss Prev. Process Ind. 2019, 62, 103969. [Google Scholar] [CrossRef]
  6. Bu, F.; Liu, Y.; Wang, Z.; Xu, Z.; Chen, S.; Hao, G.; Guan, B. Analysis of natural gas leakage diffusion characteristics and prediction of invasion distance in utility tunnels. J. Nat. Gas Sci. Eng. 2021, 96, 104270. [Google Scholar] [CrossRef]
  7. Wang, X.; Tan, Y.; Zhang, T.; Zhang, J.; Yu, K. Diffusion process simulation and ventilation strategy for small-hole natural gas leakage in utility tunnels. Tunn. Undergr. Space Technol. 2020, 97, 103276. [Google Scholar] [CrossRef]
  8. Yuan, S.; Wu, J.; Zhang, X.; Liu, W. EnKF-based estimation of natural gas release and dispersion in an underground tunnel. J. Loss Prev. Process Ind. 2019, 62, 103931. [Google Scholar] [CrossRef]
  9. Meng, Q.; Wu, C.; Li, J.; Wu, P.; Xu, S.; Wang, Z. A study of pressure characteristics of methane explosion in a 20 m buried tunnel and influence on structural behaviour of concrete elements. Eng. Fail. Anal. 2021, 122, 105273. [Google Scholar] [CrossRef]
  10. Yang, Y.; Wu, C.; Liu, Z.; Du, J.; Zhang, H.; Xu, S.; Zhou, S. Protective effect of unbonded prestressed ultra-high performance reinforced concrete slab against gas explosion in buried utility tunnel. Process Saf. Environ. Protect. 2021, 149, 370–384. [Google Scholar] [CrossRef]
  11. Xue, Y.; Chen, G.; Zhang, Q.; Xie, M.; Ma, J. Simulation of the dynamic response of an urban utility tunnel under a natural gas explosion. Tunn. Undergr. Space Technol. 2021, 108, 103713. [Google Scholar] [CrossRef]
  12. Wang, S.; Li, Z.; Fang, Q.; Yan, H.; Chen, L. Performance of utility tunnels under gas explosion loads. Tunn. Undergr. Space Technol. 2021, 109, 103762. [Google Scholar] [CrossRef]
  13. Zhao, Y.; Wu, J.; Zhou, R.; Cai, J.; Bai, Y.; Pang, L. Effects of the length and pressure relief conditions on propagation characteristics of natural gas explosion in utility tunnels. J. Loss Prev. Process Ind. 2022, 75, 104679. [Google Scholar] [CrossRef]
  14. Wang, S.; Li, Z.; Fang, Q.; Yan, H.; Liu, Y. Numerical simulation of overpressure loads generated by gas explosions in utility tunnels. Process Saf. Environ. Protect. 2022, 161, 100–117. [Google Scholar] [CrossRef]
  15. Fang, Z.; Lin, H.; Huang, H.; Zheng, H. Model test and numerical simulation of gas leakage and diffusion in pipe gallery. Eng. Mech. 2006, 189–192. [Google Scholar] [CrossRef]
  16. Deng, X.; Yao, A.; Xu, T.; Jiang, H. Study on leakage and diffusion laws of gas pipeline in gas cabin of urban utility tunnel. J. Saf. Sci. Technol. 2019, 15, 83–89. [Google Scholar] [CrossRef]
  17. Zhang, P.; Lan, H. Effects of ventilation on leakage and diffusion law of gas pipeline in utility tunnel. Tunn. Undergr. Space Technol. 2020, 105, 103557. [Google Scholar] [CrossRef]
  18. Gao, J.; He, X.; Qiu, Y.; Mao, J. Experiment and numerical simulation on oil vapor explosion in oil pipelines. Oil Gas Storage Transp. 2019, 38, 71–75. [Google Scholar] [CrossRef]
  19. Xia, W.; Gao, K.; Qiao, G. Study on propagation characteristics of gas explosion shock wave in gas cabin of utility tunnel. J. Saf. Sci. Technol. 2021, 17, 84–90. [Google Scholar] [CrossRef]
  20. Xu, A.; Chen, X.; Jia, J. Effects of obstacles on gas explosion shock wave propagation. China Saf. Sci. J. 2019, 29, 96–101. [Google Scholar] [CrossRef]
  21. Zhang, Y.; Sun, H. Experimental study on effect of obstacles on gas explosion overpressure in duct. J. Heilongjiang Univ. Sci. Technol. 2017, 27, 350–353. [Google Scholar] [CrossRef]
  22. Author, Z.M. Study on Structural Dynamic Response and Damage Laws of under Gas Explosion in Underground Utility Tunnel. Master’s Thesis, Beijing University of Civil Engineering and Architecture, Beijing, China, 2020. [Google Scholar]
  23. Fang, W.; Wu, J.; Bai, Y.; Zhang, L.; Reniers, G. Quantitative risk assessment of a natural gas pipeline in an underground utility tunnel. Process Saf. Prog. 2019, 38, e12051. [Google Scholar] [CrossRef]
  24. Hu, Q.J.; Tang, S.; He, L.P.; Cai, Q.J.; Ma, G.L.; Bai, Y.; Tan, J. Novel approach for dynamic safety analysis of natural gas leakage in utility tunnel. J. Pipeline Syst. Eng. 2021, 12, 06020002. [Google Scholar] [CrossRef]
  25. Bai, Y.; Wu, J.; Sun, Y.; Cai, J.; Cao, J.; Pang, L. BN & CFD-based quantitative risk assessment of the natural gas explosion in utility tunnels. J. Loss Prev. Process Ind. 2022, 80, 104883. [Google Scholar] [CrossRef]
  26. Wu, J.; Bai, Y.; Fang, W.; Zhou, R.; Reniers, G.; Khakzad, N. An Integrated Quantitative Risk Assessment Method for Urban Underground Utility Tunnels. Reliab. Eng. Syst. Saf. 2021, 213, 107792. [Google Scholar] [CrossRef]
  27. Zheng, H.; Li, P.; Ma, G.; Zhang, Q. Experimental investigation of mechanical characteristics for linings of twins tunnels with asymmetric cross-section. Tunn. Undergr. Space Technol. 2022, 119, 104209. [Google Scholar] [CrossRef]
  28. Wang, J.; Huang, J.; Wang, H. The Utility Model Relates to a Safety Prevention and Control Device for Gas Cabin of a Utility Tunnel. CN209340888U, 3 September 2019. [Google Scholar]
  29. Li, Z. Risk Assessment on Natural Gas Pipelines in an Urban Utility Tunnel. Master’s Thesis, South China University of Technology, Guangzhou, China, 2018. [Google Scholar]
  30. Wan, L.; Zhang, G.; Li, K. Study on Natural Gas Leakage and Diffusion Law in Utility Tunnel based on CFD. Chin. J. Undergr. Space Eng. 2018, 13, 900–905. [Google Scholar]
Figure 1. Two-dimensional simplified physical model of a gas leak.
Applsci 13 04264 g001
Figure 2. The influence of different mesh sizes on the calculation results.
Applsci 13 04264 g002
Figure 3. Three-dimensional diagram of the explosion model.
Applsci 13 04264 g003
Figure 4. CH4 concentration at detection points versus time under unventilated conditions.
Applsci 13 04264 g004
Figure 5. CH4 concentration versus time at monitoring points under normal ventilation conditions.
Applsci 13 04264 g005
Figure 6. Effect of air baffles at different heights.
Applsci 13 04264 g006
Figure 7. The relationship between CH4 concentration and time change at monitoring points at different leakage locations.
Applsci 13 04264 g007
Figure 8. Under the condition of no wind, the dangerous area of the gas cabin with (a) No Air Baffle and (b) Air Baffle, when the gas leakage continues for 10s.
Applsci 13 04264 g008
Figure 9. Under normal ventilation conditions, the dangerous area of the gas cabin with (a) No Air Baffle and (b) Air Baffle, when the gas leakage continues for 10 s.
Applsci 13 04264 g009
Figure 10. Contour diagram of overpressure change diagram of gas cabin without gas baffle.
Applsci 13 04264 g010
Figure 11. Overpressure-time curves of each monitoring points in the top and middle of the gas cabin without gas baffle.
Applsci 13 04264 g011
Figure 12. Overpressure cloud image of the baffle and the wall of the gas cabin when the spacing is 70 m.
Applsci 13 04264 g012
Figure 13. Overpressure-time curve of middle of gas cabin with different gas baffle spacing.
Applsci 13 04264 g013
Figure 14. Overpressure-time curves of top of gas cabin with different gas baffle spacing.
Applsci 13 04264 g014
Disclaimer/Publisher’s Note: The statements, opinions and data contained in all publications are solely those of the individual author(s) and contributor(s) and not of MDPI and/or the editor(s). MDPI and/or the editor(s) disclaim responsibility for any injury to people or property resulting from any ideas, methods, instructions or products referred to in the content.

