1. Introduction
Technology companies, including Microsoft, Facebook, and Apple, have increasingly realized the importance of empathy to business success [
1]. Companies are considered empathetic when they act ethically, treat their employees well, communicate better with their customers, and focus on their users [
1]. The concern of some companies may be focused on the development of disruptive solutions with other paradigms of use but without a prior investigation of the added value of how useful that product or service will be for the target user.
In the context of the development of innovative technological solutions, the company’s notion of creating empathy for customers was extended to the company’s professionals (solution development team), who seek empathy for the target users of their solutions, focusing on quality.
In the context of developing innovative technological solutions, this notion of creating empathy between customers for the company has been extended to create empathy between the company’s professionals (solution development team) for the target users, aiming at the quality of the solution [
2,
3,
4].
However, concern about empathy was not always present in technology solutions companies. According to CAMPOS [
5], some companies were confused about how, when, and where to apply software and hardware solutions in order to generate value for their users. In an Internet of Things (IoT) solutions, for example, the product or service lifecycle becomes more complex due to the various forms of interactivity (by human movement, voice, and occurrence of environmental phenomena, among others), as well as the contextual aspects of the use of pluggable devices and technical challenges such as cross-technology, and incompatibility between manufacturers. The author also emphasizes that the focus is on the use of the product itself, not on the applicability of the solutions. So, the concern of some companies may be focused on the development of disruptive solutions with other paradigms of use, but without prior investigation of the added value of how useful this product or service will be for the target user
Thus, the processes of developing innovative solutions include building empathy practices. These are the cases of design methodologies, design thinking (DT) [
2], double diamond [
6], and Google Sprint [
7], which include moments of integration between a development team and target users of the solution, in order to emerge feelings of trust, consent, and other factors. The team or part of it applies techniques to develop empathic skills, putting itself in the user’s shoes during experiments, for example. Although these methodologies exist for creating an idea focused on the user, the relationship between the feeling of empathy in the technical team and the impact of this on the UX (user experience) quality of the solution remains a study opportunity due to the lack of studies in the field.
The general objective of this research is to guide UX specialists in building empathy for users during the co-creation of an ideal innovative solution together with software developers. The research questions were guided by the author’s assumption and study opportunity about the importance of empathy in creating user-centered solutions, that is, solutions that solve one or several problems of the target audience. This assumption is based on the following considerations: user empathy is generally perceived as motivating developers to make an effective product; the developers’ empathy practices impact their engagement behaviors with processes and search for a quality UX solution; the developers’ empathy practices impact their perceptions of the solution developed during this process. To answer these questions, a case study was carried out with an innovative solution.
In this research, the UX quality of a solution means that the built solution must, above all, provide a good experience to the target users and solve their difficulties.
To contextualize this investigation, the following research questions (RQ) were defined considering the construction and application of empathy in the process of developing innovative solutions using UX techniques:
Central question: Is there an impact of applying empathy in the process of creating innovative solutions?
RQ1: Do the empathy practices performed by developers impact their behaviors of process involvement and pursuit of a UX quality solution?
RQ2: Do the empathy practices performed by developers impact their perceptions of the solution developed during this process?
The objective of this research is to measure the effectiveness of building empathy in technical teams, as well as its impact on the design of innovative solutions. In this research, assumptions about the team’s perceptions of the UX quality of a solution (the optimal solution) are crafted, as well as its engagement behavior, with empathy as a mediating variable. To verify them, activities to find out what is the professional’s perception of the empathy practices were performed, as well as their involvement and the solution used by the user. As a contribution to human-computer interaction (HCI), this research presents itself as a way to show the return on investment of UX techniques for the design of better solutions.
For areas related to HCI, some contributions are also made: in education, UX techniques are often taught, such as an empathy map, when approaching design thinking processes. The measurement carried out on empathy, in a real case, supports the HCI students to understand the importance of building the team’s empathy by the user for the quality of the solution; in software engineering (SE), the presented approach pursues the integration between professionals who practice UX and SE professionals, who apply the understanding of UX in the ideas and construction of the solution.
To accomplish the objective of this work, four specific actions were carried out:
- (1)
Bibliographic research in academic studies regarding studies that conceptualize and work with empathy and studies regarding processes for developing innovative solutions that support the construction of empathy by the development team.
Although there are several methodologies for creating an idea focused on the user, the investigation of its results, that is, the measurement of the relationship of empathy built in the technical team and the impact of this on the UX quality of the solution, is still a gap, or that is, there is a lack related to the practical application. It is noteworthy that in this research, the quality of the UX of a solution means that the solution built must mainly provide a good experience to the target users and solve a relevant problem for them, adding value to their lives. Thus, this research intends to fill this gap.
- (2)
Scope definition and delimitation of the study cases, as well as their planning and execution.
- (3)
Selection of the participants, validation methodologies, and validation experiences.
- (4)
Conduction of the experiences, analysis, and presentation of the results, challenges, and limitations.
2. Background and Related Work
This section will be organized into two subsections: in the first, works that conceptualize and work with empathy are presented; in the second section, processes for developing innovative solutions that support the construction of empathy by the team are presented.
2.1. Conceptualization of Empathy
Lipps [
8] and other researchers (Freud [
9], Kohler, Piaget, and Mead [
10]) agree that empathy is a cognitive process for an individual to feel in another person, to understand how they see the world. Companies that develop technology solutions have been using empathy as a business strategy to attract users to use their products [
11]. To them, empathy is used to identify potential target groups and meet their specific needs, providing new features and experiences in their solutions [
11]. Ferro and Heemann use empathy in the ideation phase of the DT process [
12] for the desirable solutions to be guided by the user’s needs [
2].
Based on Lipps’ definition [
8], empathy is a process of putting yourself in someone else’s shoes, where one can see the importance of stimulating the construction of an empathetic look from programmers to the target audience of an innovative solution. This may be possible through HCI techniques. According to Ferreira [
13], the expression multidisciplinary teams refer to a group of people, who together apply to a task or work, deepening their knowledge or knowledge with theories from independent disciplinary fields. Collaboration helps in the development of complex tasks where individual work is not enough to fulfill them [
14]. In addition to supporting the understanding of difficult problems, collaborative multidisciplinary teams can also gain empathy in order to support the construction of the scope of a project [
15]. Practices must be applied to develop the courage to learn something the professional does not yet know and the humility to trust relatively in something they do not yet know [
12].
2.2. Processes for Building Empathy
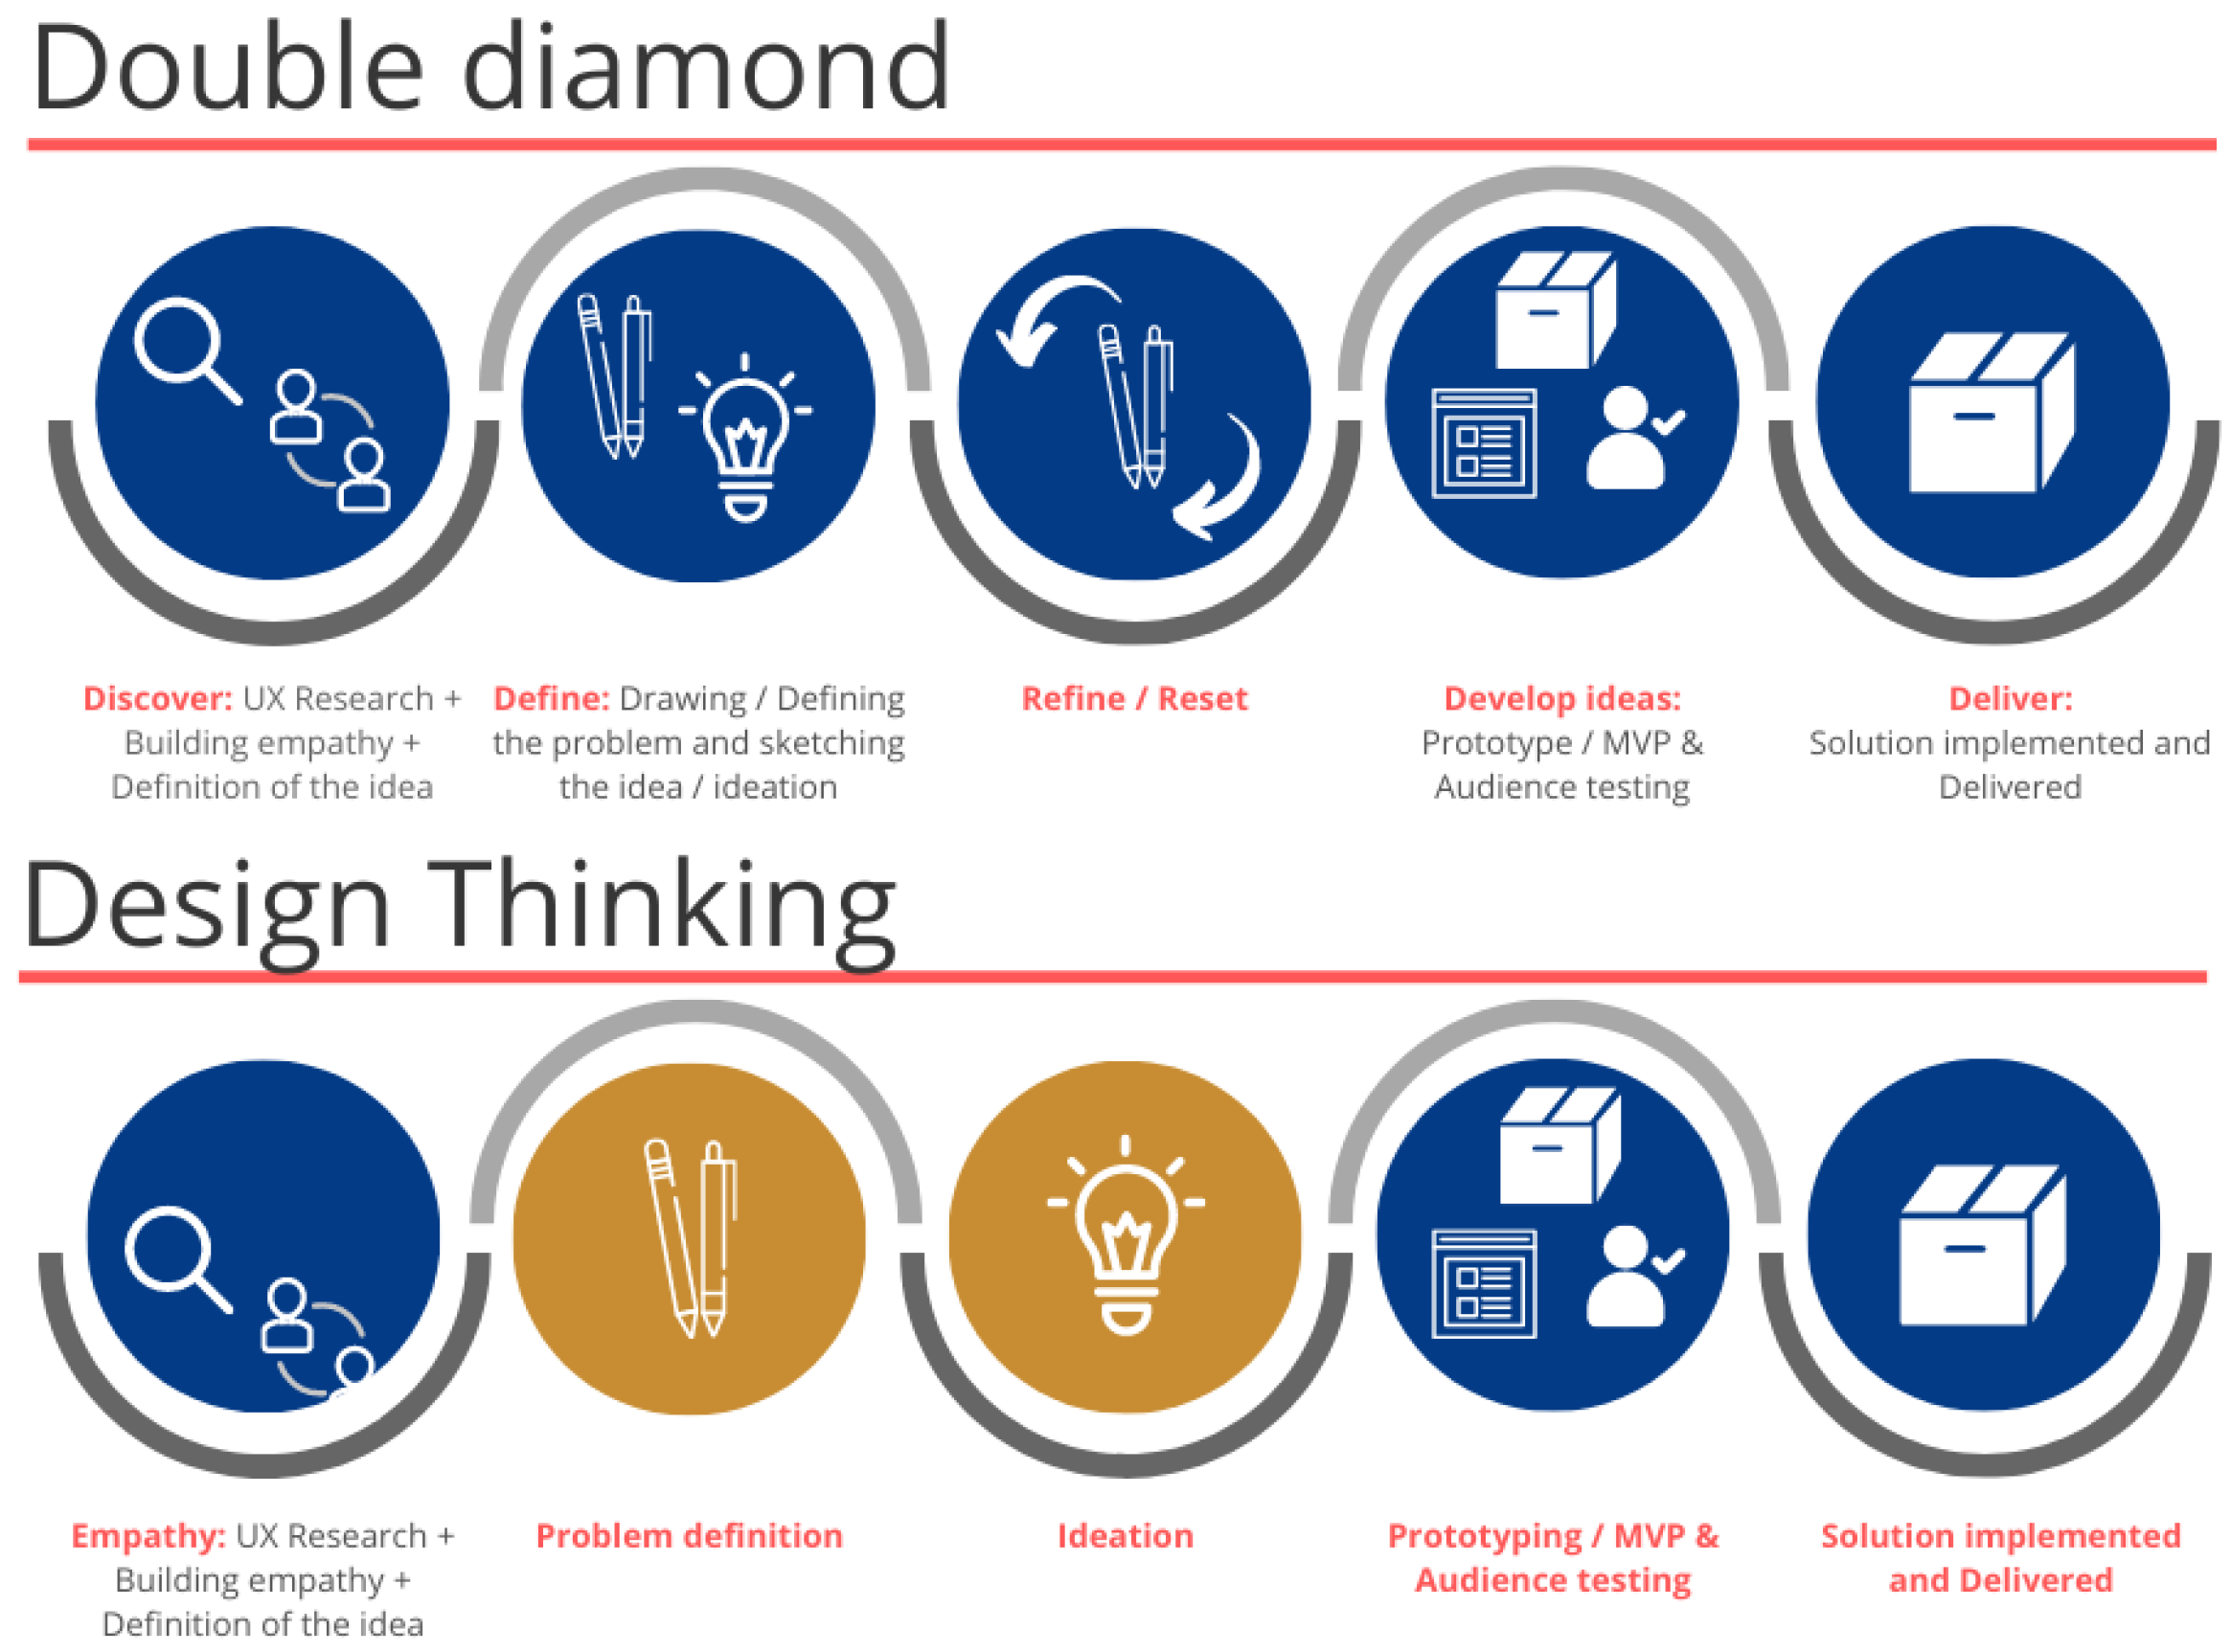
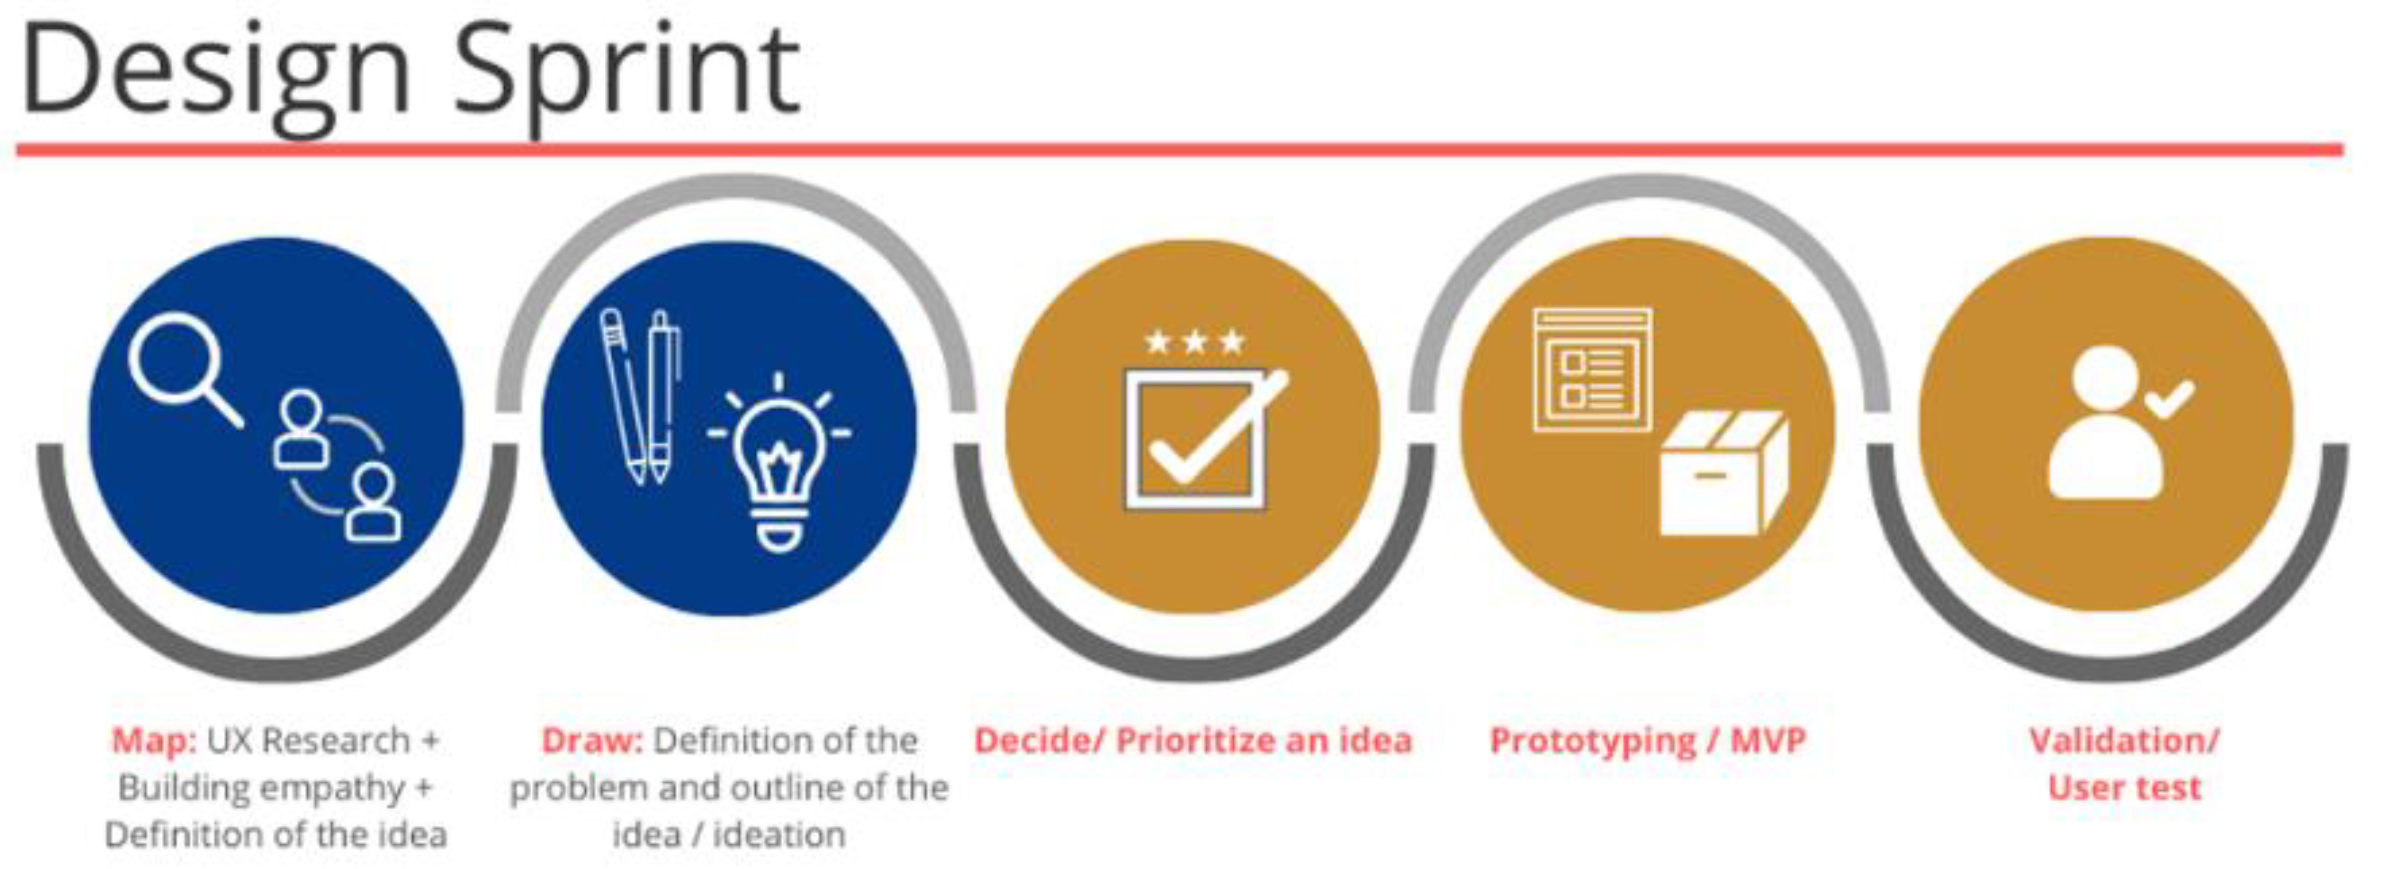
Collaborative and empathic work occurs in processes such as double diamond, DT and design sprint, where the practice of empathy between the designer and the user is encouraged in multidisciplinary teams [
2,
3,
4]. These design processes are widely known and start the idea of process creation, with the understanding of the user’s need, through UX techniques, which seek to develop empathic skills. However, they have some differences, as illustrated in the three images in
Figure 1 and
Figure 2 and explained below.
Double diamond: This method was developed in 2005 by the UK Design Council and is used to solve customer problems with innovation [
6]. It has different phases that allow you to identify the problem, develop a solution, and then analyze it.
Design thinking: A management approach that encourages the creation of innovative solutions through methods such as double diamond. This is a process centered on interaction and empathy with the customer to identify problems, develop solutions, and test them [
2].
Design sprint: The methodology uses five steps, with specific objectives, carried out in exactly five days to conceive an idea into something tangible and testable [
7]. Before carrying on with the steps, it is necessary to define the problem or challenge to be solved and select a team of professionals, preferably multidisciplinary [
7].
In general, they are user-centric innovation processes [
2,
6,
7] that use empathy to simulate the interests of users before finding an idea. All integrate UX techniques (such as empathy map, journey map, and prototyping). In [
16], when the authors show personas and their trajectories to a multidisciplinary project team, empathy is collaboratively co-created. As for the validation of ideas, only TML suggests the integration of research (design science) with practice, as it conducts UX research and prioritizes the ideas raised based on user-centered factors. Only the DT has validation with the user before final delivery. However, this validation often occurs at the minimum level of prototype or viable product and does not have a specific process to plan and execute this moment.
Neither of these processes measures built empathy nor its impact on the application of UX techniques in the process or on the UX quality of the final product.
2.3. Empathy Measurement
According to Davis’ model [
17], in a prototypical empathic episode, observing someone triggers mechanisms that produce responses in the observer. Four sequential components are identified in this episode: antecedents, processes, intrapersonal consequences, and interpersonal consequences.
The IRI (Interpersonal Reactivity Index) Model, proposed by Davis [
18], is one of the most used measures to analyze empathy in different areas of psychology and neuroscience [
19,
20]. Because it is a renowned model, the IRI was chosen to be applied in this research. The IRI, created in 1983 by Davis, is a scale capable of evaluating the affective and cognitive dimensions of empathy. According to Davis’ model, in an empathic episode, the observation of a target triggers mechanisms that produce responses in the observer. In this episode, the four sequential components are identified [
20] (see
Figure 3):
Background: characteristics of the observer or the situation.
Processes: mechanisms by which the empathic response is produced.
Intrapersonal consequences: the responses that occur in the observer due to exposure to the target (interpretations, empathic concern, or forgiveness).
Interpersonal consequences: behavioral responses aimed at the observed person (help).
The IRI has a multidimensional conception of empathy based on four sub-scales [
20]:
Subscale 1: perspective taking—reflects the person’s tendency to adopt the other’s points of view.
Subscale 2: empathic concern—measures the person’s ability to experience feelings of compassion and concern for the other.
Subscale 3: personal discomfort—assesses the person’s feelings of anxiety, apprehension, and discomfort in tense interpersonal contexts.
Subscale 4: fantasy—assesses the person’s propensity to put themselves in fictional situations.
Different from other research carried out with the IRI indicator [
18,
20,
21], this article analyzes the impact of empathy regarding the questions of this research.
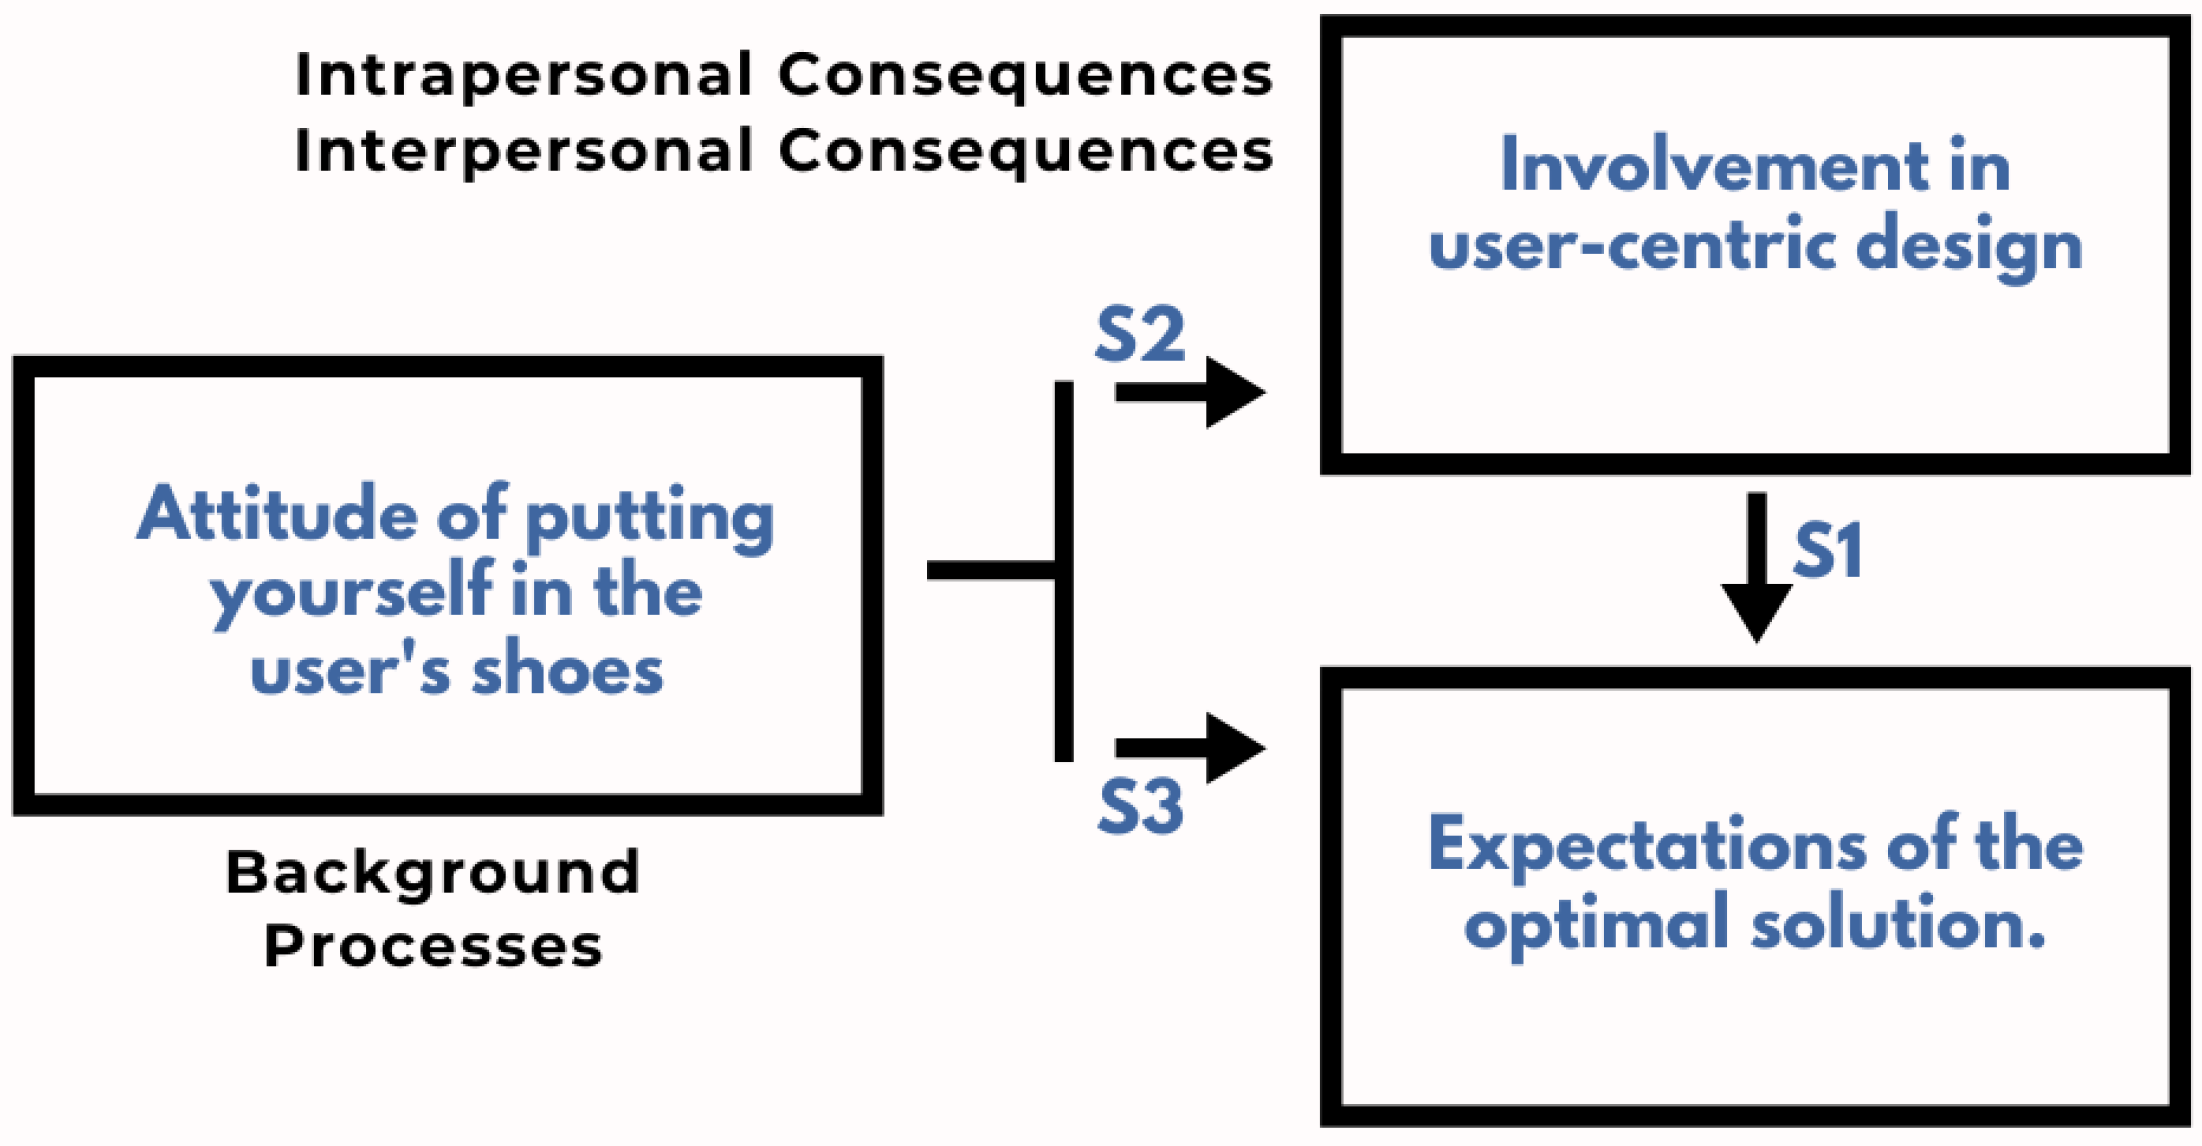
In this research, a new subscale for the IRI model is suggested, where the purpose of this inclusion is to measure the developers’ perception of the UX quality of a solution, as well as their engagement behaviors to seek an ideal solution.
Subscale 5: impact of building the technical team’s empathy for the user, on the quality of the UX, and on the execution of its activities by capturing the observer’s perception regarding the impact of knowing the user’s pain, in relation to the execution of their technical activities of the project to meet RQ1 and RQ2.
Three variables were identified to elaborate the assumptions that generated the answers for the research:
Empathy practices: it was considered as a professional’s perception of their attitude of putting themselves in the user’s shoes and analyzed considering the four mentioned IRI subscales, that is, perspective taking, empathic concern, and personal discomfort of a person affect the personal characteristics of developing the feeling of empathy [
20];
Professional involvement in user-centered design: it was analyzed considering the professional’s involvement in UX concepts and techniques (e.g., if a developer, during their technical activity of coding, thought about the effectiveness of the solution from the perspective of UX quality and added value for the user);
UX quality in the built solution (the optimal solution): it was analyzed by comparing what the professional expected the solution to be and what he realized when he saw its use by the user.
The following were the assumptions (S) identified (see
Figure 4):
S1: Involvement in user-centric design affects the expectation of an optimal solution. This allows you to verify the importance he gives to UX techniques. If he gets too involved in applying UX techniques, he is expected to have a matched expectation.
S2: The professional’s attitude of putting himself in the user’s place in the development of the solution affects his involvement in user-centered design when performing his technical activities.
S3: The professional’s attitude of putting himself in the user’s place in the development of the solution affects his expectation of an optimal solution.
In
Figure 4, the conceptual model of this research is presented to guide the analysis of the assumptions.
3. Case Study Used in Assumption Analysis
The case study of this research was a project in the electrical sector, where a solution with augmented reality and smart glasses Real Wear HMT1 was developed to support electricians in equipment maintenance.
The challenge studied came from the electricity sector, which required that the solution be developed using augmented reality and computational intelligence technologies. The challenge was to increase the efficiency of maintenance of specific equipment in the area. That is, assisting electricians in decision-making, providing them with information and instructions compatible with the maintenance of such equipment, as well as training them.
3.1. Participants
The project’s technical team, which participated in this case study, was composed of seven male members between 20 and 35 years old and exercised the role of developer. The seven information technology professionals, in addition to the UX specialist, participated in this project with the following responsibilities:
A UX/requirements/testing expert: conducted UX research and elicited/prioritized requirements and performed application testing.
Two software developers: implemented project application requirements.
Three specialists in the field of augmented reality/artificial intelligence: implemented techniques for automatic object detection and 3D modeling of selected equipment.
An automation engineer: described instructions for handling equipment.
One of the project managers: monitoring project impediments, schedules, and resources.
As for the users, there were thirteen male electricians, where 81.9% were between 18 and 39 years old, and 18.2% were between 40 and 49 years old. Furthermore, 63.6% of them had less than 2 years of experience. It is noteworthy that none of the users had used smart glasses before.
3.2. Validation Method
All professionals with different professional/life experiences, such as technical knowledge in different areas, participated in the empathic design process applied in this study, from building empathy to consolidating user test results. These professionals were able to contribute suggestions for improvements according to the user’s needs. These steps were part of the empathic design process, briefly described as follows.
3.3. Empathic Design Process
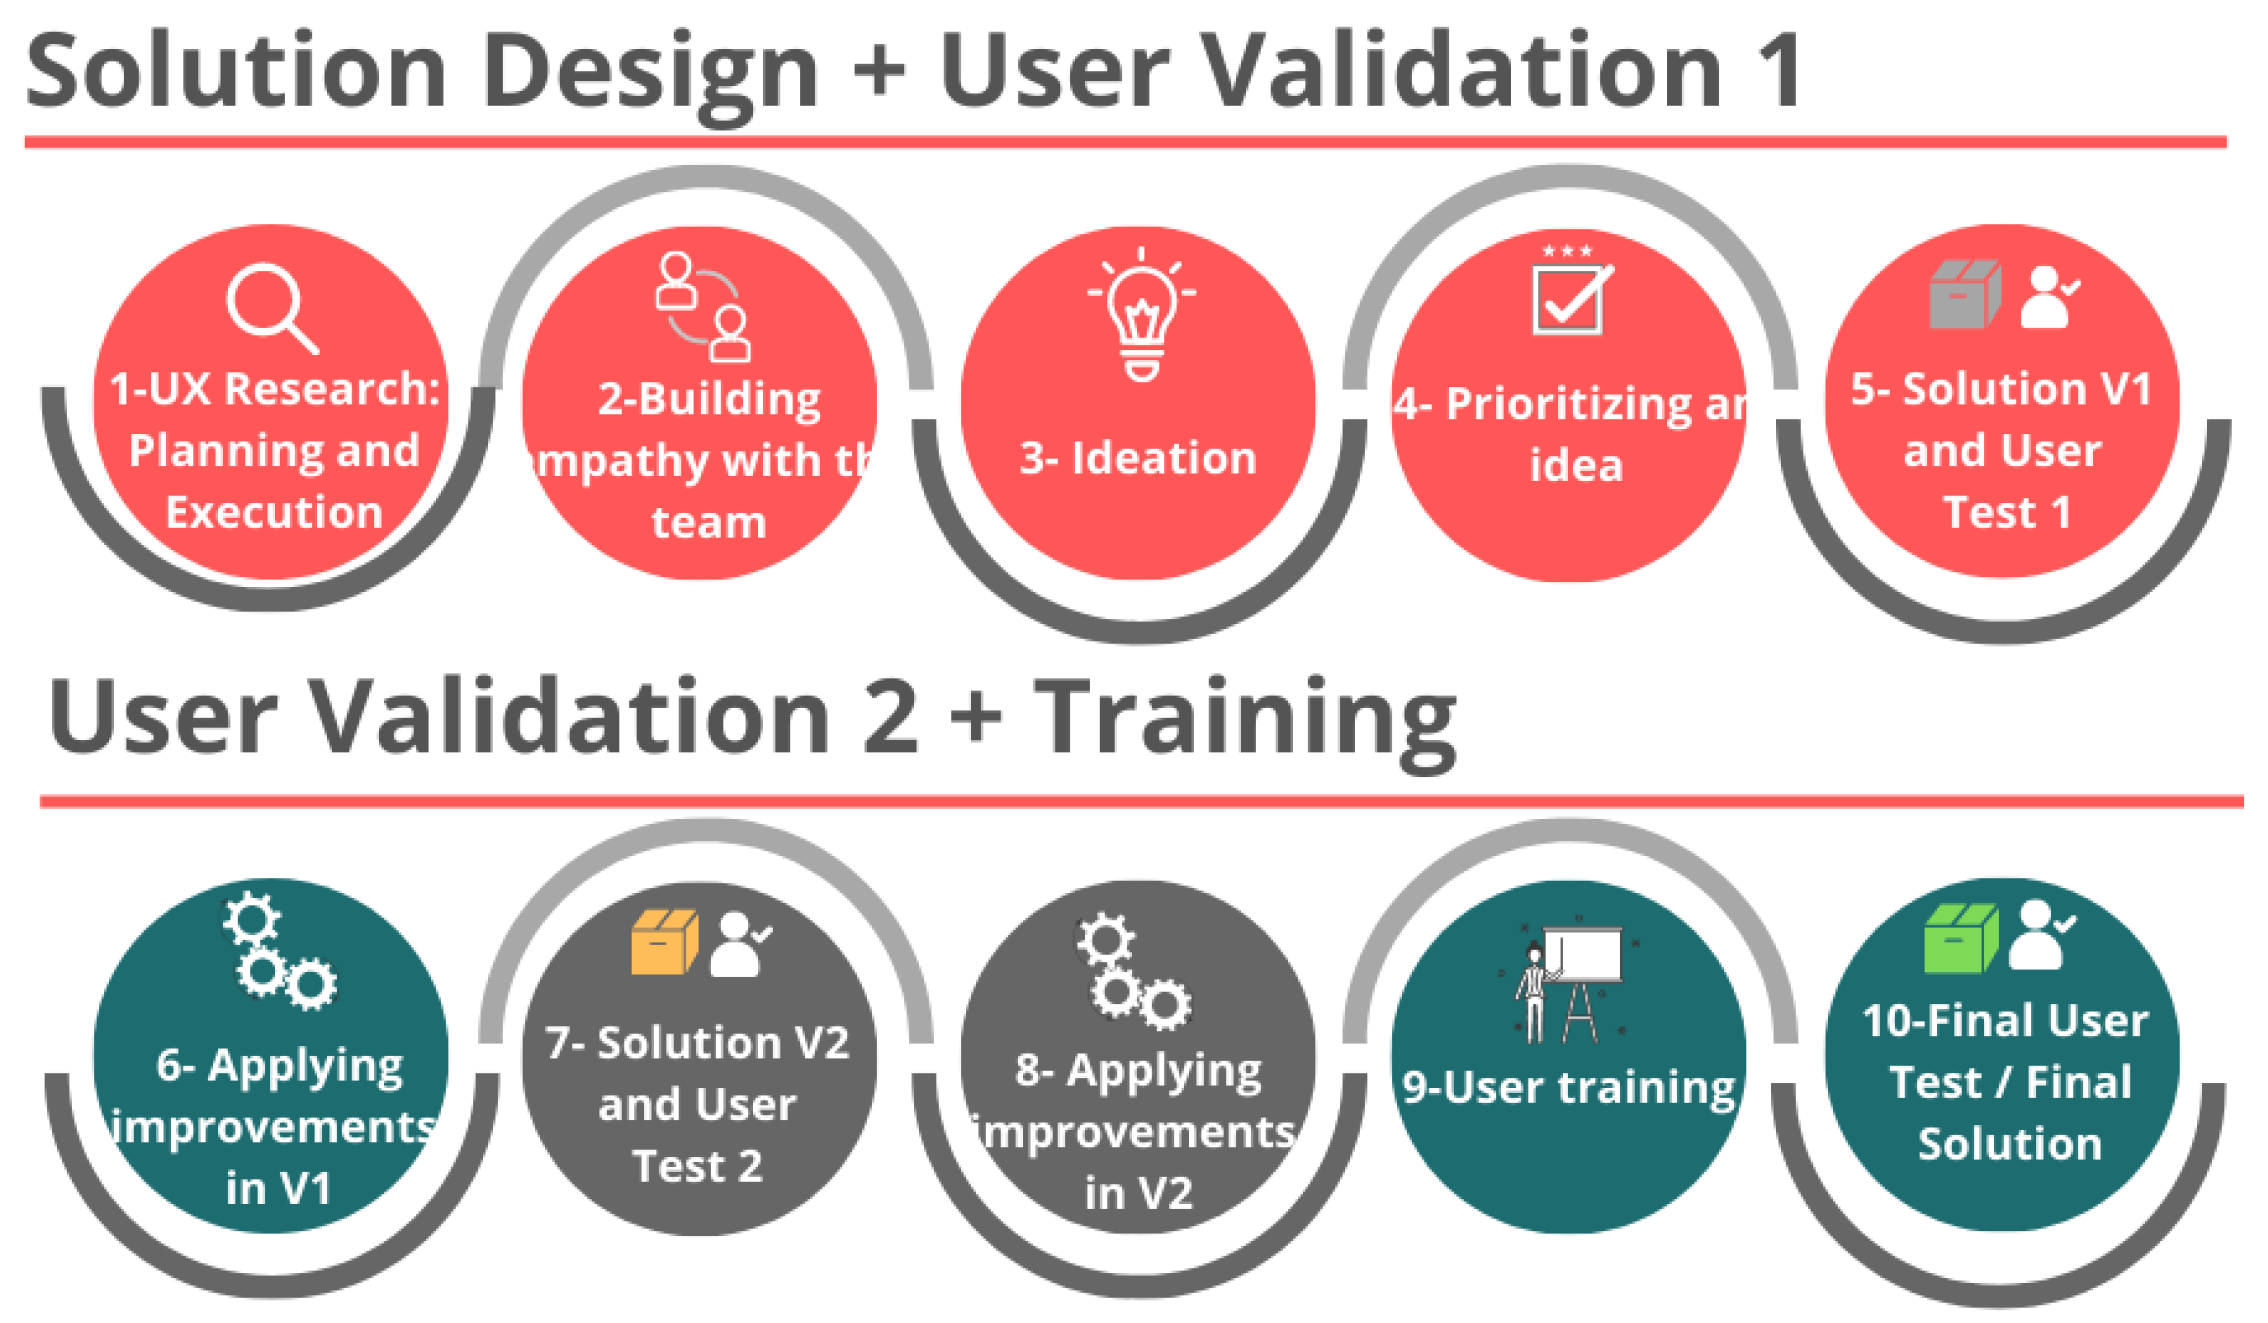
The empathic design process applied in this study followed all the steps of the two cycles (upper and lower) illustrated in
Figure 5.
In general, a solution is idealized based on the UX research (initial moment of understanding the problem (step 1 of
Figure 5)). The research is part of a repetitive flow, which alternates moments of divergence and convergence of thought [
6] to encourage creativity and team collaboration. It is a flow of a flexible nature, guided by the UX expert’s advanced planning. The UX expert starts by understanding the context and empathizing with the problem. It applies techniques (interviews, benchmarking, personas, etc.) with the target audience and reliable research data to collect information about the user, such as needs and pains, and generate hypotheses for solutions focusing on that user’s problem.
Results are represented in artifacts (empathy map, user journey, value proposition map, etc.) for the context of the problem. Then, they were presented to the team, which participated in the co-creation of the solution with innovative ideas and focused on the users’ problem (steps 2 and 3).
After ideation, the team prioritizes a minimally viable solution (a functional prototype capable of demonstrating the value of the solution) (step 4) [
7,
22]. The next moment, and during the development of the solution, the partial delivery of the solution (steps 5 and 7) is verified before validation with the final version of the solution (steps 9 and 10), interspersed with an application of improvements to the solution (steps 6 and 8).
3.4. Validation Experiment Method
In particular, for the validation of research questions and assumptions, the authors of this article relied on the team’s involvement in carrying out and/or observing the test steps performed with users (steps 5, 7, 9, and 10 in
Figure 5). They organized an experiment, which took place in these four test steps. They varied the validation objective (
Section 3.3), the place of accomplishment (due to the inability of the team to travel to the users’ workplace), and the artifact used in data collection. About the place of performance, there were mediated tests, called by this research “Laboratory Tests” and nonmediated tests, called “Field tests”.
3.4.1. Laboratory Tests
The laboratory test was carried out via videoconference, where the electrician, who was located in an office, activated his camera so that the team could visualize their reactions and mirrored the smart glasses screen so that the entire iteration could be monitored. All tests were recorded with the user’s consent for consultation when necessary.
A script was created containing the test tracks that the team needed to verify. The UX specialist and the developer indirectly requested the execution of the trials so as not to induce the user to execute the expected path, as the objective was to evaluate the solution’s intuitiveness. In this way, as the UX specialist and the developer observed the electricians’ interaction, interaction aspects, such as voice and navigation commands, could be validated. Meanwhile, the team took note of the problems identified, and at the end of the test, the user made reports.
3.4.2. Field Test
In field testing, the solution was used in adverse conditions such as rain and low or high light. To carry out these tests, the experiment had the support of the client’s team, where an employee was responsible for acting as an instructor to help participants in case of doubt on how to adjust the smart glasses for use. In this unmediated test, the electricians filled out a problem report, pointing out their suggestions, praise, and difficulties. In addition to the results of the problem report, the telemetry technique in field tests was also applied in order to monitor all user interactions.
The validation of the research questions required different test objectives, which are presented below.
3.4.3. UX Verification Objective
This step aimed to validate the quality of the solution in terms of functionality, user experience, and added value of the solution, in line with the principles of software engineering, which state that the sooner a software adjustment is identified, the lower its cost. For this, a test plan was made containing information such as the target audience, necessary infrastructure, and a roadmap with the necessary checks to validate the solution. The collection of feedback from this moment occurred through the UX analysis and validation of each solution delivery through user tests (items 5 and 7 of
Figure 5).
The following are the reported UX verification items that targeted perceived ease [
10] and perceived usefulness [
10], and the quality of an experience [
23]:
[Useful] The developed solution manages to solve the problem it proposes to solve.
[Usable] Electricians are able to use and understand all the features of the application without any problems.
[Locatable] Electricians can find what they are looking for on the app screens quickly and efficiently.
[Credible] The app is so reliable that I recommend it to my coworkers.
[Accessibility] The solution has accessibility features, for example, alternative adaptations for the visually impaired.
[Desirable] The solution solves a problem that electricians want to solve.
[Valuable] The solution saves time and helps electricians achieve the expected goals.
Given the particularities of the devices in innovative solutions, training was given at the end of the process so that users learn to use the equipment with the developed solution. In addition, user manuals were made available, and configuration and sanitation actions were carried out (because it is shared equipment). Validation actions, including training, were carried out via videoconference.
3.4.4. UX Validation Objective
In this step, the final version of the solution with the adjustments identified in the verification was corrected and made available to the user. A new application of the UX verification and problem reporting items was suggested. However, this time, these artifacts were reduced to only assessing those problems that had the training pointed out as a possible solution. For this reason, these reports must be described after adjustments for the second test, as well as for training (items 9 and 10 in
Figure 5).
4. Case Study Used in Assumption Analysis Measurement of Team Empathy Applied in a Validation Experiment
The case study of this research was a project in the electrical sector using a solution with augmented reality and smart glasses.
In this topic, the artifacts completed by the team about the user tests are presented: (In Form 1 and Form 2, both containing questions adapted from the IRI (Interpersonal Reactivity Index)) [
18]. For the answer options, the Likert scale was used in 5 levels, from 0 to 4 (where: 0—It does not describe me at all; 1—It does not describe me well; 2—It describes me more or less; 3—It describes me well; 4—Describes me very well).
It is noteworthy that before applying the forms, the seven participating professionals, excluding the UX specialist, agreed to a consent form to participate in the experiment. Three activities were performed to measure developer perceptions.
4.1. Activity 1: Application of Form 1
A 25-question questionnaire was applied, individually, to each of the developers, containing 18 questions taken from the following IRI subscales: perspective taking, empathic concern, and personal discomfort. Some items were chosen, and the selection criterion was applied in relation to the items that were most related to the context and objective of the research. The purpose of this block of questions was to identify the participant’s tendency to develop a feeling of empathy based on everyday situations. Individual items were considered as the necessity to measure not only the tendency to feel empathy for each other but also the impact of practices that help stimulate this feeling on the technical work of each team member. This experiment was executed in order to make this analysis possible. Therefore, it was also necessary to create a new subscale that corresponded to the context of the experiment and was more applicable to the team. The assumption is that empathy could arouse in the technical team the feeling of attention to the real problem of the user by developing their solutions. The objective is to find out how disruptive solutions can be useful, interesting, and innovative.
Listed below are the questions from the first part of Form 1:
Perspective take (T):
T1. From time to time I have difficulty seeing things from the perspective of others.
T2. I sometimes try to understand my friends better by imagining their perspective of seeing things.
T3. When I’m upset with someone, I usually try to put myself in their place for a moment.
T4. Before criticizing someone, I try to imagine how I would feel if I were in their shoes.
Empathic concern (P):
P1. I have feelings of tenderness and concern for people less fortunate than myself.
P2. I don’t feel sorry when other people are in trouble.
P3. When I see that someone is being taken advantage of, I feel like protecting them.
P4. I get emotional about the things I see happening.
P5. The misfortunes of others don’t usually trouble me.
P6. I would describe myself as a soft hearted person.
Personal discomfort (D):
D1. In emergency situations, I feel uncomfortable and apprehensive/apprehensive.
D2. When there is disagreement, I try to listen to all points of view before making a decision.
D3. When I see someone getting hurt, I have to remain calm.
D4. Being in a tense emotional situation scares me.
D5. I’m usually very effective when dealing with emergencies.
D6. I tend to lose control in emergency situations.
D7. When I see someone in an emergency needing help, I get completely lost/lost.
D8. I believe that an issue always has two sides and I try to look at both.
The seven questions in the second part of Form 1, prepared by the authors of this article, served to obtain the respondent’s opinion regarding the following:
The attitude of putting yourself in the user’s shoes before and during the solution design, which aims to analyze the construction of empathy of the participant by the target user, during the performance of collaborative activities (they are steps 1 to 5 of the first cycle of
Figure 5), as well as the impact of this, in relation to their technical activities (e.g., if when coding the solution, he thought about its effectiveness from the point of view of UX and added value of the solution). The questions in this subscale (impact of the construction of empathy by the technical team by the user on the quality of the solution) were the following:
I1: I can put myself in the user’s position, feeling their pain and needs.
I2: I can see the context (physical, social and technological) where the user’s problems appear.
Involvement in the realization of a user-centered design, which refers to the participant’s perception of their behavior in the collaborative activities carried out in the two iterations (in
Figure 5, in the first iteration, they are activities 2, 3, and 4, and in the second iteration, they are activities 6 and 8). The questions were the following:
I3: I manage to pursue an optimal solution to the user’s problem.
I4: I feel more motivated to perform technical tasks focused on solving a user’s problem.
I5: I can be more attentive to aligning my tasks with the user’s needs.
I6: I can contribute more with suggestions for improvements to my project’s solution, seeking to help the user to have a better user experience.
I7: I think participating in building empathy has positive impacts on my technical activities.
4.2. Activity 2: Analysis of UX with the “DELIVERED” Solution by the Development Team
A video containing a recording of a user test was shown individually to each participant. The video was recorded remotely through a videoconference, where the user, in addition to having a camera filming his interaction with the device, shared the screen of the smart glasses. The objective was to see if the developers were empathetic with the user’s reaction when using the solution. This video was chosen because it clearly displayed users using the solution and reporting their opinions about usage, and being possible to observe where the user presented their difficulties with the solution. For example, the video showed that the app faced a lot of resistance at first due to the new interaction paradigm. Five electricians had difficulty looking at a tiny screen for a long time. They reported problems such as blurred vision, headaches, and fatigue. This was compounded by the fact that many electricians had vision problems and wore corrective lenses. Another complaint was about the need to memorize commands (this was later resolved with the addition of a glossary of commands). Due to ergonomic issues, features that required the camera, such as augmented reality and object detection, were initially not well received. Navigation was confusing for users as more steps were taken than necessary to reach a goal (the team later simplified navigation by removing branch paths).
4.3. Activity 3: Application of Form 2
Form 2 was applied individually to each participant, containing 5 questions originating from the IRI fantasy subscale and 3 new questions. The IRI questions have been adapted to relate to the user test video rather than referring to movie and theater fantasies (as they were originally described). The 5 IRI questions were used to obtain the respondent’s opinion, based on the videos presented, as to their attitude of putting themselves in the user’s shoes after the solution was used by the user in order to confirm their initial perception of the construction of the participant’s empathy for the target user. However, now the focus is on the UX with the developed solution. The questions around fantasy (F) were the following:
F1. I easily let myself get involved in the feelings of the user who appeared in the video?
F2. I remained objective when watching the video and didn’t get completely involved?
F3. It’s rare to get completely involved/involved when viewing a situation such as the video that was presented?
F4. After watching the video, I feel like I’m in the electrician user’s shoes?
The new questions were included in order to assess the developer’s perception of the UX after watching the user interact with the solution. Thus, it was possible to evaluate and compare the team’s perception of the impact of empathy on the solution during and after development:
The expectation of building an optimal solution which refers to the professionals’ perceptions of the expected optimal solution. Questions F5 to F8 serve to assess the professionals’ perceptions of the optimal solution. The questions were the following:
F5. Watching the video, I imagine how I would feel if those events had happened to me?
F6. Did my expectation regarding the context of use of the solution correspond to reality?
F7. Did my expectation of having developed an optimal solution, which solves the user’s problem, correspond to reality?
F8. Did my expectation regarding the constitution of an easy-to-use solution for the target audience correspond to reality?
5. Analysis of the Results
Based on the results of Forms 1 and 2 of the empathy measurement experiment, calculating the median and mode of their responses,
Table 1,
Table 2,
Table 3,
Table 4 and
Table 5 were generated for each subscale. They present the consolidated responses of all seven professionals. These consolidated data are presented in percentages, in the respective columns of the tables, which contain the questions for each subscale, and in the rows of the tables, which contain the following options for answering the questions:
0—Does not describe me at all;
1—It doesn’t describe me well;
2—Describe me more or less;
3—Describe me well;
4—Describe me very well.
The analyzes are described below.
In
Table 1, participants “describe themselves well” as empathetic, considering the median and mode calculations for the data obtained in responses T1 to T4. This information is directly linked to the following variable: the attitude of putting oneself in the other’s shoes on the part of the participants; it was also confirmed by the answers given in Form 2. In Form 2, the answer of median and mode was also “3-Describe me well”. In general, it is concluded that most empathized with the user when watching the video.
Now, to validate assumption 2, the practitioner involvement is analyzed.
S2: The professional’s attitude of putting himself in the user’s place in the development of the solution (I1 and I2) affects his involvement in user-centered design (I3 to I7).
Questions I1 and I2 are related to the programmer’s condition of putting himself in the user’s place after having learned about the user’s pain through the activities of building empathy. Questions I3 to I7 refer to the fact that developers bring this knowledge to their daily technical activities. Overall, a positive result was obtained on these questions, with the assumption that empathy was built and impacted technical tasks.
Next, to validate assumption 3 of this research, the expectation of building an optimal solution is analyzed and presented as follows.
S3: The professional’s involvement in user-centered design (questions from part 1 of Form 1) affects their expectation of building an optimal solution; This allows you to verify the importance he gives to UX techniques (F1 to F8 of Form 2). If he gets too involved in applying UX techniques, he is expected to have a matched expectation.
The questions in part 1 of Form 1 would be T1 to T4 and I1 to I2, as they refer to the practice of empathy. They are supposed to affect fantasy questions (F1 to F5) when it is evaluated whether the developer has put himself in the place of the user featured in the video. The questions F6 to F8, on the other hand, induce the programmer to compare his expectation of the optimal solution created during development with the reality exposed in the video after delivering the solution to the user. It was noticed that there was a tendency of the participants of the experiment to put themselves in the place of the user, as well as, in general, the fulfillment of the expectation regarding the final result of the UX.
As for assumption 1—S1: The personal characteristics of developing a professional’s feeling of empathy affect their attitude of putting themselves in the user’s shoes. An answer can be gauged from the correlation [
24] of some questions on Form 1 with Form 2, and it was also possible to obtain more relevant information. Consider the correlations below:
Correlation: {F1_form2} {T2_form1, T4_form1}
{F1_form2,T2_form1} = 0.50952
{F1_form2,T4_form1} = 0.61111
This result indicates consistency in the response of the participants who reported having a tendency to be empathetic in step 1 (T1 and T2 of Form 1). While in step 2, they were also able to put themselves in the place of the user shown in the video (F1 of Form 2). The tendency to develop the feeling of empathy, together with techniques that seek to encourage this practice, may have contributed to the programmers putting themselves in the user’s shoes when developing the solution and watching the video.
In analyzing the results, different perspectives were considered according to the IRI model and NPS (net promoter score) support.
It is noteworthy that it was possible to obtain the maximum score in terms of customer satisfaction through the NPS (net promoter score) [
25]. Furthermore, in the validation experiment mentioned in this research, the user’s assessment of the solution’s user experience and added value was satisfactory.
6. Conclusions
Generally speaking, the solution contributed to the solution of the user’s problem, and empathy was developed. The result obtained is satisfactory since the identified solution is innovative, aligned with trends and market differentials, as well as the main aspect, which is its value for the user. Another gain is collaboration, allowing everyone on the team to participate in the creation of the idea. In addition to making the process rich, with the participation of different experiences and knowledge of those involved, it is good for the team because knowing how to design is one of the skills of the professionals of the future, be it any profession.
This research was empirical, qualitative, and applied. A replicable process that promotes the implementation of UX improvements for innovative and disruptive solutions was developed.
In general, the main results were the following:
- -
Time and cost saving with the execution of remote tests;
- -
Contribution to the IRI, with the inclusion of another subscale;
- -
The model is replicable and provides a positive impact on the quality of the solution.
- -
Measuring the effectiveness of building empathy in technical teams.
From the tests, it was found that the solution offered a good user experience for them, solving latent users’ difficulties. Corrective actions to adapt the solution and improvements to the design process were also raised, such as the need for training the users in the solution.
In the tests, there was a demonstration of how the activities were carried out in the remote context due to the project having been carried out during the COVID pandemic period.
However, just as this scenario seemed to be a limitation when finalizing it, it could be concluded that the adaptations to remote work led to time savings and reduced project costs with team hours.
Finally, one of the most valuable points of this research was the contribution to the IRI, with the inclusion of another subscale, to be applied in systems development processes, with a focus on empathic and user-centered design.
As a general conclusion of the test, it was understood that the involvement of the technical team in activities to build empathy for the user and contextualize feedback from them during the development of an innovative solution has a positive impact on the quality of the solution.
It can be inferred that the perception of built empathy is affected by the professional’s attitude of putting himself in the user’s place during and after the development of the solution. The developers felt motivated to build a solution that adds value and has a good UX for users, seeking this in their daily technical activities, participating in user tests, and giving suggestions for improvements (decentralizing this activity from the specialist). Even participants with a lower tendency to be empathetic were able to work on empathy to seek good results.
About the limitations of this research, we highlight that the user tests were applied without any prior initial instruction on how to use the device. Considering that the device and the solution were new to the target audience, the difficulty of interaction may have had some influence on this aspect. Therefore, the result cannot be considered decisive at this time.
Another limitation was the need to guarantee full coverage of the functionality tests, as well as to evaluate how the solution behaved in adverse conditions but natural to its contexts, such as rain and little or too much light. For this, tests were carried out in two different scenarios: laboratory with a controlled environment and in the field. In this way, in the laboratory tests, it was possible to guarantee the coverage of the planned test script. While in the field tests, it was possible to observe the behavior of the solution in its real environment of use.
Regarding the sample size used in the experiment, it can also be considered a limitation of the research, leaving the execution of the experiment with a broader sample as future work. As the next steps, it is intended to elaborate a knowledge base to contribute to future similar projects. It is also expected to evaluate the investment required to apply the process, as well as the risks of its application, and to describe a better detailing of the desired return and lessons learned.


