1. Introduction
The performing arts, such as music, theater, and Opera, are found throughout Europe, as part of the culture. Each theater reveals in how it was erected, the creative ideas of the architects and how it contributed to the progress of the local society. Furthermore, the typical horseshoe shape of the floor plan became typical and widespread not only in Italy but also in other European countries, although other shapes, such as the elliptical and a shoebox shape were also popular geometries adopted by architects.
Several research studies focus on the development and contribution that the theater made over centuries as a place of cultural diffusion in the lower and middle classes of society [
1,
2]. Other research studies take these cultural heritage buildings as an opportunity to conduct acoustic simulations and potential improvements that can be supported with the adaptations due to compliance with the standard regulations in the field of health and safety [
3]. During the COVID-19 pandemic, numerous research studies were conducted on audience attendance as the pandemic could cause a change in the habits of building users [
4]. On this basis, various investigations on live virtual reality performances have been undertaken [
5,
6] to make theatrical performances available at a domestic price since the use of only a pair of headphones in combination with a head-mounted display (HMD) is required.
The Ponchielli theater of Cremona has evolved over 250 years and is the result of a continuous process of reconstruction, maintenance and renovation. The theater was acquired by the Cremona Municipality in 1986 and has undergone a complete renovation, adaptation and technical modernization since 1989 [
7].
Since 2003, the management of the Ponchielli theater has been entrusted to the Cremona City Council. This Italian theater is considered one of the most beautiful theaters in northern Italy and continues to contribute to the cultural life of the local population.
Acoustic measurements were carried out according to ISO 3382-1 [
8] to record the impulse responses (IRs) at different locations. The calibration process, which involves the comparison between measured and simulated values, is a procedure used to increase the accuracy of the predictions [
9].
2. History of the Ponchielli Theater of Cremona
The Ponchielli theater of Cremona was originally a wooden theater built in the 18th Century that burned down in a fire. In 1747, a group of nobles decided to give the city a public theater to replace the previous one. A Cremonese architect, G.B. Zaist, was commissioned to design the theater. In 1785 the theater was named Nazari, in honor of the Marquis who had commissioned its construction. In 1806, the theater was again destroyed by fire [
7]. The reconstruction of the theater was entrusted to the students of the architects Piermarini and L. Canonica. In 1808 the theater was completed and was named Concordia.
At the beginning of the 19th Century, the composer A. Ponchielli came to the theater. He immediately improved the architecture and enlarged the stage. In 1824, the building was partially destroyed in another fire and was renovated to its present appearance by the architects F. Rodi and L. Voghera. At the beginning of the 20th Century, the theater was named in memory of the great composer A. Ponchielli [
7].
In 1986 the Ponchielli theater became the property of the Municipality. Since 1989, the theater has been thoroughly renovated and technically remodeled.
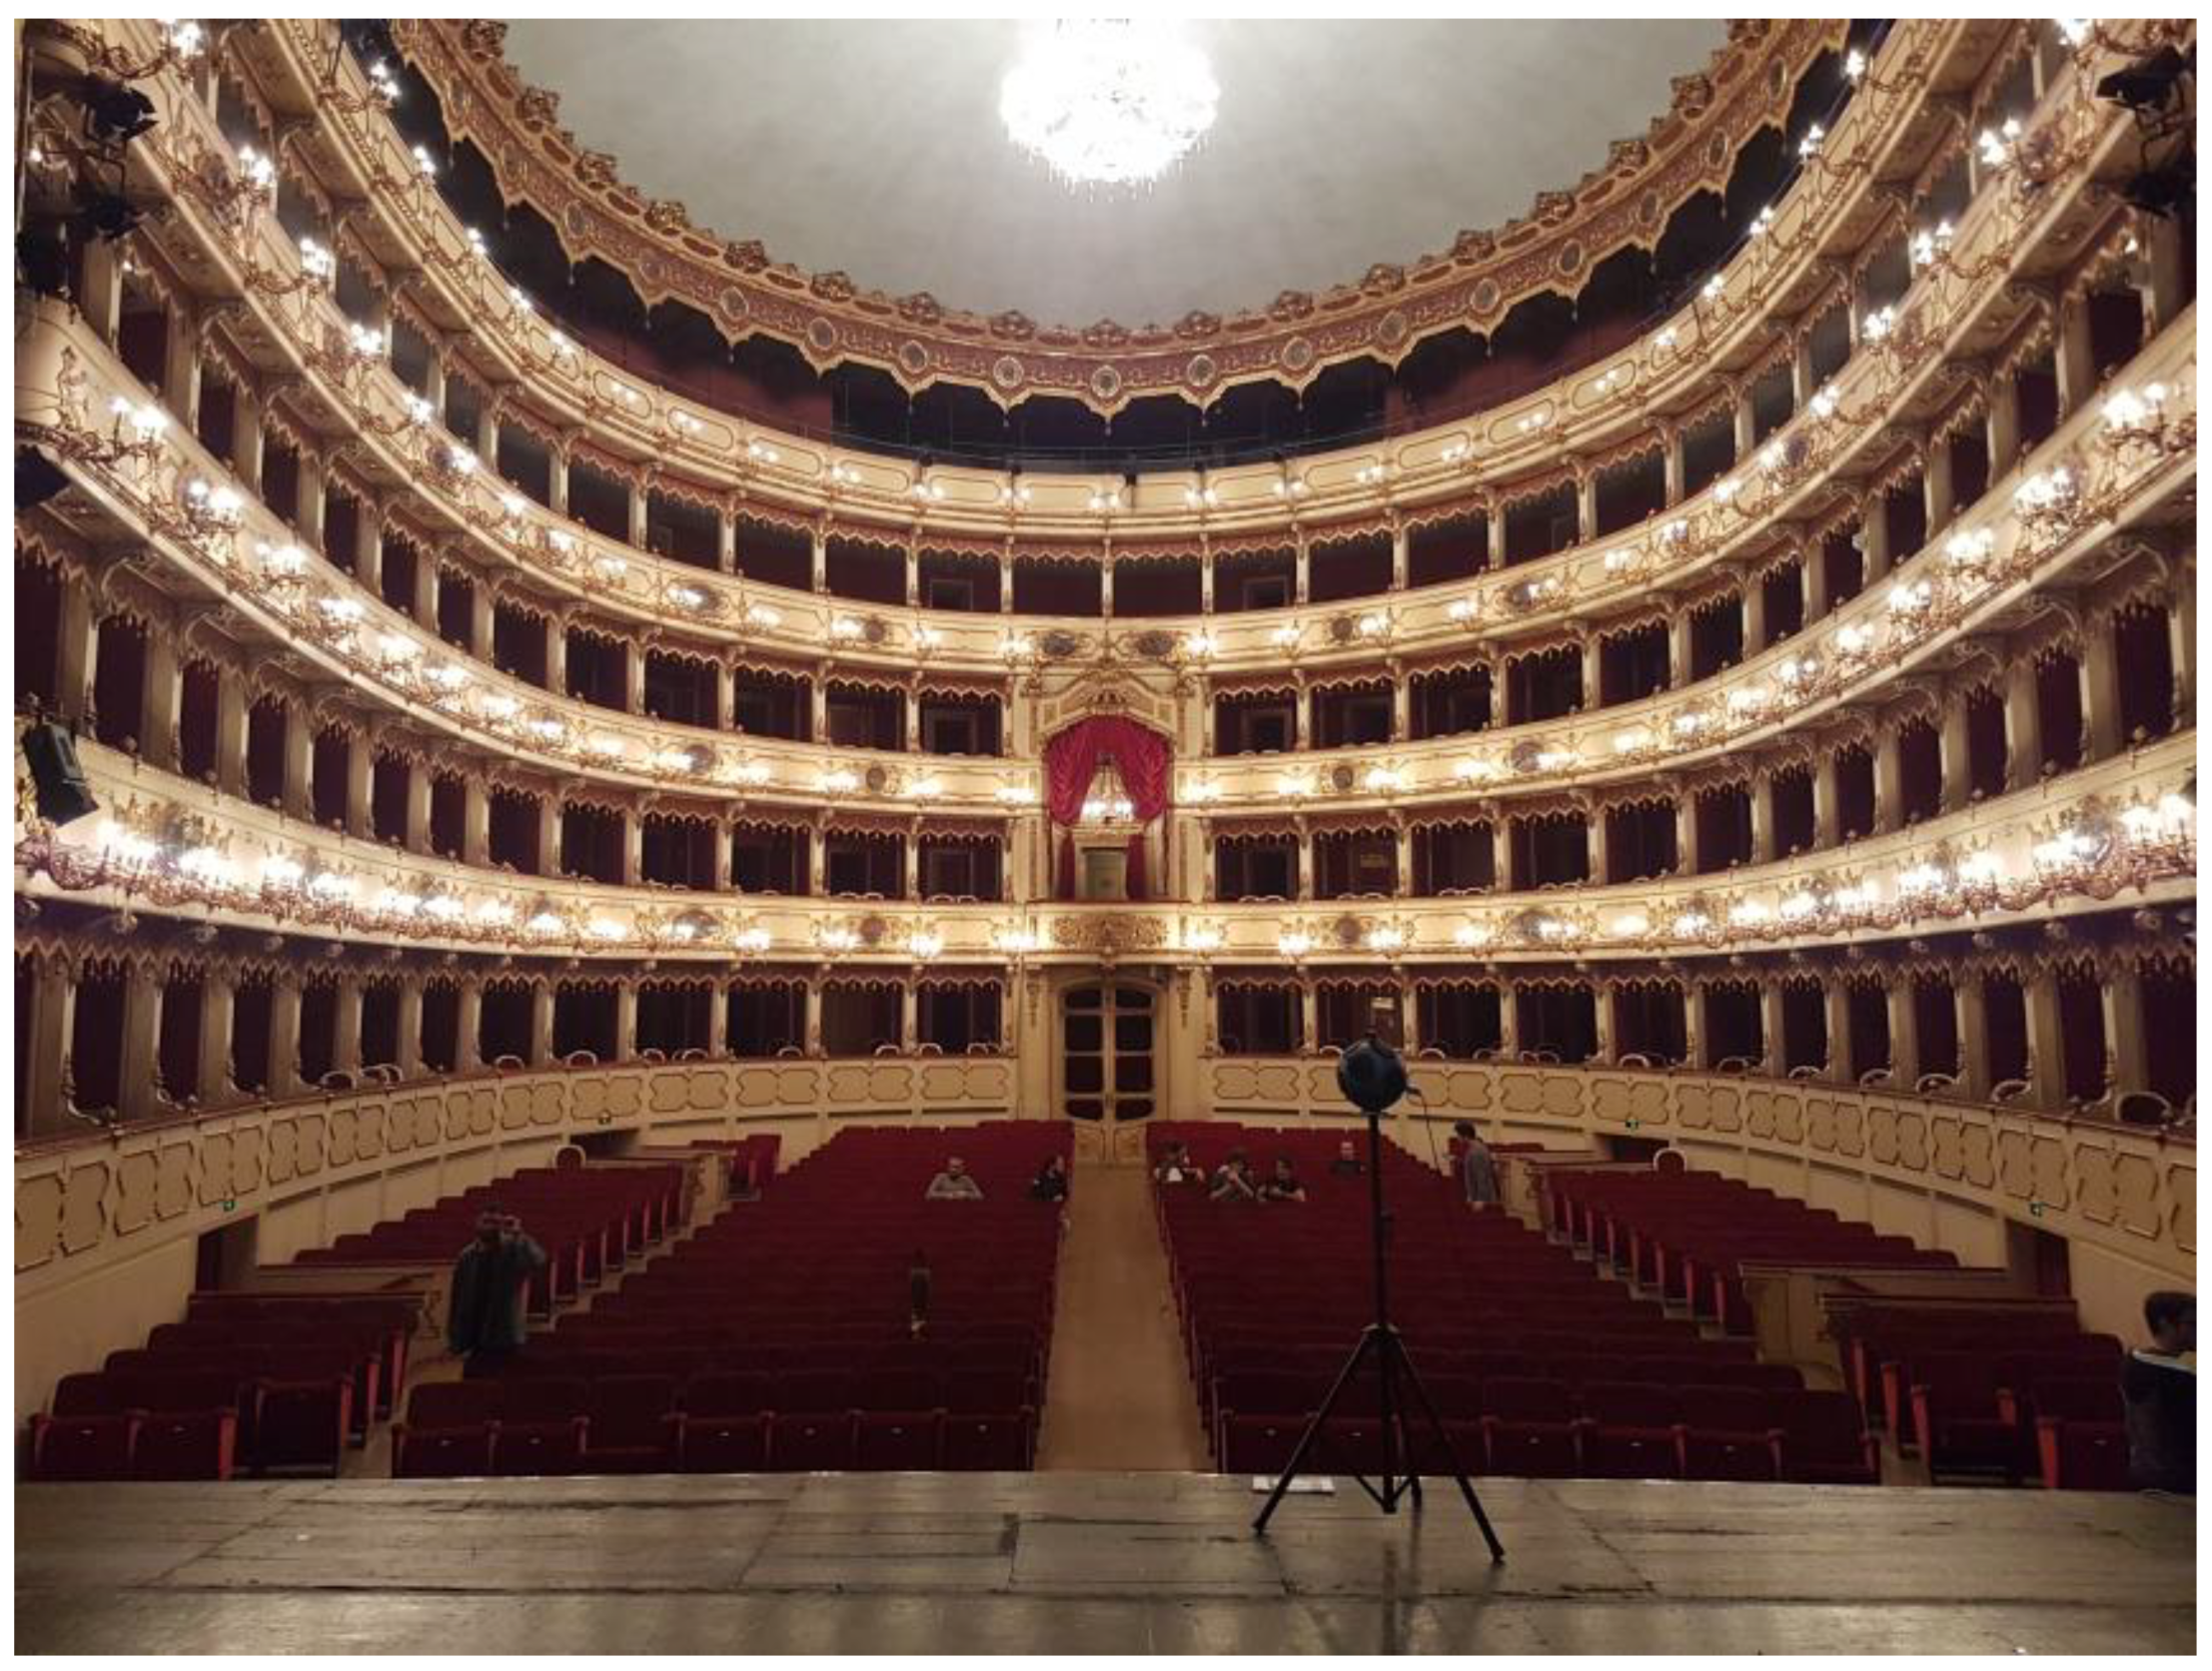
The theater preserves the wooden beam structure from 1800 and is regularly maintained. Its horseshoe-shaped hall, with four orders of balconies crowned by a top gallery, has the typical characteristics of a 19th Century Italian Opera house.
Figure 1 shows the interior of the theater.
3. Architectural Features
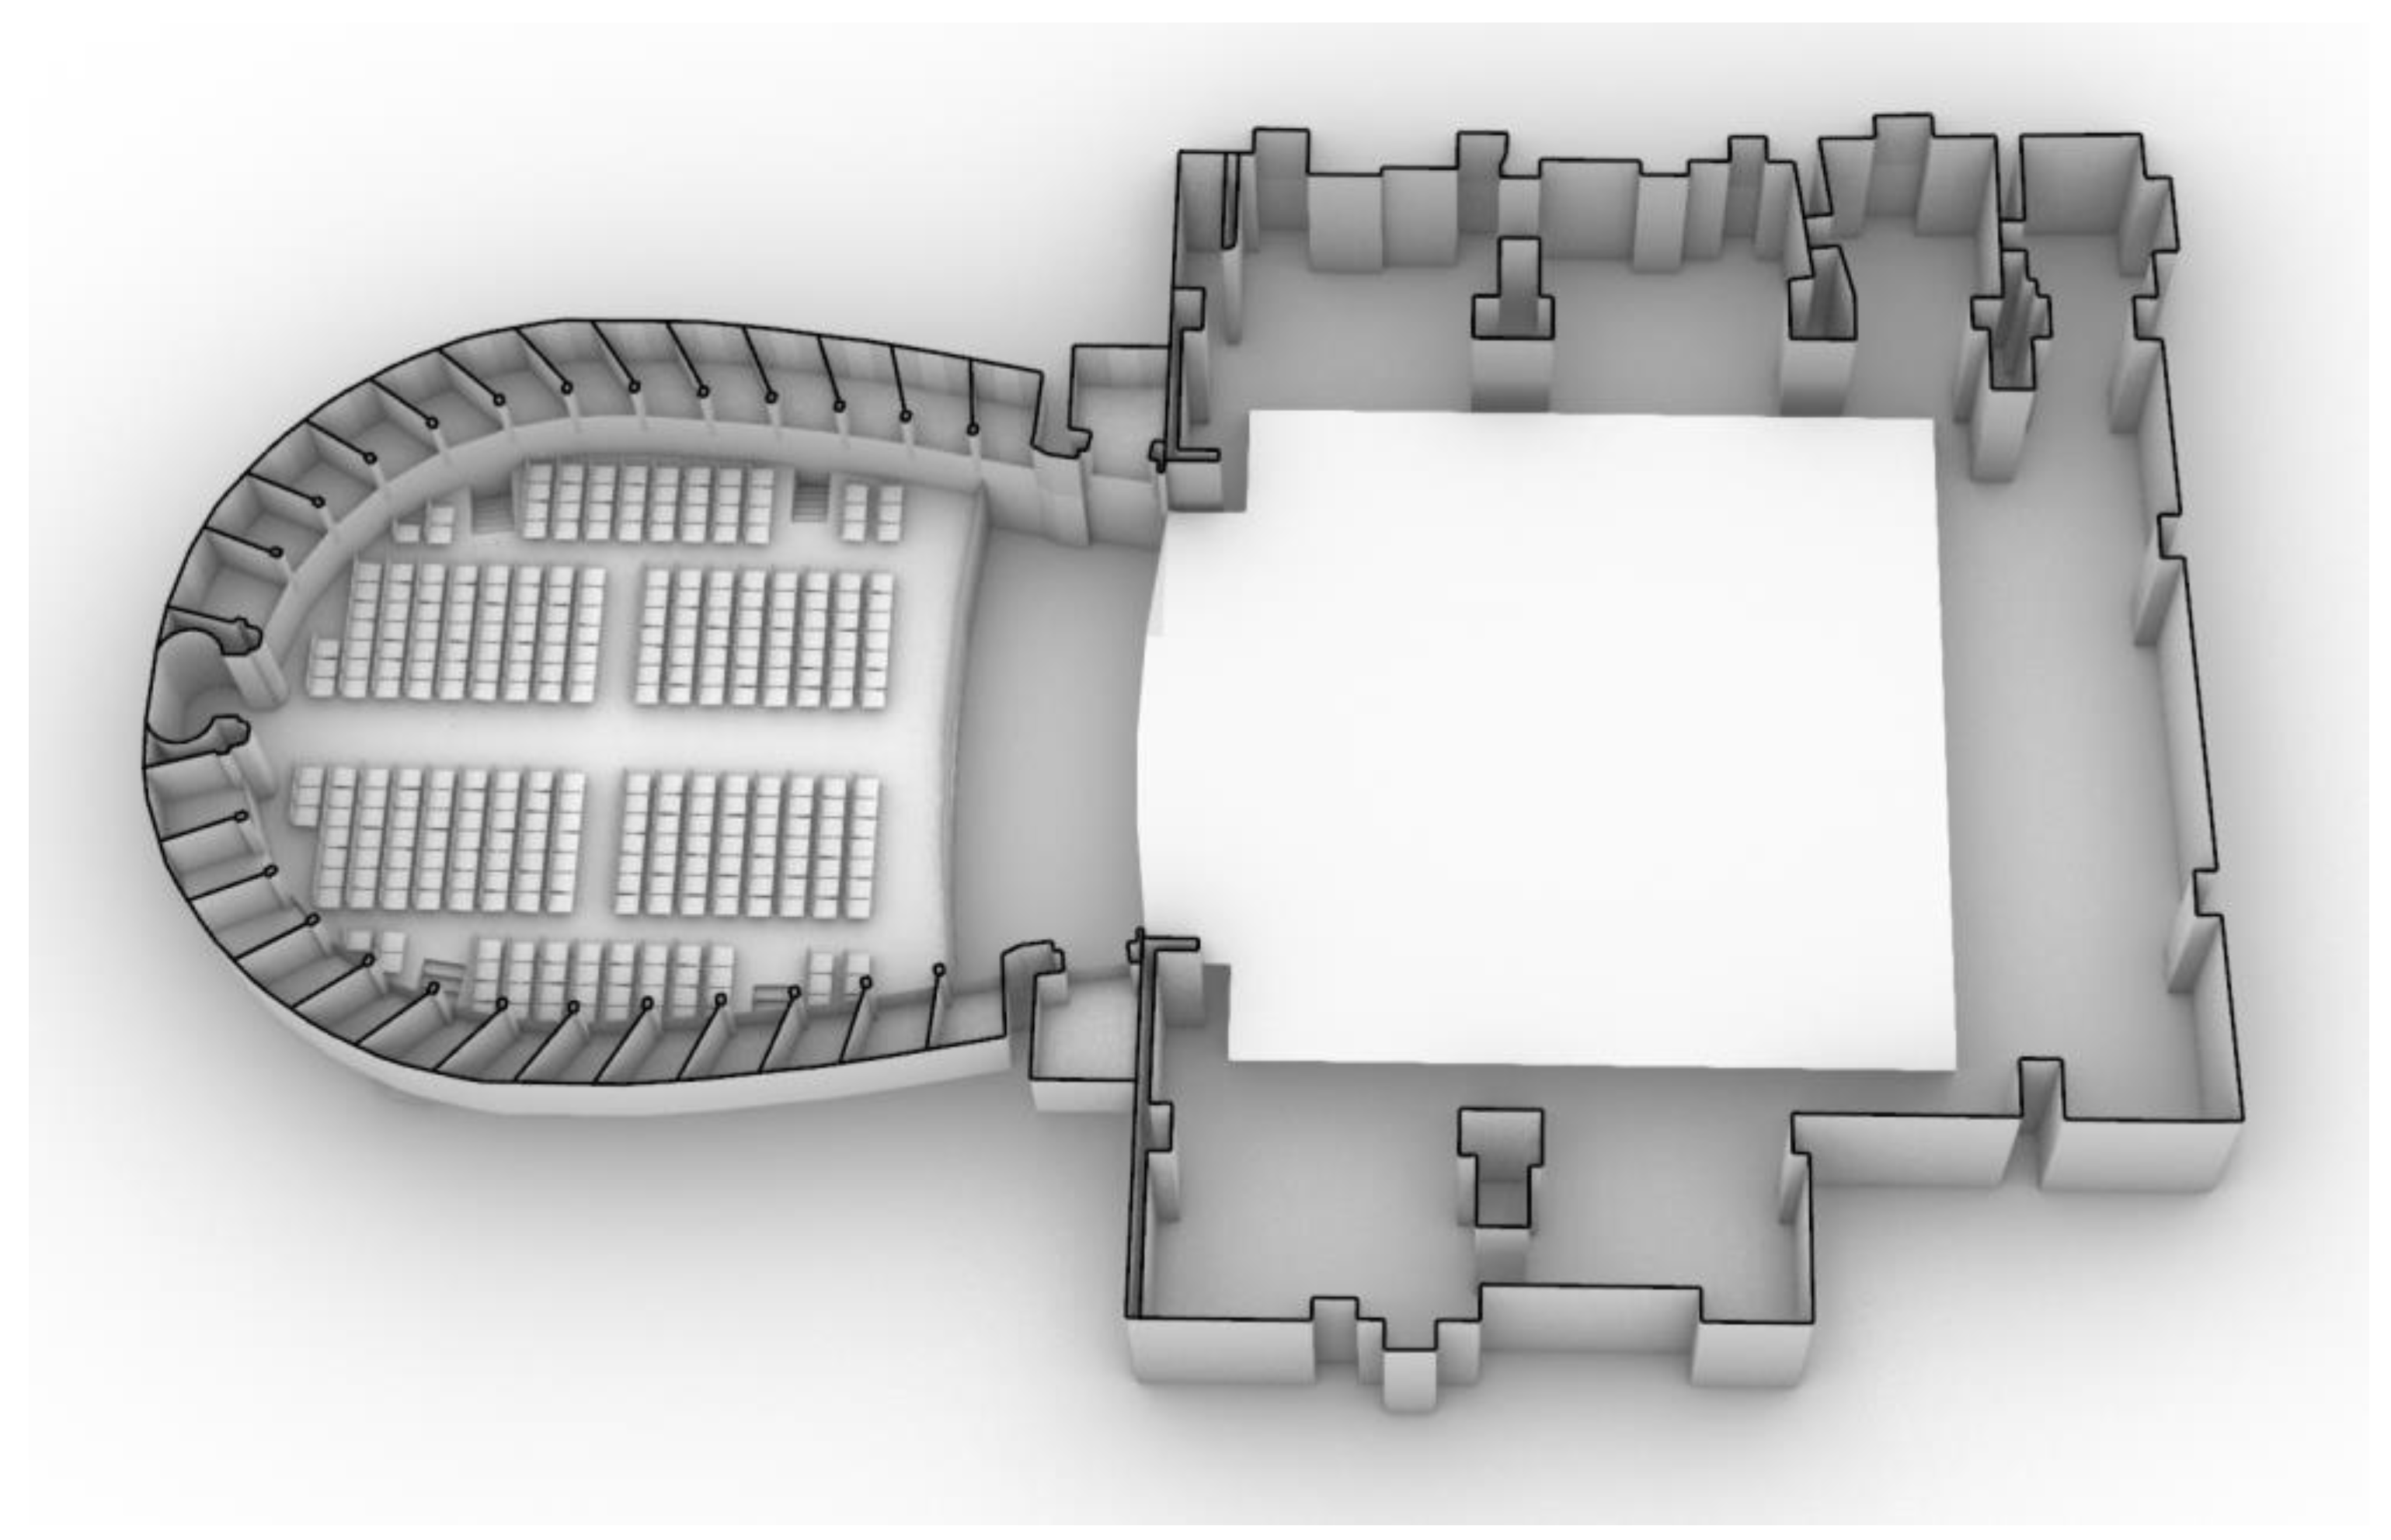
The Ponchielli theater of Cremona is characterized by a horseshoe-shaped plan, as shown in
Figure 2, crowned by four orders of balconies and a top gallery, with a total capacity of up to 800 seats—400 in the stalls, 200 in the
loggione, 105 in the top gallery, and 92 spread in the 46 boxes over three levels of balconies.
The Ponchielli theater was one of the first in Italy equipped with electric lighting. The main hall is decorated in atmospheric and subtle gold tones. The curtains were created by Antonio Rizzi in 1891 and painted with oil on fabric. Their remarkable size of 7 × 11 m serves to illustrate the legend of music history. The curtains are used on various evenings during the music season. Another view of the main hall is shown in
Figure 3, while
Table 1 summarizes the architectural characteristics of the theater.
With the data summarized in
Table 1, it is possible to compare the number of seats inside the Ponchielli theater with the optimal range. According to the literature [
10], a value of at least 10 m
3/seat is often recommended, although for Opera theaters the reference value is 7–9 m
3/seat and for drama theaters, it is 4 m
3/seat. Based on the volume of the main hall (3600 m
3) and the total capacity (800), the ratio related to the Ponchielli theater is equal to 4.5 m
3/seat. This result is midway between the two targets, considering that the Opera theaters of the 18th–19th Century were the representative places suitable for both drama and musical performance (including symphonic and Opera).
4. Materials and Methods
Acoustic measurements were carried out in the Ponchielli theater across the stalls and in some boxes. The aim was to measure the impulse response of the theater at various locations to cover the audience area. The measured data have been processed and compared in order to understand the acoustic response of the main hall, which will be compared to other Italian Opera theaters in the following sections. A digital model has been created to simulate different scenarios. Before any calculation, a calibration process was necessary to tune the absorption and scattering coefficients assigned to the numerical model with the measured results [
11].
4.1. Measurements Positions
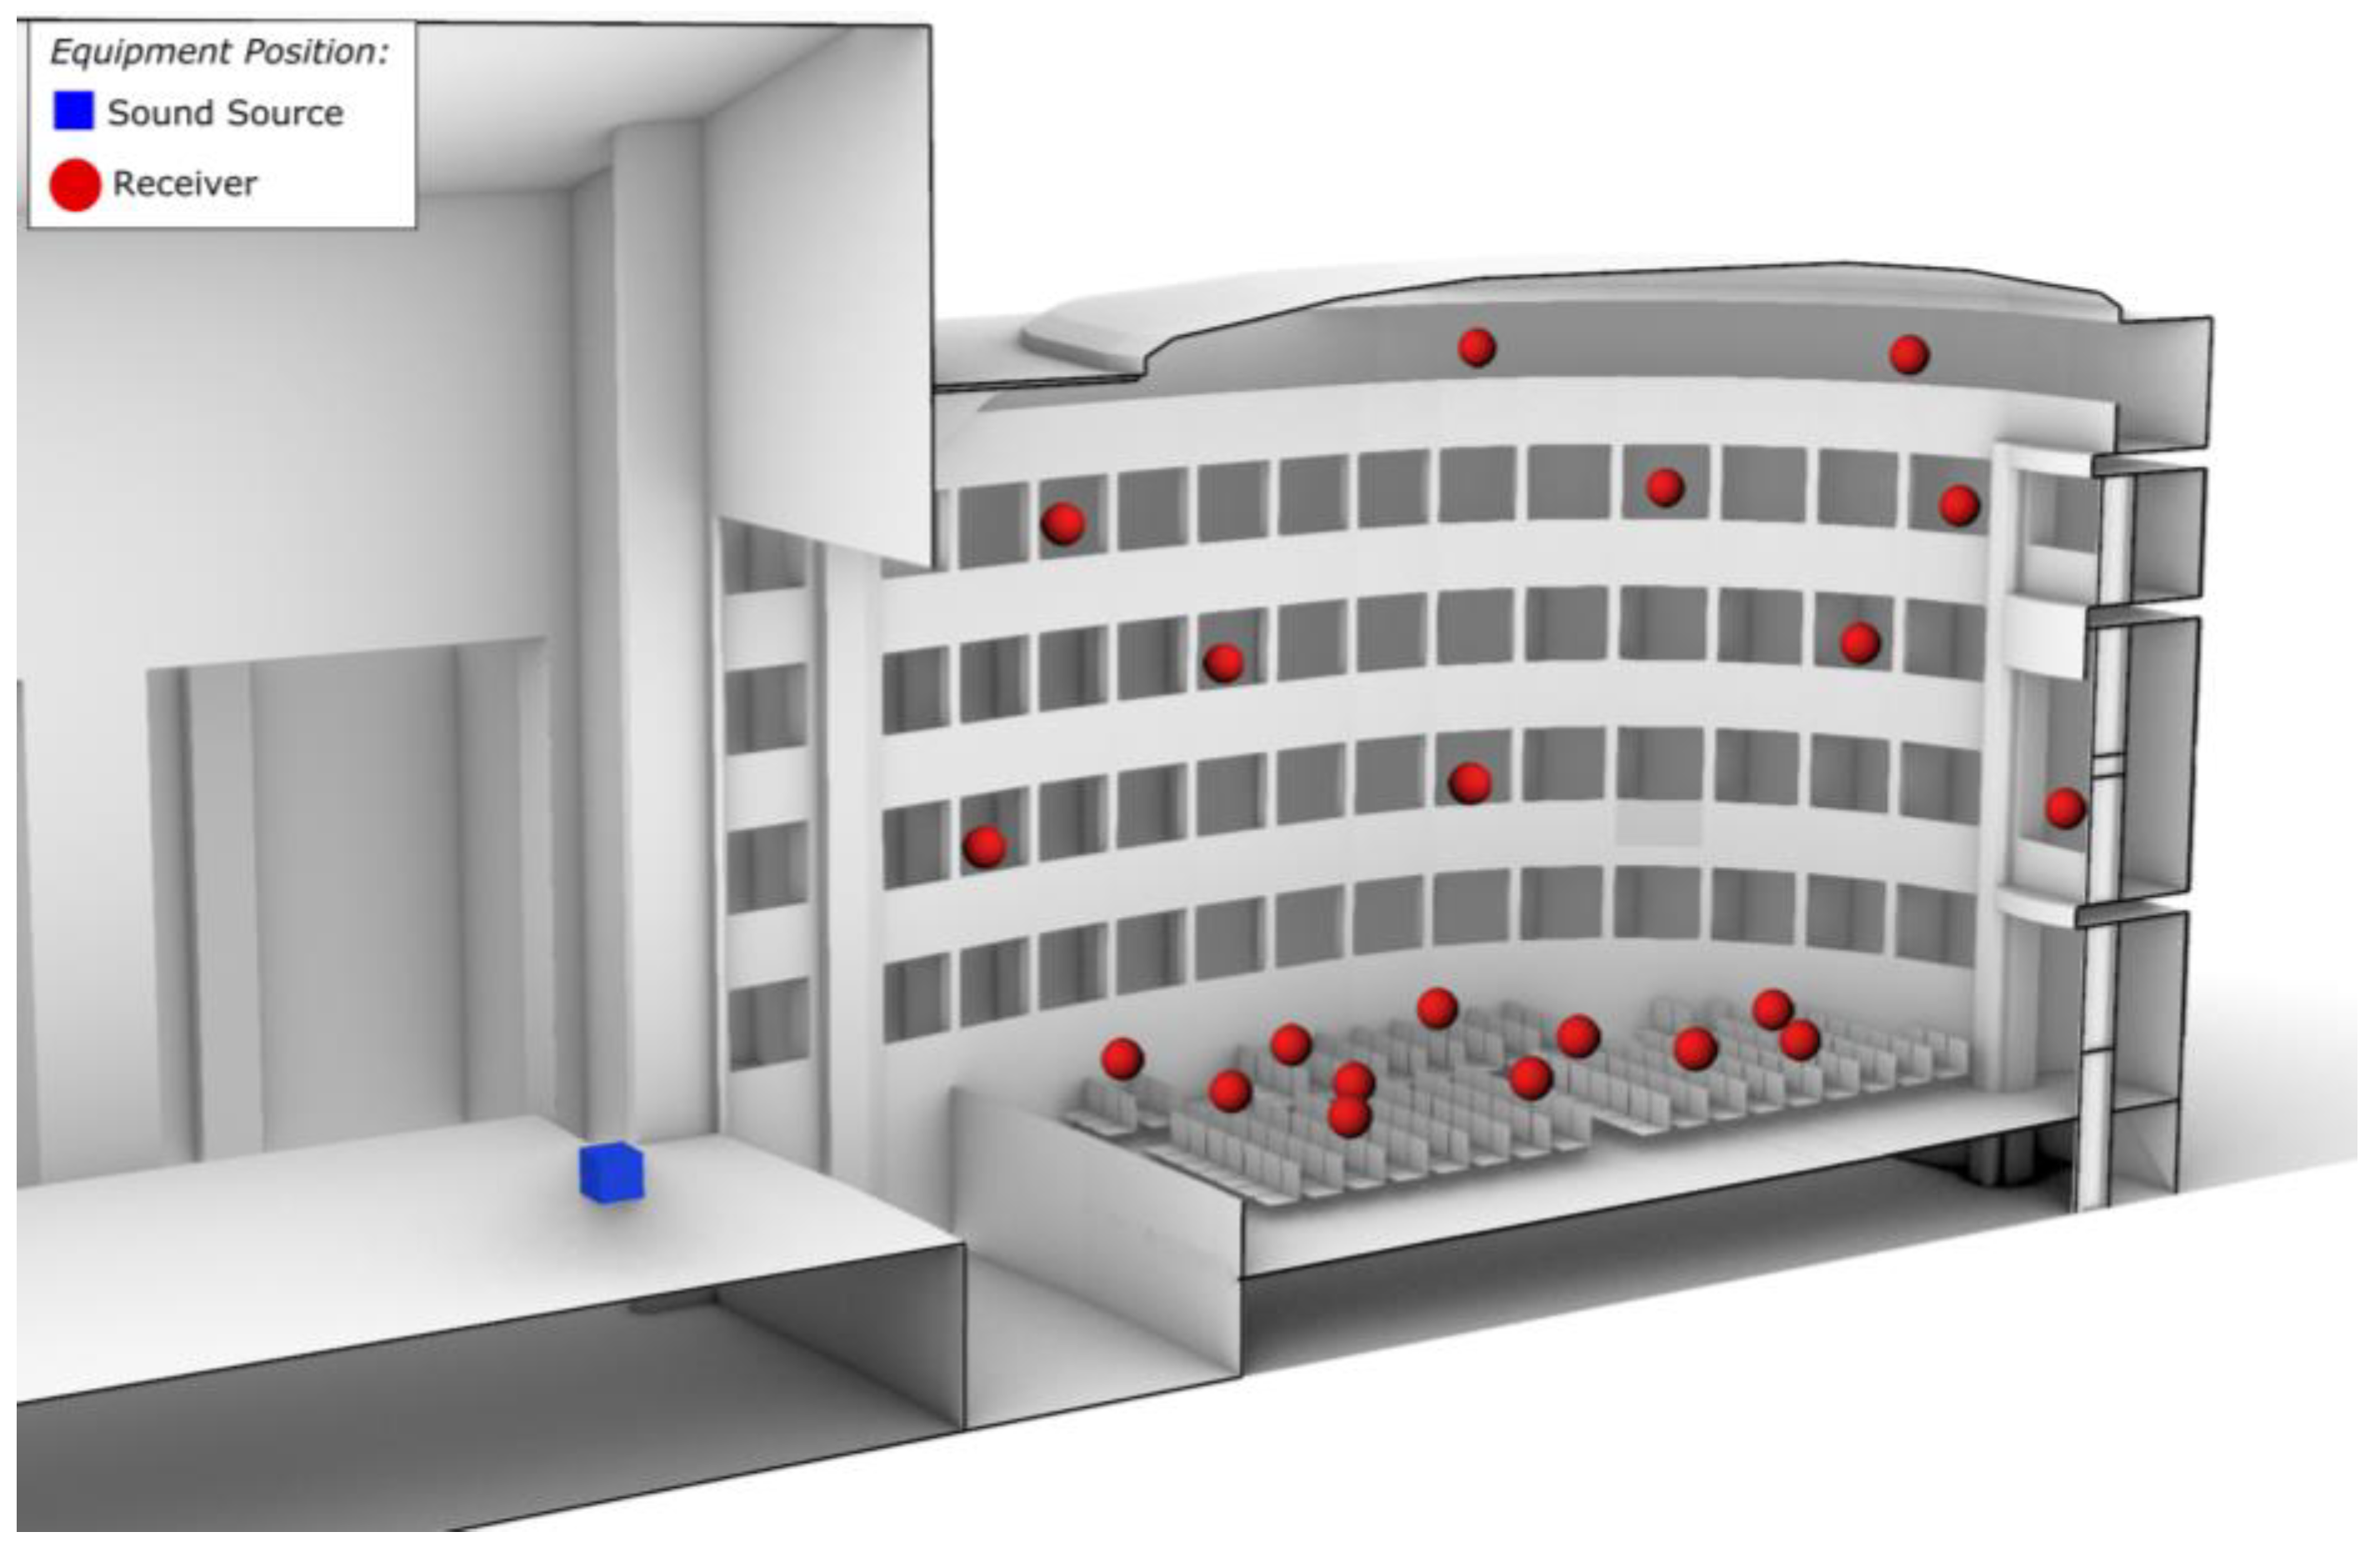
The sound source was placed on stage at a height of 1.4 m above the finished floor, while the receivers were moved across the stalls and in some selected boxes. Specifically, 11 measurements were conducted in the stalls and 10 in the balcony boxes. Due to the axial symmetry of the room, the measurement points were selected in only half of the volume. The measurements were undertaken in unoccupied conditions and with the stage empty of any scenery [
12].
Figure 4 shows the positions of the instrumentations during the survey.
4.2. Measurements Techniques and Equipment
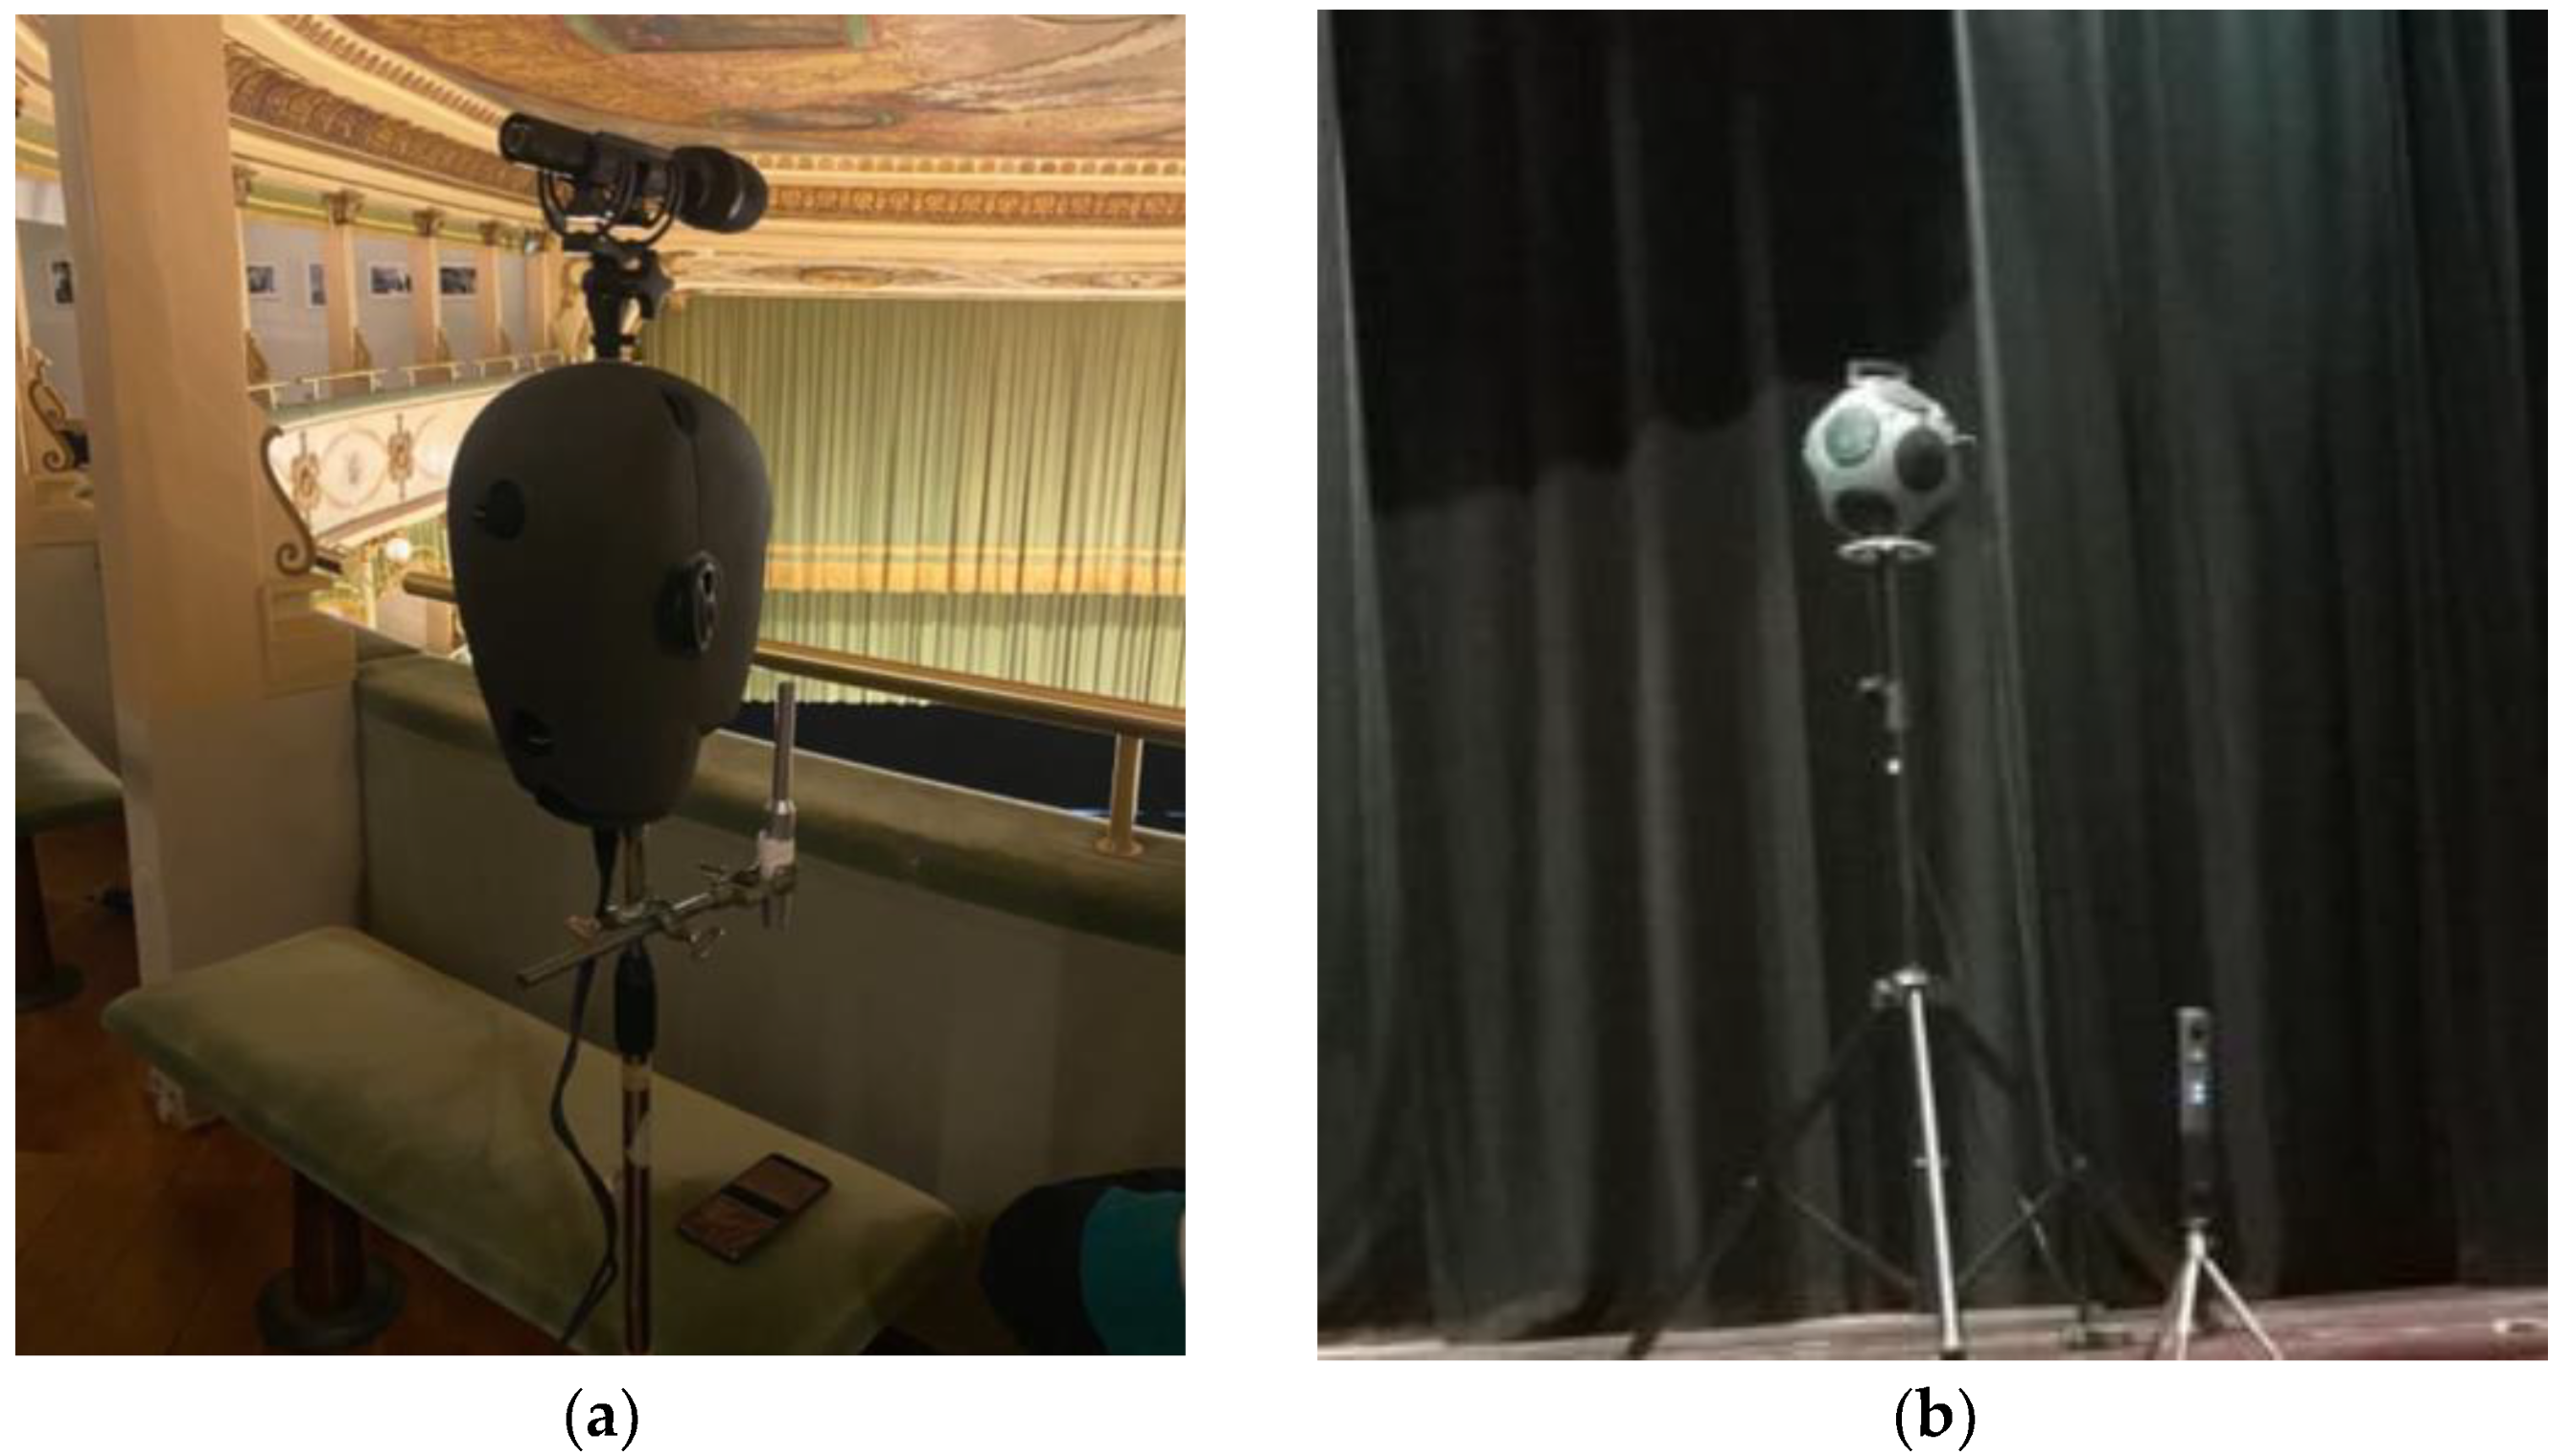
The equipment used during the survey consisted of a dummy head, a 4-channel microphone, an omnidirectional microphone, and a dodecahedral loudspeaker fed with an Exponential Sine Sweep (ESS) signal [
13], ranging from 20 Hz to 20 kHz. A Zoom F8 audio interface controlled by an Apple iPad Mini was used to record the signals from each microphone. Three ESS signals were recorded successively for each measurement point. The thermo-hygrometric conditions were taken into account during the survey [
14].
Figure 5 shows the equipment used during the site survey.
The different types of receivers used for this study are the omnidirectional microphone (Behringer, Willich, Germany, CM8000), a dummy head (Neumann, Berlin, Germany, KU100), a 4-channel microphone (Sennheiser, Wedemark, Germany, Ambeo) capable of creating Ambisonics B-format parameters after post-processing. Another element of the equipment was the Zoom F8 audio interface that has been used to record the signals captured by the microphones. In summary, seven audio channels were used in the recording: channels 1 through 4 were connected to the Ambeo microphone, channels 5 and 6 were utilized to record the dummy heads, and channel 7 was used to record the omnidirectional microphone.
4.3. Acoustic Parameters Calculation
The main acoustic parameters involved in this investigation are the following:
Early Decay Time (EDT), which is computed by considering the direct sound for the decay occurring between 0 dB and −10 dB after the interruption of the sound source [
15].
Reverberation time (T
20), which is the time it takes the sound pressure level to drop over 20 dB after the sound source has been switched off. This parameter is a function of the room volume and the quantity of absorption in the room [
16].
Clarity index, which is calculated by an early-to-late energy ratio based on a time subdivision of the impulse response. The referent clarity index for music is C
80, while C
50 is involved to evaluate speech performance [
17].
Definition (D
50) is used in rooms to assess the quality of speech perception. It is represented as the ratio of sound energy reaching the receiver in the first 50 milliseconds over the total sound energy until it is completely dissipated in the room [
18].
Speech Transmission Index (STI) is used to evaluate the distortion of the speech signal that can be affected by an excess of reverberation, high level of background noise and undesirable echoes. It is represented by a pure number ranging between 0 and 1, indicating very poor and optimal speech comprehension, respectively.
During data post-processing, IRs were obtained by convolving the recorded signals with the inverse filter of the ESS signal used during the measurements [
19]. Once the IRs have been obtained, the values of the main acoustic parameters can be calculated using the Aurora plugin in Audition 3.0 software [
20]. Aurora is a plugin suite created to perform the analysis of acoustic parameters other than for auralization. Two Aurora plug-ins were used: one for the convolution (i.e., “Convolve with clipboard v4.4b”) and the other for the acoustic parameters (i.e., “Acoustical Parameters 4.3”).
4.4. Measured Results
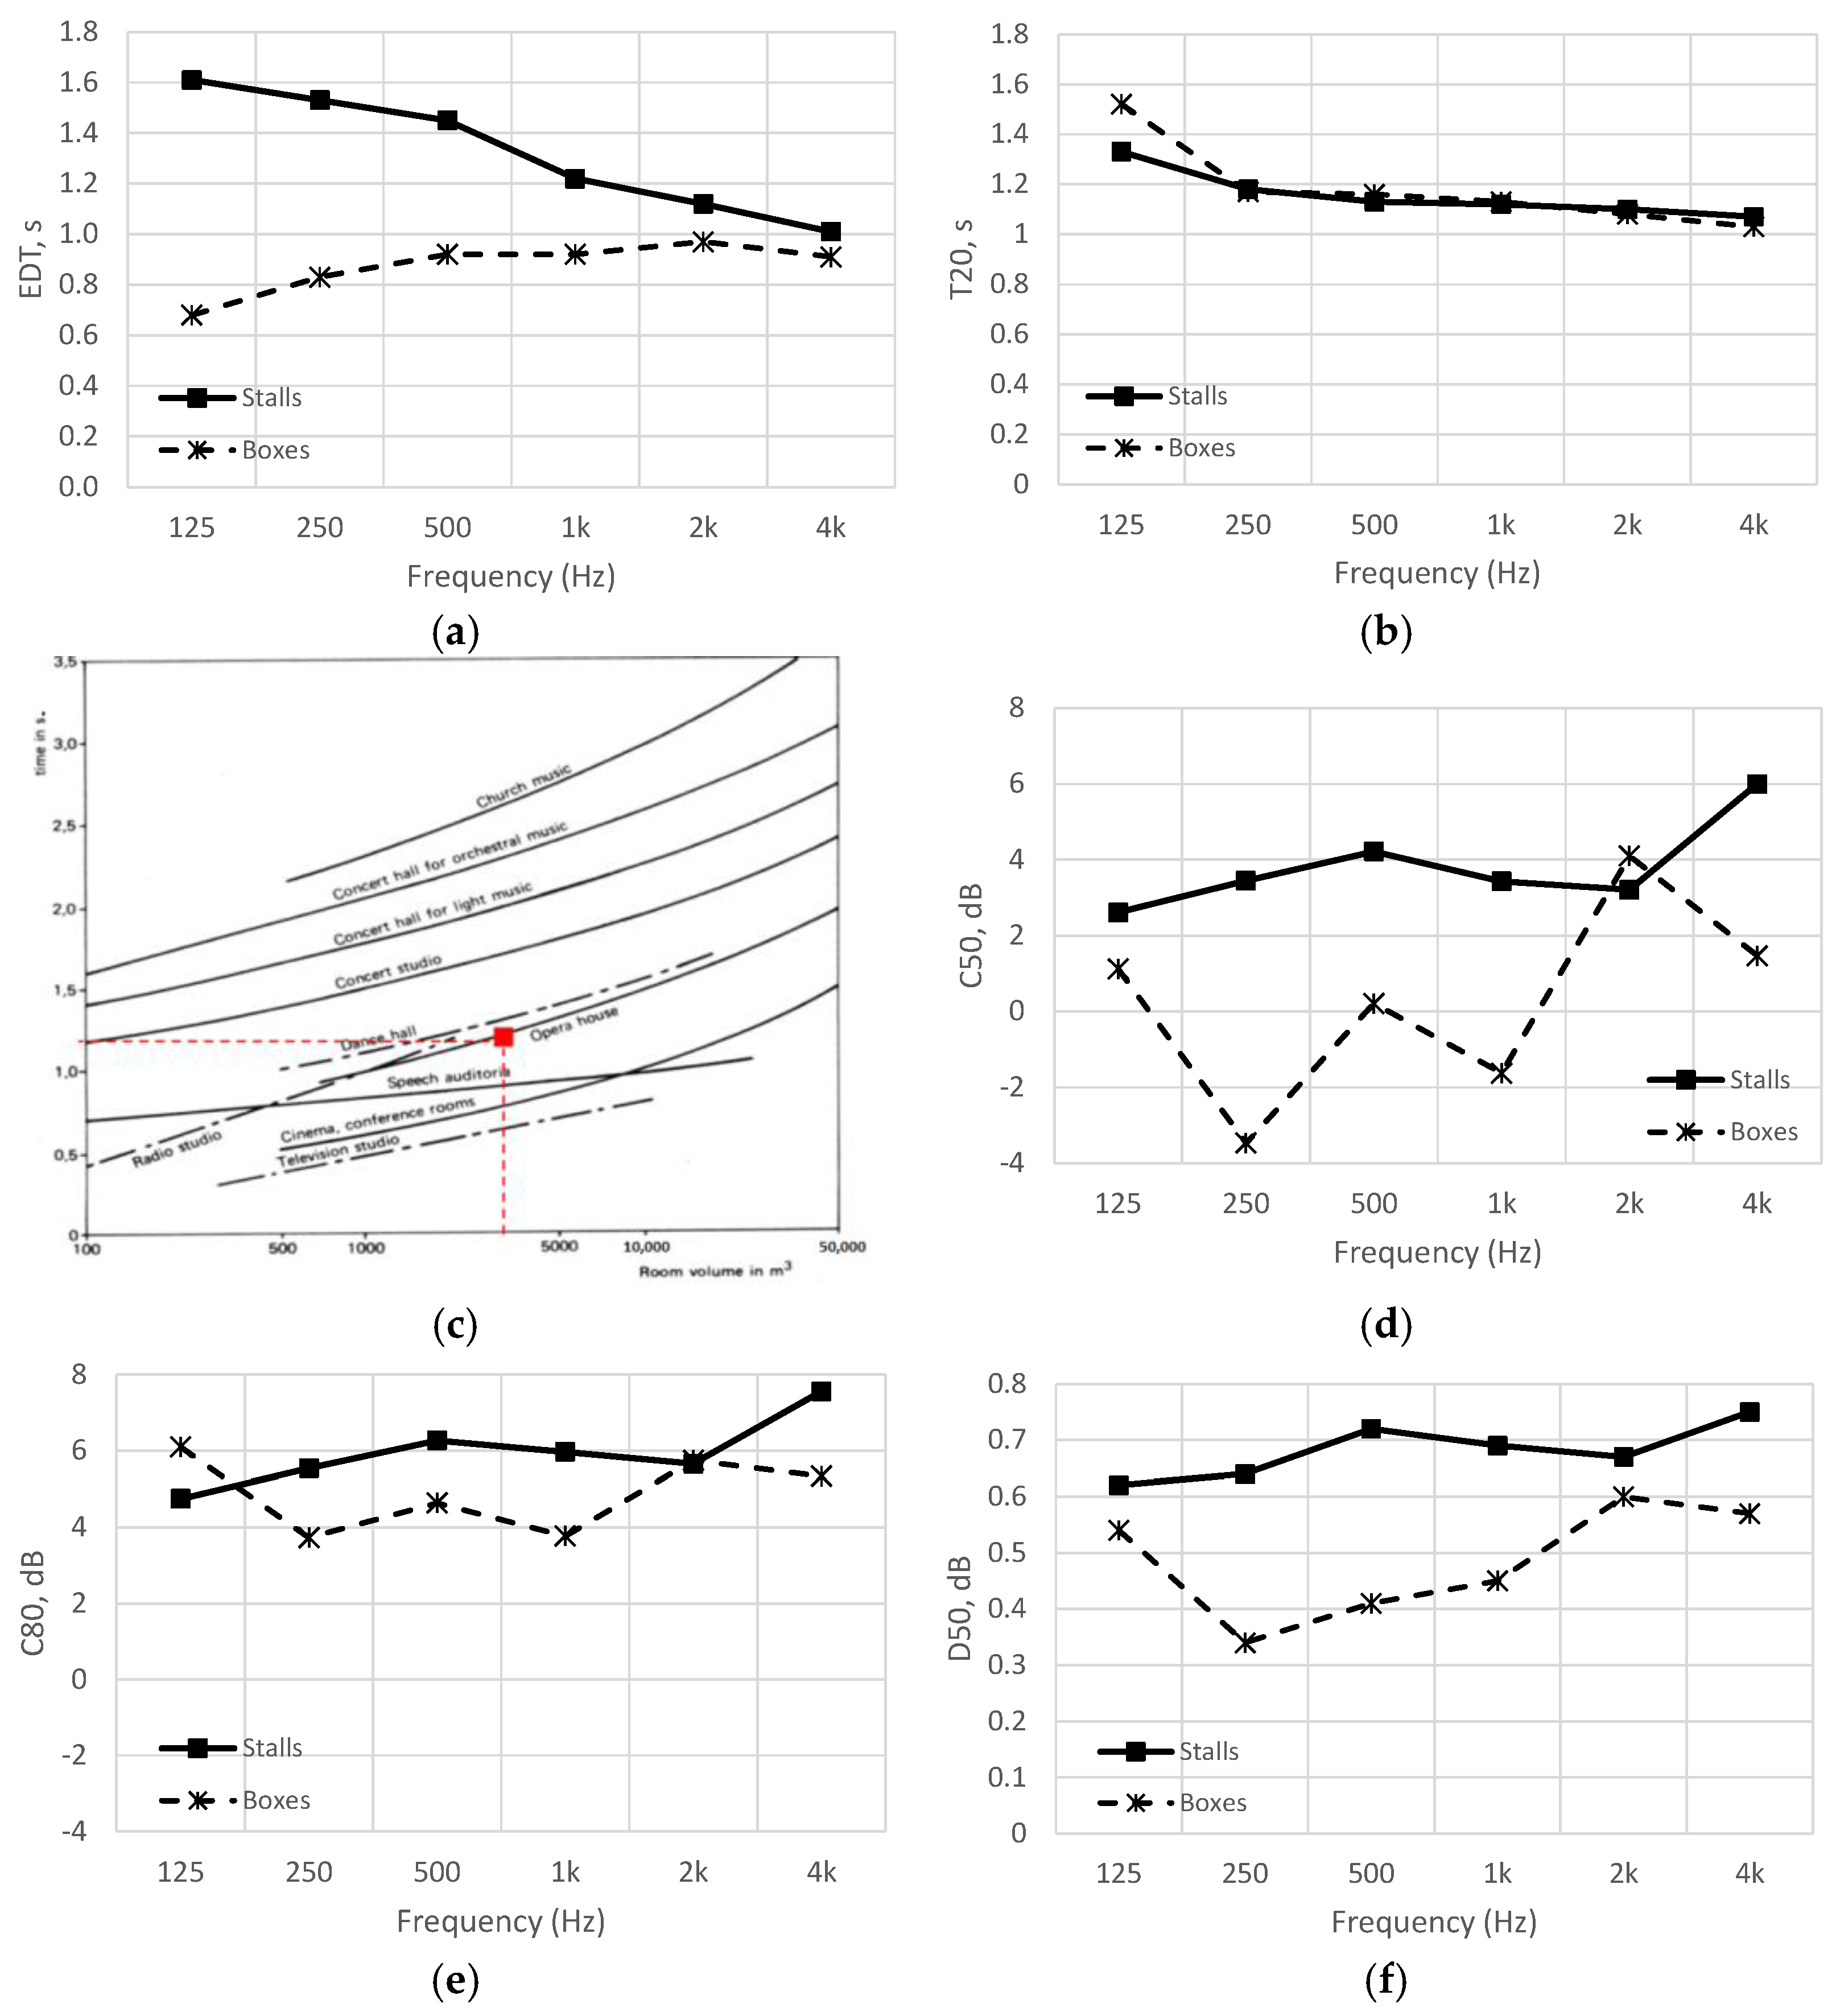
A summary of the measured results related to the main acoustic parameters is shown in
Figure 6, compared between values measured in the stalls and the elevated balconies.
In terms of EDT, the values of the stalls are found to be up to 1 s higher than those measured in the boxes. This difference is considerably reduced at high frequencies, where both trendlines tend toward 1.0 s. Considering that the optimal values of EDT in Opera theaters should range between 1 s, related to speech intelligibility, and 2.6 s for music,
Figure 6a shows that the EDT values fall within the optimal range in the stalls, while the values in the boxes are slightly below the lower range limit.
The measured values of reverberation time show a negligible difference between the results obtained in the boxes and stalls, with the exception of 125 Hz where a difference of 0.2 s has been found. Since the reverberation time is related to the volume size of a room, the optimal value at mid-frequencies for the Ponchielli theater, equal to 1.2 s, is within the optimal range considered for Opera theaters, as indicated in
Figure 6c.
Considering that the optimal values of the clarity index should be comprised between −2 dB and +2 dB, according to Jordan [
21],
Figure 6d shows that the values of C
50 are found approximately within the optimal range in the boxes, with an upward peak at 2 kHz and a downward peak at 250 Hz. The trend related to the stalls is more uniform, around 4 dB and, overall, up to 4 dB above the upper range limit.
In terms of music, the values of the clarity index for both stalls and boxes are very similar, fluctuating between 4 dB and 8 dB. These results have also been found in other Italian Opera theaters of similar volume size, measured by the authors of this paper and commented on in the following sections.
The mean value related to definition (D
50) is around 0.7 for the stalls and 0.45 for the boxes, as indicated in
Figure 6f. A good speech definition is defined to have values higher than 0.5 (i.e., 50%), while the optimal values for music definition should be lower than 0.5 (i.e., 50%) [
18]. The D
50 results show that the Ponchielli theater of Cremona is suitable for both speech and music.
Another acoustic parameter that is relevant for an Opera theater is the speech transmission index (STI), which considers the level of distortion in a speech signal caused by building factors like reverberation and background noise [
22]. The STI parameter can assume values comprised between 0 and 1 and the measured results for the Ponchielli theater are summarized in
Table 2, assessed against the background noise level measured over a 30 min period inside the main hall. STI value summarized in
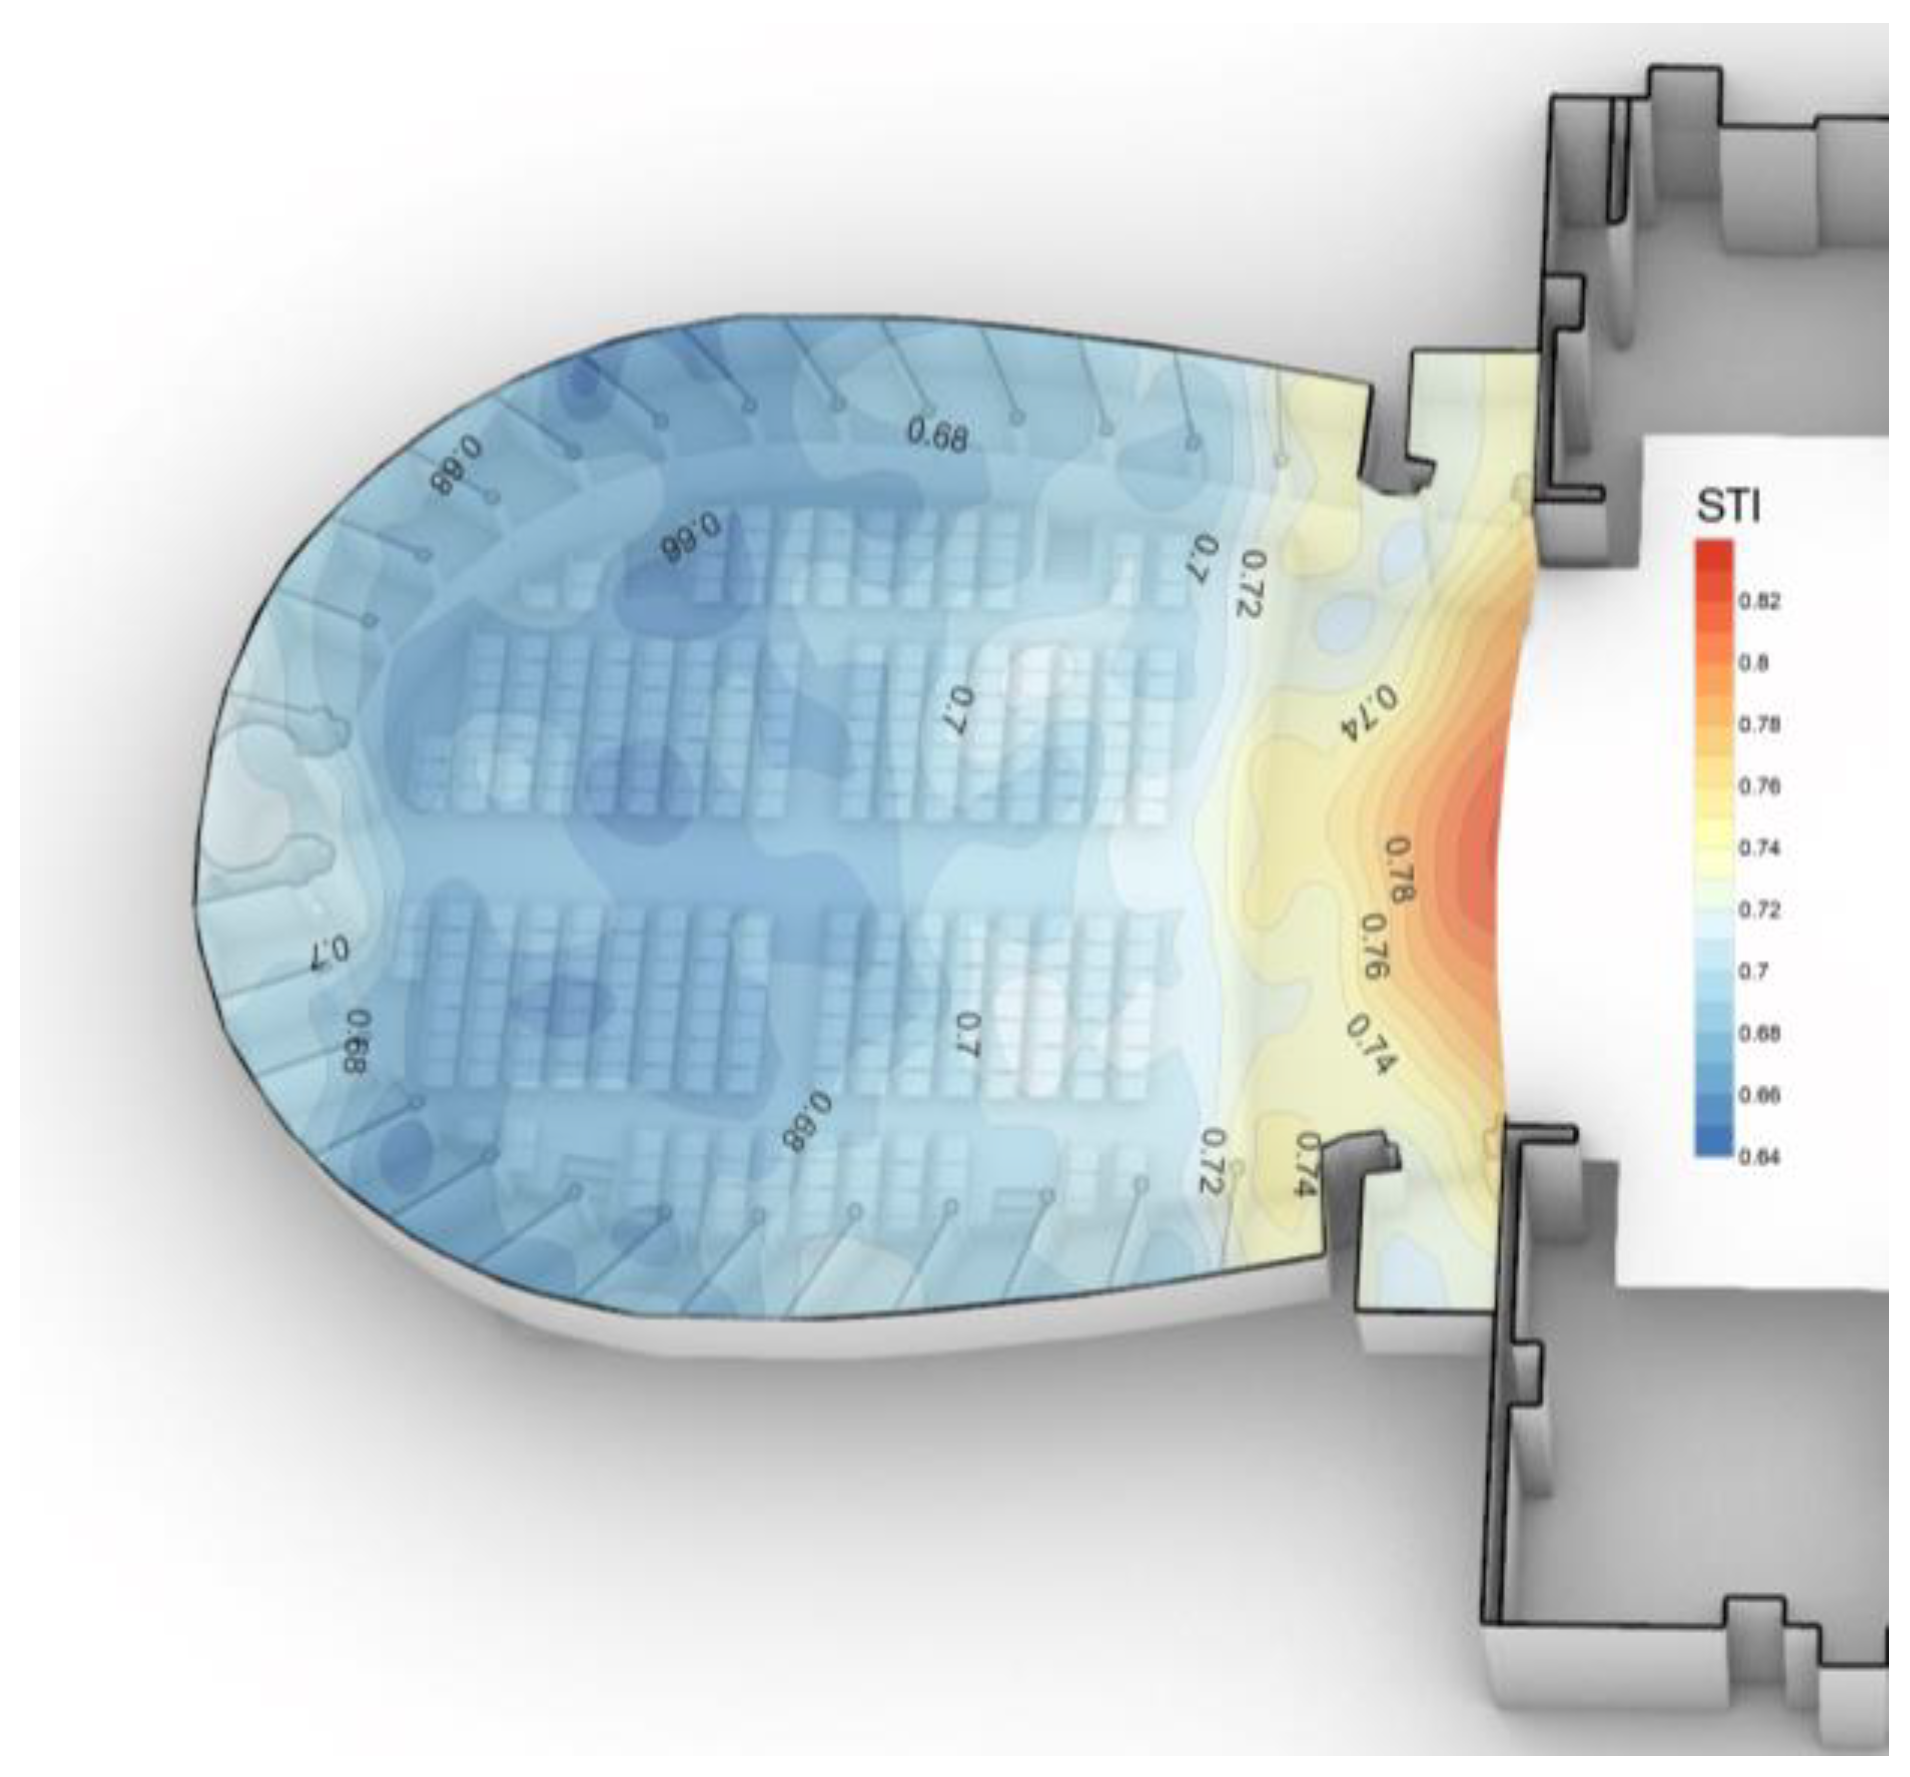
Table 2 is the average value of all measurement positions. A spatial distribution of this parameter is given in
Figure 7.
The values in
Table 2 should be considered the average of all the measuring points. Based on the results, the average STI value of the Ponchielli theater falls into the “good” category, as defined by the intelligibility rating according to ISO 9921 [
23]. This result represents another factor that contributes to making the overall acoustic quality of the Ponchielli theater one of the best in Northern Italy.
Figure 7 indicates the scale of STI values spread across the plan, where the values around 0.82 are closer to the stage, while the representative STI along the minor axis of the hall and at the back of the volume fluctuates around 0.7 and 0.66, respectively. The full spatial distribution of the STI across the whole plan is indicated in
Figure 7; it is obtained by the interpolation of the measured values in a few selected positions, to be referring to
Figure 4.
With reference to STI, it could be noted that this value could vary with the occupancy of the hall due to the increase in background noise due to people whispering. In other words, the higher the occupancy, the higher the background noise and therefore the lower the STI.
5. Acoustic Simulations
Acoustic simulations have been carried out using Ramsete 3.0 software, which is based on the principle of raytracing acoustics and considers a triangular base pyramid propagation of the sound rays [
24]. Compared to other software, the calculation time of Ramsete is constant for up to 4000 receivers in the model due to its constant time for computation. Before any evaluation of simulations on different scenarios, the acoustic calibration of the digital model was necessary.
Acoustic Calibration
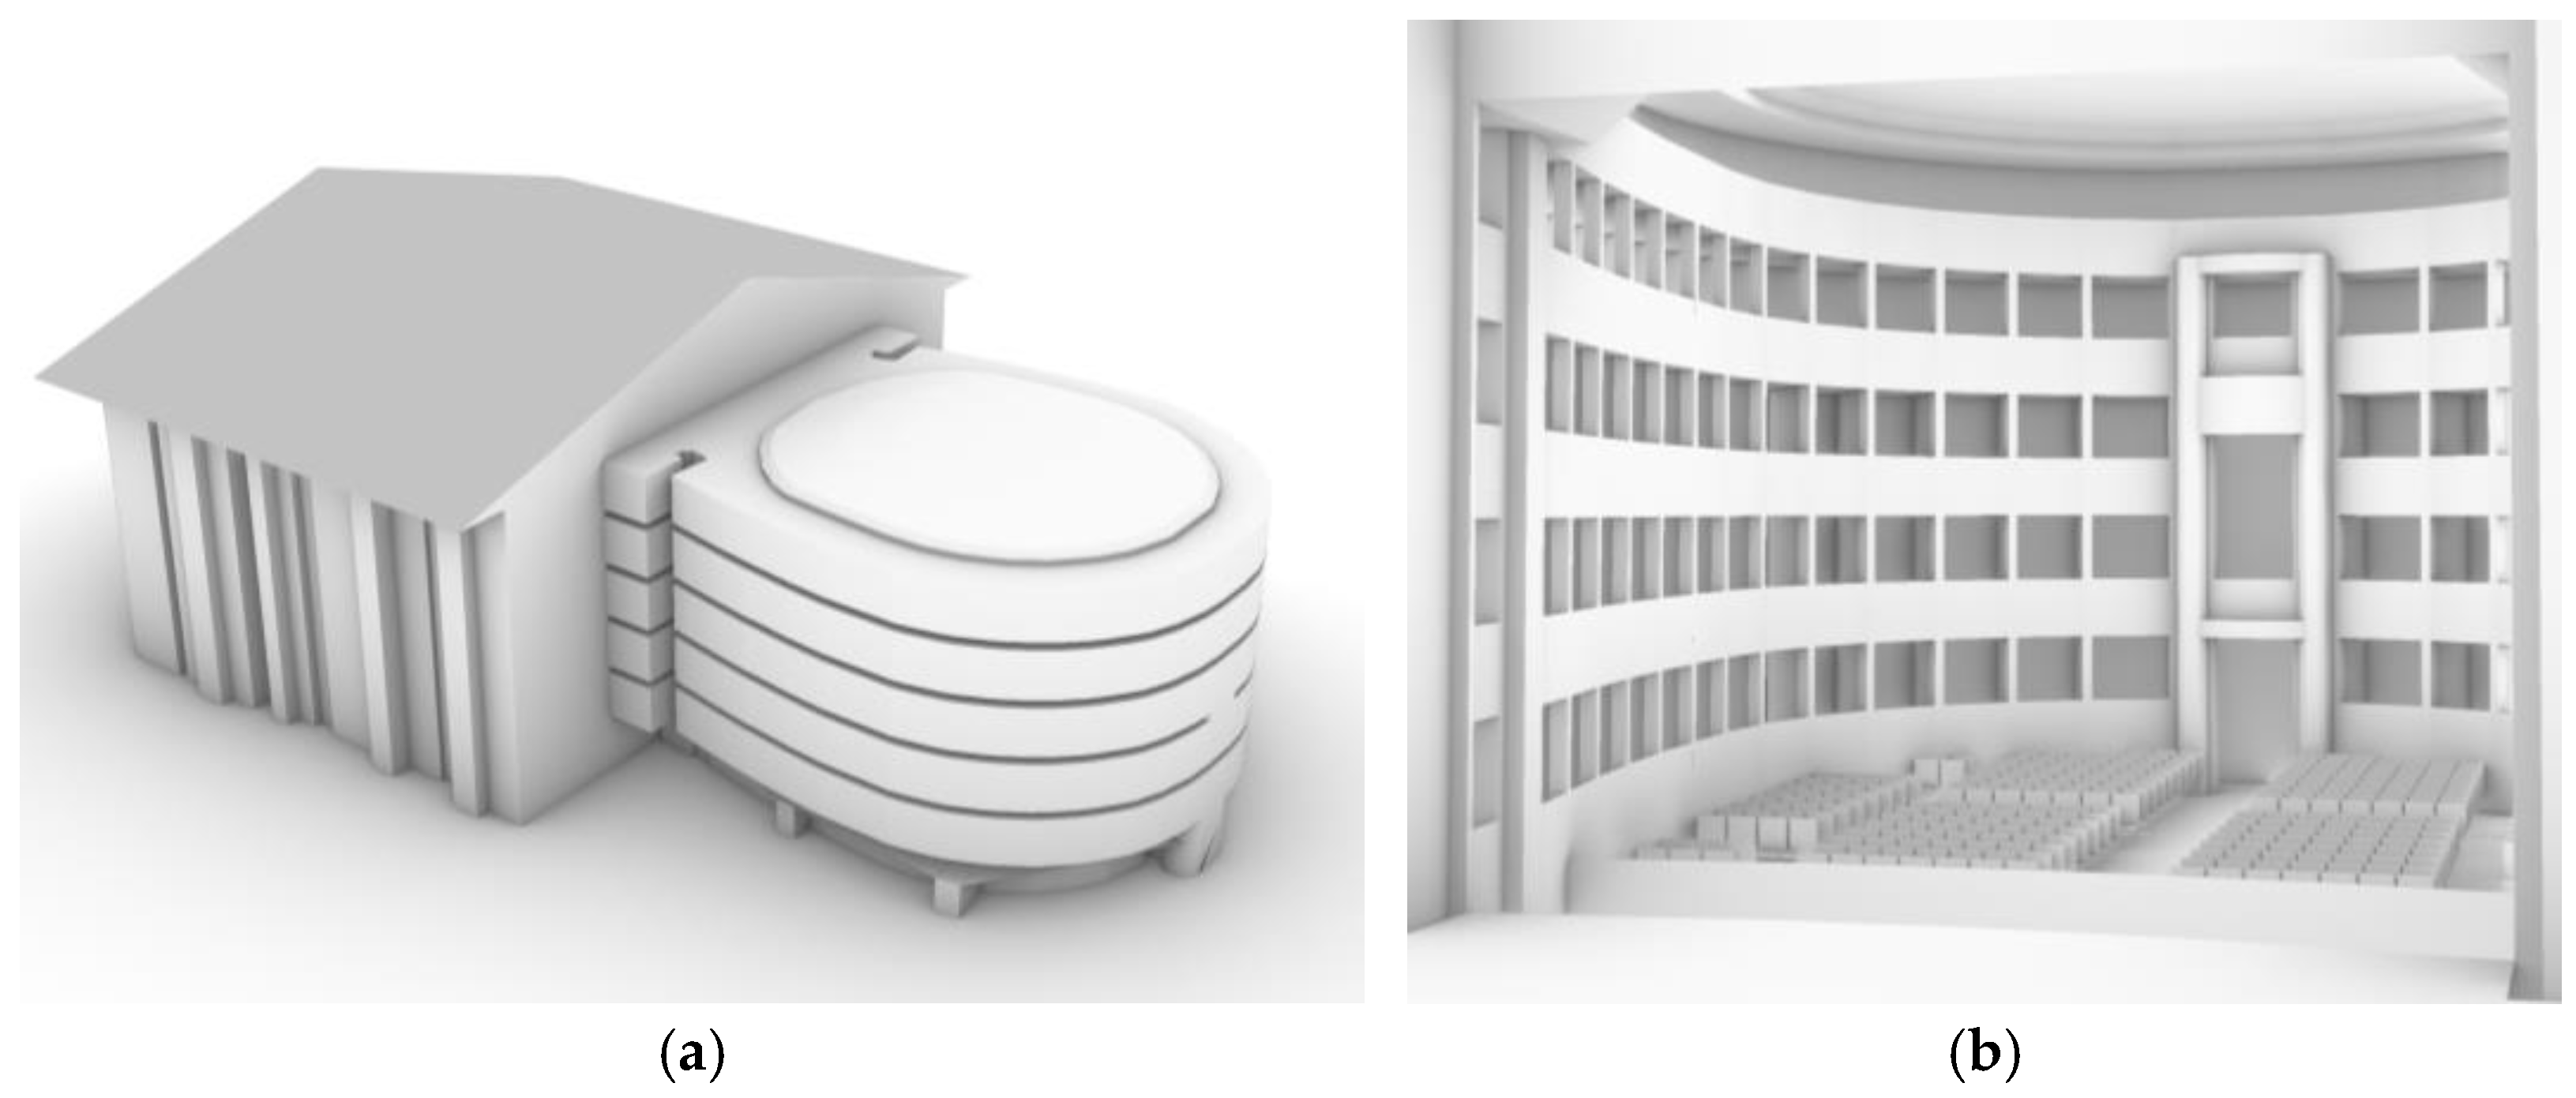
The 3D model was simplified from a more complex architecture, as shown in
Figure 8 before simulating the effect of different audience occupancy. Although the simplifications of the fine details, the overall geometry and architectural features have been kept.
For both calibration and simulations, Ramsete was configured with the parameters listed in
Table 3. The absorption and scattering coefficients for all the materials are indicated in
Table 4 and
Table 5 as a result of the calibration process and experience with acoustic simulations undertaken for other Opera houses [
16]. Note that the seats are characterized by medium-high upholstery (approximately 40–50 mm thickness). Also, the same conditions of the site survey have been reproduced into the model, especially regarding the unoccupied circumstance for the calibration.
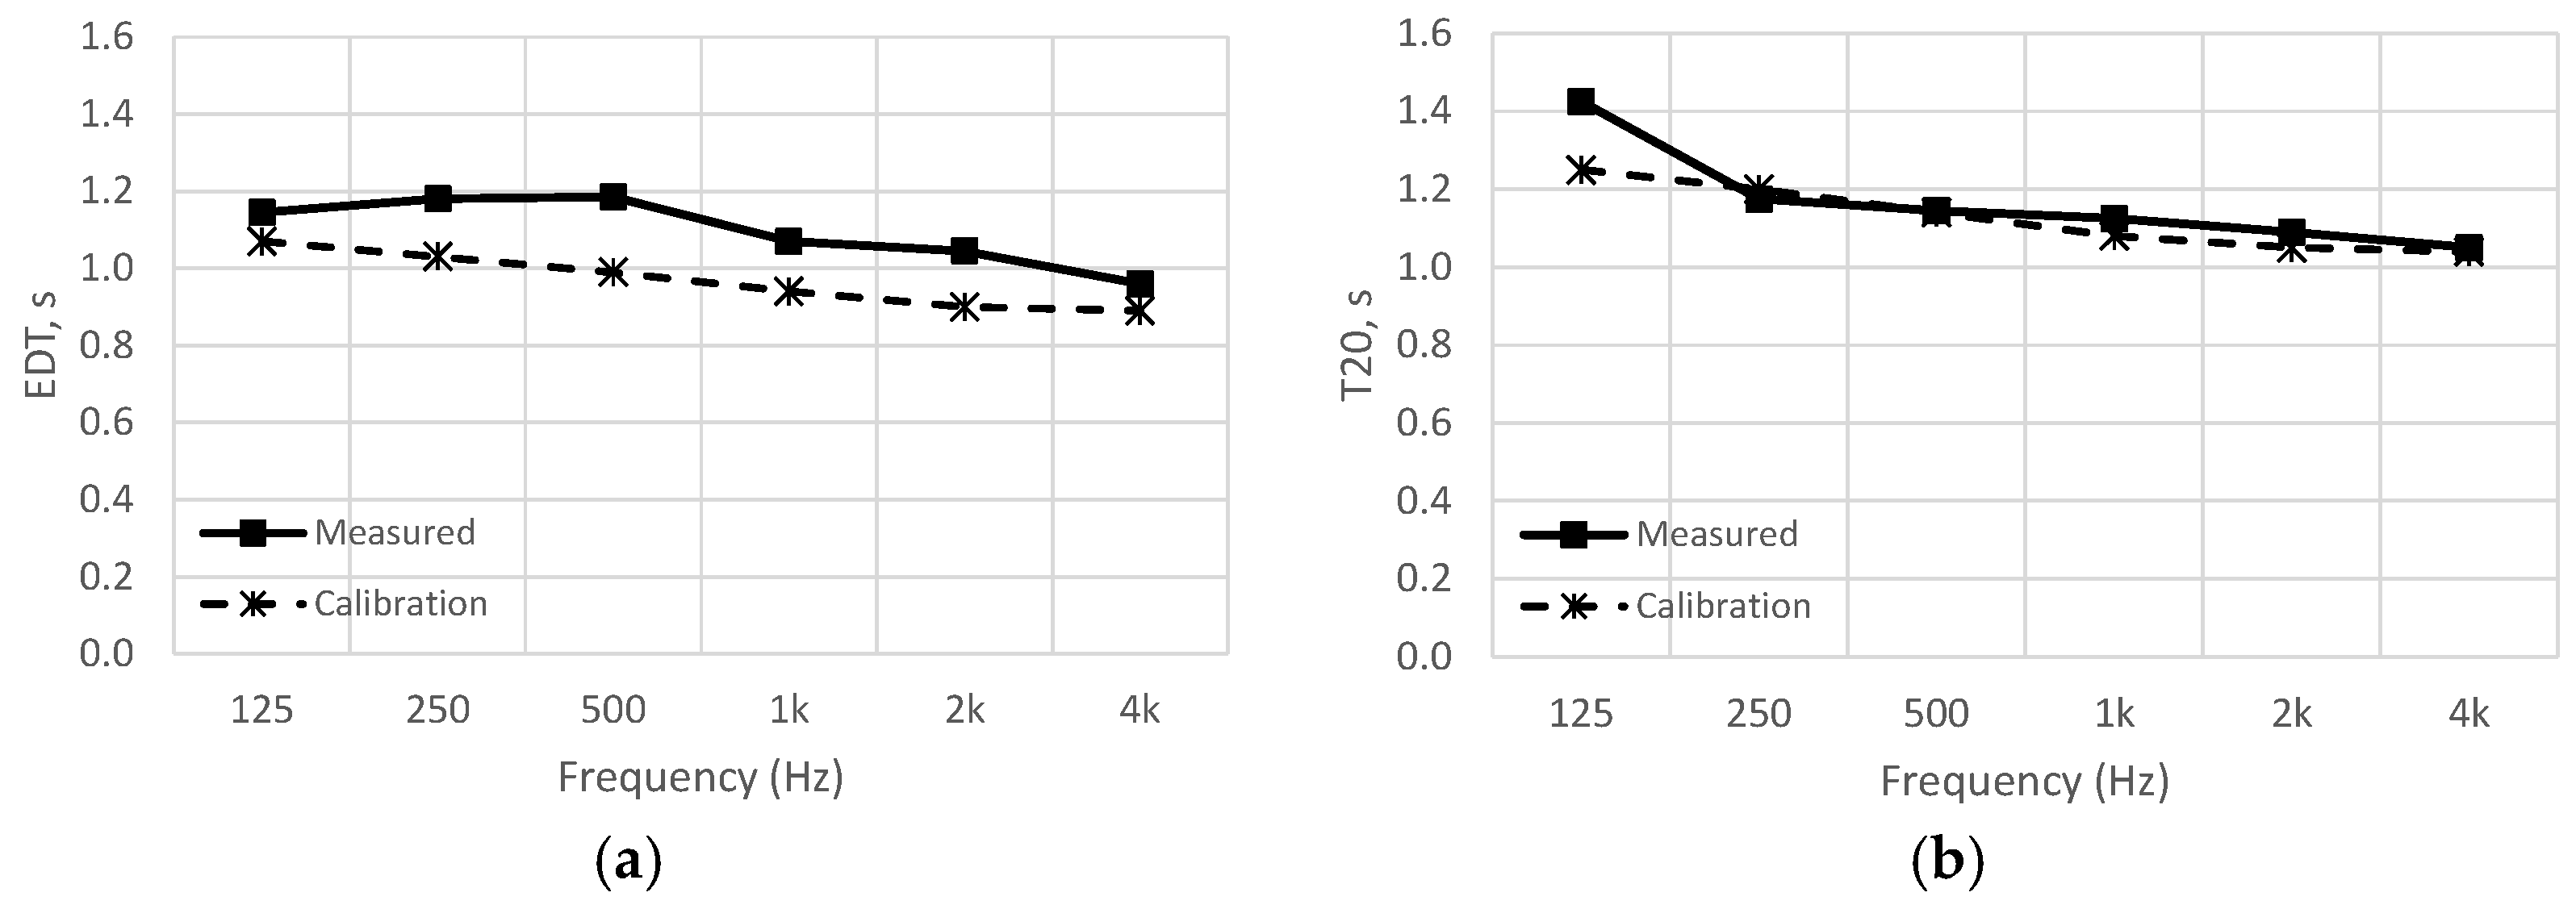
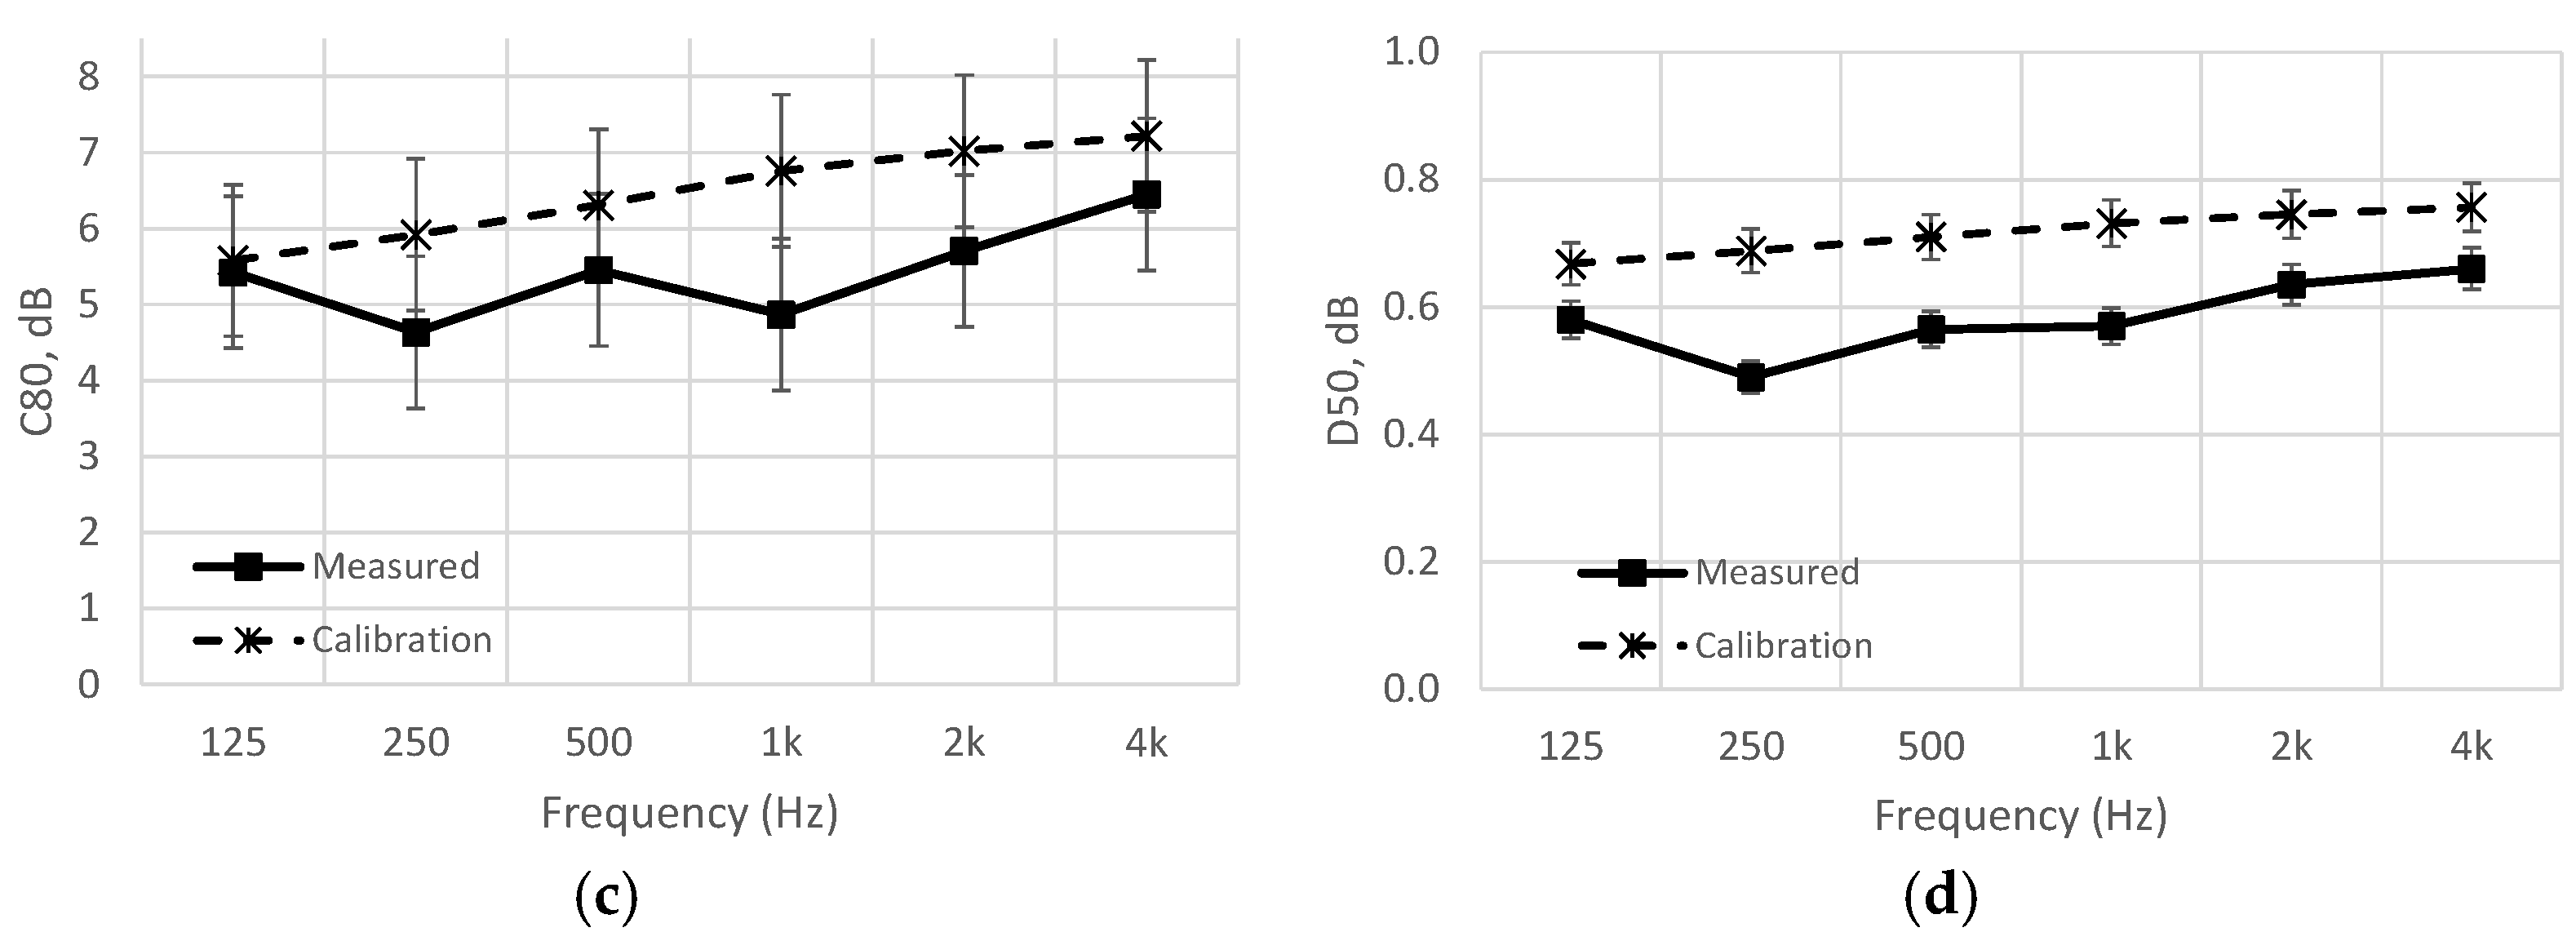
The calibration process was undertaken in relation to EDT, T
20, C
80 and D
50 across the bandwidth comprised between 125 Hz and 4 kHz, as shown in
Figure 9. For all the considered acoustic parameters, some deviation between the measured and calibrated values is seen due to the influence of environmental variables such as humidity and air absorption during the site measurements. This drift value is within 5% across all the octaves of the reverberation time and the EDT, as shown in
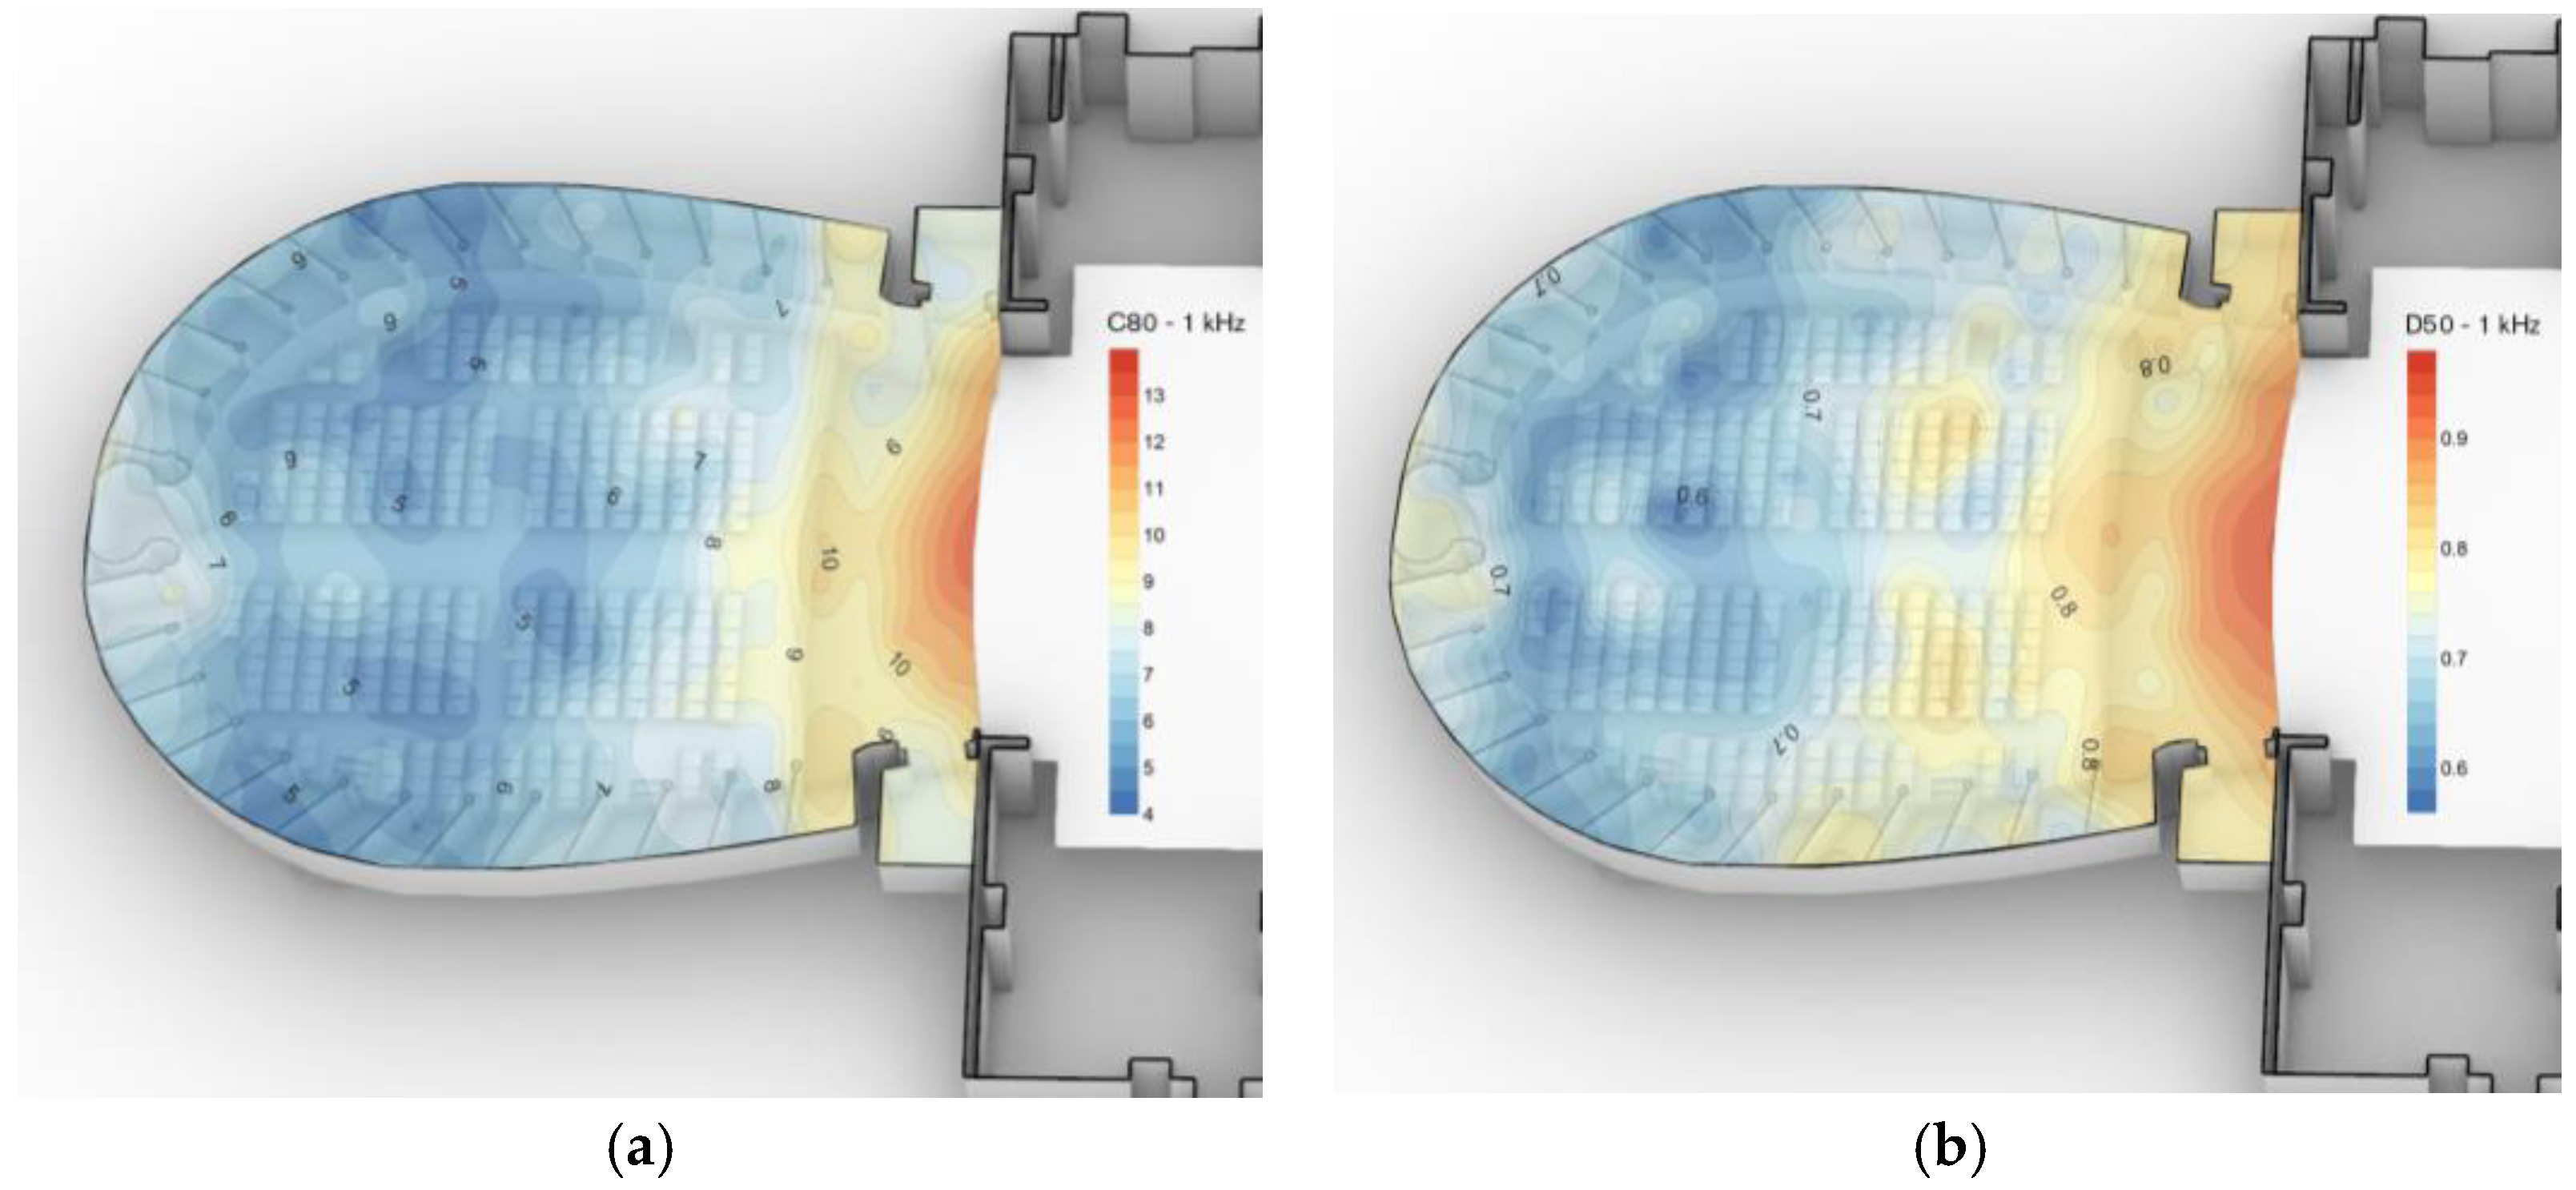
Figure 9, with the exception of the clarity index and the definition since these parameters are very sensitive to the exact position assumed during the site survey. However, the spatial distribution of C
80 and D
50 at 1 kHz is given in
Figure 10 in order to clarify the higher and lower values based on the position assumed across the plan.
6. Simulated Results
After the calibration process, the simulations of two specific scenarios are conducted, and described as follows:
The absorption coefficients assumed for the audience are summarized in
Table 6, related to 117 m
2 for 50% occupancy and 243 m
2 for 100% occupancy, respectively [
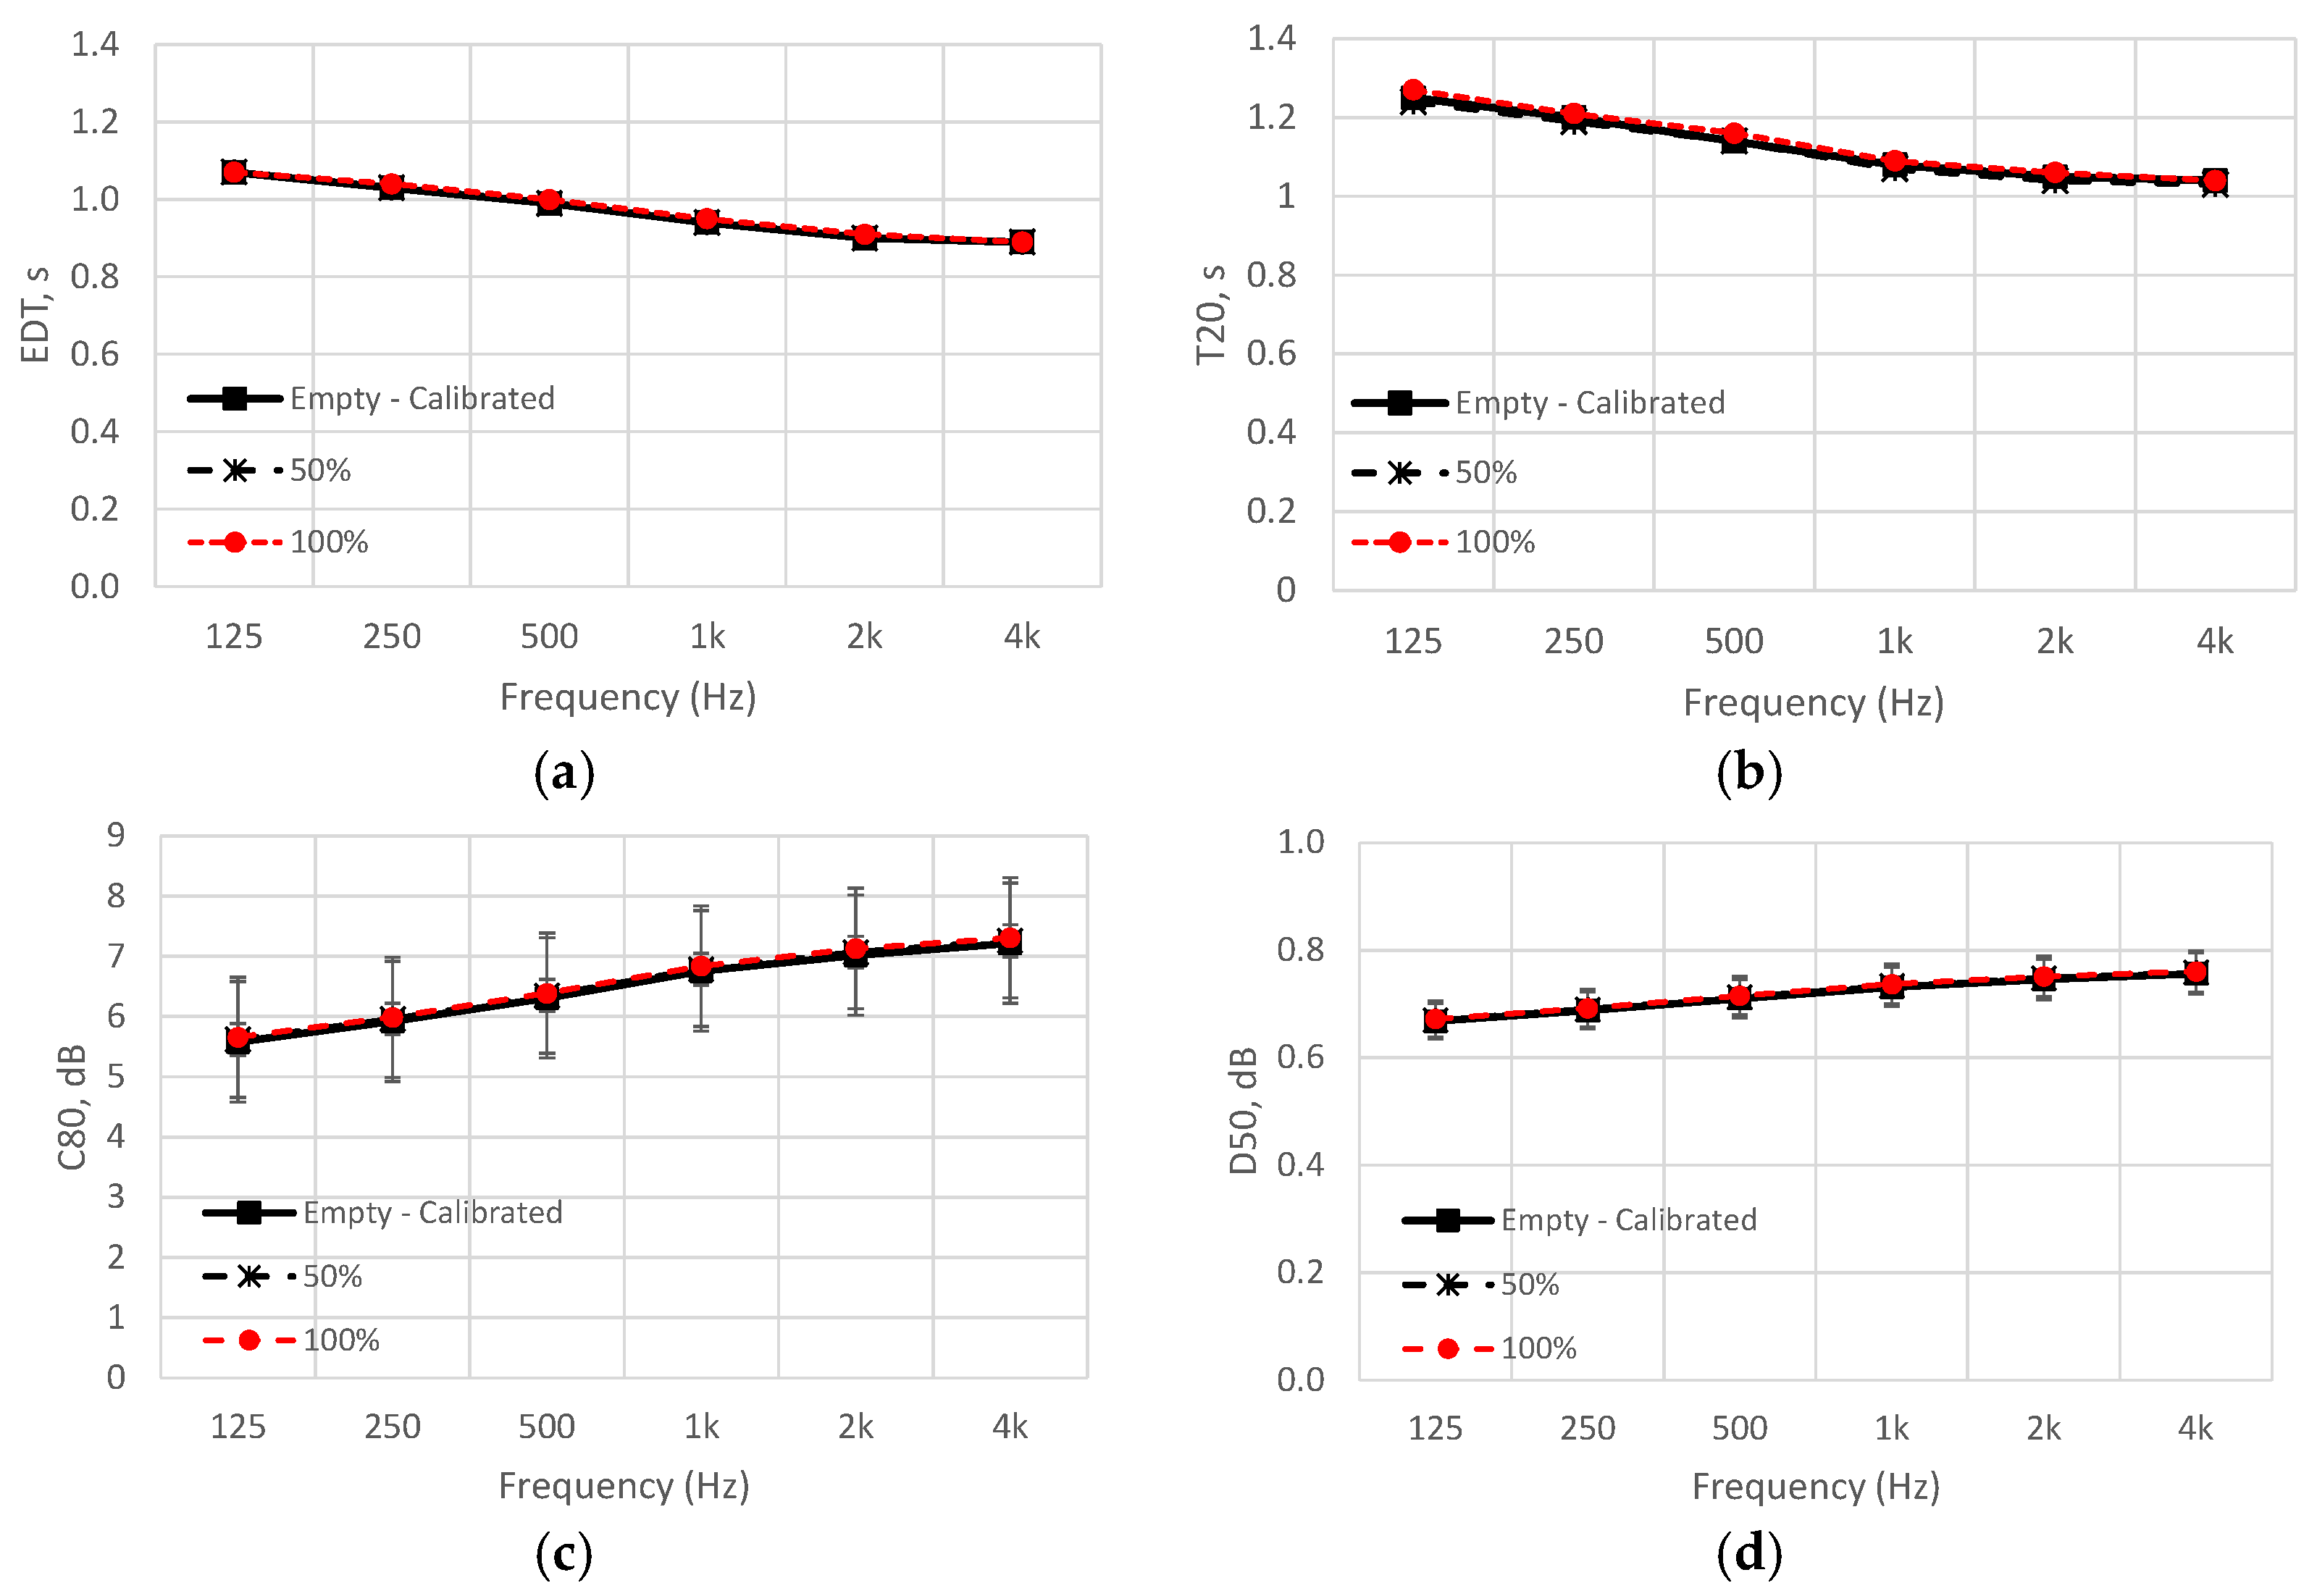
25]. The occupancy for the 50% scenario was uniformly distributed across the audience area, in both stalls and balconies—specifically, every other seat. The main acoustic parameters are reported in the octave bands between 125 Hz and 4 kHz, to be considered as the averaged values of all the receivers’ positions.
Figure 11 shows the graphs of the simulated results compared with the calibrated values representing the condition without any audience.
The graphs in
Figure 11 show that with a medium-high upholstery of the seats, the presence of an audience does not result in any appreciable difference [
26], meaning that the acoustics of the Ponchielli theater do not change and are independent of the degree of occupancy [
27]. This outcome is positive, especially for actors and musicians who do not have to change their effort between rehearsal and a live show in the presence of the public [
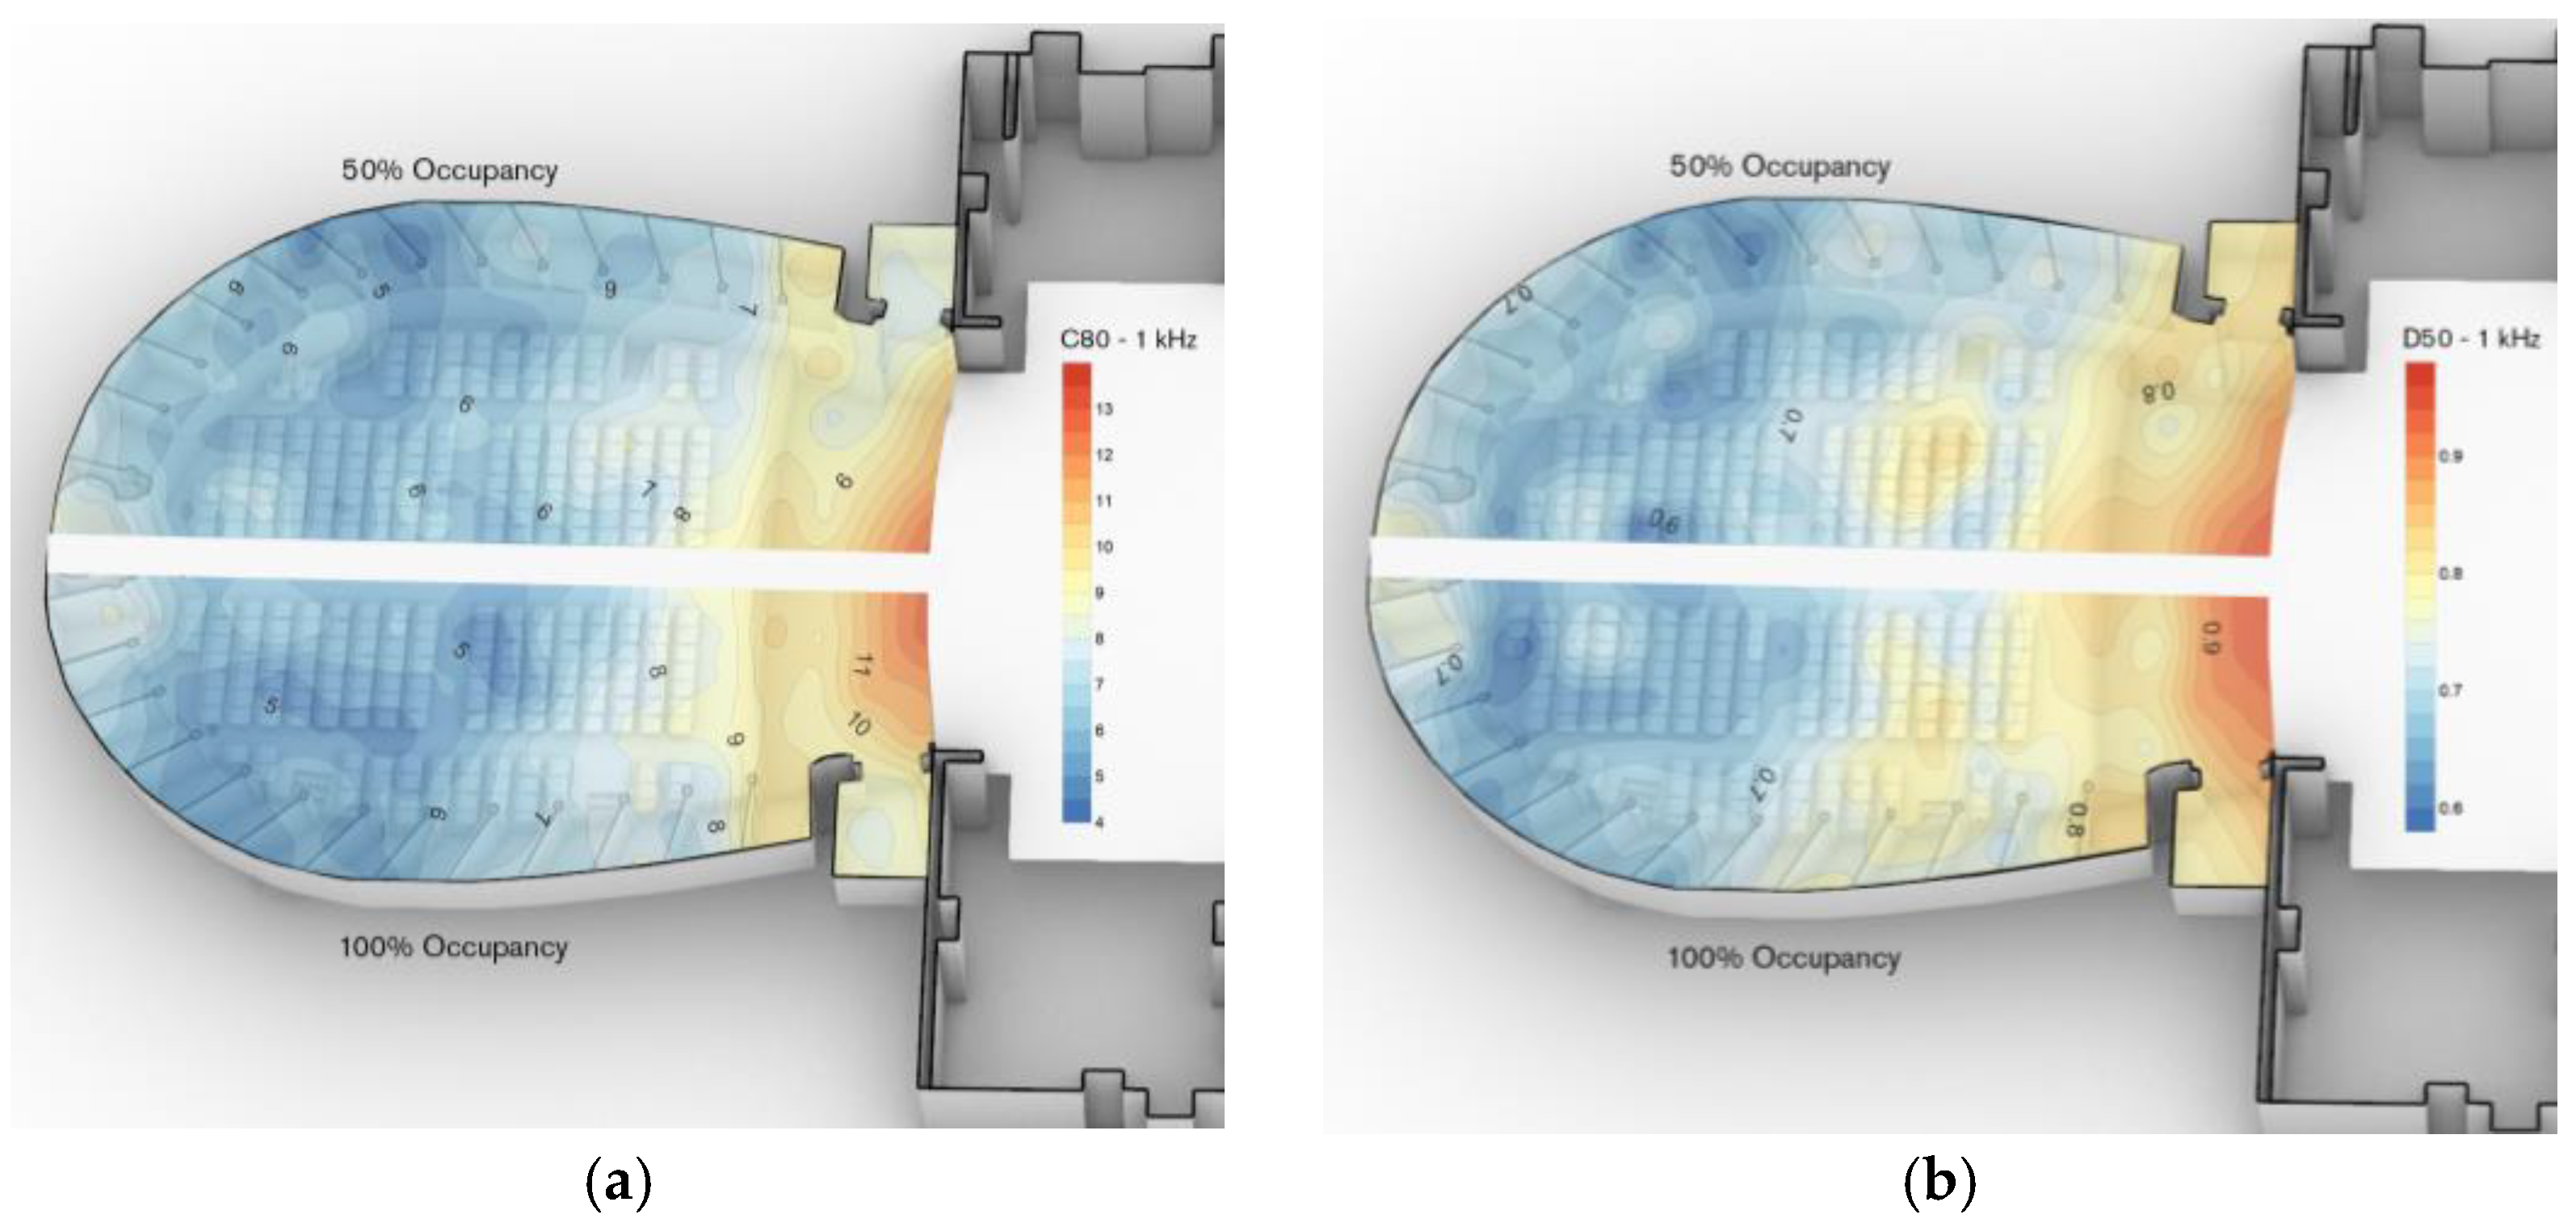
28]. The negligible change between 50% and 100% occupancy is due to the high absorbing coefficients of the seats that are very similar to those of a human body. In addition to the standard deviation error bars added to graphs (c) and (d) of
Figure 11, a spatial distribution at 1 kHz of the parameters C
80 and D
50 is shown in
Figure 12, where it is possible to see that the values are higher for positions close to the stage and 2–3 points less in the middle of the hall. The acoustic maps in
Figure 12 show the values at both 50% and 100% occupancy, shown above and below the main axis of the plan, respectively. The spatial distribution of C
80 and D
50 has been added since they are acoustic parameters that vary with the position inside the space, hence the average values are only indicative for all the octaves.
7. Acoustic Quality Comparison with Other Opera Theaters
Three other Italian Opera theaters, characterized by similar volume size and provided with a horseshoe shape, have been analyzed and compared with the Ponchielli theater of Cremona (PC), namely:
Mercadante theater of Naples (DN) [
1],
Verdi theater of Salerno (VS) [
29],
Masini theater of Faenza (MF) [
30].
The measured data have been averaged for all the receiving points. All measured values were carried out in unoccupied conditions. The data comparison between the selected theaters is summarized in
Table 7.
The comparison between the measured results of all the selected theaters is given in
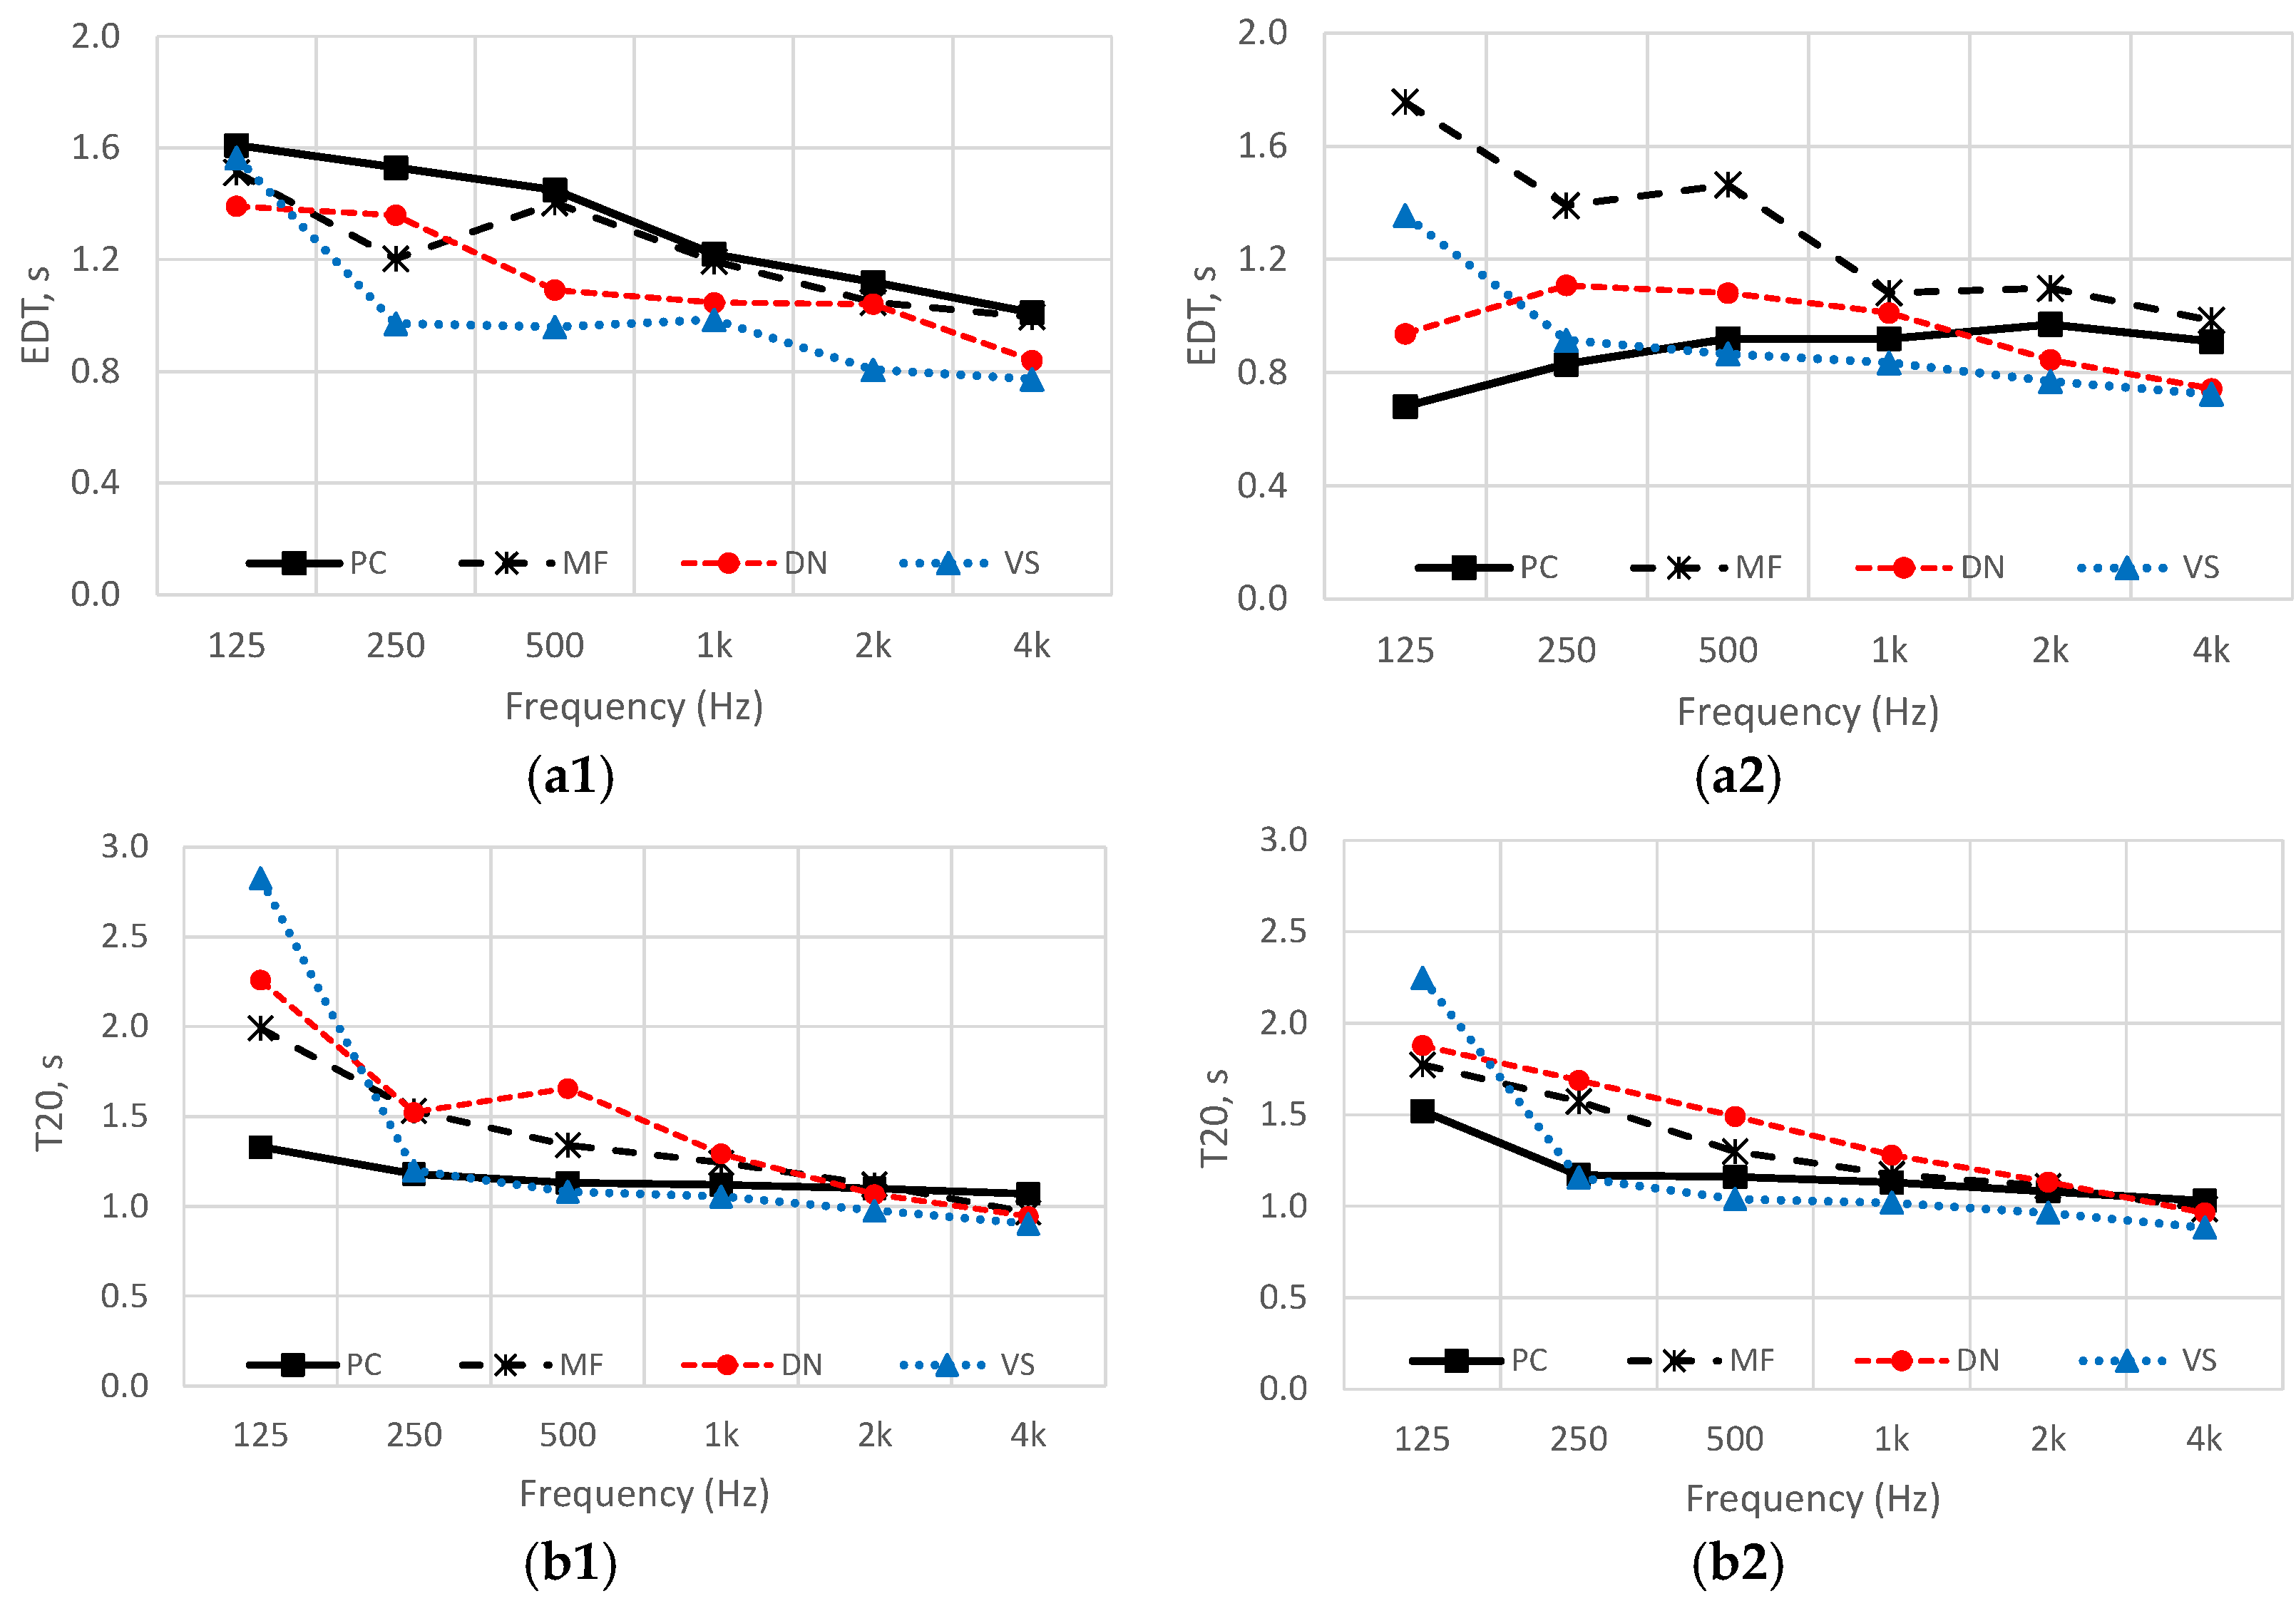
Figure 13, grouped as in the stalls and in the elevated boxes.
Figure 13 shows that the EDT values in the stalls are very similar between the theaters, with a difference of up to 0.8 s and overall fluctuating around 1.2 s, which is a good outcome for both speech and music perception. For the boxes, the difference between the theaters is wider, about 1 s at low frequencies, becoming narrower at high frequencies. The theater with the highest EDT values in the boxes is the Masini of Faenza, but these are still within the optimal range indicated by Jordan. Note that the Masini theater has the smallest volume size among the selection.
In terms of reverberation time, the T20 values measured in the stalls and boxes are very similar to each other, with the exception of the Verdi theater of Salerno showing a T20 value of almost 3 s at 125 Hz, greater than the others. This value is 0.6 s higher than the value measured in the boxes of the same theater. Overall, given the similarity of all the theaters, the average of the reverberation time values is good, fluctuating around 1.3–1.4 s at mid frequencies, meaning that the values are suitable for both speech and music.
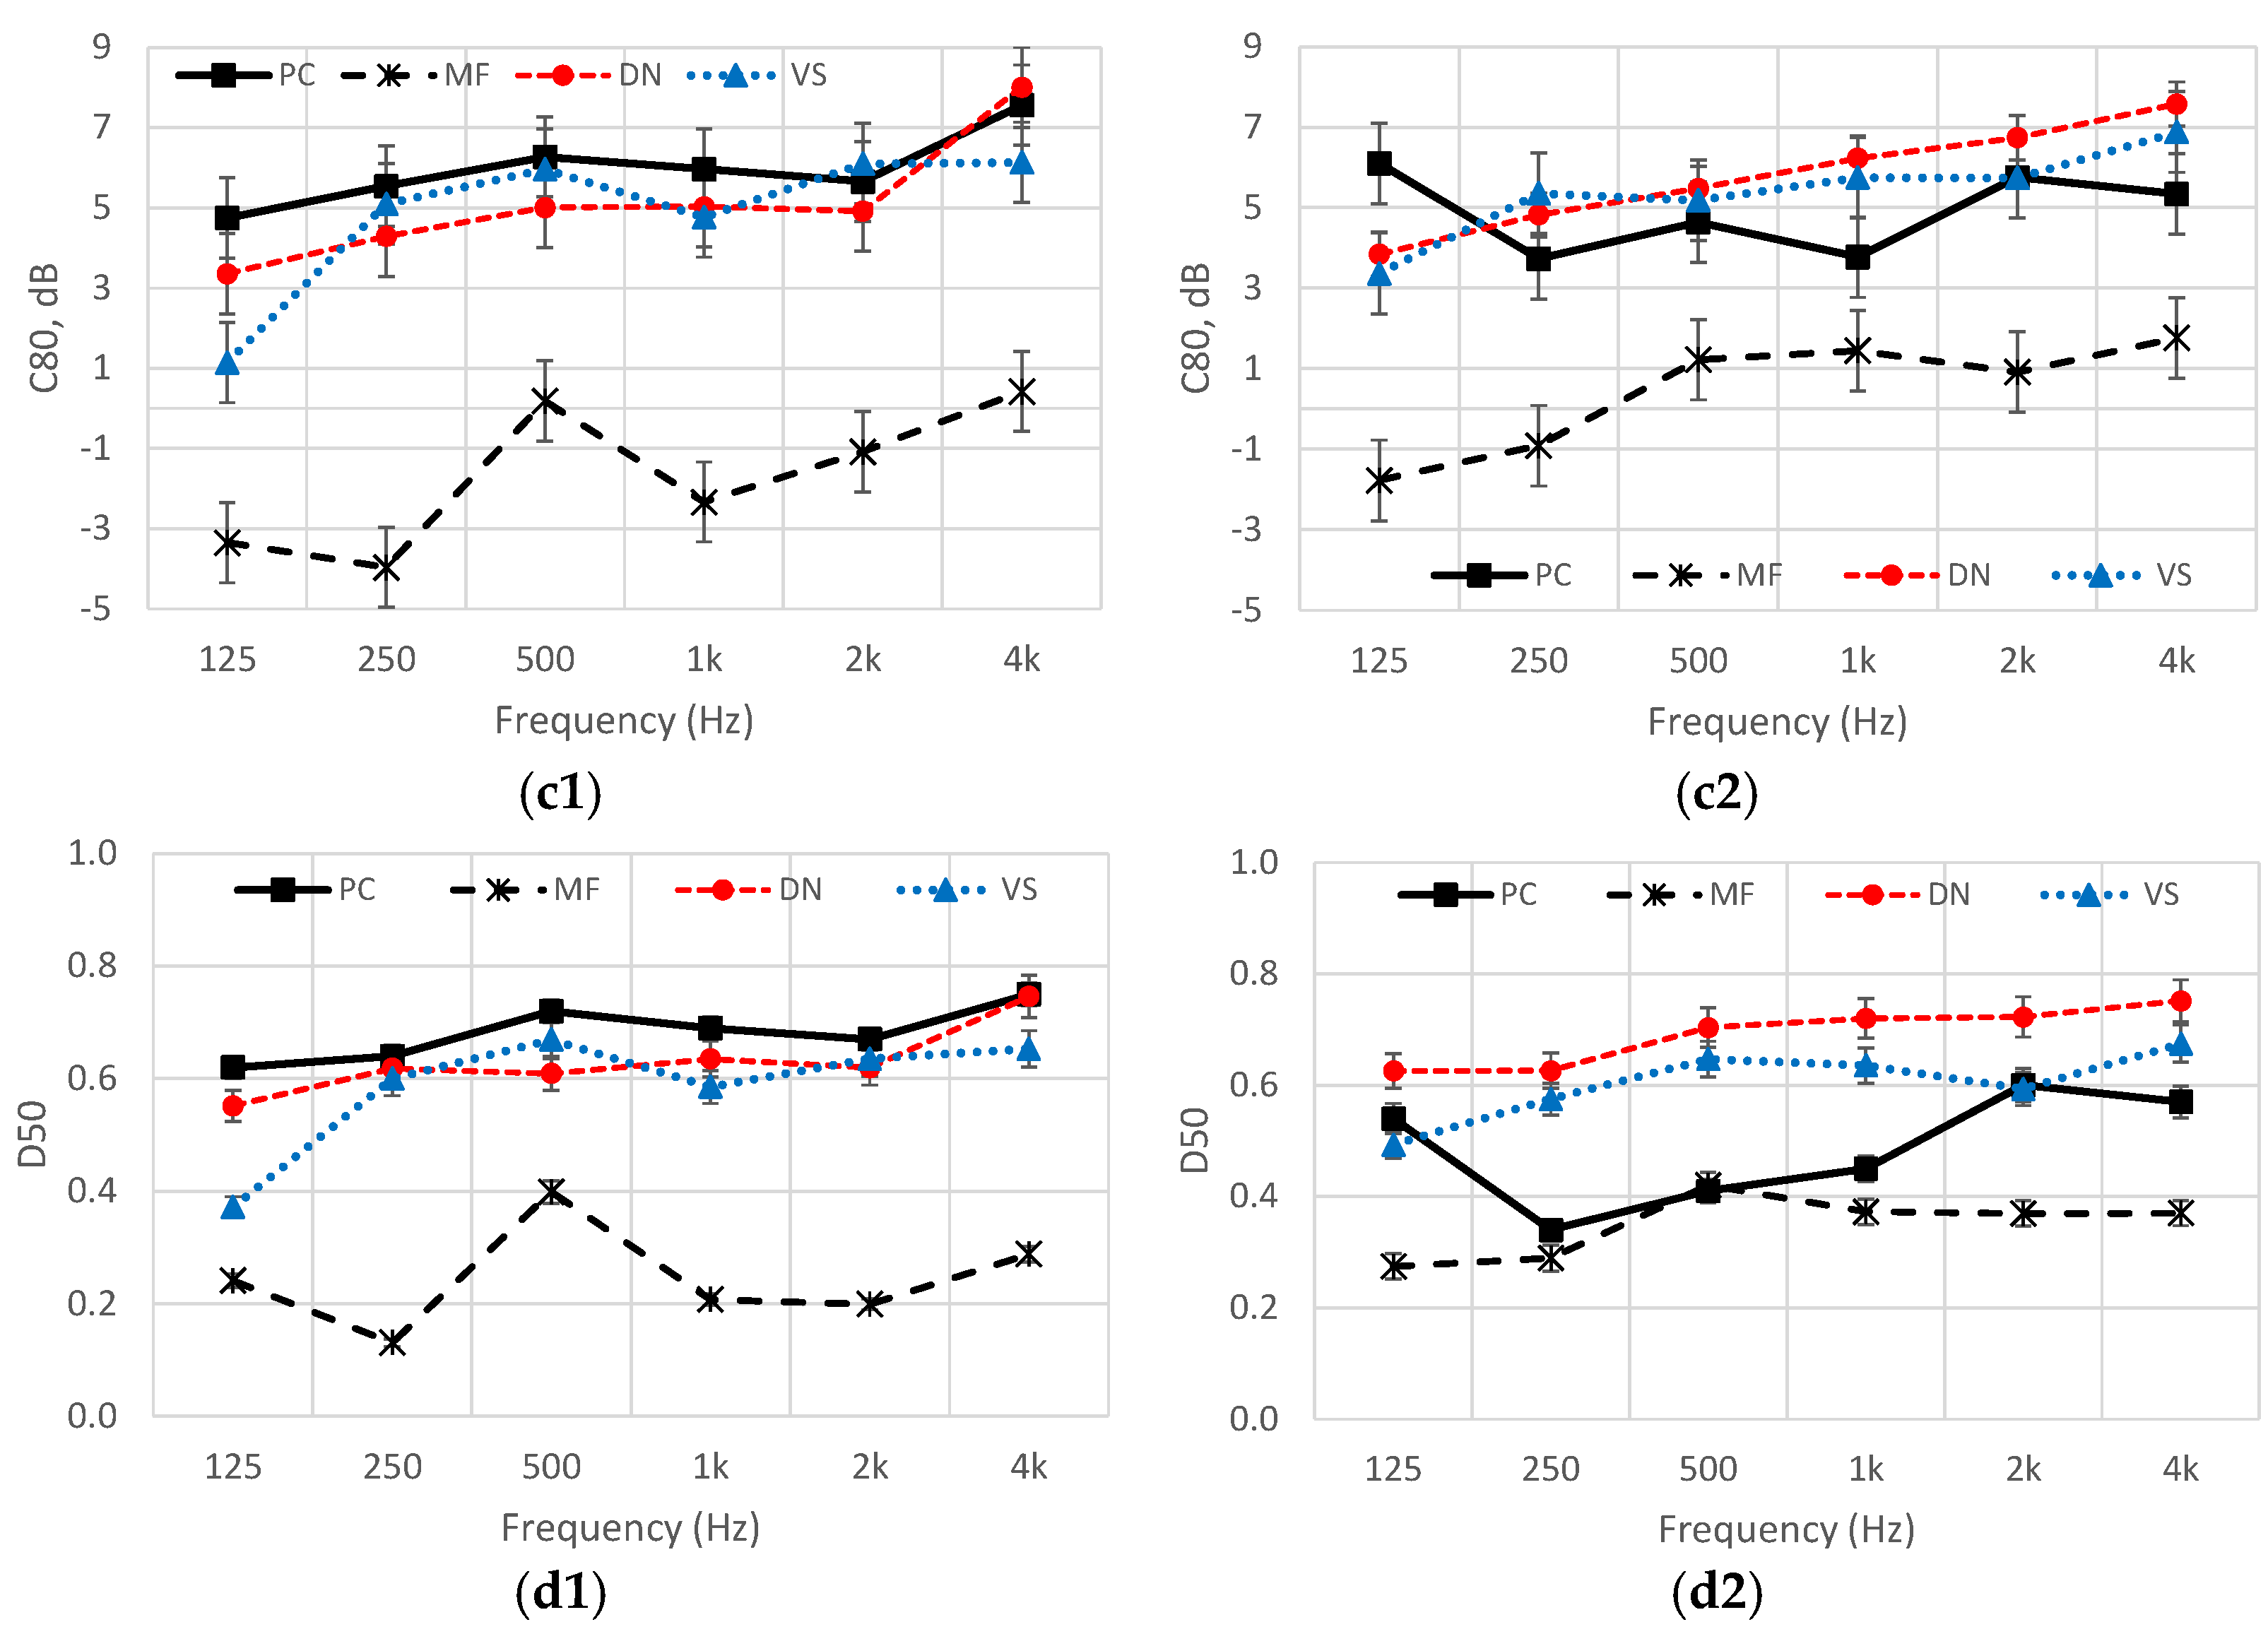
The trend in the music clarity index has been found to be very similar for the Ponchielli, Mercadante and Verdi theaters, while the results related to the Masini theater are up to 6 dB and 4 dB below those of the other theaters, for stalls and boxes, respectively. However, the C
80 values related to the Masini theater are within the optimal range, while the values related to the other three theaters are slightly above the upper range limit, which is a common factor of many Opera theaters having similar characteristics.
Figure 13c1,c2 shows the average values at each octave with the error bars since this parameter and the definition vary with the position assumed inside the space.
Regarding the definition,
Figure 13d1 shows a similar trend for the Ponchielli, Mercadante and Verdi theaters, at around 0.6, while the results related to the Masini theater fluctuate around 0.2–0.3. The results of definition do not change in the boxes for Mercadante, Verdi and Masini theaters, while the values measured in the Ponchielli theater are similar to the Masini theater at low-mid frequencies and similar to the Verdi and Mercadante theaters at 125 Hz and 2 kHz. Overall, the definition in the four theaters has been found to be suitable for both music and speech.
8. Discussions
The acoustic survey carried out inside the Ponchielli theater represents the baseline of the acoustic analysis related to the main acoustic parameters. The geometry and the configurations of the volume, organized over a horseshoe-shaped plan are very important to understand the outcomes obtained by the post-processing IRs. Based on the results, the acoustic response of the main hall is suitable for both music and speech performances, as 19th Century theaters were built to be used for both drama and musical performances.
The acoustic simulations have demonstrated that the high absorption given by the upholstered seats do not change the acoustic response of the hall at different percentage of occupancy, hence a balance between rehearsal and live performance is kept and the performers do not need to change their effort with the presence of an audience.
After the acoustic simulations, a comparison with the measured values undertaken by authors in other Opera theaters having a similar volume size has been reported and discussed. Specifically, the comparison grouped distinctively for stalls and balconies indicates that the values are very similar across the selected theaters, although a slight underperformance has been found for the C80 results of the Ponchielli, Mercadante and Verdi theaters, which are slightly above the upper optimal range limit.
Future research will focus on acoustic simulations of different types of scenery, including those realized with modern materials, to highlight the adaptability of old theater spaces to contemporary performances, possibly integrating a comparison with other research studies already carried out for other Opera theaters.
Author Contributions
Conceptualization, L.T., A.B. and R.Y.; methodology, L.T.; software, A.B.; validation, L.T.; formal analysis, A.B.; investigation, L.T. and A.B.; resources, L.T. and A.B.; data curation, A.B.; writing—original draft preparation, R.Y.; writing-review and editing, A.B.; visualization, A.B.; supervision, L.T. and A.B.; project administration, L.T.; funding acquisition, L.T. All authors have read and agreed to the published version of the manuscript.
Funding
This research received no external funding.
Institutional Review Board Statement
Not applicable.
Informed Consent Statement
Not applicable.
Data Availability Statement
Data non available due to privacy reasons.
Acknowledgments
The authors would like to acknowledge the students of the Applied Acoustics Course at the School of Architecture of the University of Bologna for their collaboration with this research.
Conflicts of Interest
The authors declare no conflict of interest.
References
- Bevilacqua, A.; Sukaj, S.; Ciaburro, G.; Iannace, G.; Lombardi, I.; Trematerra, A. How a quartet of theatres plays under an acoustic perspective: A comparison between horseshoe shaped plans in Campania. Build. Acoust. 2022, 29, 317–329. [Google Scholar] [CrossRef]
- Merli, F.; Bevilacqua, A.; Tronchin, L. Acoustic response of the Goldoni theater of Bagnacavallo. In Proceedings of the International Congress on Immersive 3D Audio (I3DA), Bologna, Italy, 5–7 September 2021. [Google Scholar]
- Tronchin, L.; Merli, F.; Dolci, M. Acoustic reconstruction of Eszterháza opera house following new archival research. Appl. Sci. 2020, 10, 8817. [Google Scholar] [CrossRef]
- Tronchin, L.; Bevilacqua, A. How much does the variety of scenery and the different percentages of audience occupancy affect the indoor acoustics at the national theater of Zagreb? Appl. Sci. 2022, 12, 6500. [Google Scholar] [CrossRef]
- Bevilacqua, A.; Merli, F.; Farina, A.; Armelloni, E.; Farina, A.; Tronchin, L. 3dof representation of the acoustic measurements inside the Comunale-Pavarotti theater of Modena. In Proceedings of the International Congress on Immersive 3D Audio (I3DA), Bologna, Italy, 5–7 September 2021. [Google Scholar]
- Funkhouser, T. A beam tracing approach to acoustic modeling for interactive virtual environments. In Proceedings of the 25th International Conference on Computer Graphics and Interactive Techniques (SIGGRAPH 98), Orlando, FL, USA, 19–24 July 1998; ACM Press: New York, NY, USA; pp. 21–32. [Google Scholar]
- Monteverdi Festival Cremona 2023. Available online: https://www.teatroponchielli.it (accessed on 31 August 2022).
- ISO 3382-1; Acoustics—Measurement of Room Acoustic Parameters; Part 1: Performance Spaces. ISO: Geneva, Switzerland, 2009.
- Farina, A.; Tronchin, L. Measurements and reproduction of spatial sound characteristics of auditoria. Acoust. Sci. Technol 2005, 26, 193–199. [Google Scholar] [CrossRef] [Green Version]
- Barron, M. Auditorium Acoustics and Architectural Design, 2nd ed.; Spon Press: New York, NY, USA, 2009. [Google Scholar]
- Vorländer, M. Fundamentals of Acoustics, Modelling, Simulation, Algorithms and Acoustic Virtual Reality; Springer Science & Business Media: Berlin/Heidelberg, Germany, 2007. [Google Scholar]
- Farina, A.; Tronchin, L. 3D sound characterisation in theatres employing microphone arrays. Acta Acust. United Acust. 2013, 99, 118–125. [Google Scholar] [CrossRef] [Green Version]
- Farina, A. Simultaneous measurement of impulse response and distortion with a swept-sine technique. J. Audio Eng. Soc. 2000, 48, 18–22. [Google Scholar]
- Tronchin, L. Variability of room acoustic parameters with thermo-hygrometric conditions. Appl. Acoust. 2021, 177, 107–933. [Google Scholar] [CrossRef]
- Barron, M.; Lee, L.J. Energy relations in concert auditoriums. J. Acoust. Soc. Am. 1988, 84, 618–628. [Google Scholar] [CrossRef]
- Kuttruff, H. Room Acoustics, 4th ed.; Spon Press: London, UK, 2000. [Google Scholar]
- Jeon, J.Y.; Seo, R.; Jo, H.I. Effects of stage volume ratio on audience acoustics in concert halls. Sustainability 2020, 12, 1370. [Google Scholar] [CrossRef] [Green Version]
- Reichardt, W.; Abel Alim, O.; Schmidt, W. Definition and basis of making an objective evaluation to distinguish between useful and useless clarity defining musical performances. Acta Acust. 1975, 3, 126–137. [Google Scholar]
- Farina, A. Advancements in impulse response measurements by sine sweeps. In Proceedings of the Audio Engineering Society Convention 122, Vienna, Austria, 5–8 May 2007; Volume 3, pp. 1626–1646. [Google Scholar]
- Farina, A. Aurora listens to the traces of pyramid power. Noise Vib. World 1995, 26, 6–9. [Google Scholar]
- Jordan, V.L. Acoustical criteria for auditoriums and their relation to model techniques. J. Acoust. Soc. Am. 1970, 47, 408–412. [Google Scholar] [CrossRef]
- Peer, I.; Rafaely, B.; Zigel, Y. Room acoustics parameters affecting speaker recognition degradation under reverberation. In Proceedings of the 2008 Hands-Free Speech Communication and Microphone Arrays (HSCMA), Trento, Italy, 6–8 May 2008; pp. 136–139. [Google Scholar]
- ISO 9921; Ergonomics-Assessment of Speech Communication. ISO: Geneva, Switzerland, 2003.
- Farina, A. Verification of the accuracy of the Pyramid Tracing algorithm by comparison with experimental measurements by objective parameters. In Proceedings of the International Conference on Acoustics, Trondheim, Norway, 26–30 June 1995. [Google Scholar]
- Tronchin, L.; Bevilacqua, A. The royal Tajo Opera theatre of Lisbon: From architecture to acoustics. J. Acoust. Soc. Am. 2023, 153, 400–414. [Google Scholar] [CrossRef] [PubMed]
- Hammond, R.; Hill, A.J.; Mapp, P. On the accuracy of audience implementations in acoustic computer modelling. In Proceedings of the 145th Audio Engineering Society International Convention, New York, NY, USA, 21 October 2018. [Google Scholar]
- Beranek, L.L.; Hidaka, T. Sound absorption in concert halls by seats, occupied and unoccupied, and by the hall’s interior surfaces. J. Acoust. Soc. Am. 1998, 104, 3169–3177. [Google Scholar] [CrossRef]
- Cox, T.J.; D’Antonio, P. Acoustic Absorbers and Diffusers: Theory, Design and Application, 3rd ed.; CRC Press: Boca Raton, FL, USA, 2004. [Google Scholar]
- Bevilacqua, A.; Merli, F.; Tronchin, L. Verdi theater of Salerno: A deepening acoustic research. In Proceedings of the International Congress on Immersive 3D Audio (I3DA), Bologna, Italy, 5–7 September 2021. [Google Scholar]
- Merli, F.; Bevilacqua, A.; Tronchin, L. Acoustic discoveries of the Masini theater of Faenza. In Proceedings of the International Congress on Immersive 3D Audio (I3DA), Bologna, Italy, 5–7 September 2021. [Google Scholar]
Figure 1.
View of the main hall from stage of Ponchielli theater of Cremona [
7].
Figure 1.
View of the main hall from stage of Ponchielli theater of Cremona [
7].
Figure 2.
Plan layout of the Ponchielli theater of Cremona.
Figure 2.
Plan layout of the Ponchielli theater of Cremona.
Figure 3.
Details of the boxes from the main hall.
Figure 3.
Details of the boxes from the main hall.
Figure 4.
Scheme of the equipment location during the acoustic survey.
Figure 4.
Scheme of the equipment location during the acoustic survey.
Figure 5.
Installation of receivers (a) and sound source (b) during the survey.
Figure 5.
Installation of receivers (a) and sound source (b) during the survey.
Figure 6.
Measured results of the main acoustic parameters: EDT (a), T20 (b), C50 (d), C80 (e), and D50 (f). Correlation between reverberation time and volume size of the theater (c).
Figure 6.
Measured results of the main acoustic parameters: EDT (a), T20 (b), C50 (d), C80 (e), and D50 (f). Correlation between reverberation time and volume size of the theater (c).
Figure 7.
Spatial distribution of speech transmission index (STI) inside the Ponchielli theater of Cremona.
Figure 7.
Spatial distribution of speech transmission index (STI) inside the Ponchielli theater of Cremona.
Figure 8.
Digital model of the Ponchielli theater of Cremona: external view (a), perspectival view of the main hall from the stage (b).
Figure 8.
Digital model of the Ponchielli theater of Cremona: external view (a), perspectival view of the main hall from the stage (b).
Figure 9.
Acoustic calibration based on main acoustic parameters: early decay time (a), reverberation time (b), music clarity index (c), and definition (d).
Figure 9.
Acoustic calibration based on main acoustic parameters: early decay time (a), reverberation time (b), music clarity index (c), and definition (d).
Figure 10.
Spatial distribution of clarity index (a) and definition (b) at 1 kHz related to the Ponchielli theater of Cremona.
Figure 10.
Spatial distribution of clarity index (a) and definition (b) at 1 kHz related to the Ponchielli theater of Cremona.
Figure 11.
Simulated results of the acoustic parameters: EDT (a), T20 (b) C80 (c) and D50 (d).
Figure 11.
Simulated results of the acoustic parameters: EDT (a), T20 (b) C80 (c) and D50 (d).
Figure 12.
Spatial distribution of C80 (a) and D50 (b) simulated at 50% and 100% occupancy.
Figure 12.
Spatial distribution of C80 (a) and D50 (b) simulated at 50% and 100% occupancy.
Figure 13.
Comparison of measured results with other Italian Opera theaters: EDT (a1,b1), T20 (b1,b2) C80 (c1,c2) and D50 (d1,d2). Type 1 stands for results measured in the stalls. Type 2 stands for results measured in boxes.
Figure 13.
Comparison of measured results with other Italian Opera theaters: EDT (a1,b1), T20 (b1,b2) C80 (c1,c2) and D50 (d1,d2). Type 1 stands for results measured in the stalls. Type 2 stands for results measured in boxes.
Table 1.
Architectural features of the Ponchielli theater of Cremona.
Table 1.
Architectural features of the Ponchielli theater of Cremona.
| | Architectural Item | Values |
|---|
| Main Hall | Total capacity (No. of seats) | Up to 800 |
| Major axis (m) | 21 |
| Minor axis (m) | 16 |
| Height (m) | 13.8 |
| Volume (m3) | Approx. 3600 |
| Scenic Building | Length (m) | 32 |
| Width (m) | 25 |
| Height up to the grid (m) | 15 |
| Volume (m3) | Approx. 12,000 |
| Main Hall + Scenic Building | Volume (m3) | 15,600 |
Table 2.
Speech Transmission Index of the Ponchielli theater of Cremona.
Table 2.
Speech Transmission Index of the Ponchielli theater of Cremona.
| Measured STI | Scale Evaluation | Equivalent Sound Pressure Levels LAeq, 30 min (dB) |
|---|
| 0.7 | 0.6 < Good < 0.75 | 33 |
Table 3.
Parameters set in Ramsete.
Table 3.
Parameters set in Ramsete.
| Subdivision Level | Time | Time Resolution | Humidity | Temperature |
|---|
| 10 | 2 s | 0.01 s | 50% | 20 °C |
Table 4.
Absorption coefficients of the materials considered in the model of Ponchielli theater of Cremona.
Table 4.
Absorption coefficients of the materials considered in the model of Ponchielli theater of Cremona.
| Materials | Absorption Coefficients—Octave Frequency Bands (Hz) |
|---|
| 125 | 250 | 500 | 1k | 2k | 4k |
|---|
| Wood—Boxes perimetral walls | 0.43 | 0.46 | 0.50 | 0.54 | 0.50 | 0.55 |
| Timber wood—Boxes floor | 0.41 | 0.42 | 0.44 | 0.46 | 0.47 | 0.42 |
| Floating floor—Stalls | 0.33 | 0.37 | 0.42 | 0.45 | 0.55 | 0.58 |
| Floating floor—Stage | 0.43 | 0.47 | 0.52 | 0.55 | 0.65 | 0.65 |
| Light Wood—Ceiling | 0.73 | 0.68 | 0.61 | 0.51 | 0.48 | 0.42 |
| Upholstery—Seats | 0.51 | 0.64 | 0.71 | 0.73 | 0.76 | 0.80 |
| Doors | 0.31 | 0.12 | 0.32 | 0.32 | 0.32 | 0.30 |
| Brick–External walls of fly tower | 0.08 | 0.07 | 0.05 | 0.04 | 0.06 | 0.04 |
Table 5.
Scattering coefficients of the materials considered in the model of Ponchielli theater of Cremona.
Table 5.
Scattering coefficients of the materials considered in the model of Ponchielli theater of Cremona.
| Materials | Scattering Coefficients—Octave Frequency Bands (Hz) |
|---|
| 125 | 250 | 500 | 1k | 2k | 4k |
|---|
| Wood—Boxes perimetral walls | 0.55 | 0.50 | 0.40 | 0.30 | 0.20 | 0.15 |
| Timber wood—Boxes floor | 0.55 | 0.50 | 0.40 | 0.30 | 0.20 | 0.15 |
| Floating floor—Stalls | 0.25 | 0.20 | 0.15 | 0.10 | 0.05 | 0.05 |
| Floating floor—Stage | 0.20 | 0.15 | 0.10 | 0.05 | 0.05 | 0.05 |
| Light Wood—Ceiling | 0.20 | 0.15 | 0.10 | 0.05 | 0.05 | 0.05 |
| Upholstery—Seats | 0.40 | 0.30 | 0.25 | 0.20 | 0.15 | 0.15 |
| Doors | 0.10 | 0.08 | 0.05 | 0.05 | 0.05 | 0.05 |
| Brick–External walls of fly tower | 0.60 | 0.53 | 0.42 | 0.35 | 0.28 | 0.17 |
Table 6.
Absorption coefficients of the audience considered in the model of Ponchielli theater of Cremona.
Table 6.
Absorption coefficients of the audience considered in the model of Ponchielli theater of Cremona.
| Materials | Absorption Coefficients—Octave Frequency Bands (Hz) |
|---|
| 125 | 250 | 500 | 1k | 2k | 4k |
|---|
| Audience | 0.65 | 0.66 | 0.80 | 0.88 | 0.83 | 0.70 |
Table 7.
Architectural features of some other Italian Opera theaters characterized by a horseshoe-shaped plan.
Table 7.
Architectural features of some other Italian Opera theaters characterized by a horseshoe-shaped plan.
| | Architectural Item | MF | DN | VS | PC |
|---|
| Main Hall | Total capacity (No. of seats) | 520 | 600 | 650 | 800 |
| Major axis (m) | 15.4 | 13.4 | 14.8 | 21 |
| Minor axis (m) | 13.4 | 13.5 | 13.7 | 16 |
| Height (m) | 14.5 | 15 | 15.4 | 13.8 |
| Volume (m3) | 2330 | 5300 | 4466 | 3600 |
| Scenic Building | Length (m) | 20 | 13.1 | 20.2 | 32 |
| Width (m) | 12 | 15.9 | 22 | 25 |
| Height up to the grid (m) | 20 | 13.9 | 15 | 15 |
| Volume (m3) | 4760 | 2900 | 6696 | 6570 |
| Main Hall + Scenic Building | Volume (m3) | 7090 | 8200 | 11,162 | 10,170 |
| Disclaimer/Publisher’s Note: The statements, opinions and data contained in all publications are solely those of the individual author(s) and contributor(s) and not of MDPI and/or the editor(s). MDPI and/or the editor(s) disclaim responsibility for any injury to people or property resulting from any ideas, methods, instructions or products referred to in the content. |
© 2023 by the authors. Licensee MDPI, Basel, Switzerland. This article is an open access article distributed under the terms and conditions of the Creative Commons Attribution (CC BY) license (https://creativecommons.org/licenses/by/4.0/).


