Article

Research on Multi-Scale Feature Extraction and Working Condition Classification Algorithm of Lead-Zinc Ore Flotation Foam

1
School of Mechanical Electronic & Information Engineering, China University of Mining and Technology-Beijing, Beijing 100083, China
2
Energy Storage Technology Engineering Research Center, North China University of Technology, Beijing 100144, China
3
Guangxi China Tin Group Co., Ltd., Liuzhou 545006, China
*
Author to whom correspondence should be addressed.
Appl. Sci. 2023, 13(6), 4028; https://doi.org/10.3390/app13064028
Submission received: 28 February 2023 / Revised: 18 March 2023 / Accepted: 19 March 2023 / Published: 22 March 2023

Abstract

:
To address the problems of difficult online monitoring, low recognition efficiency and the subjectivity of work condition identification in mineral flotation processes, a foam flotation performance state recognition method is developed to improve the issues mentioned above. This method combines multi-dimensional CNN (convolutional neural networks) characteristics and improved LBP (local binary patterns) characteristics. We have divided the foam flotation conditions into six categories. First, the multi-directional and multi-scale selectivity and anisotropy of nonsubsampled shearlet transform (NSST) are used to decompose the flotation foam images at multiple frequency scales, and a multi-channel CNN network is designed to extract static features from the images at different frequencies. Then, the flotation video image sequences are rotated and dynamic features are extracted by the LBP-TOP (local binary patterns from three orthogonal planes), and the CNN-extracted static picture features are fused with the LBP dynamic video features. Finally, classification decisions are made by a PSO-RVFLNs (particle swarm optimization-random vector functional link networks) algorithm to accurately identify the foam flotation performance states. Experimental results show that the detection accuracy of the new method is significantly improved by 4.97% and 6.55%, respectively, compared to the single CNN algorithm and the traditional LBP algorithm, respectively. The accuracy of flotation performance state classification was as high as 95.17%, and the method reduced manual intervention, thus improving production efficiency.

1. Introduction

Flotation is one of the main methods for industrial mineral extraction, which functions by using different hydrophilic/hydrophobic properties on the surfaces of mineral particles. One of the main factors affecting the performance of flotation is the dosage of reagent, and the dosage can be decided only after accurate judgment of the dosage status. Researchers have found that the characteristics of the flotation cell surface foam are closely related to the flotation conditions and characteristics of the production process [1,2]. Accurate characterization of foam is essential to optimize the flotation process.
At present, the determination of optimum flotation performance by foam characteristics is mainly carried out by experienced engineers and technicians, who may suffer from difficulties in online detection, low recognition efficiency, and subjective or lack of uniform judgment. Therefore, it is of great significance to develop an intelligent performance state identification method for optimizing flotation control and improving flotation process efficiency. The role of foam in flotation is crucial. The textural characteristics of the foam surface reflect the concentration of the mineral; the size of the foam reflects the possibility of adhesion between the mineral particles and the foam, and the smaller the foam, the greater the possibility of the useful minerals being adhered. The color of the foam also reflects the information of the mineral [3,4]. The traditional flotation condition recognition method mainly extracts features such as color, size, shape and speed of the foam surface [5], and then inputs the extracted features into the classification for condition recognition; however, such methods are not stable in feature extraction, and the features extracted from images of different quality differ, so they have a large impact on recognition accuracy and are not robust. CNN can be driven directly from the image set between features and targets, and can perform deep learning to extract image features efficiently [6]. Therefore, CNN has been introduced into the foam flotation process recognition. Fu et al. [7,8] firstly applied CNN to the feature extraction of flotation foam and the prediction classification of fine ore, which greatly improved the recognition accuracy compared with the traditional flotation condition identification method. Morar et al. [9] proposed a machine vision technology to accurately measure the lamellar rupture rate on the foam surface. Wang et al. [10] segmented the foam image then extracted the features of the segmented bubble image through CNN, and identified the working conditions by counting the frequency distribution of various bubbles. These methods extracted the features of a single image and ignored the local details of multi-scale image features, so their recognition efficiency was low. Liao et al. [11] proposed a mode recognition method utilizing bimodal CNN feature extraction and self-adaptive transfer learning based on AlexNet model. The authors optimized the model’s parameters by using an improved quantum Wolf pack algorithm. Li et al. [12] proposed a transfer learning method based on CNN, and adopted SVM to generate an automatic recognition model. Chen et al. [13] proposed a method to identify antimony flotation performance states based on a lightweight convolution vision transformer, and introduced a lightweight convolution neural network module and sub-module of lightweight neural network ModileNetv2 which could better capture flotation foam characteristics. Although the above methods use a convolutional neural network to extract rich foam detailed texture features, they ignore the correlation between each individual foam. In addition, the correlation measure between each pixel and the points in its surrounding neighbors in the whole image is not reflected. Meanwhile, feature extraction using CNN is incomplete and ignores the influence of high-frequency features. In recent years, the development of the multi-scale geometric analysis method has provided a new idea for image edge detection. The NSST not only has the features of multi-scale, multi directional capabilities, translation fidelity, and anisotropic characteristics, but also has high computational efficiency and unlimited decomposition methods. It can be applied to inhomogeneous foam distribution and boundary detection of different thicknesses. It can also reduce the noise level.
To address the above problems, this paper proposes a method of PSO-RVFLNS foam flotation condition recognition method combining CNN and LBP-TOP features. To avoid the problem of incomplete feature extraction of single scale image, this paper constructs NSST-CNN feature extraction network which dissects foam images into different frequencies and scales using NSST, and then uses a multi-channel CNN to extract static features such as contours and details of images with different frequency scales. An LBP-TOP algorithm is used to process the original video and to extract time–frequency dynamic features which reflect the motion trends and interactions between different foams. The desired LBP features are fused with CNN features in series to make up for the lack of dynamics of the features proposed by CNN. Finally, the classification decision is made by random weight neural network of particle swarm optimization. The flotation dosing state can be accurately identified.

2. Materials and Methods

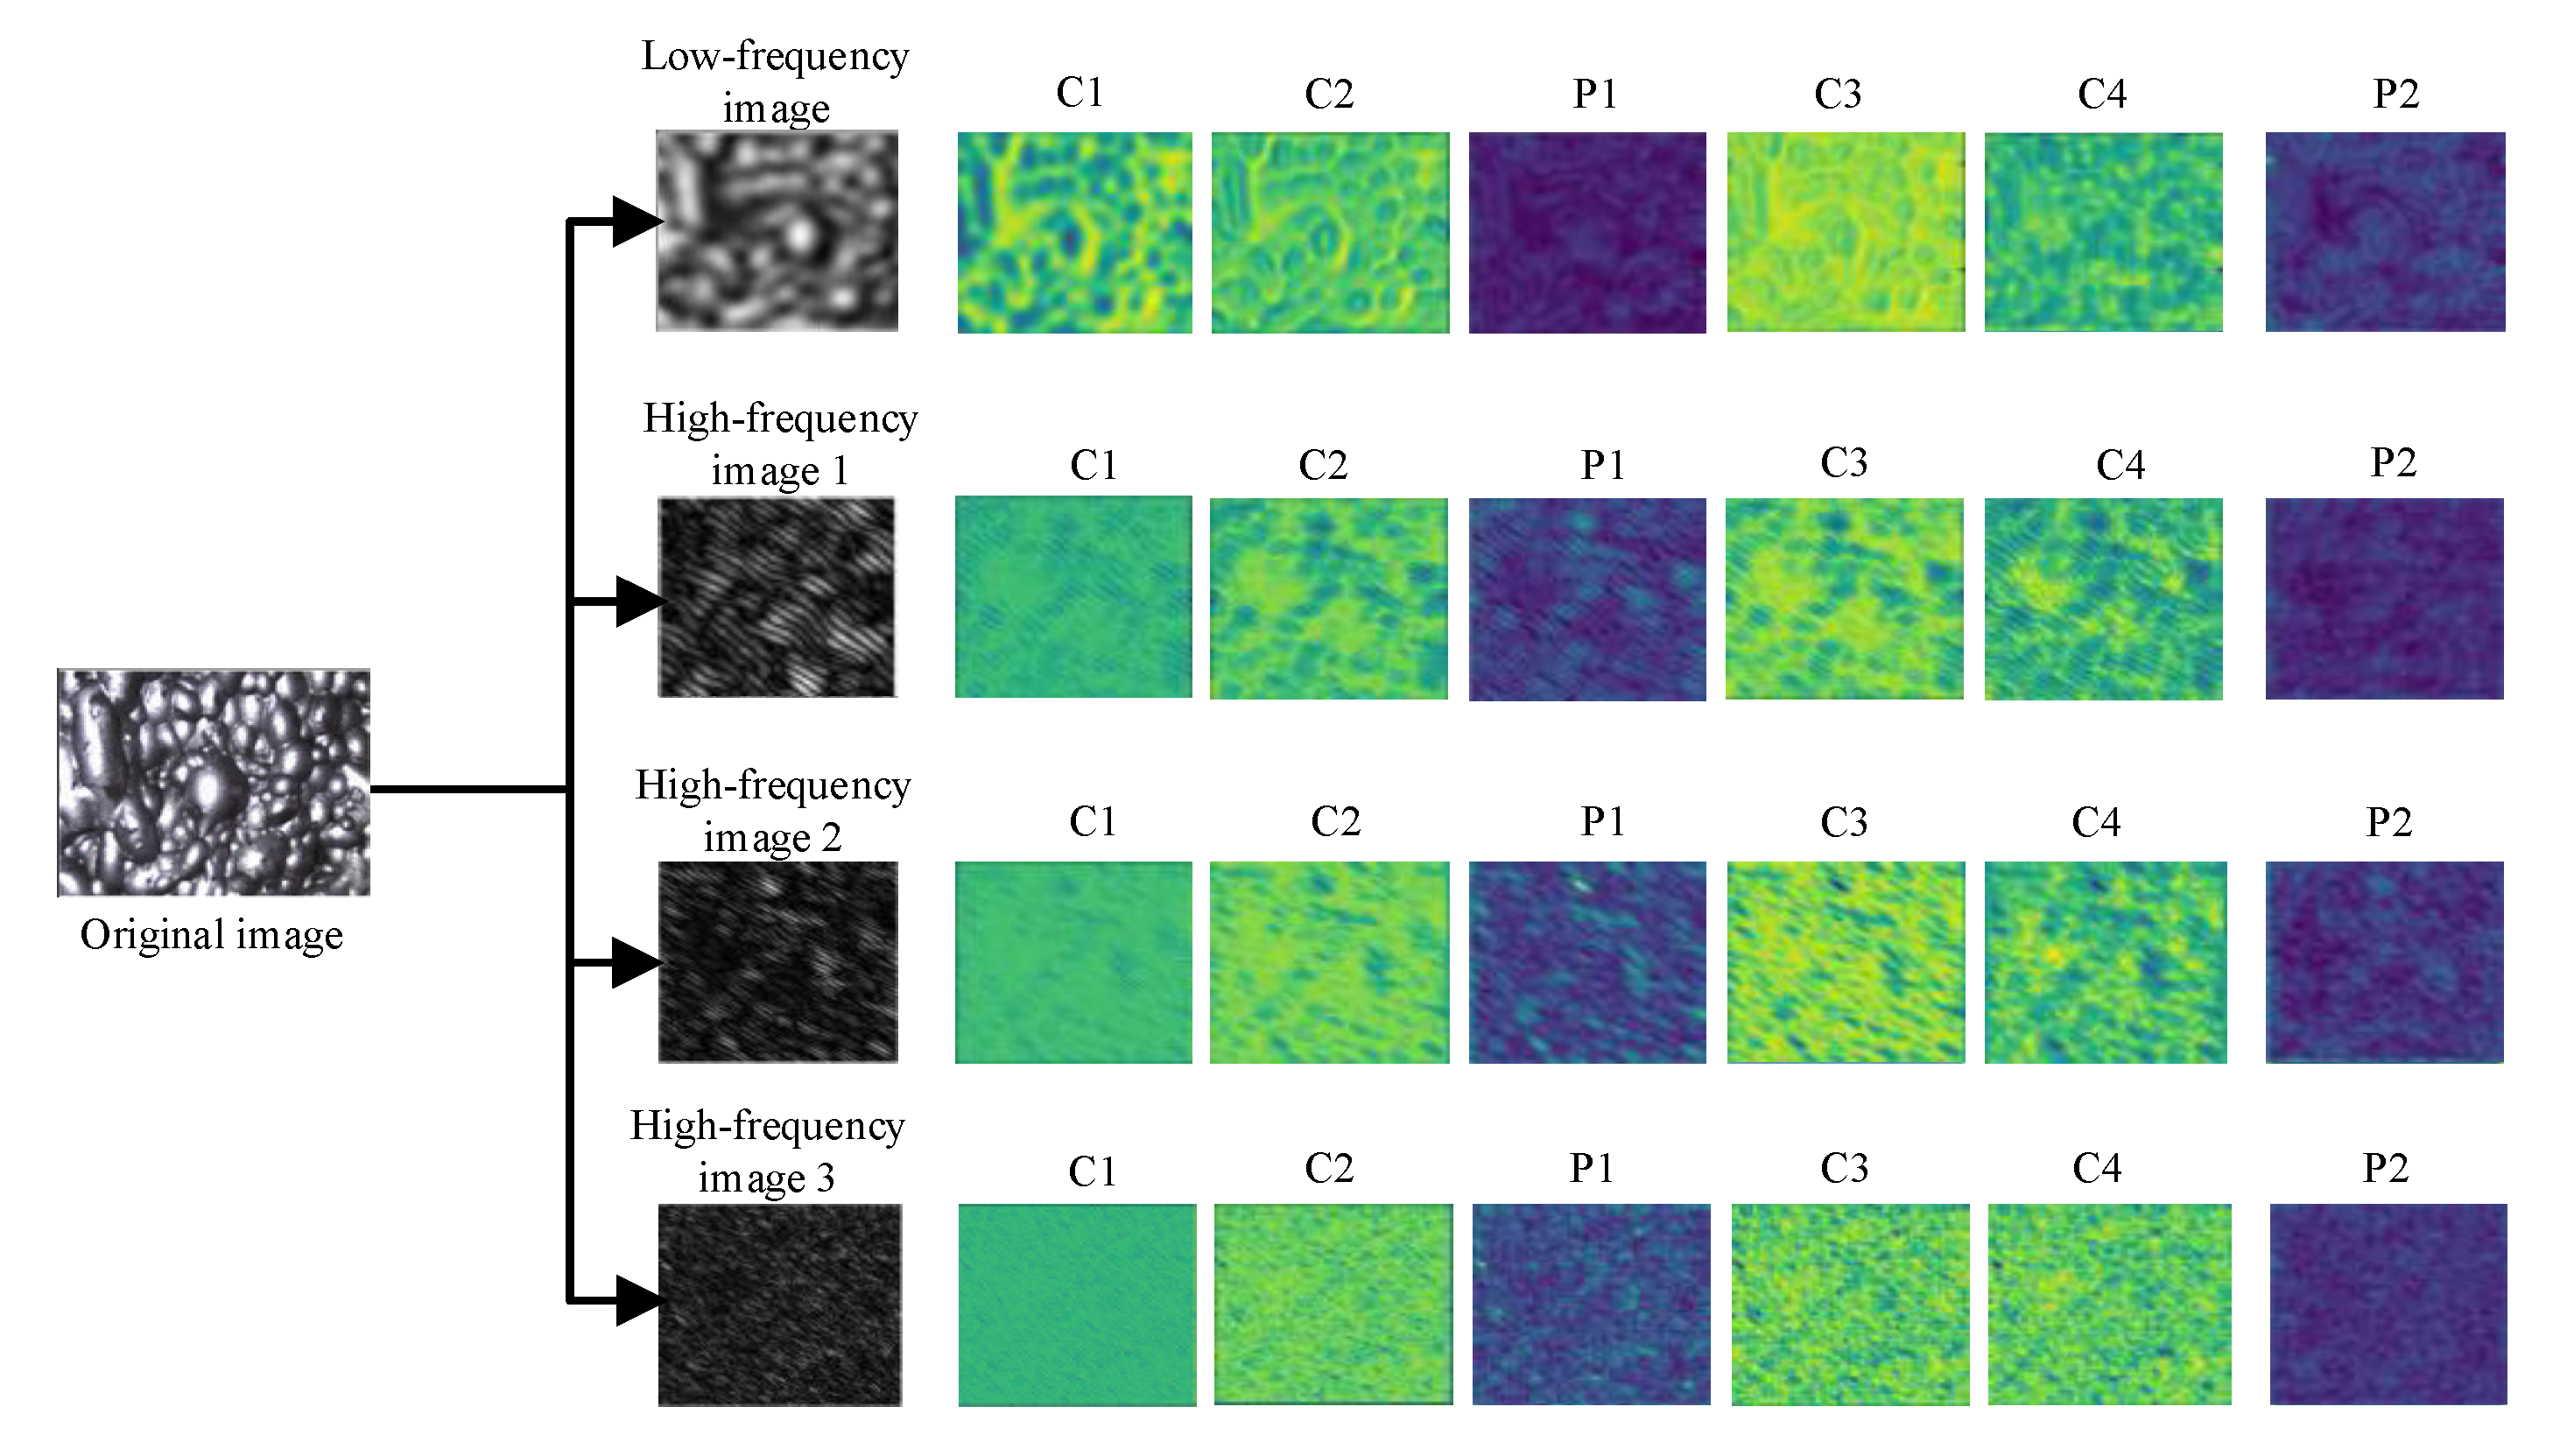
2.1. Multi-Scale NSST-CNN Feature Extraction

Through the analysis and study of a large number of foam images and the comparison of foam morphology characteristics under different process performance states, the performance states can be roughly divided into six categories, as shown in Figure 1. The first type has a medium flotation bubble size, near uniform distribution, clear foam profile, the best flotation performance, and the highest flotation production efficiency. The second type has a large and polygonal foam size, rough texture, uneven size distribution, and a more transparent foam color. In this case, the foam flow rate is fast, the content of valuable minerals carried by the foam is low, and the flotation efficiency is not high, The third type is a foam that carries mineral particles that exceed the foam’s carrying capacity. A large number of bubbles are broken, resulting in a large but unevenly distributed foam that contains more non-target material, resulting in a low grade final concentrate. The fourth type has a low foam volume, large variation in foam size, and severe foam collapse. The fifth type has a foam mineralization extent that is too high; the mineral particles in the foam are oversaturated with high viscosity, the bubbles are broken in large quantities, and the consistency is large. The sixth type has an abnormal condition called the “sinking condition”; in this case, due to some improper operation or equipment issues, the liquid level in the cell is too low, resulting in the camera being unable to focus on the foam and unable to image it well. Therefore, to better identify flotation performance states, this paper constructs an NSST-CNN to extract the shape features of foam images with different scales.

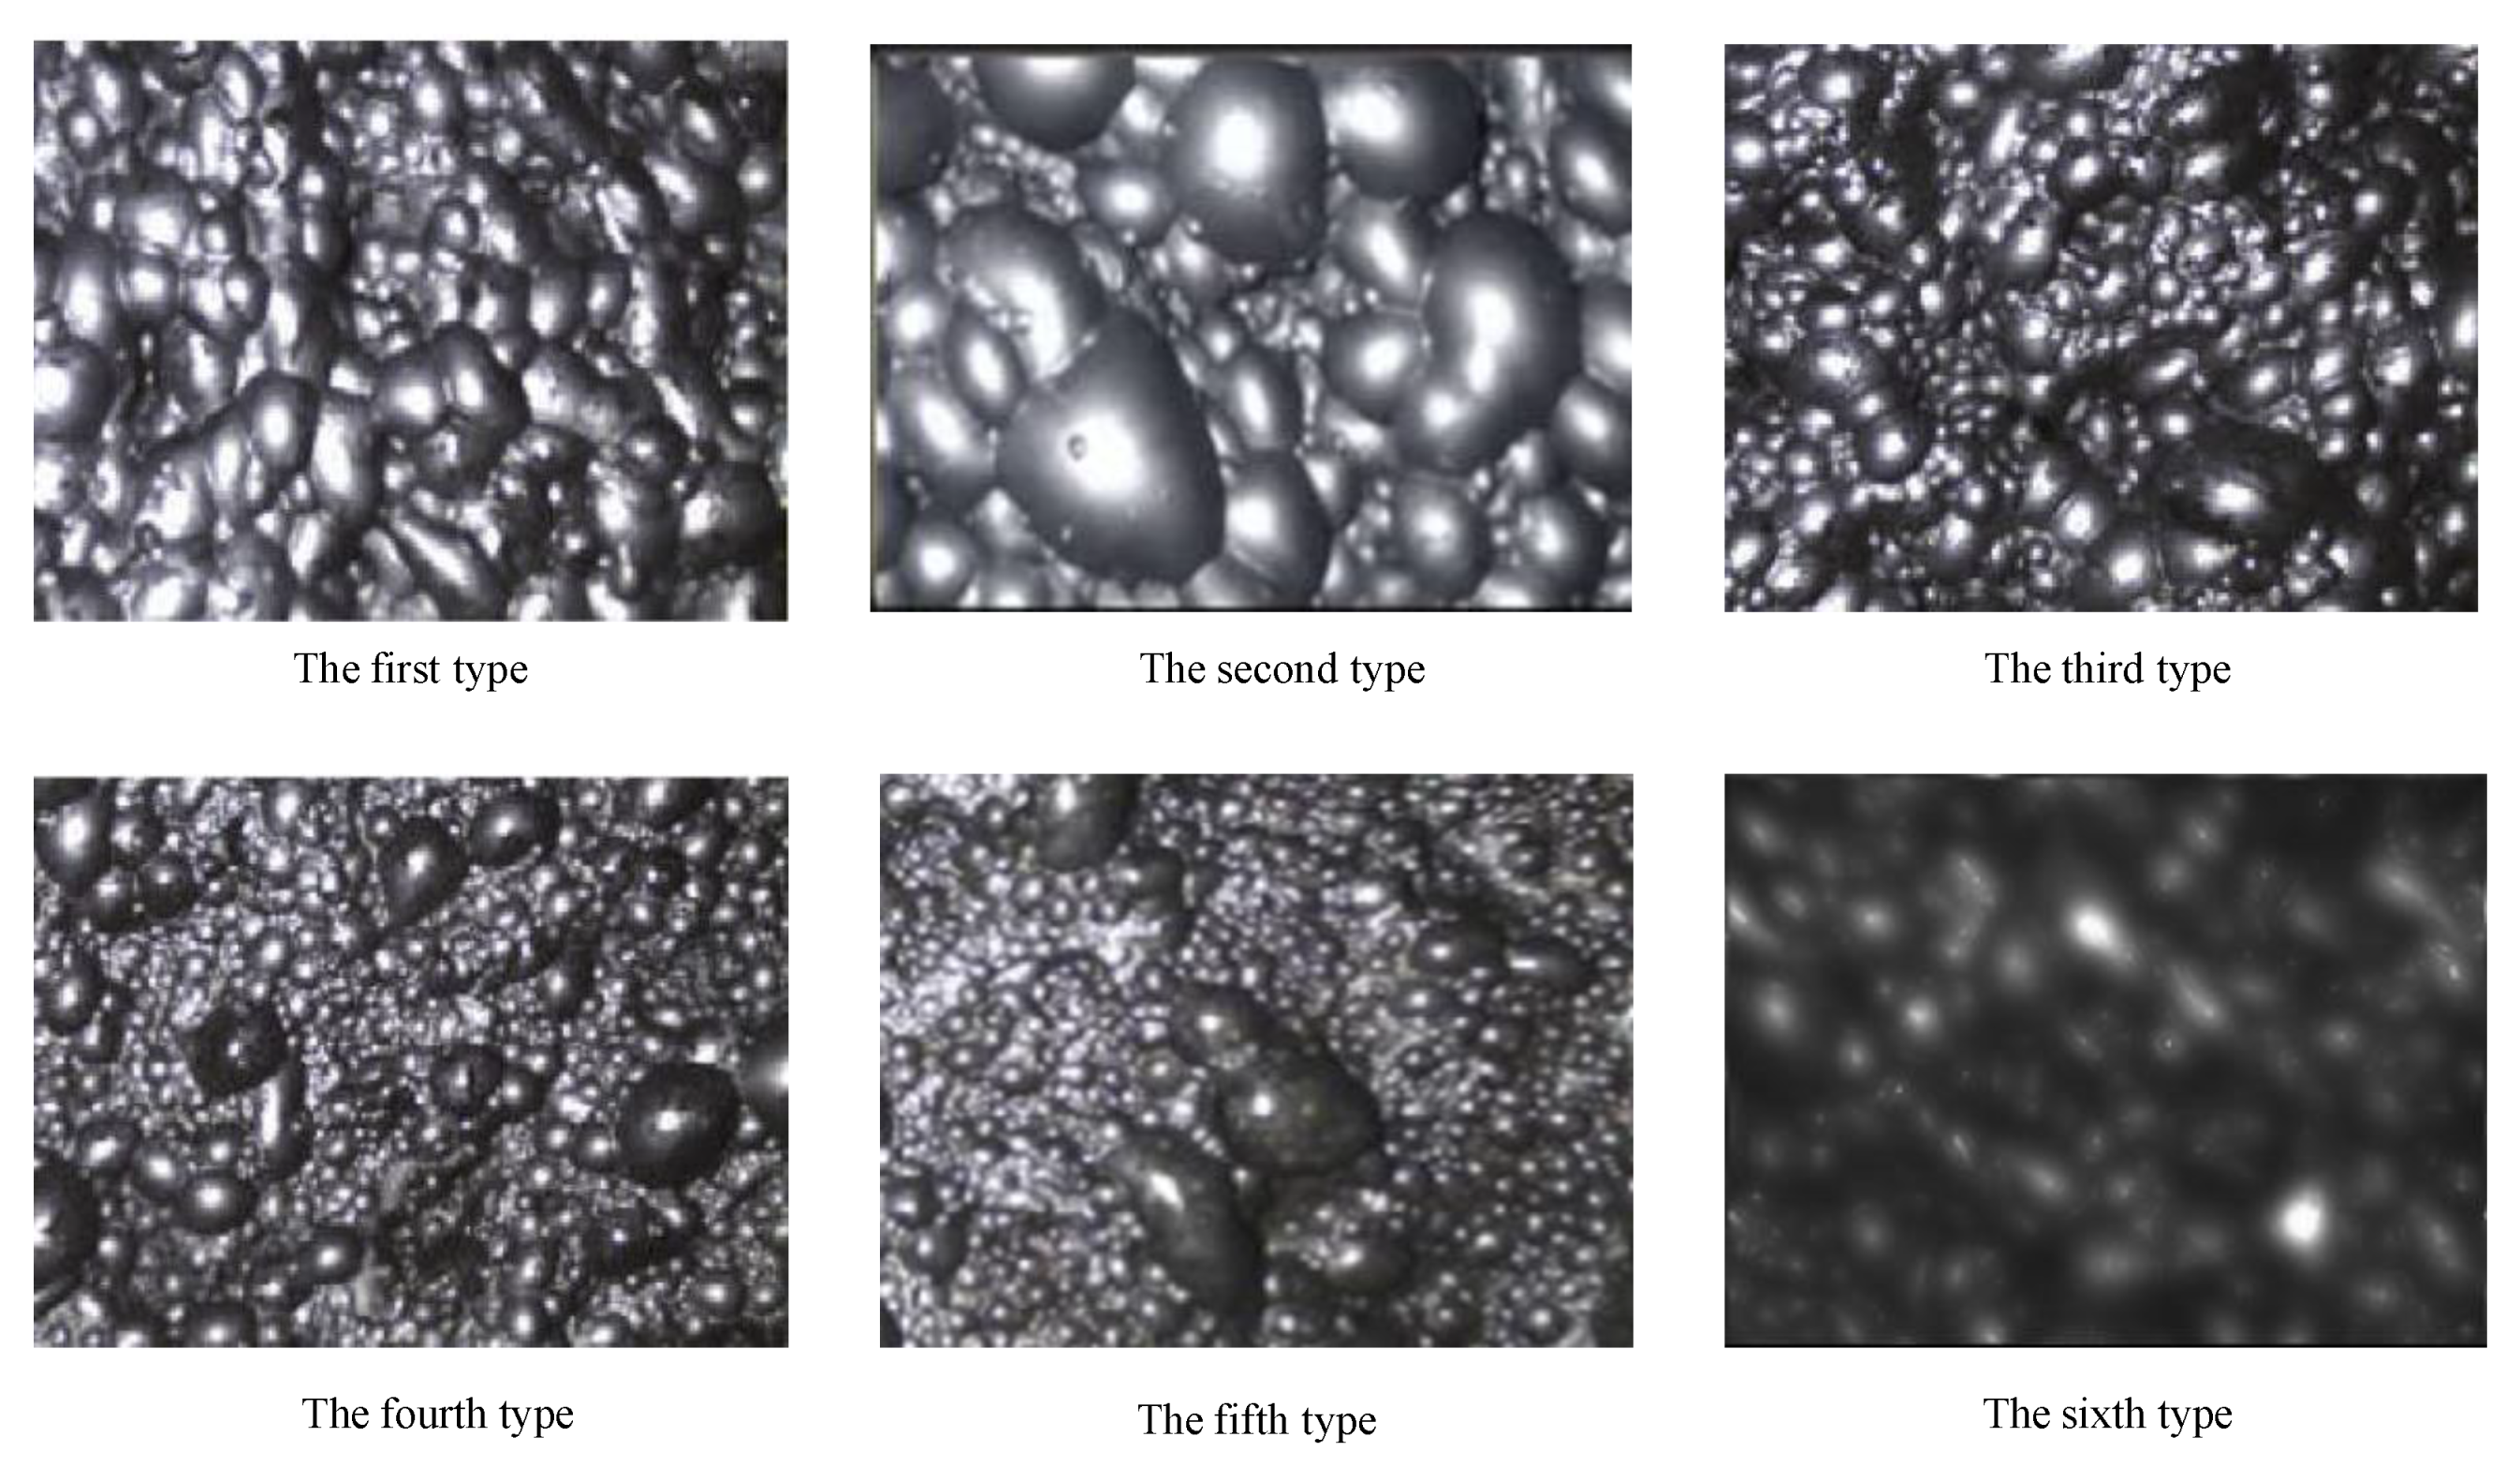
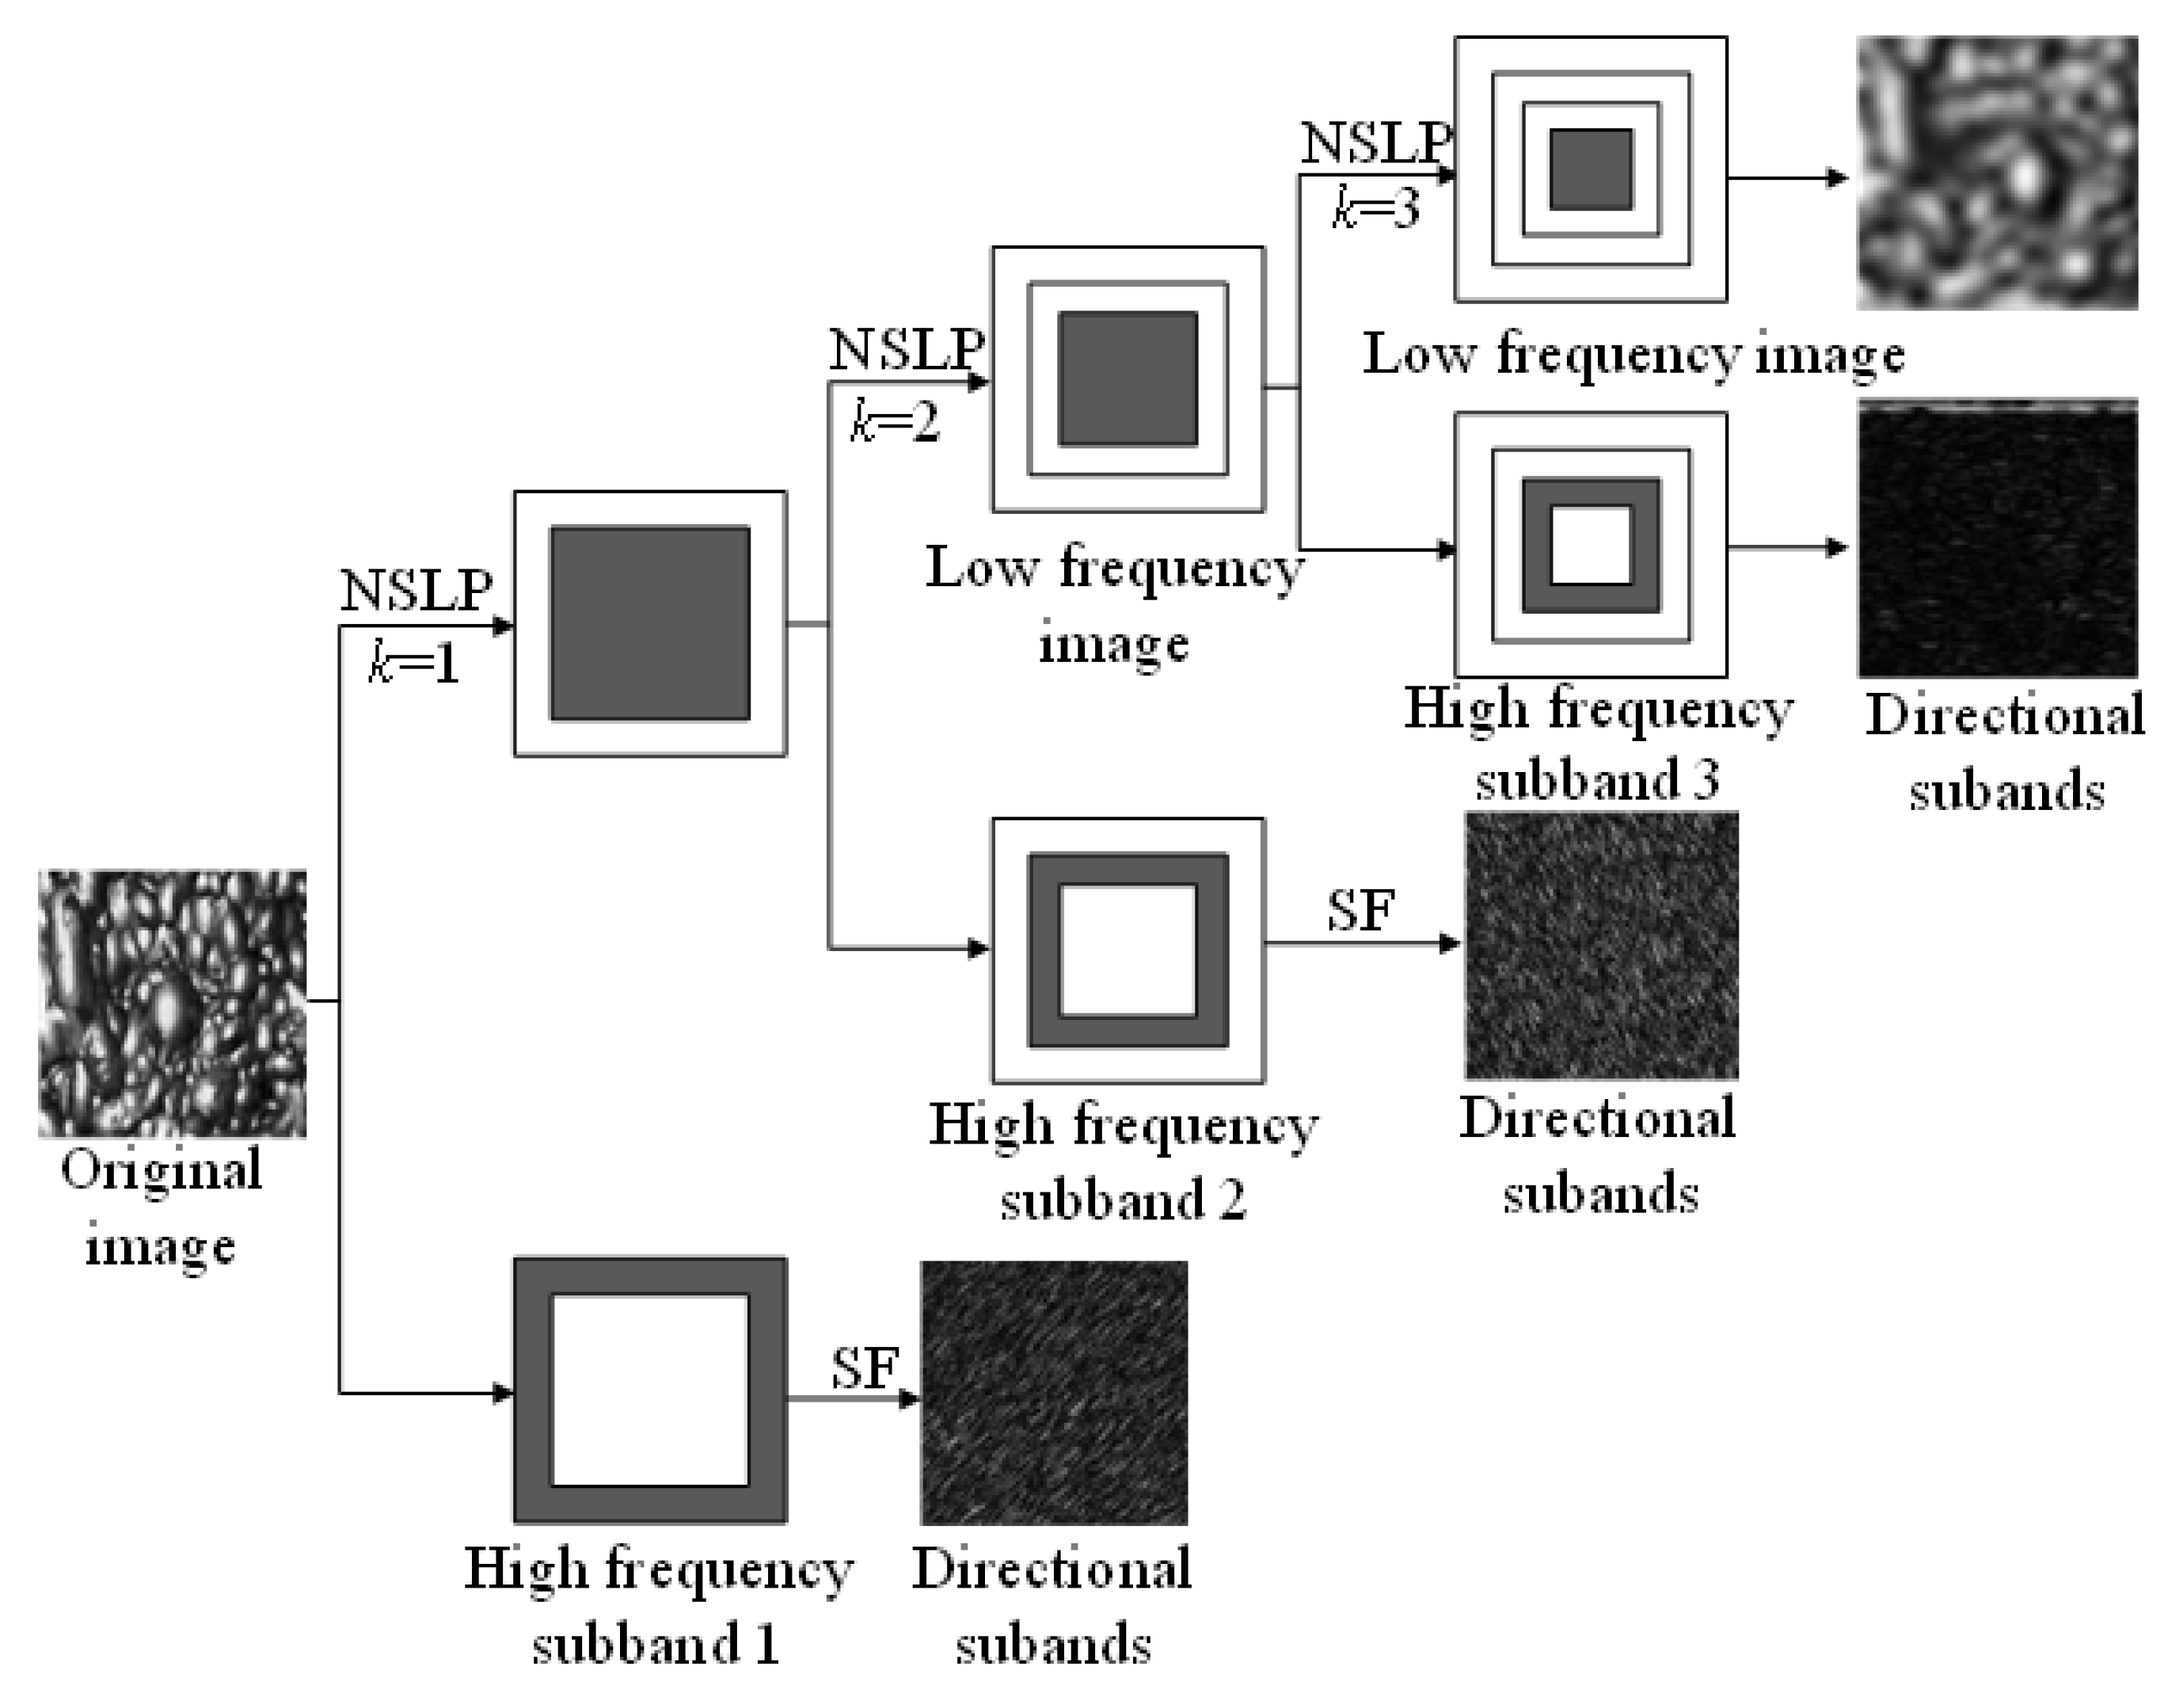
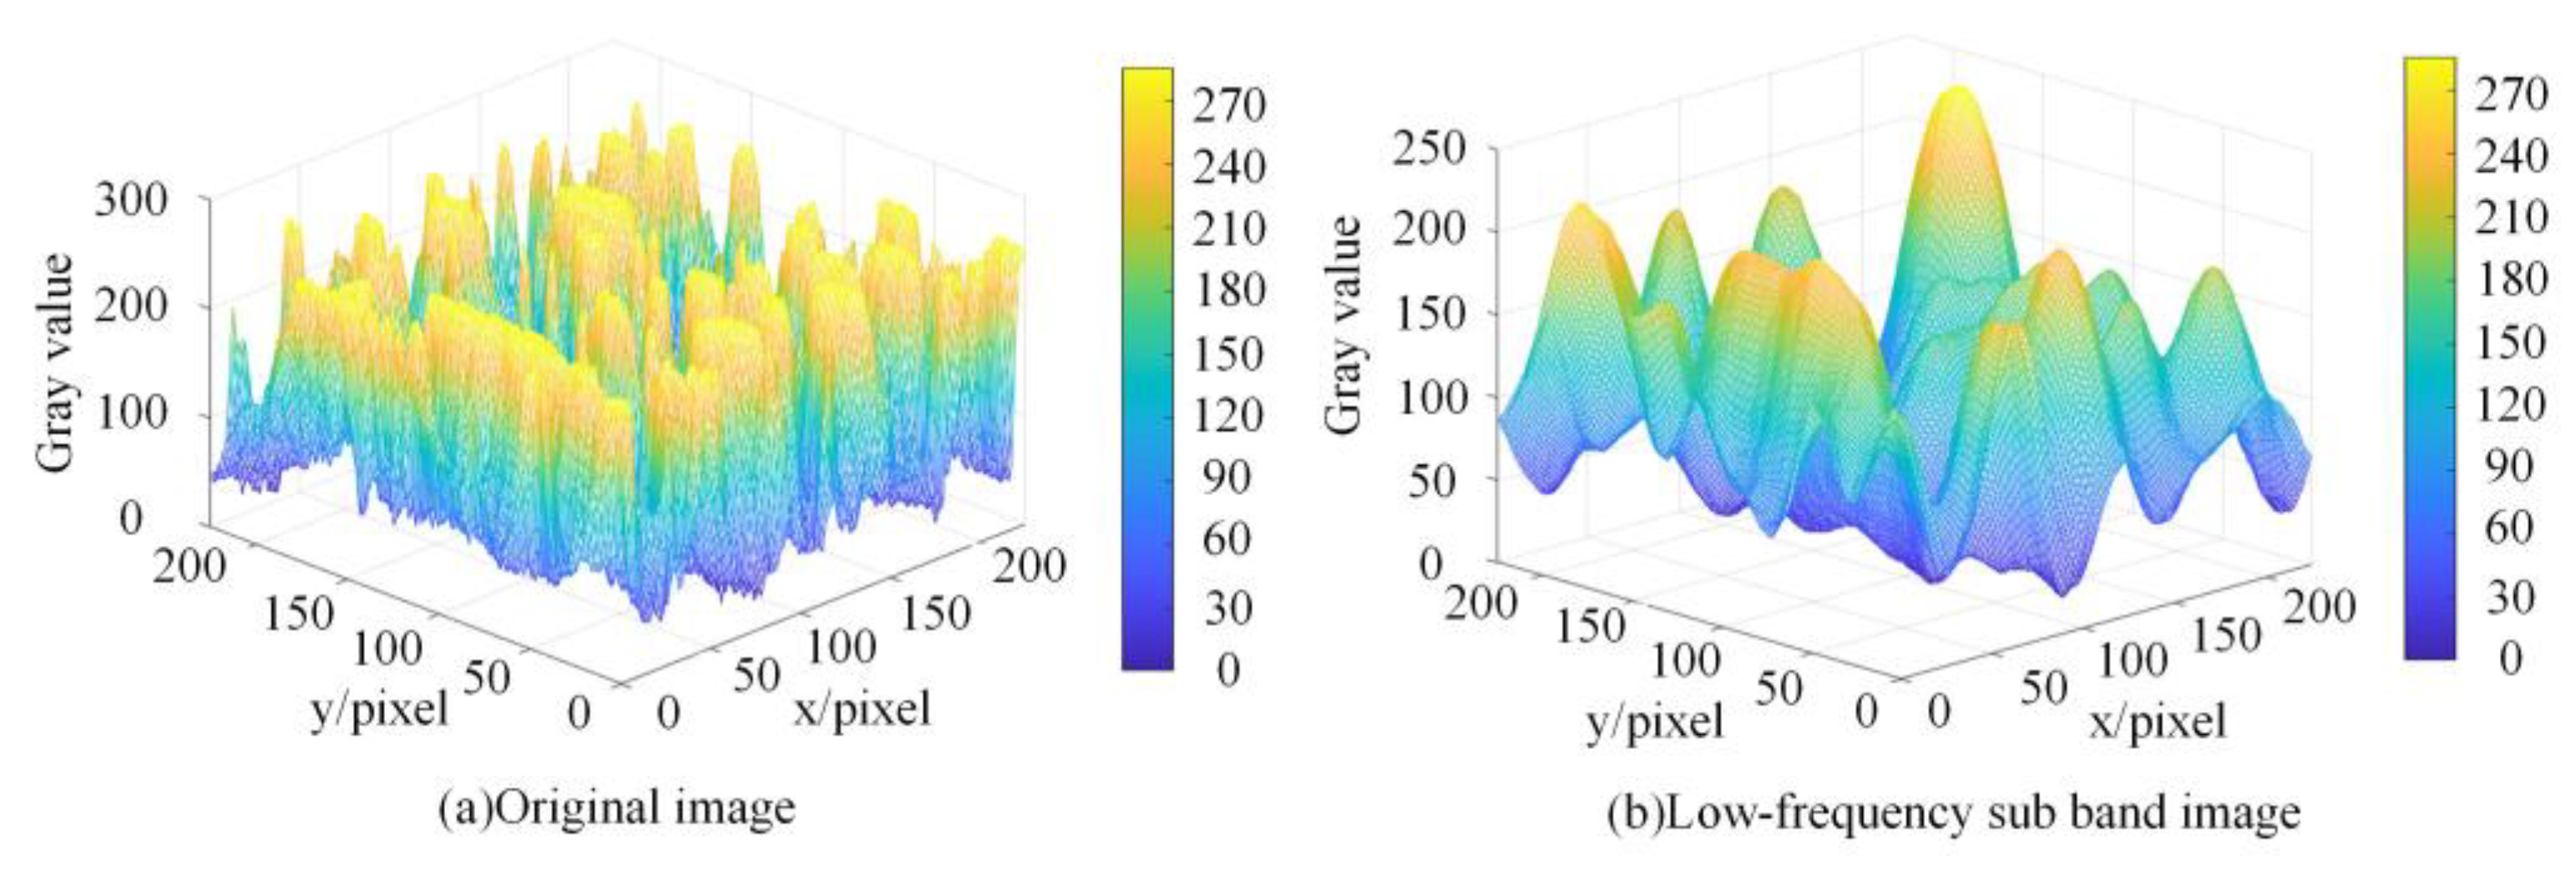
2.1.1. NSST Multi-Scale Dissection of Bubble Images

NSST is an optimization and improvement of shear-wave transform [14], which consists of Laplace transform and a shear-wave filter. It is a multi-scale geometric analysis tool that has emerged in recent years and is characterized by translation invariance, multi-direction, and computational complexity [15,16]. It can obtain sparse representation of images in different directions and scales. The NSST transformation is divided into two steps: ① multi-scale decomposition and ② direction localization. Multi-scale decomposition is accomplished by a non-subsampling pyramid filter bank (NSLP) which ensures translation invariance and suppresses the pseudo-Gibbs phenomenon [17]. After NSLP decomposition, a low-frequency image and K-layer high-frequency sub-band images are obtained, and each high-frequency sub-band image can be decomposed into multiple directional sub-bands; all decomposed images have the same dimensions. The three-level decomposition in the foam image can better separate the high-frequency features of the foam image. Figure 2 shows a 3-level NSST decomposition process. The decomposition in the high-frequency sub-band contains details of foam boundaries, texture, and noise. As can be seen in Figure 3, the low-frequency sub-band image after NSST decomposition retains the approximate features of the original image, and the noise interference of the foam image is effectively reduced.

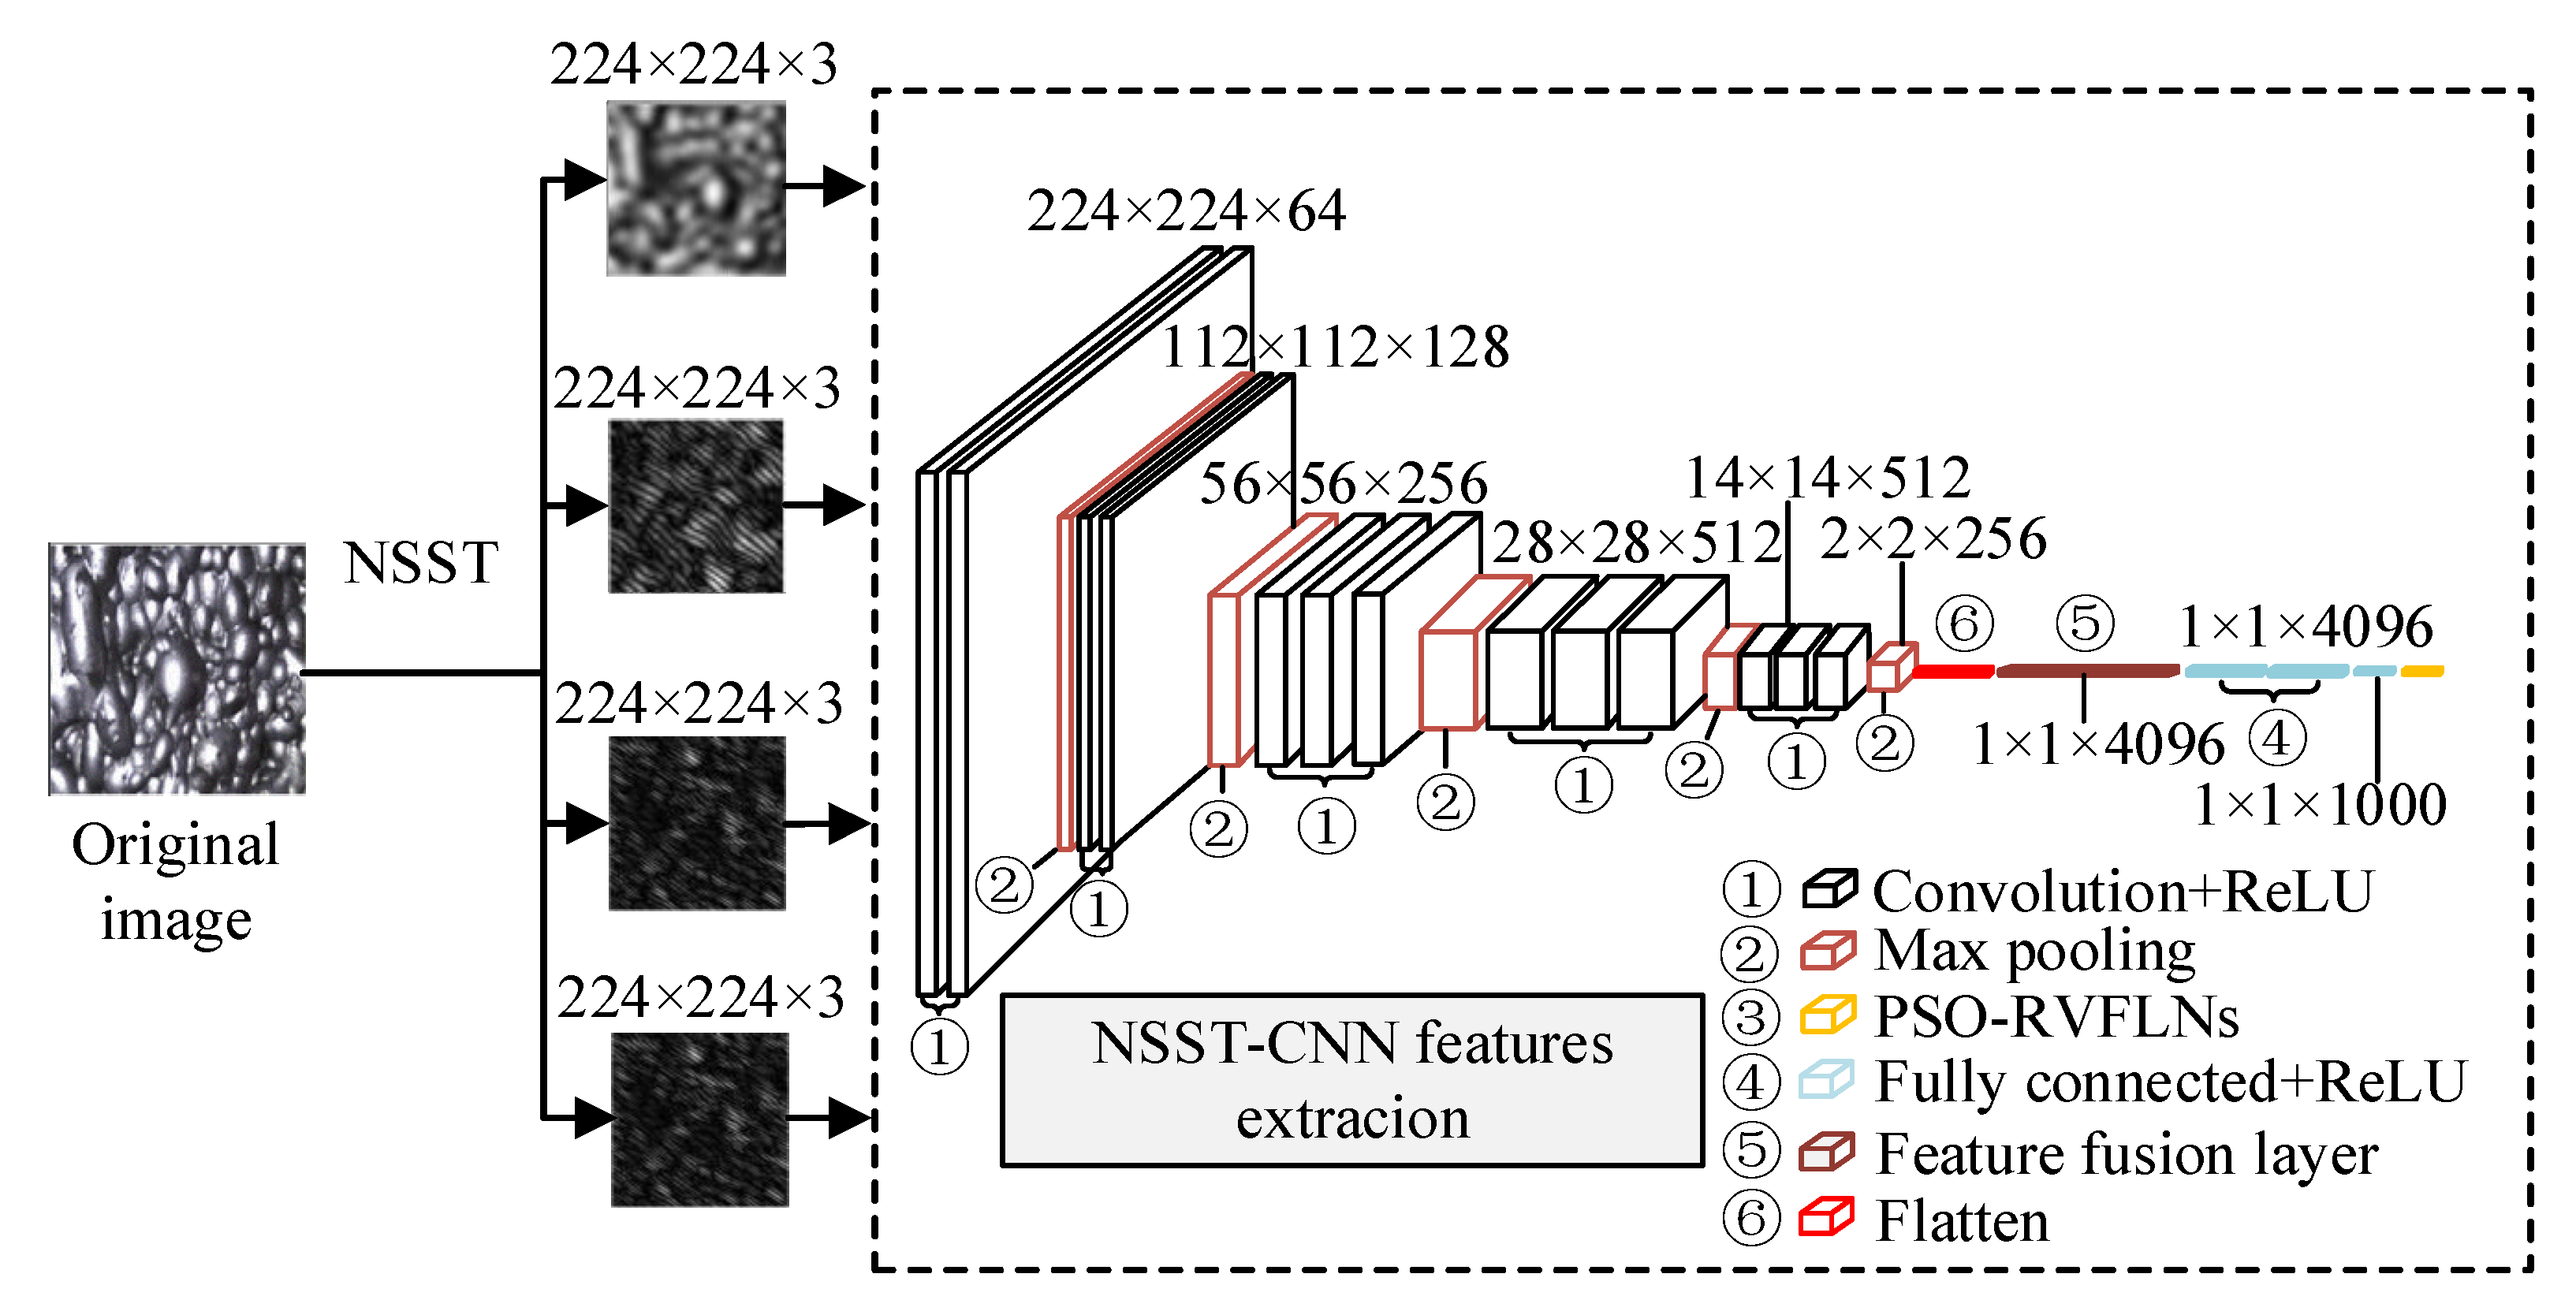
2.1.2. Construction of an NSST-CNN Feature Extraction Network

The CNN is a classical deep neural network model for image processing. Compared to other deep neural networks, they have fewer parameters and faster training speed, so they have a huge advantage in the image field [18]. In this paper, a VGG16 network was selected. The VGG16 network consists of 13 convolutional layers, five pooling layers, and three fully connected layers, of which 16 are network layers containing parameters. After NSST decomposition, the original foam image outputs a multi-scale image with a size of 224 × 224 × 3 which is fed to the CNN network. After a series of convolution and pooling operations, the output size becomes 2 × 2 × 256, and finally a 256-dimensional feature vector is output after a fully connected layer. Compared with the simple and easy to train AlexNet network, the VGG16 not only inherits these features perfectly, but also increases the depth of the network. The VGG16 can produce image features more comprehensively, so it effectively improves the network’s performance [19,20,21]. In this paper, the four frequency sub-bands of the NSST triple decomposition are extracted separately, and then the extracted 1024 × 4 dimensional features are fused, and the fused feature vector is 1 × 4096 dimensional.
Foam flotation condition recognition works by building a convolutional neural network using the NSST processed image for training and testing. After the NSST’s decomposition into multiple scale images, low and high-frequency images can reflect more of the foam image’s multi-scale details and contours, and the characteristic vectors output from each scale are fused in series, which can thereby obtain a high classification accuracy. Figure 4 shows the NSST-CNN network feature extraction model.

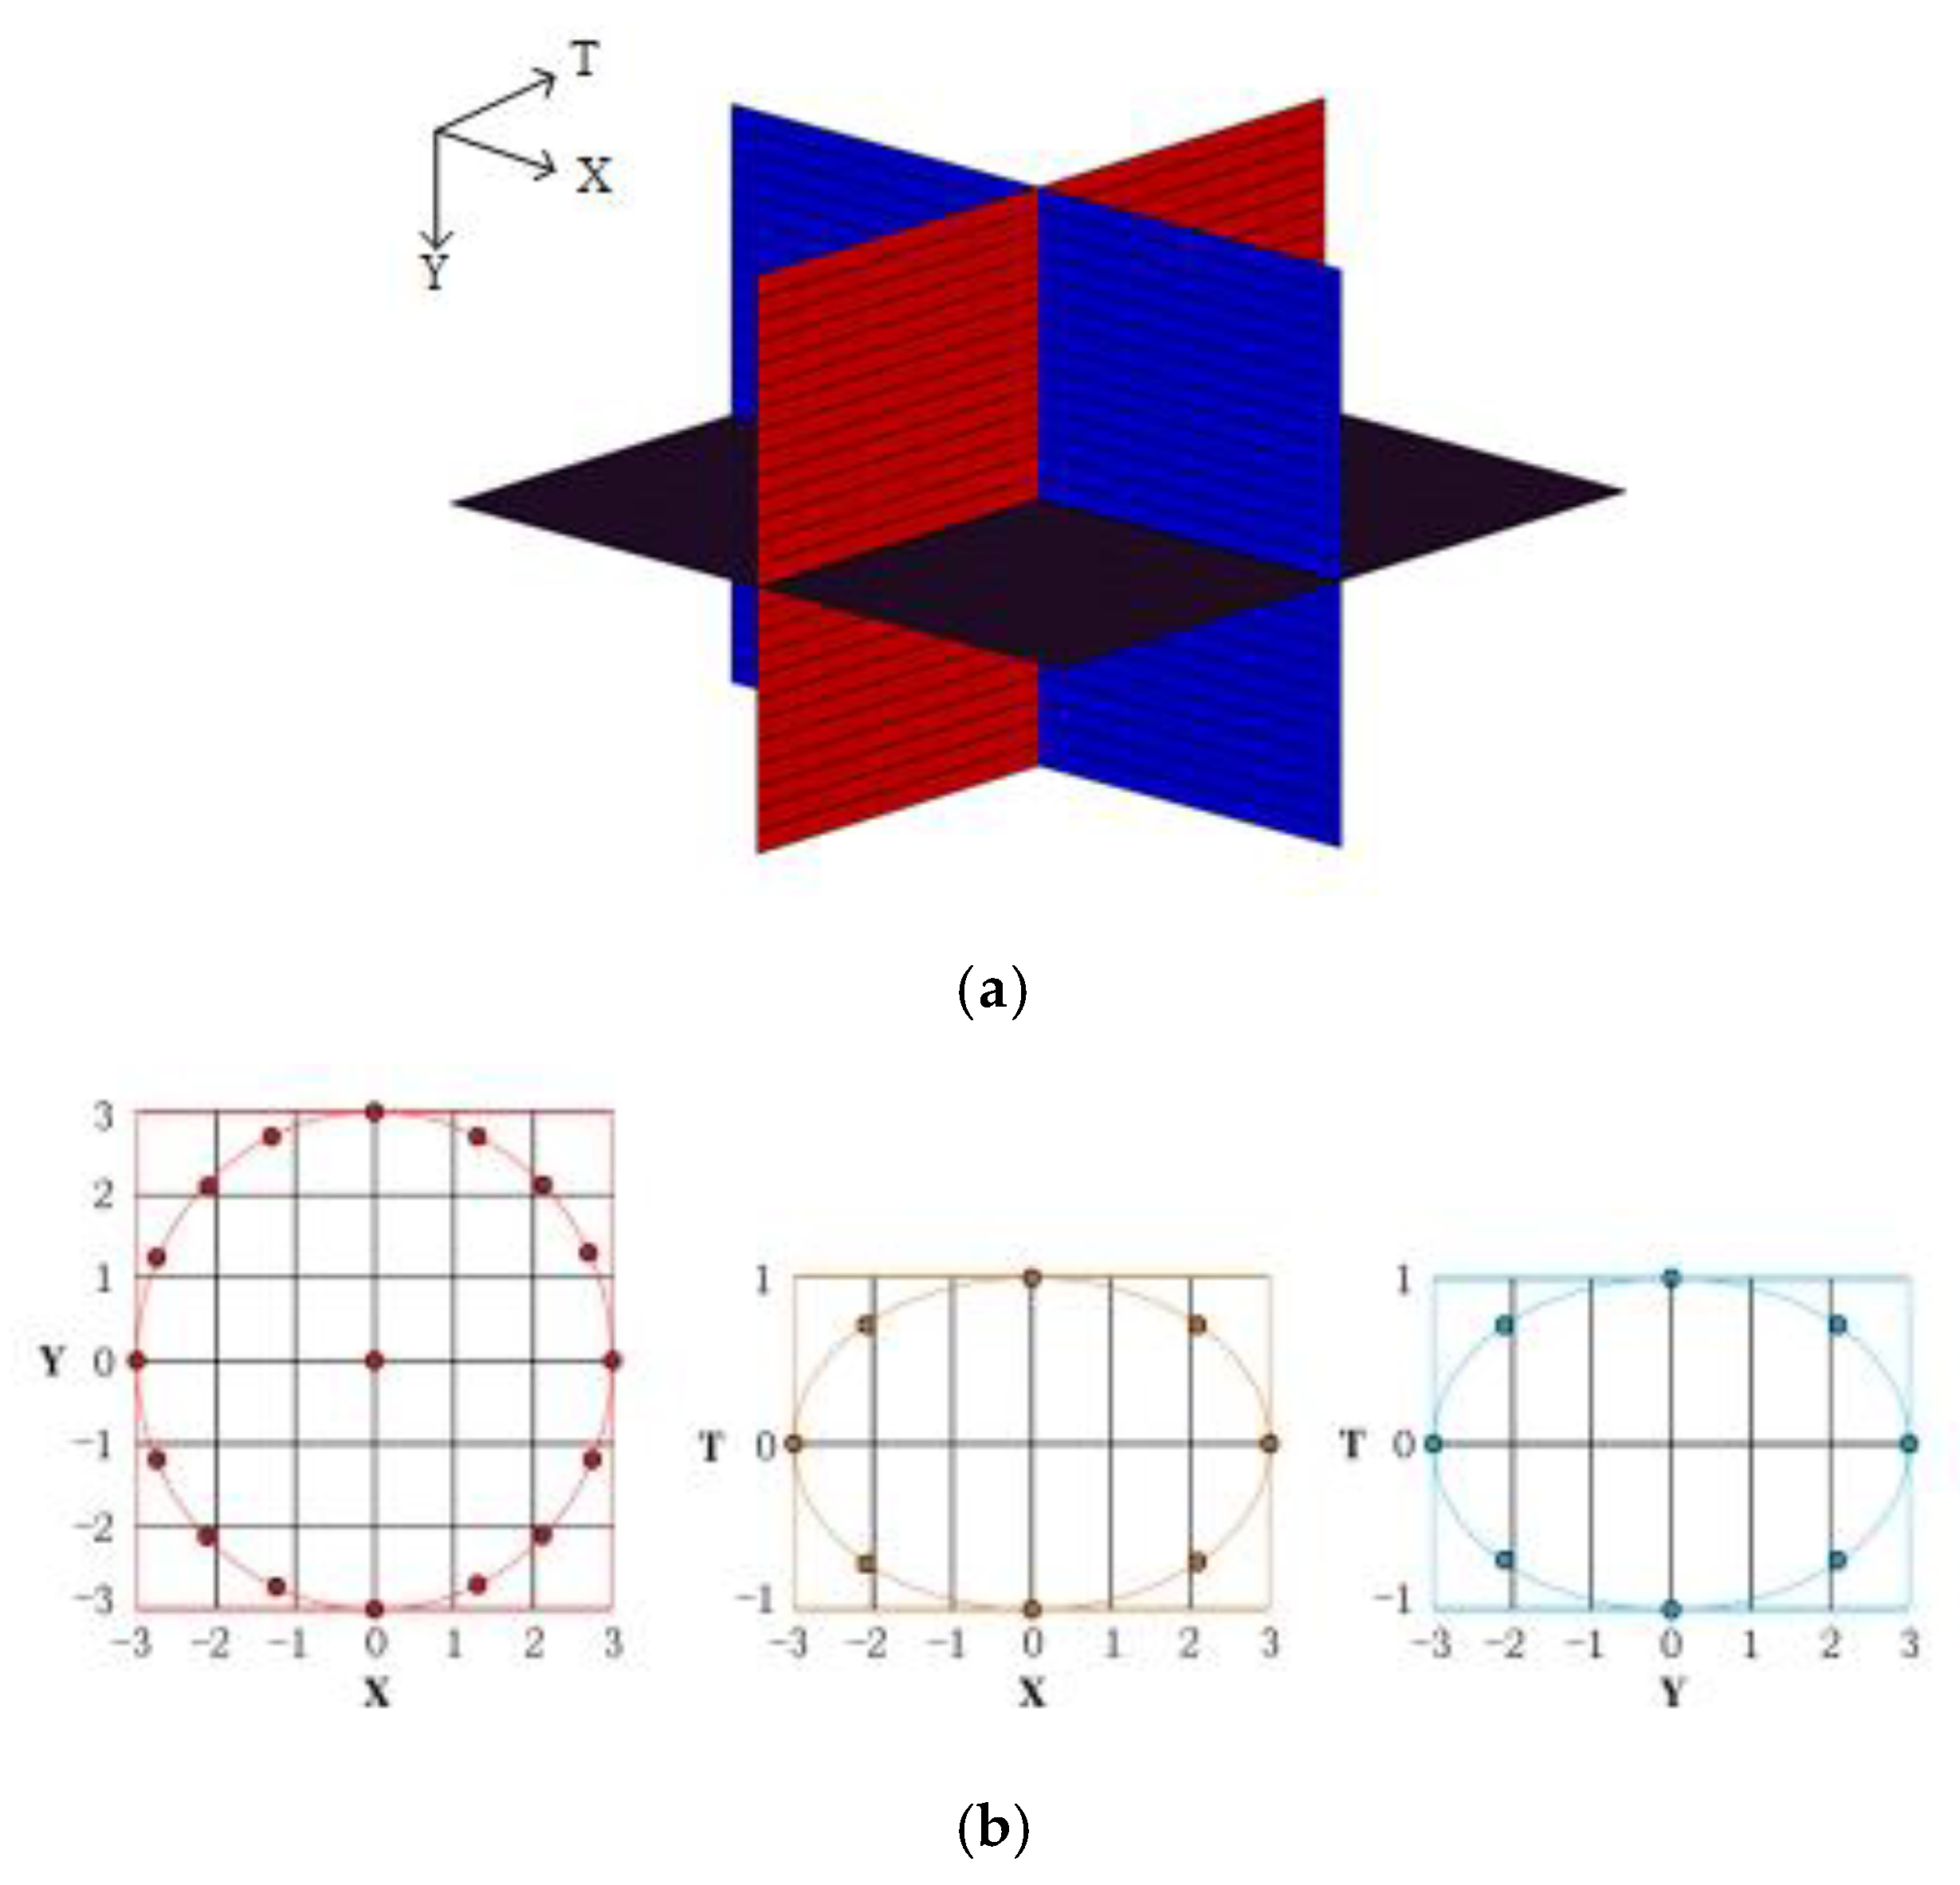
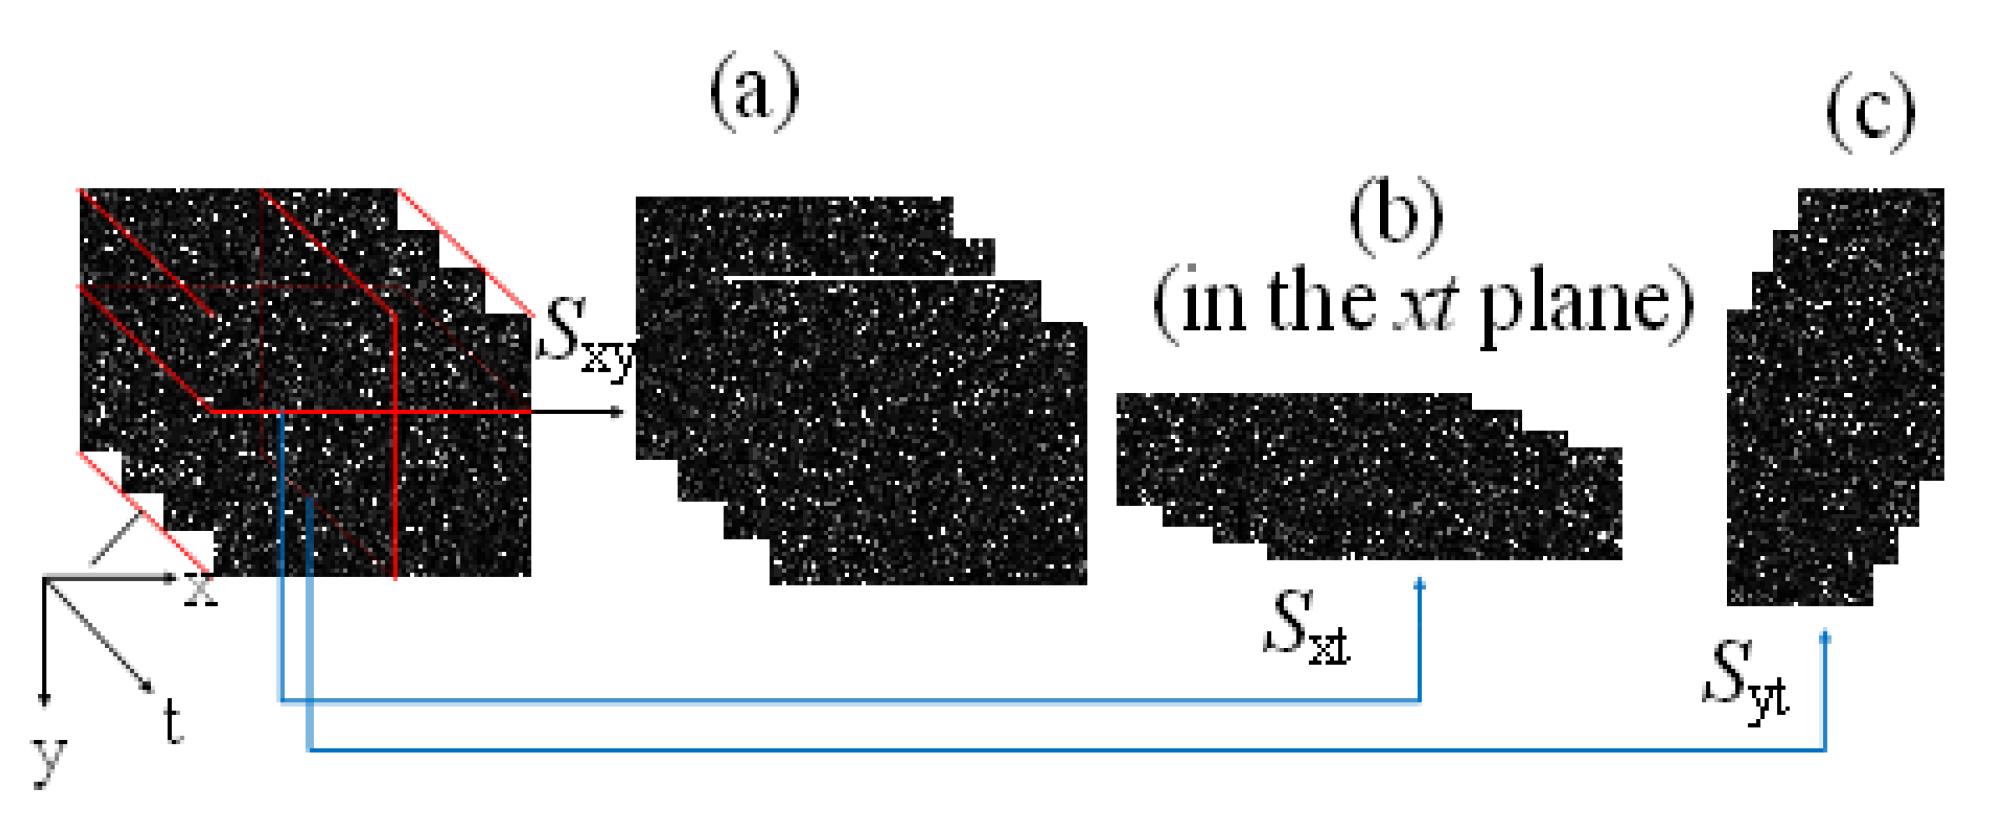
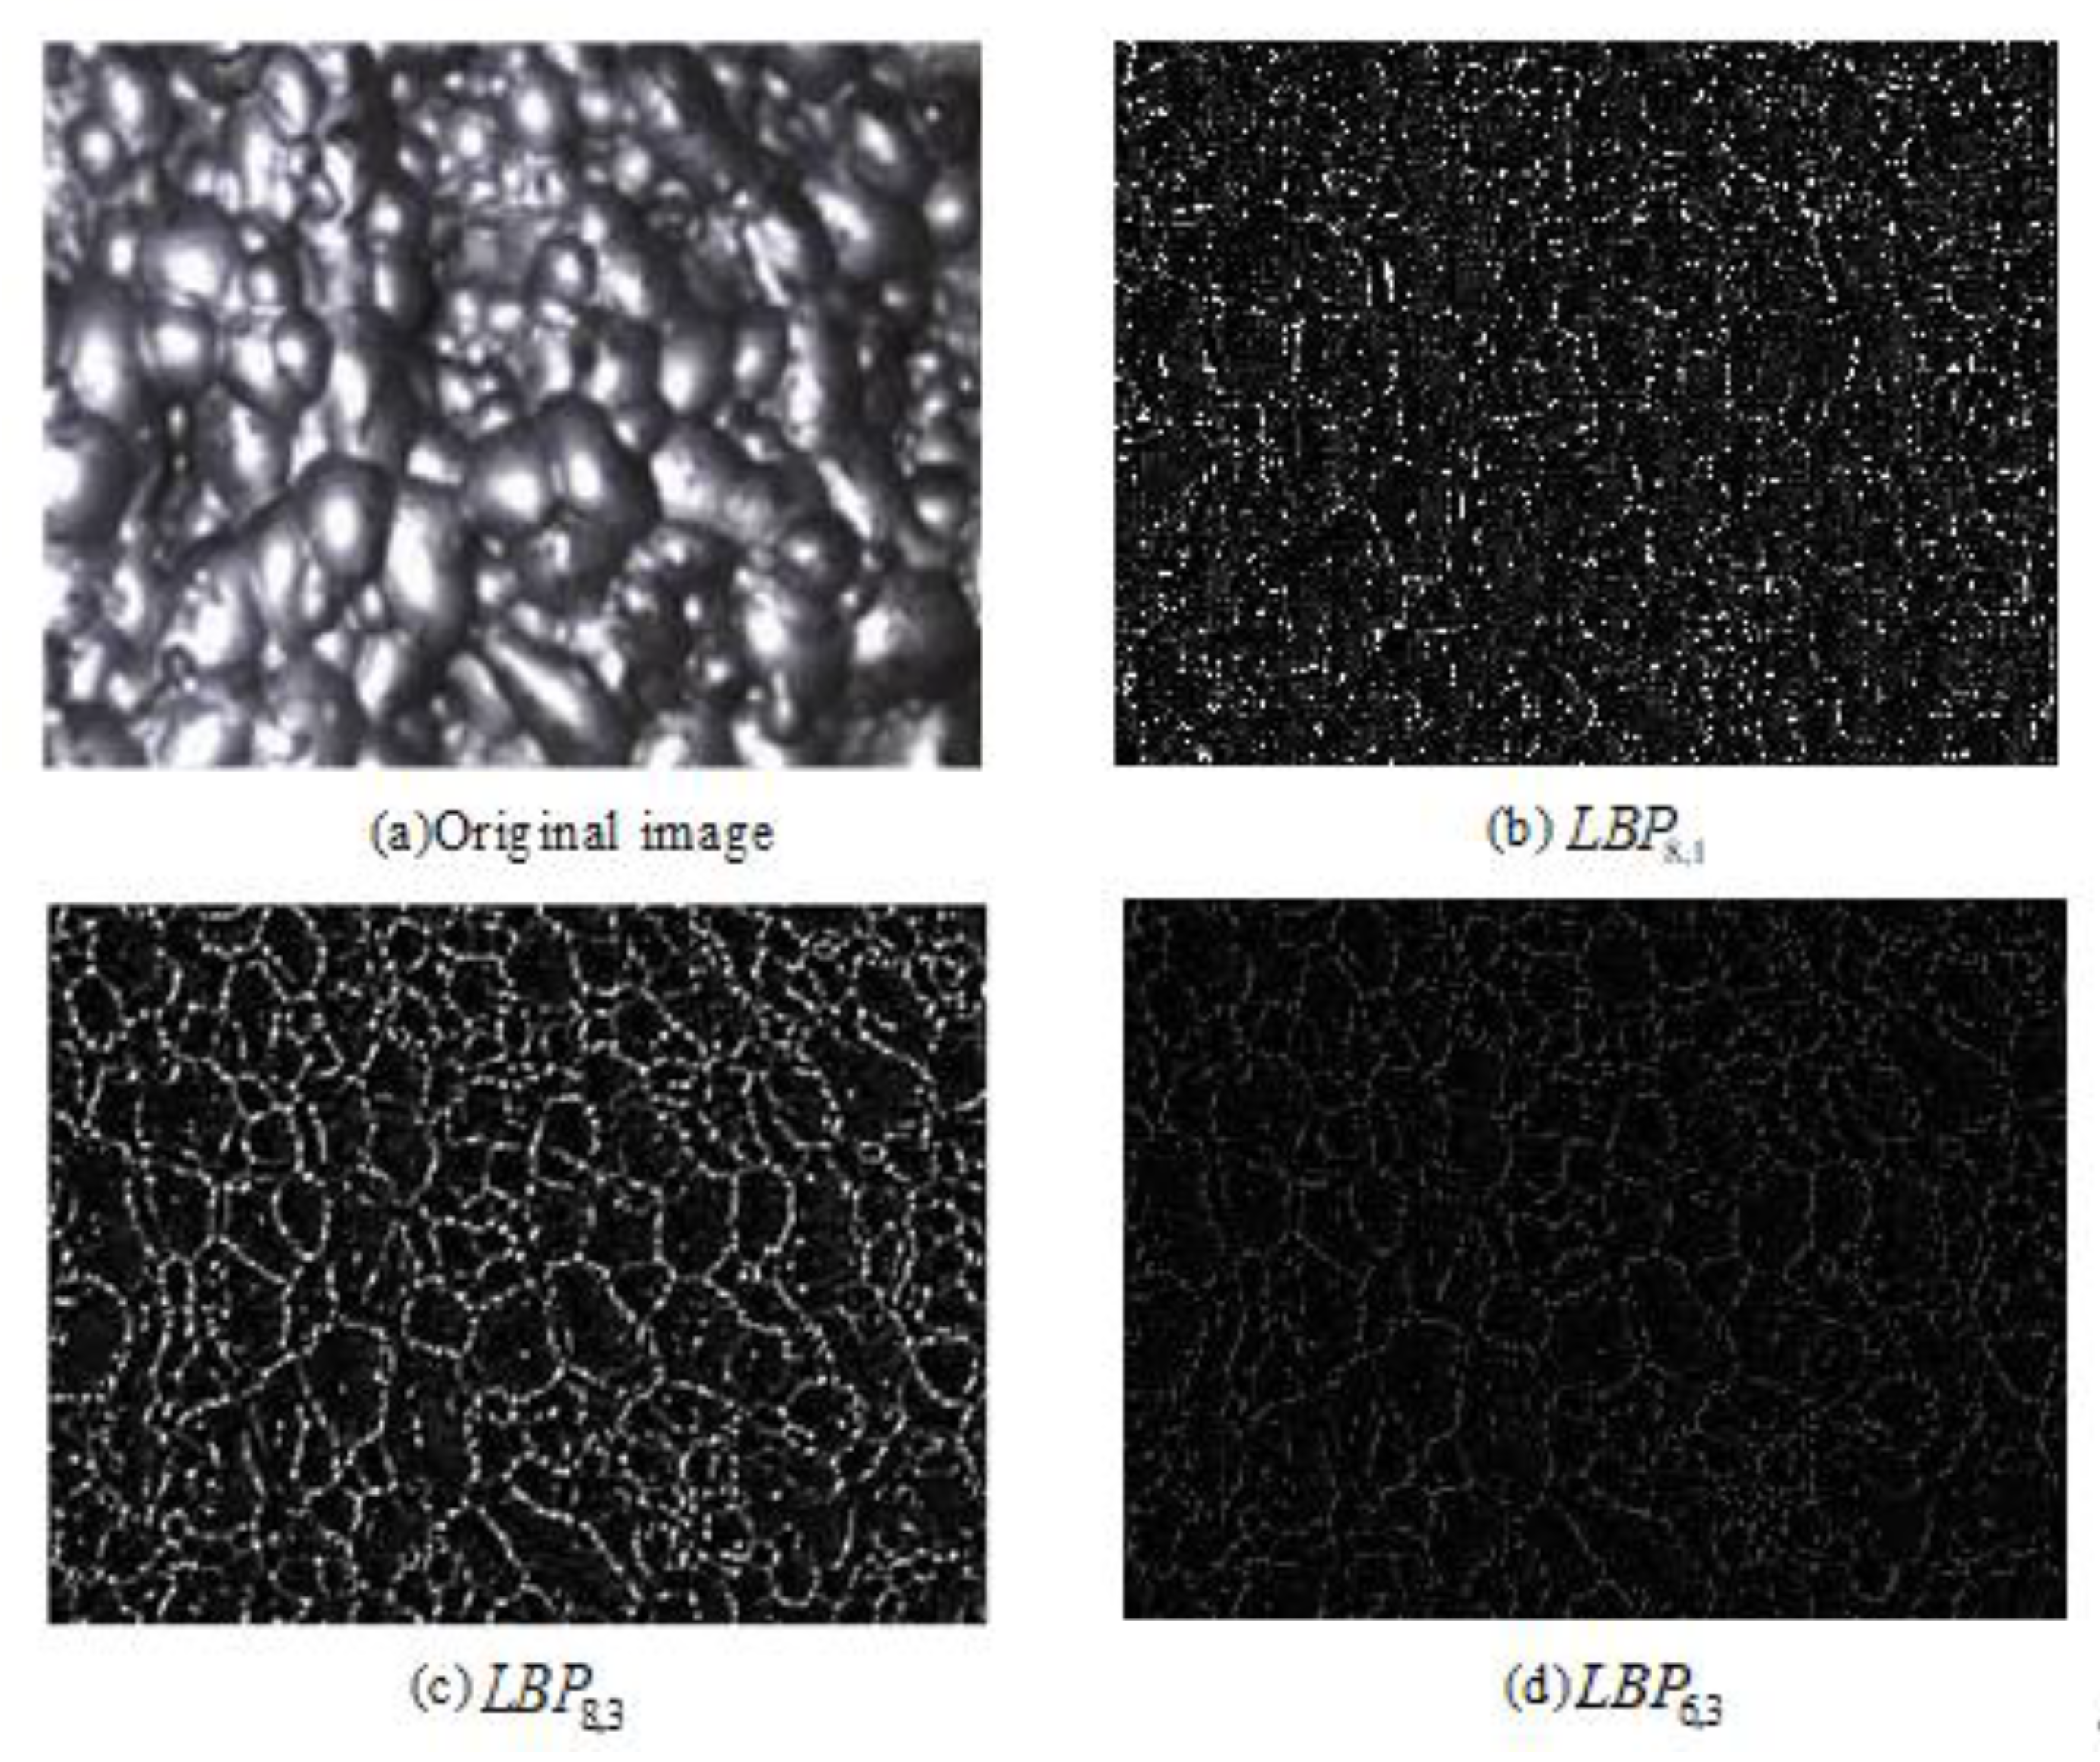
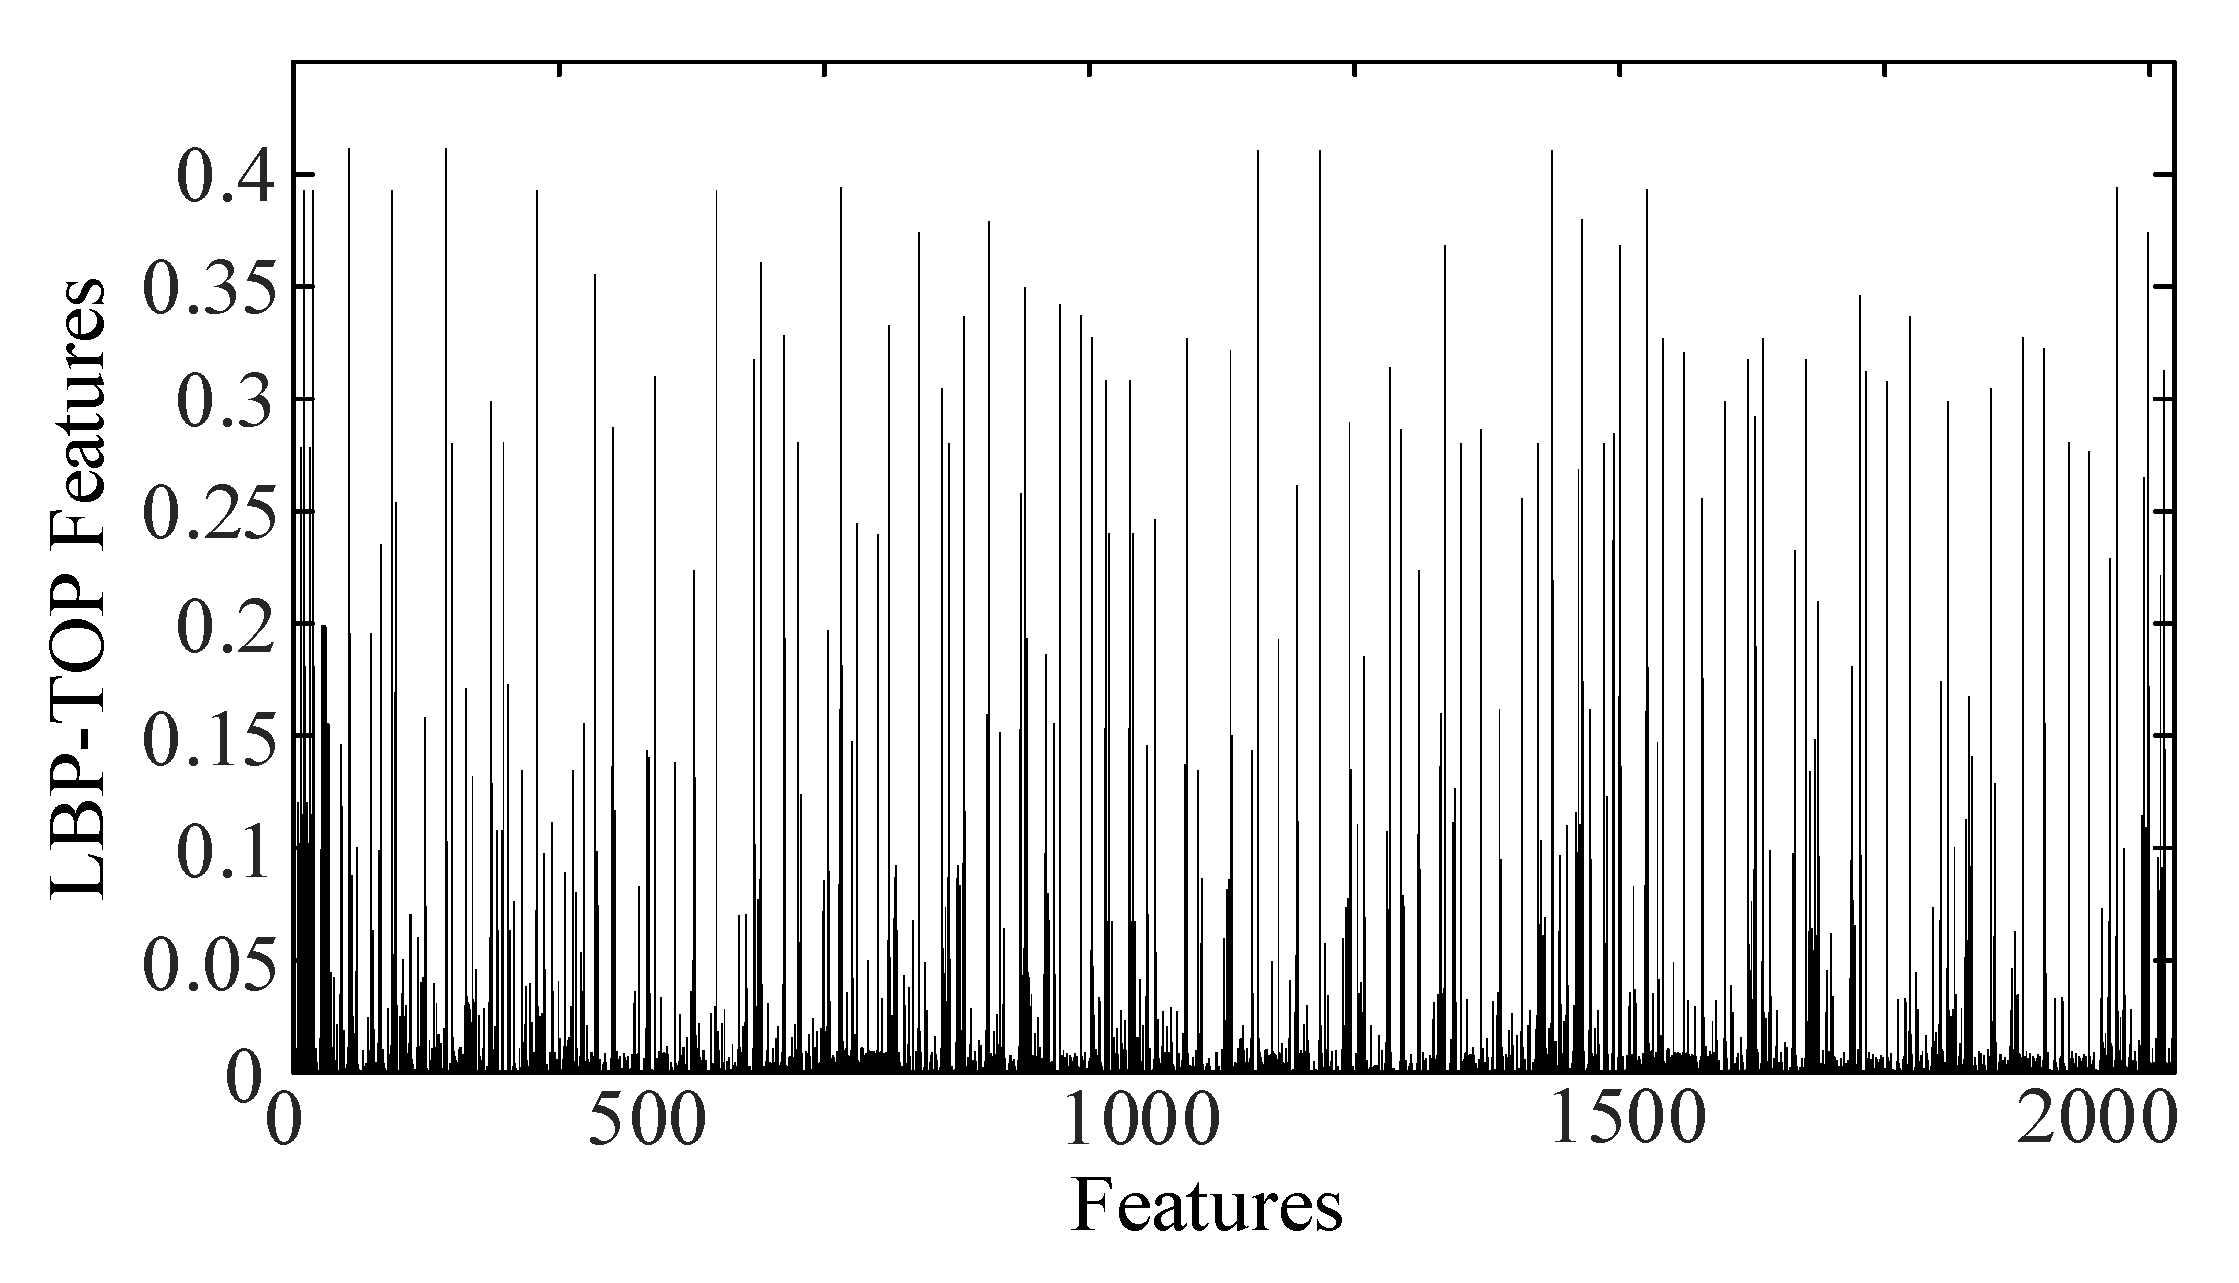
2.2. LBP-TOP Feature Extraction

The process of foam flotation is time-consuming and slow. In the process of flotation, different foams are produced, split, merged and made to disappear, and there are mutual extrusions and interactions among them. The movement trajectories of different foams are also different. These factors affect the accuracy of performance state recognition. LBP features can only extract texture features on the plane, and the extracted features can only reflect the result of the interaction between bubbles in the image. LBP cannot reflect the trend of motion change. Therefore, the LBP-TOP method was considered. LBP-TOP is an expansion of LBP from 2D space to 3D space which can effectively extract the temporal features of videos [22,23]. At present, this algorithm is widely used in China in micro-expression face recognition, but its application in the field of foam flotation is not popular. In order to extract richer foam features, this article applies time-frequency features to foam flotation from the perspective of foam dynamic features to effectively reflect the interaction between foams and the trend of foam motion. It can better reflect the dynamic foam characteristics. A single image has only X and Y dimensions, while a video or image sequence has an extra dimension along the time axis T. The X-Y, X-T and Y-T directions are orthogonal to each other and therefore can provide spatiotemporal information [24,25,26].
In an image sequence, given three orthogonal planes of the texture map, X-Y is the image normally seen, X-T is the texture of each row scanned along the time axis, and Y-T is the image of each column scanned along the time axis. As shown in Figure 5, LBP-TOP divides the sequence into three planes, X-Y, X-T and Y-T, according to the spatiotemporal relationship. The radius R and the number of field points P are set for each plane, and the LBP values of all independently. The calculated results of the three planes are taken as the LBP-TOP value of sequence images [27].
Figure 6 shows the schematic diagram of extracting image sequences in three orthogonal planes.

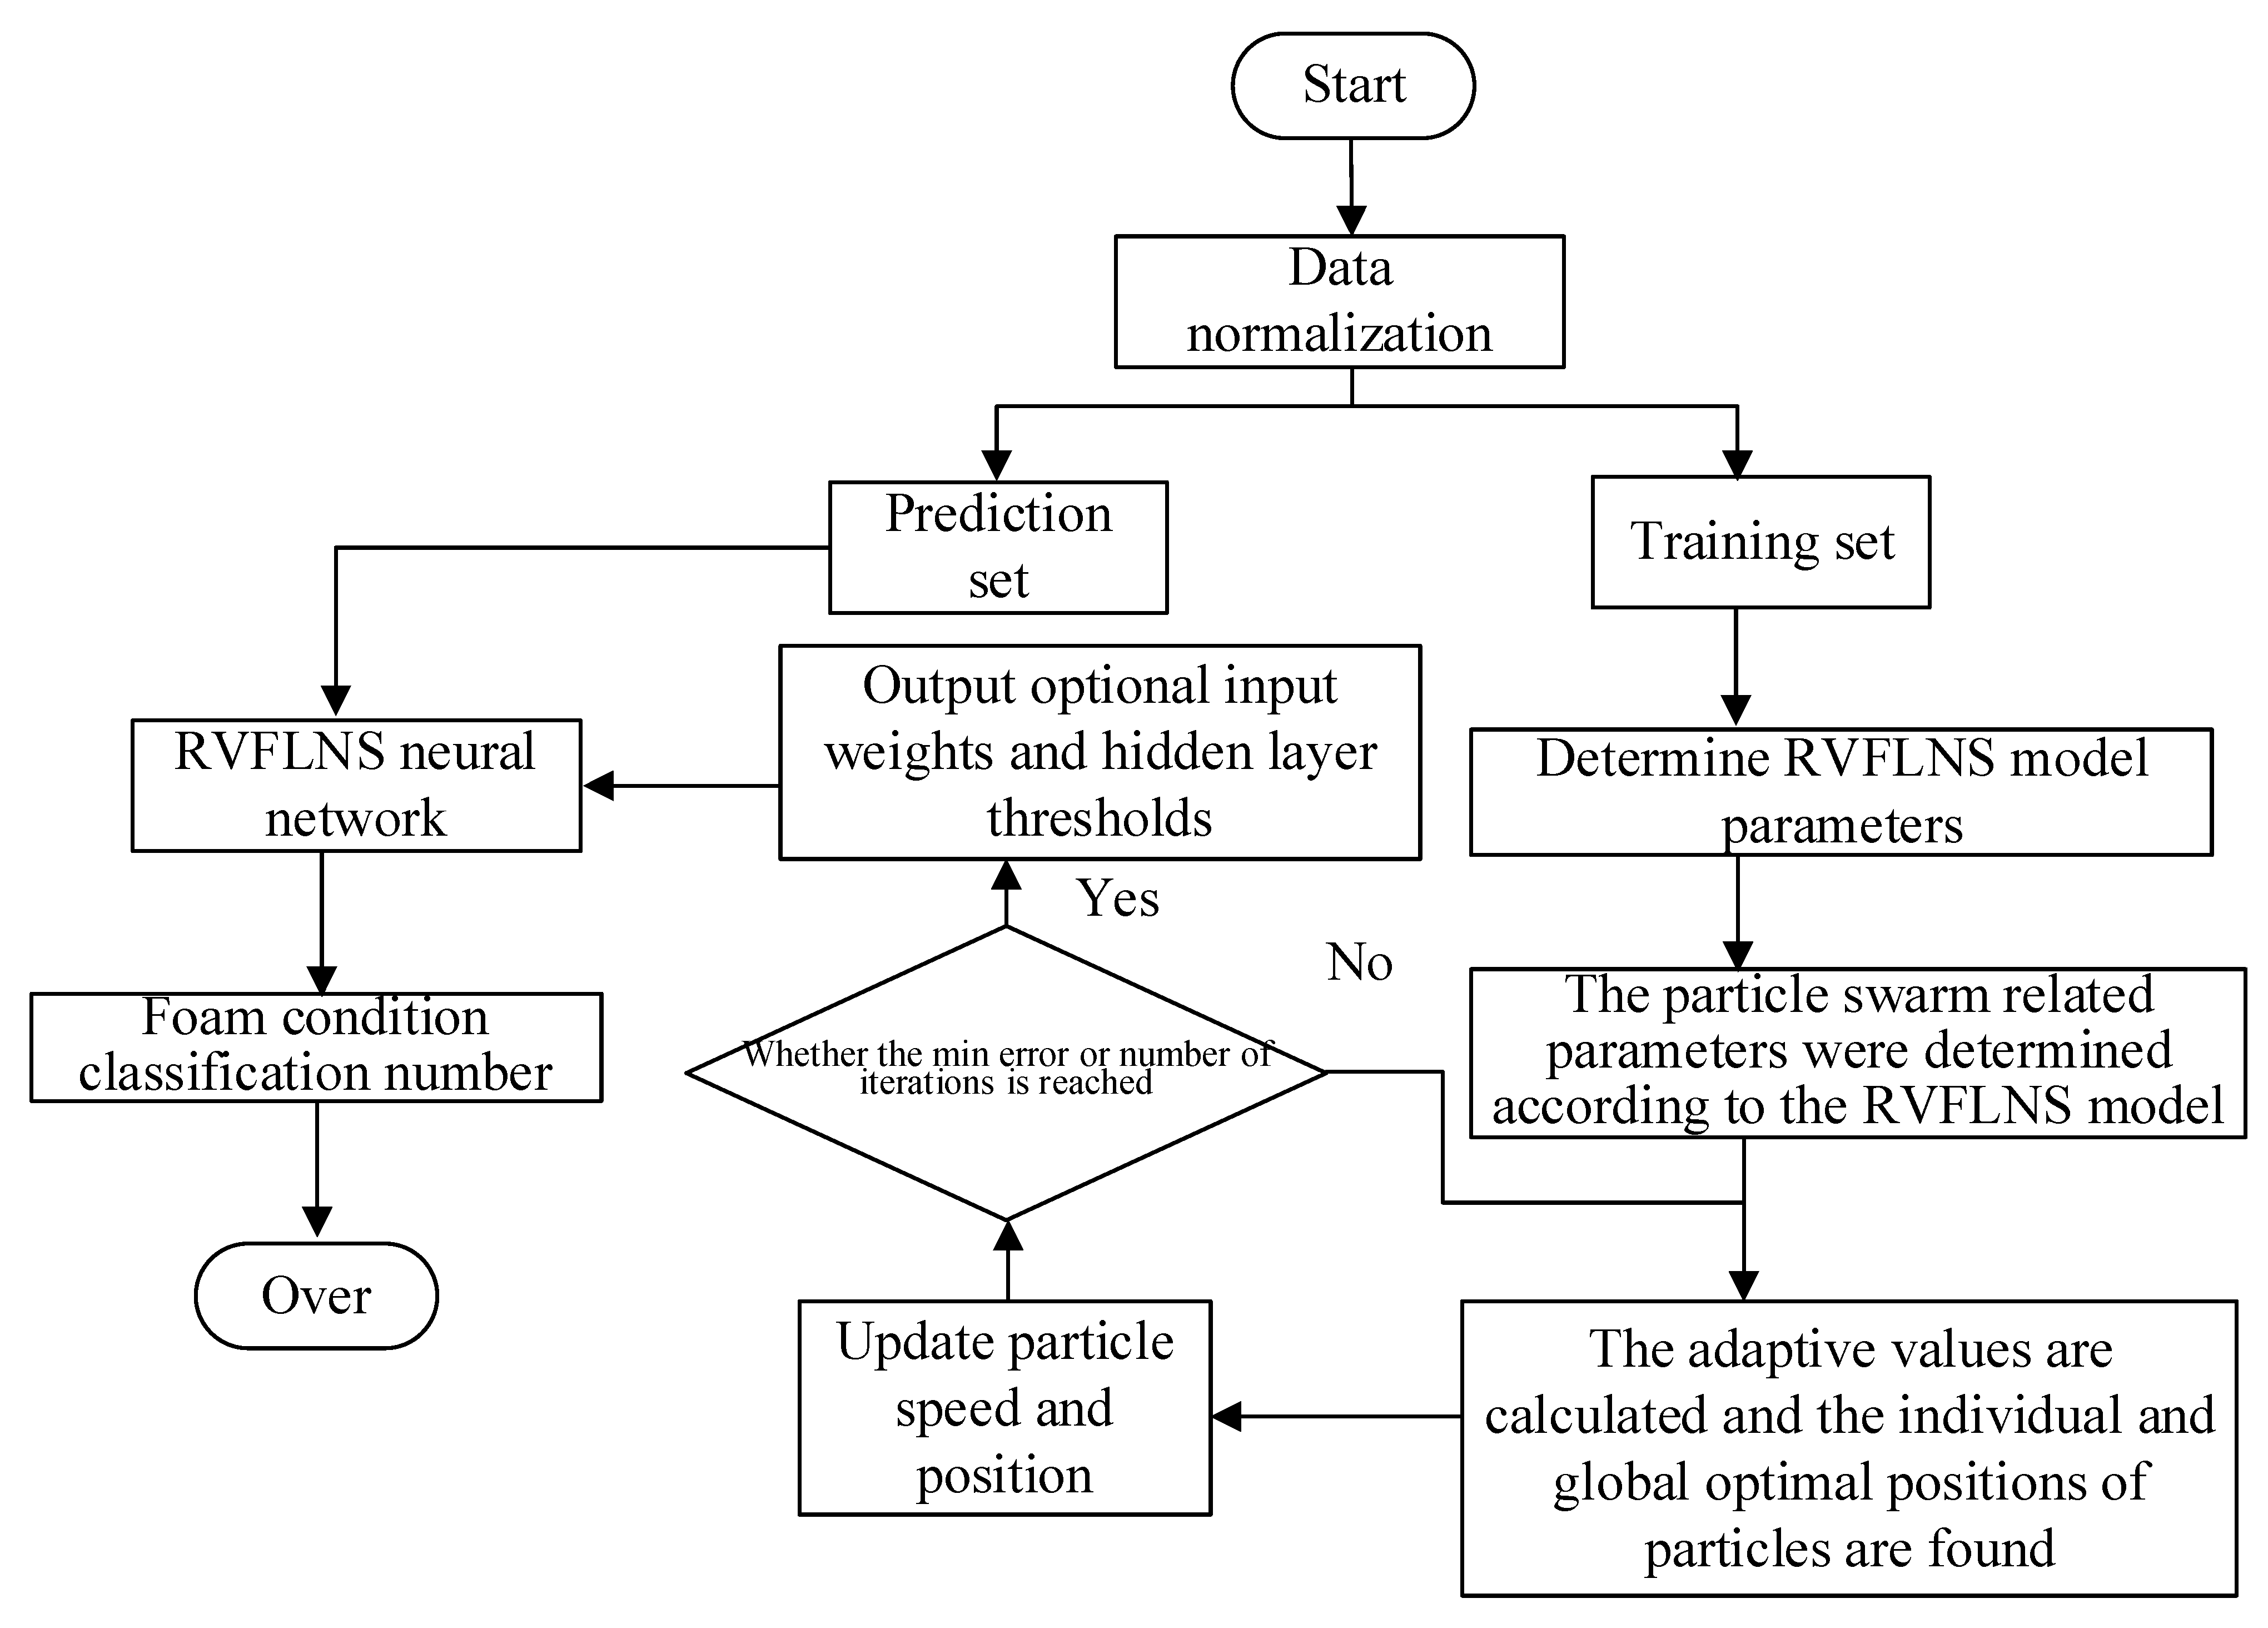
2.3. PSO-RVFLNS Condition Recognition Based on CNN and LBP Features

2.3.1. Random Weight Neural Network

A stochastic weight neural network is a new type of feedforward neural network; assuming there are n training samples { ( x k , t k ) } k = 1 n , x k is the input vector and t k is the output vector. An RVFLNS regression model with L hidden layers and f ( ) neuron layers can be expressed as follows:
{ i = 1 L w T f ( w i n x 1 + b i ) = t 1 i = 1 L w T f ( w i n x 2 + b i ) = t 2 i = 1 L w T f ( w i n x n + b i ) = t n
where k is the number of training samples, w i n is the input weight of the input node and hidden layer node, w is the output weight connecting the hidden layer and the output layer, and b i is the deviation of the ith neuron, namely the hidden layer threshold. The above equation may be written in matrix form as HW = T, where
H = [ f ( w i n x 1 + b 1 ) f ( w i n x 1 + b m ) f ( w i n x n + b 1 ) f ( w i n x n + b m ) ]
in which H is the output matrix of hidden layer of neural network, W is the output weight, W = [ w 1 , w 2 , , w L ] T ; T is the output vector, and T = [ t 1 , t 2 , , t k ] T . Since T is much larger than L in most cases, the output weight can be obtained using w = ( H T H ) 1 H T H . Therefore, the trained RVFLNS time series prediction model can be obtained:
t = i = 1 L w i f ( w i n x + b i )
where x is the input of the prediction model and t is the output of the prediction model.
However, when solving some practical problems with the RVFLNS algorithm, the number of neurons in the hidden layer is often increased in order to achieve a certain desired modeling accuracy, which leads to a non-compact structure of the algorithm network. To solve this problem, Xu et al. proposed the particle swarm optimization random weight neural network (PSO-RVFLNS) learning algorithm [27,28].

2.3.2. PSO Algorithm

PSO is a bionic optimization algorithm proposed by Kennedy and Eberhart [29,30] which originated from the study of birds predation behavior, wherein each bird in the search space is equivalent to the solution of each optimization problem in the PSO algorithm, which is equivalent to a “particle”. The so-called “particles” have their own positions and velocities which determine the direction and distance of their flight. All particles have their own fitness value, which determines how good or bad their current position is. In each iteration of the project, the particle updates itself with two metrics: the individual best P b e s t and the global best G b e s t .
The velocity and position updating equation of particle i is as follows:
V i d k + 1 = w v i d k + c 1 r a n d 1 k ( p b e s t i d k x i d k )   + c 2 r a n d 2 k ( g b e s t i d k x i d k ) x i d K + 1 = x i d K + v i d K + 1
where v i is the velocity information, v i = ( v i 1 , v i 2 , , v i d ) T , x i is the location information, and x i = ( x i 1 , x i 2 , , x i d ) T ; v i d k and x i d k are the individual best point position and global best point position of the d-dimension of particle I in the KTH iteration, respectively. w is the inertial weight factor modulating the speed of the particles. c 1 and c 2 are, respectively the maximum stride length and acceleration coefficient that adjust the flight direction of the individual best particle and the global best particle. r a n d 1 , 2 is a random number between [0, 1].
To overcome the shortcomings of poor classification capability and poor stability caused by randomly generated input weights and hidden layer thresholds during the training of RVFLNS algorithm, the global search ability of the PSO algorithm was used to optimize the input weights and hidden layer thresholds, as reported in the literature. The RMS error between the output value of the training sample and the expected output value is taken as the fitness function of the PSO algorithm to improve the prediction accuracy of RVFLNS. The PSO-RVFLNS algorithm flow is shown in Figure 7.
The algorithm proposed in this paper mainly uses a CNN for static feature extraction. In addition, the LBP texture features of time-frequency images are also extracted in this paper. These two features are combined as the input of performance state recognition to obtain higher classification accuracy. The principal diagram of the proposed algorithm is shown in Figure 8.

3. Results

To verify the effectiveness of this method, the foam images of lead-zinc ore concentrate ⅱ tank from a flotation plant in Guangxi were taken as the experimental object. The experimental hardware platform CPU was an Intel(R) Core (TM) I7-11800H, @2.3 GHz, GPU was a NVIDIA GTX3060, RAM was 16 GB. The software running environment comprised Windows10, Python3.7, Pytorch1.11.0 and Matlab2020a. The 10 s foam videos were collected every 10 min from 9:00 a.m. to 15:00 a.m. for 18 consecutive days, and the images of the 3rd–7th s were extracted according to the interval of 0.5 s, and the final foam dataset was more than 6400 copies. Some 1000 copies of data were randomly selected for each working condition, and the data were divided into training set and test set according to the ratio of 4:1. The results and comparative analysis of each experimental procedure are given.

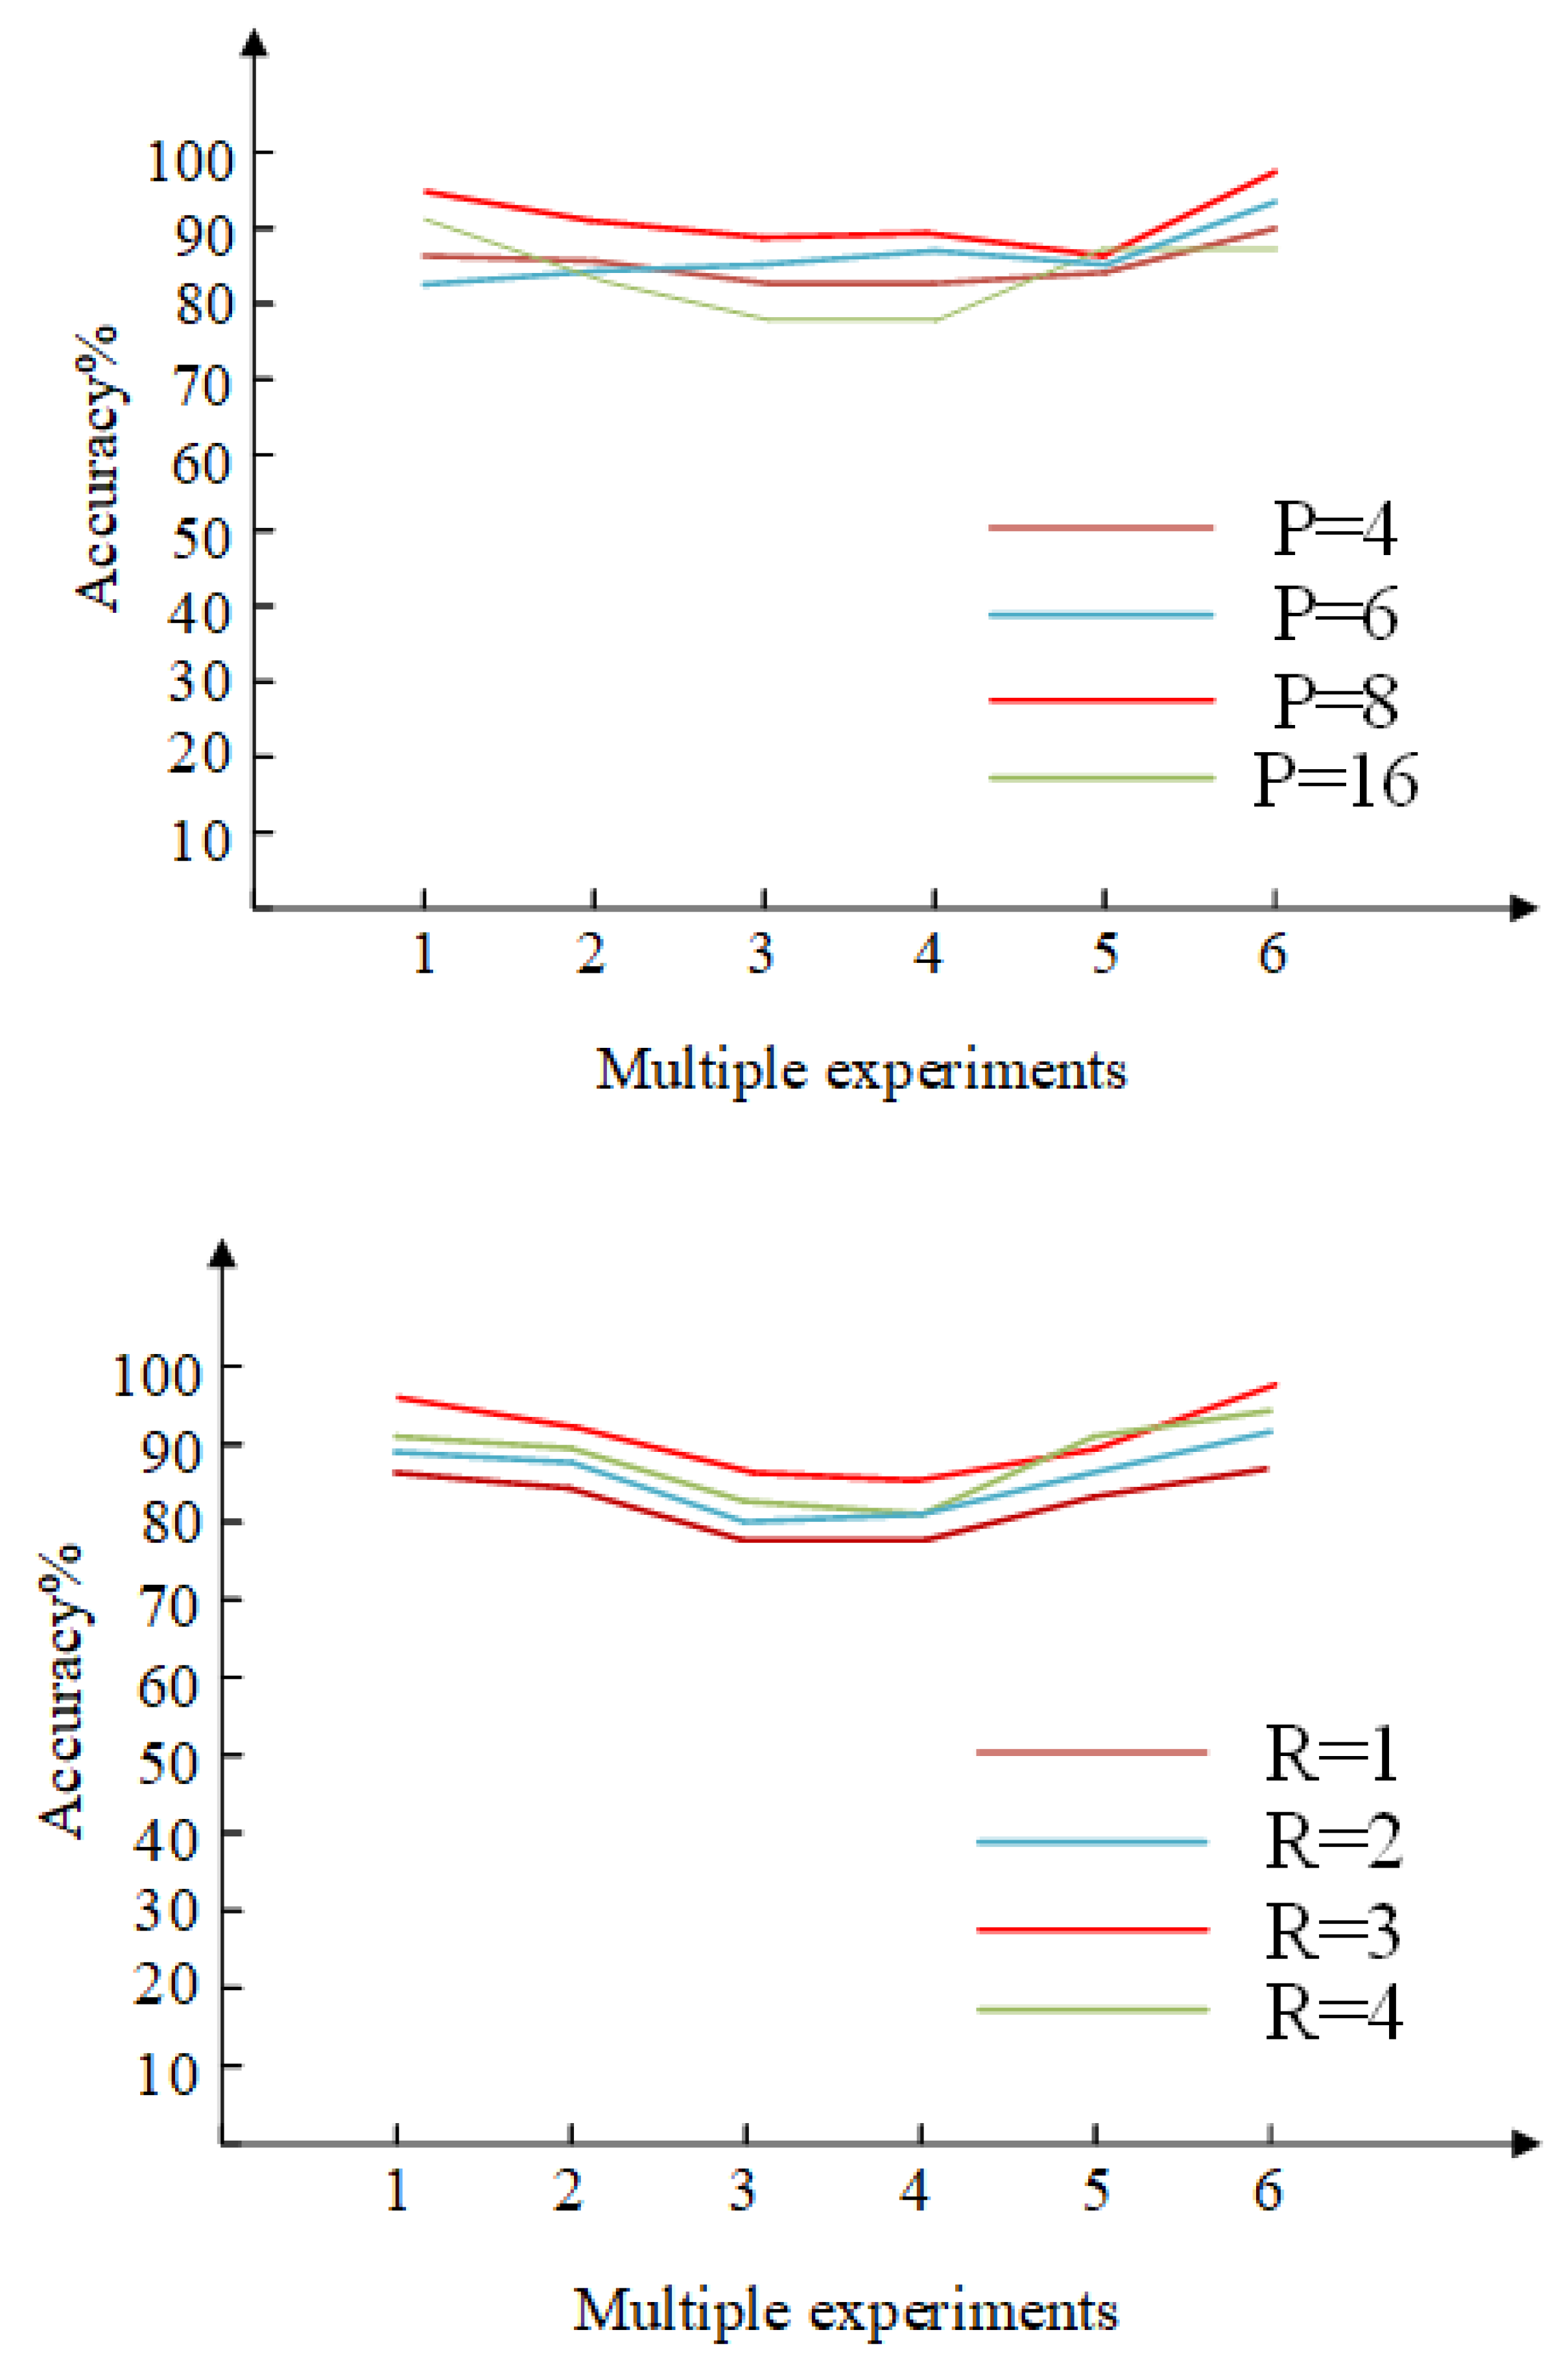
3.1. LBP Experimental Analysis

(1) Parameter analysis of foam image processed by rotation-invariant LBP operator
When processing foam images with a rotation-invariant LBP operator, the parameters P and R affect the image processing effect and thus the final recognition accuracy. Set P to take the values in the set {4,6,8,16}, and R to take the values in the set {1,2,3,4}. The images are processed using the rotation-invariant LBP operator, and then the dynamic texture feature vector is calculated. The average recognition accuracy of the six experiments is shown in Figure 9. When experimenting with P, R, the optimal value of 3 is chosen; when experimenting with R, P, the optimal value of 8 is chosen.
As shown in Figure 9, with the change in P and R parameters, the recognition accuracy also shows some floating. The value of P has a great influence on the image-processing effect; when P is small, the image contrast is lower, and when P is large, more factors interfering with texture feature extraction are obtained. Figure 10 shows the image processing effects of P and R with different values. When P = 8 and R = 1, the foam boundary in the image is not clearly depicted, and when P = 6 and R = 3, the image contrast is low. These comparison results show that the extraction effect is better when P = 8 and R = 3, and the texture features of foam image are more obvious, which lays a good foundation for feature extraction. The experimental results show that the highest accuracy of work condition recognition is obtained by choosing P = 8, R = 3 for image processing.
(2) LBP-TOP feature extraction
The data set was rotation invariant LBP-processed to enhance texture visibility while reducing the effect of high brightness, and then the processed foam was placed in the tri-orthogonal plane to extract dynamic temporal features. In the foam image sequence, the number of frames in the continuous foam image sequence was N; the time axis radius RT = L was set according to the data, where N ≥ 2 L + 1 and the L + 1 frame in the foam image sequence was taken as the center frame. The eigenvalues of LBP were calculated on the X-Y plane, and then L frames were taken from the foam images before and after, according to the center frames on the X-T and Y-T planes, respectively. Finally, the LBP-TOP features of the foam image sequence were cascaded together according to the order of X-Y, X-T and Y-T planes. PXY = PXT = PYT = 8, RY = RX = 3, RT = 1 were selected to divide the image sequence into 2 × 2 blocks and calculate the LBP-TOP features of foam image sequences corresponding to various working conditions or performance states. The X-Y, X-T, Y-T planes each have 708 features dimensions, and the three planes add up to a total of 2124 dimensions. The LBP-TOP histogram is shown in Figure 11.

3.2. Visualization Analysis of CNN Feature Map

The images were decomposed into four scales (low-frequency scale, high-frequency scale 1, high-frequency scale 2 and high-frequency scale 3) through NSST multi-scale decomposition and inputted to CNN network model for learning. Visualization of the first six layers of an image’s data flow is shown in Figure 12. The low-frequency sub-band contains a large amount of global information of the image, while the high-frequency sub-band contains details, textures and other features. After continuous learning and computation in the convolutional layers and pooling layers, more contour and detail features can be extracted from images at the four scales.
Figure 13 shows the loss function of NSST-CNN training. After multiple iterations of training, the network can achieve good results. The model can be used to extract image features. After 220 iterations, the model achieves good convergence effect.

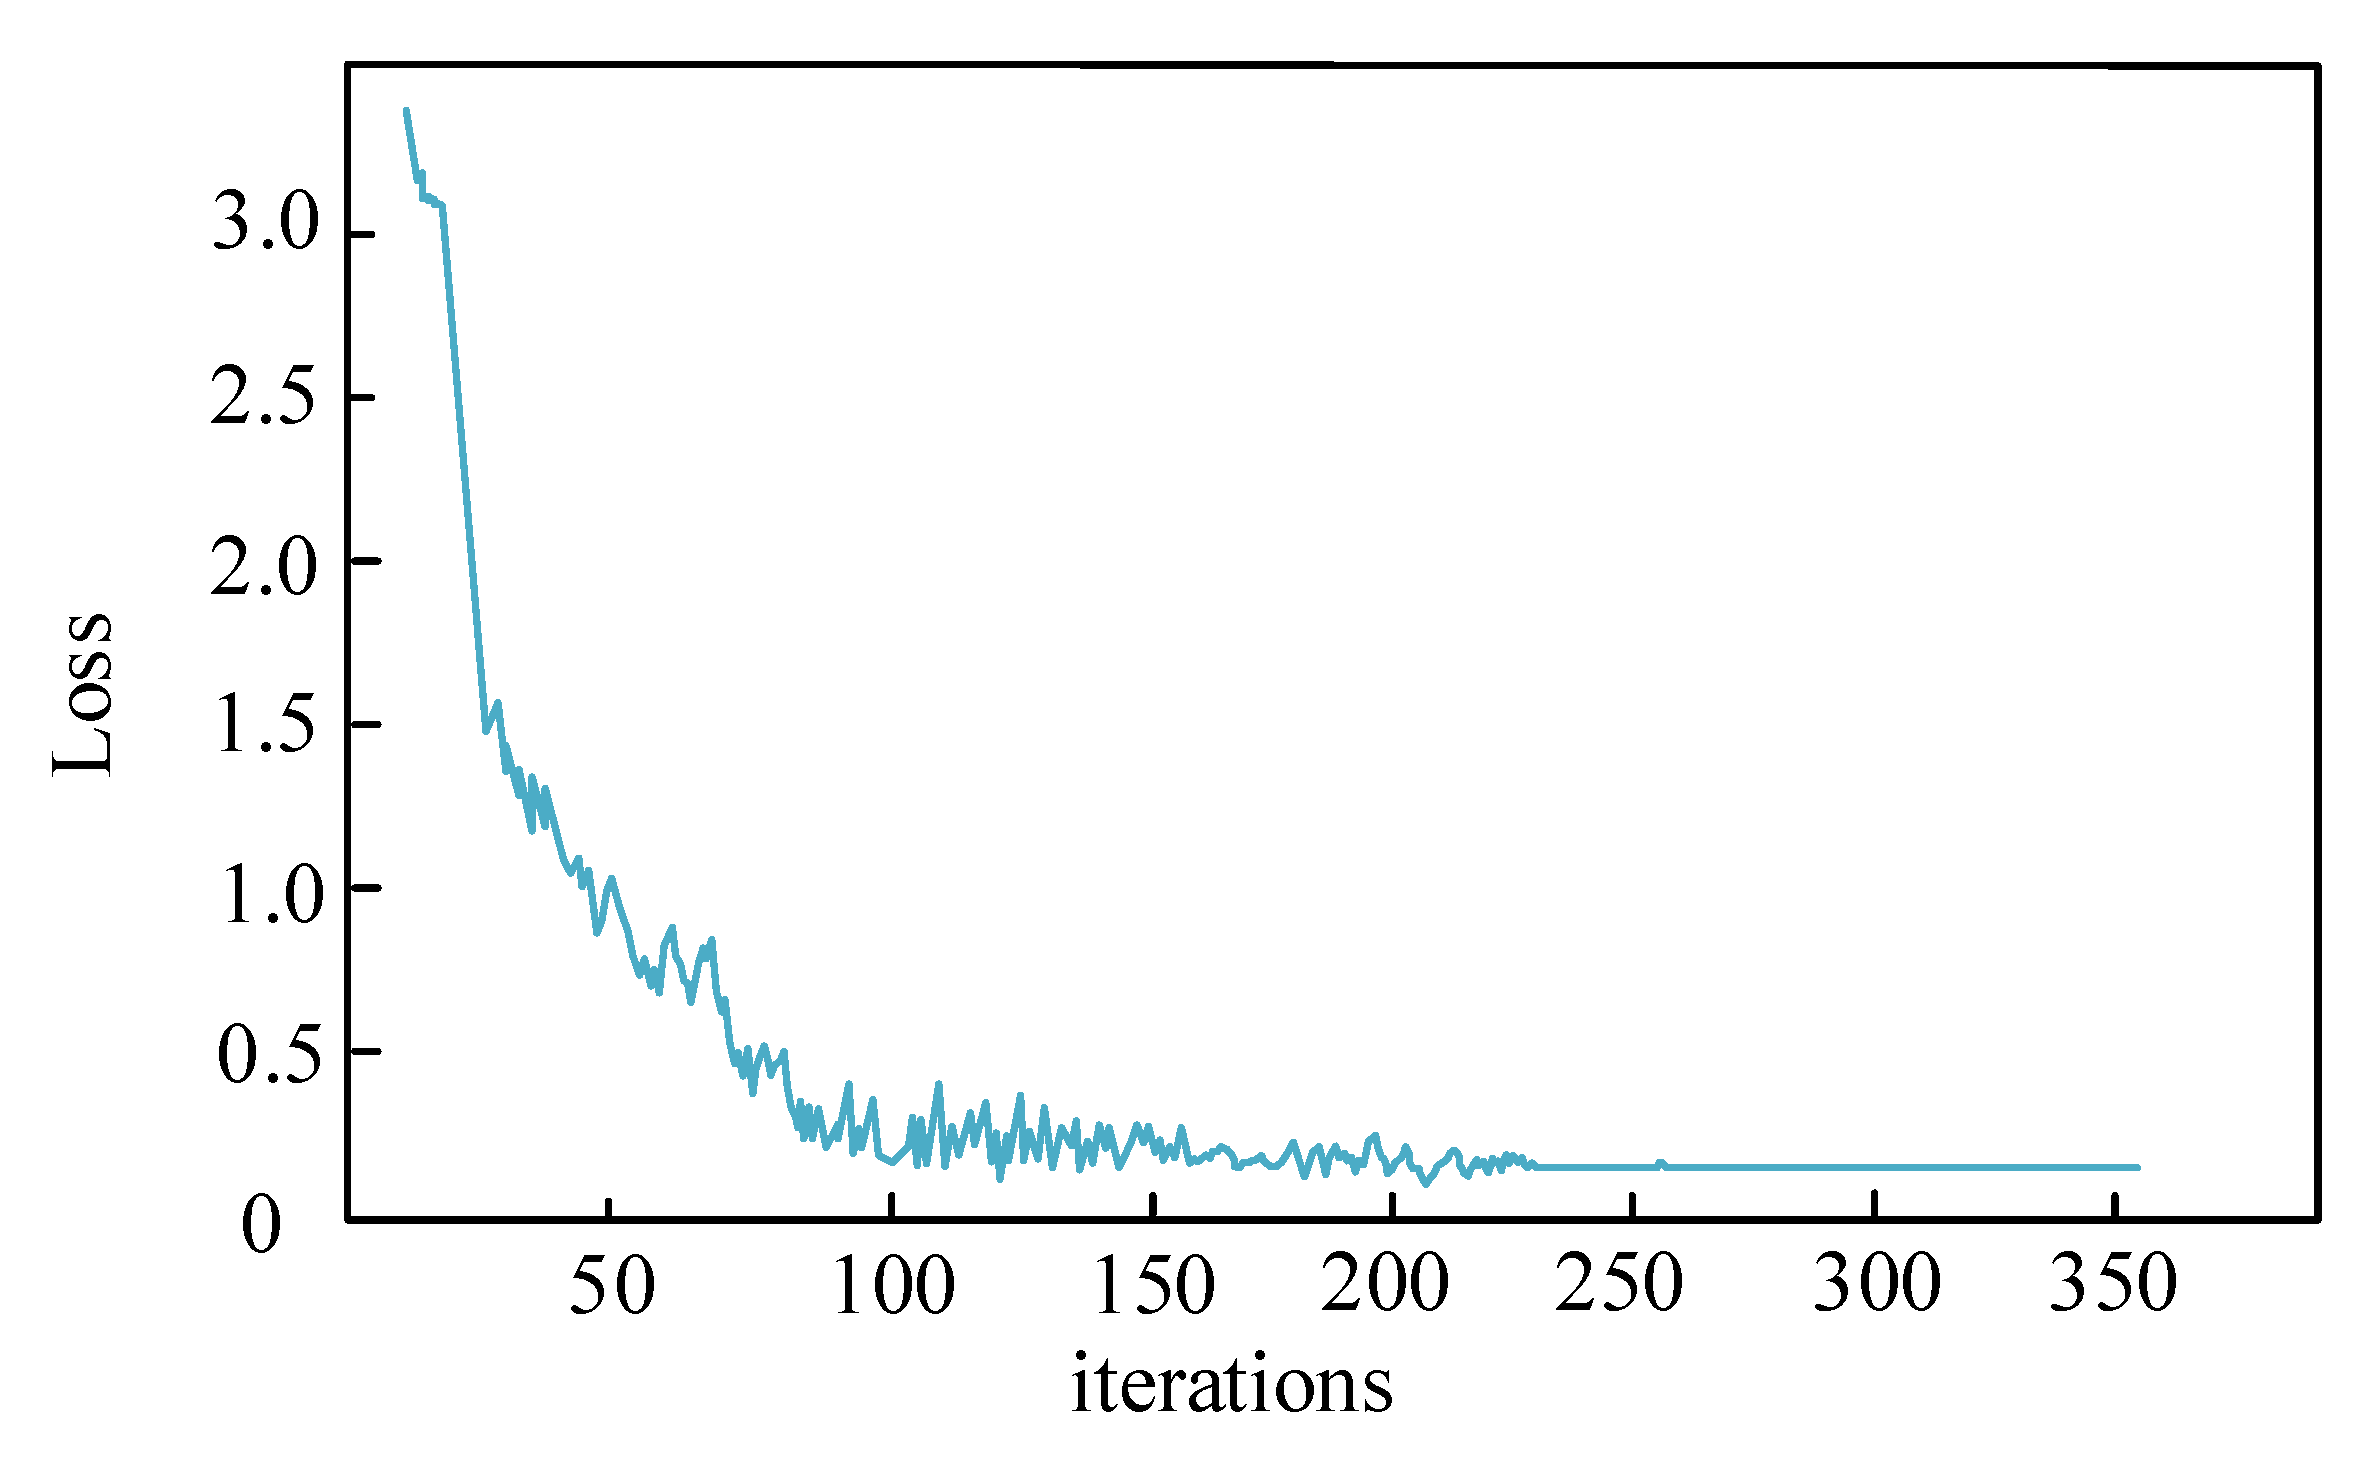
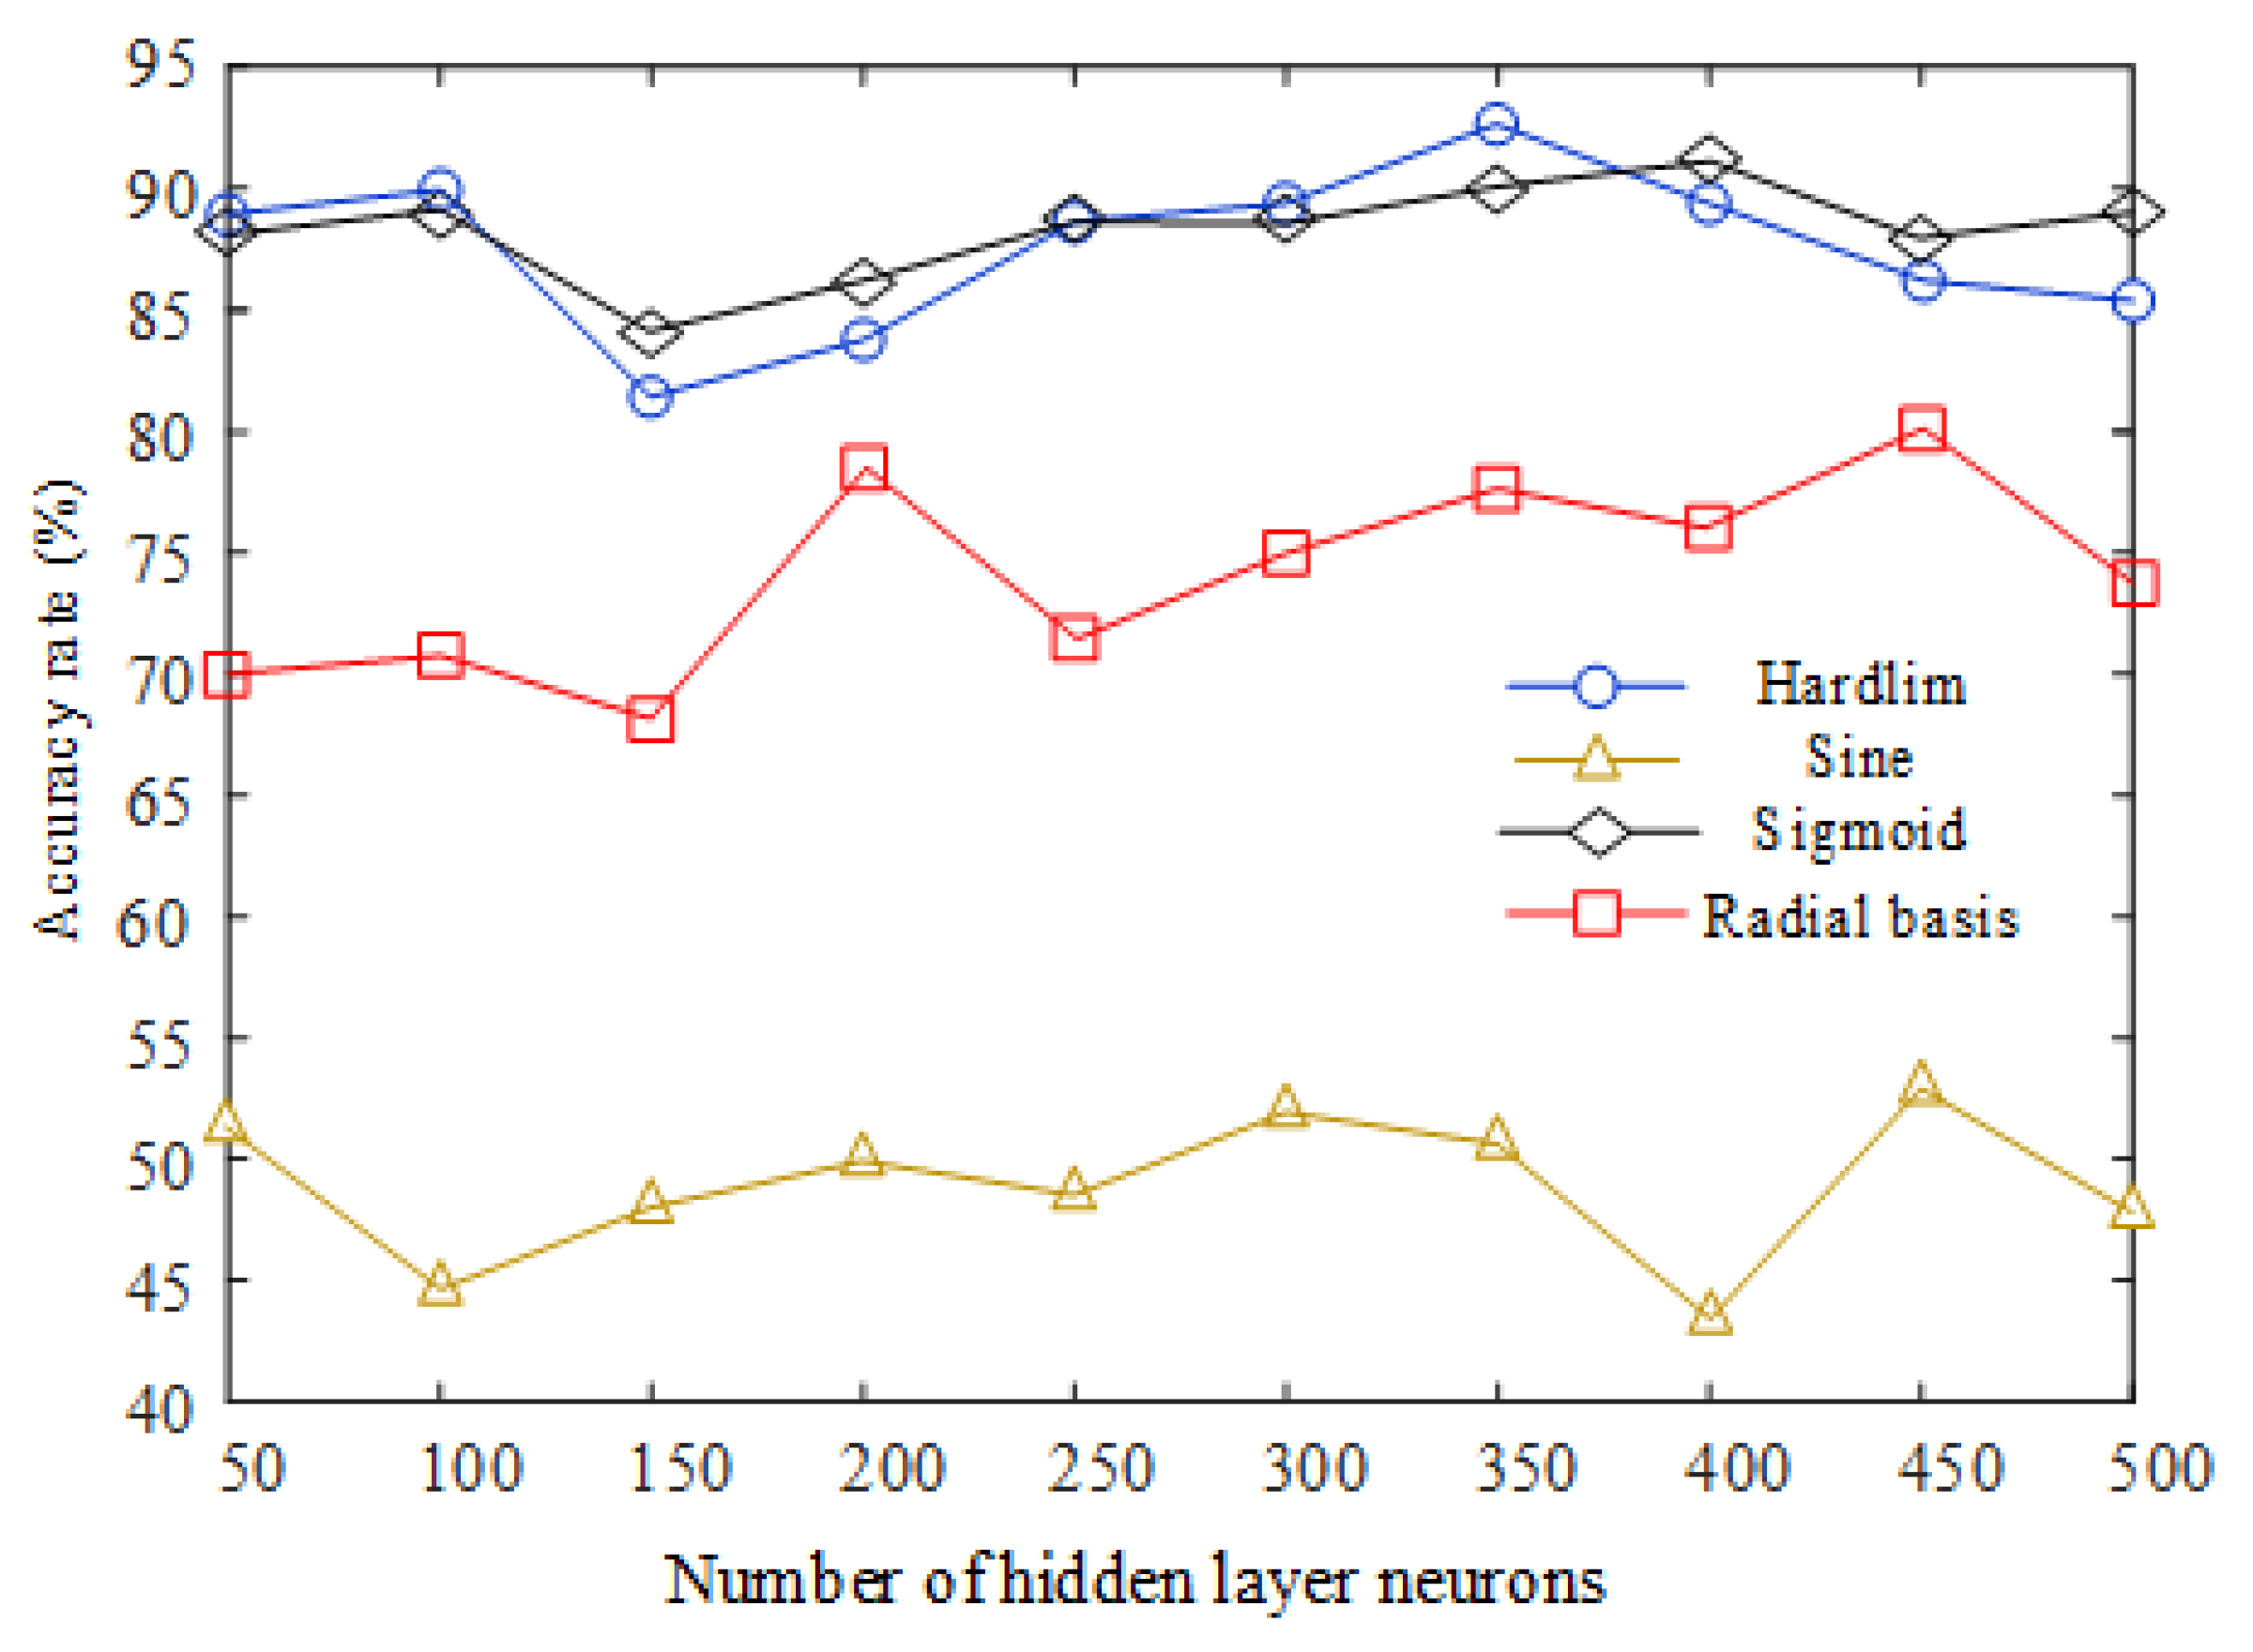
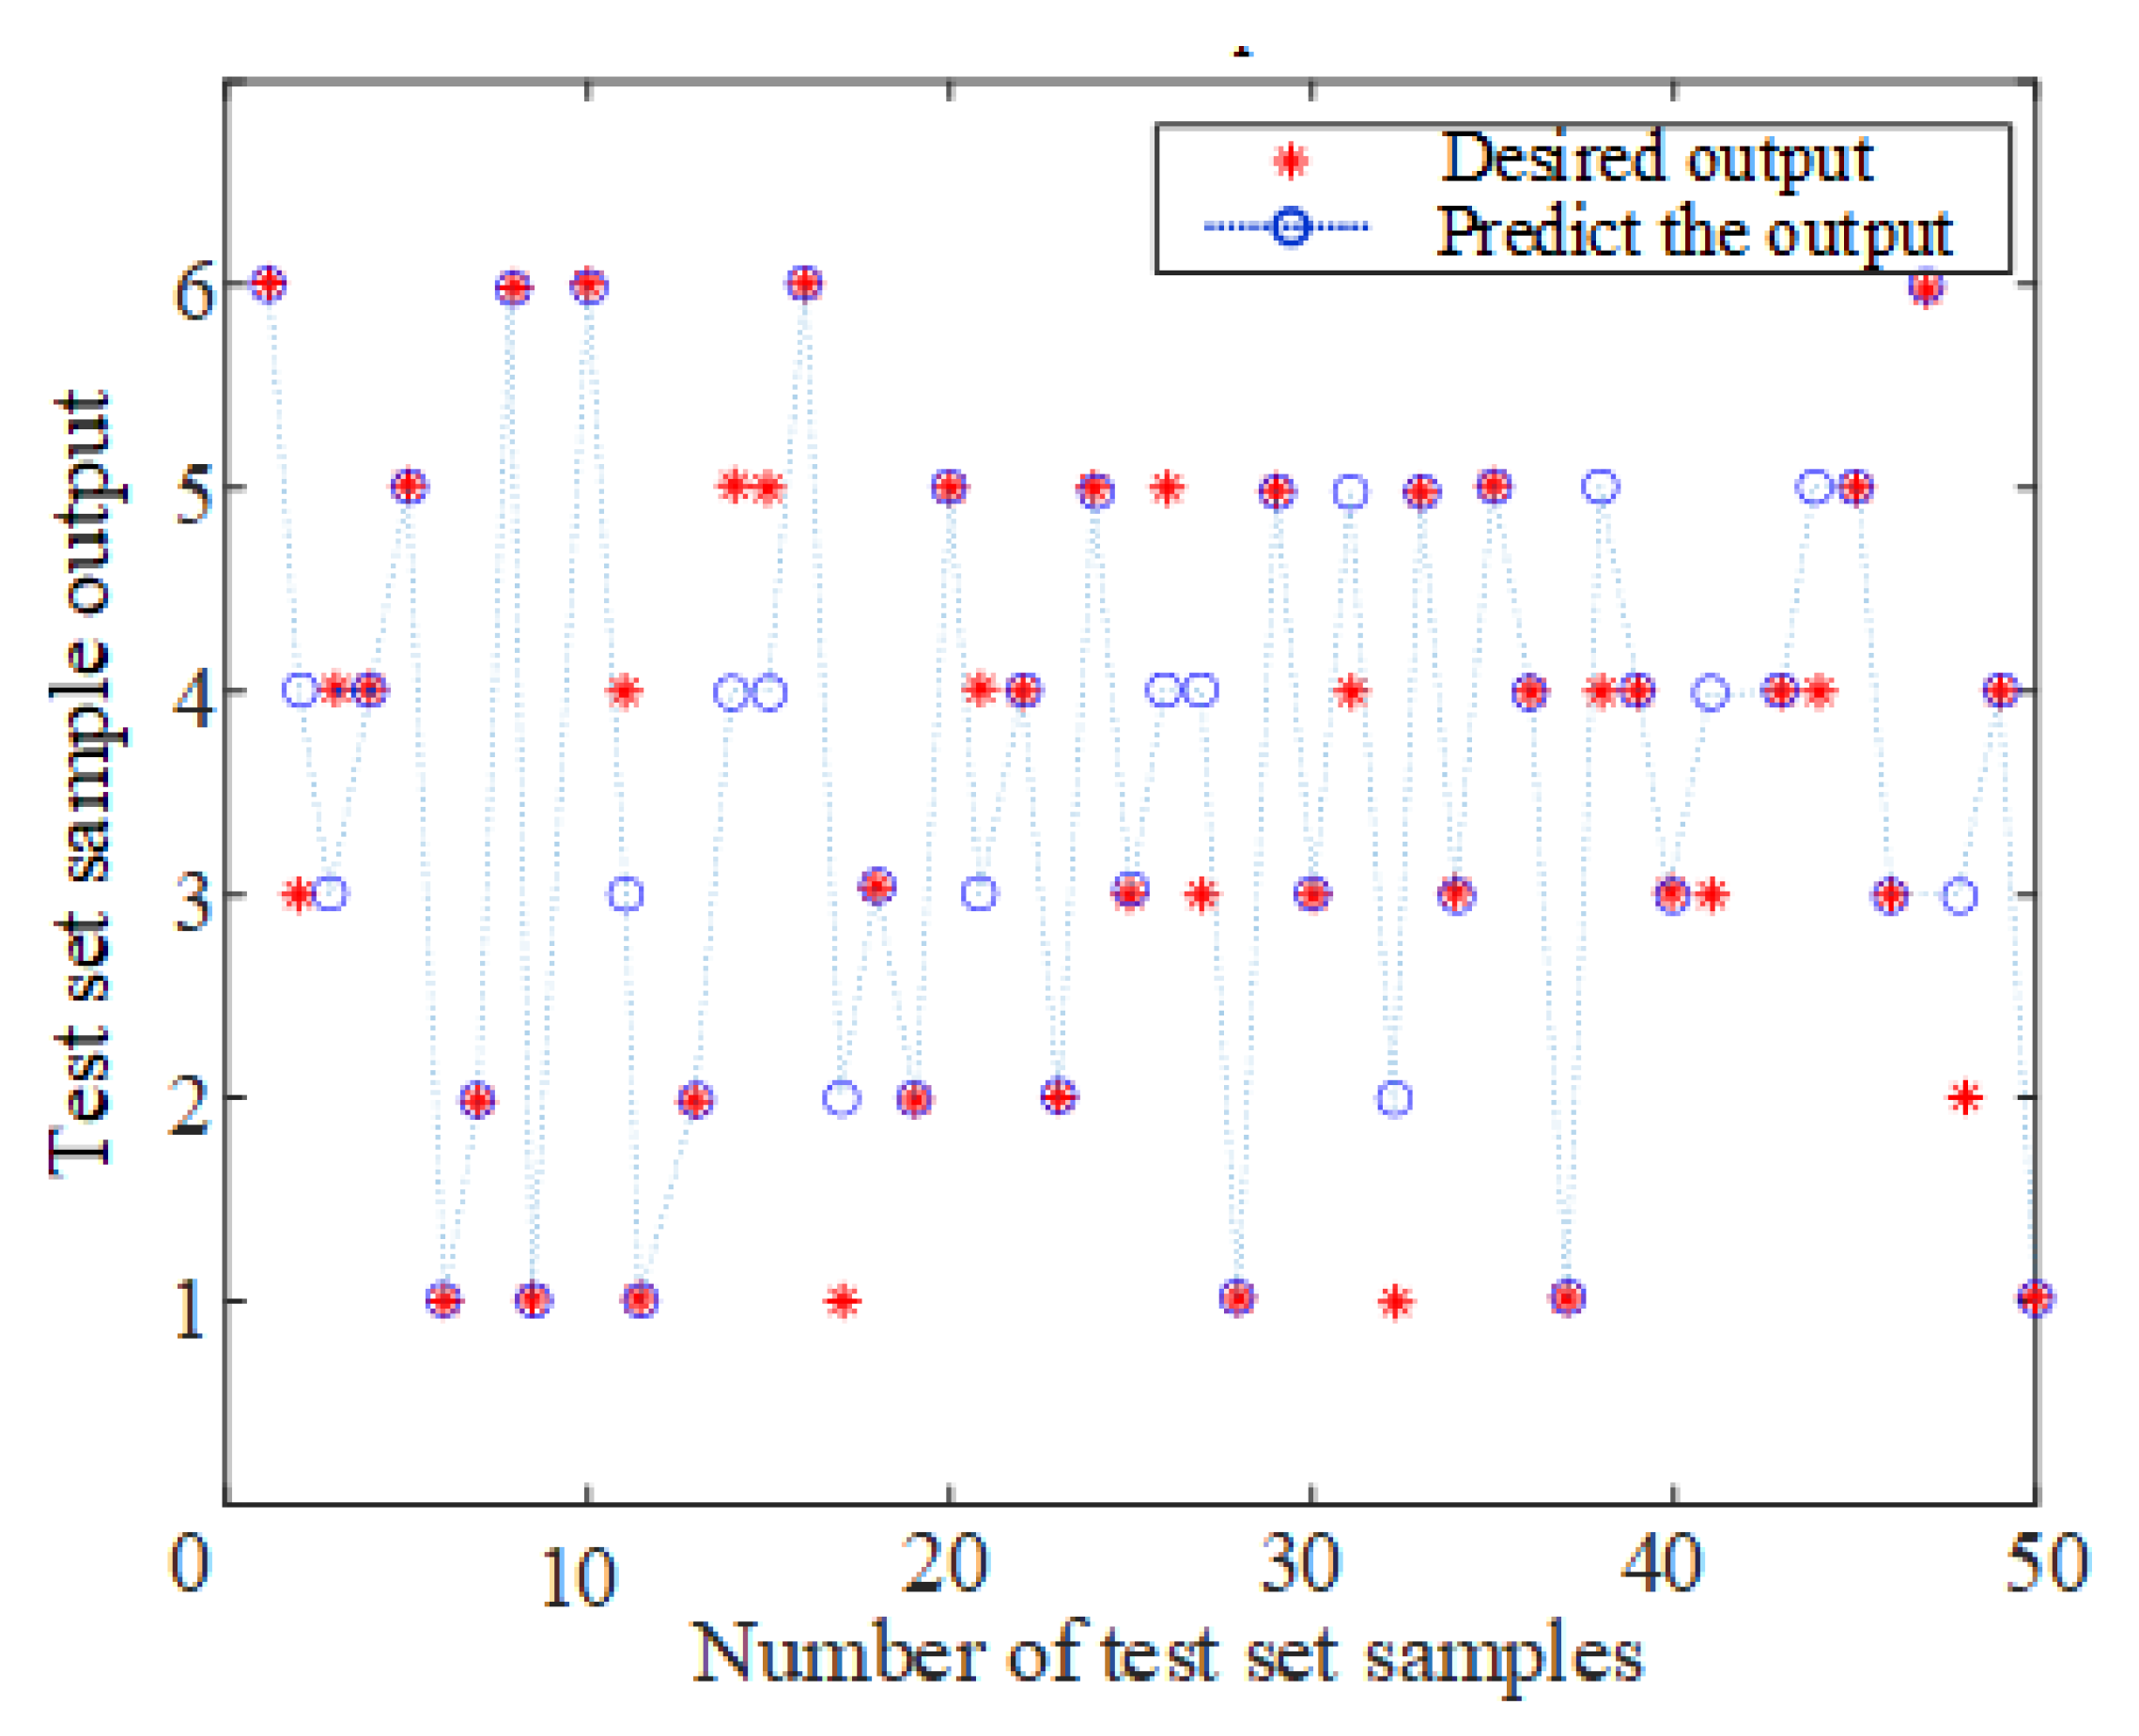
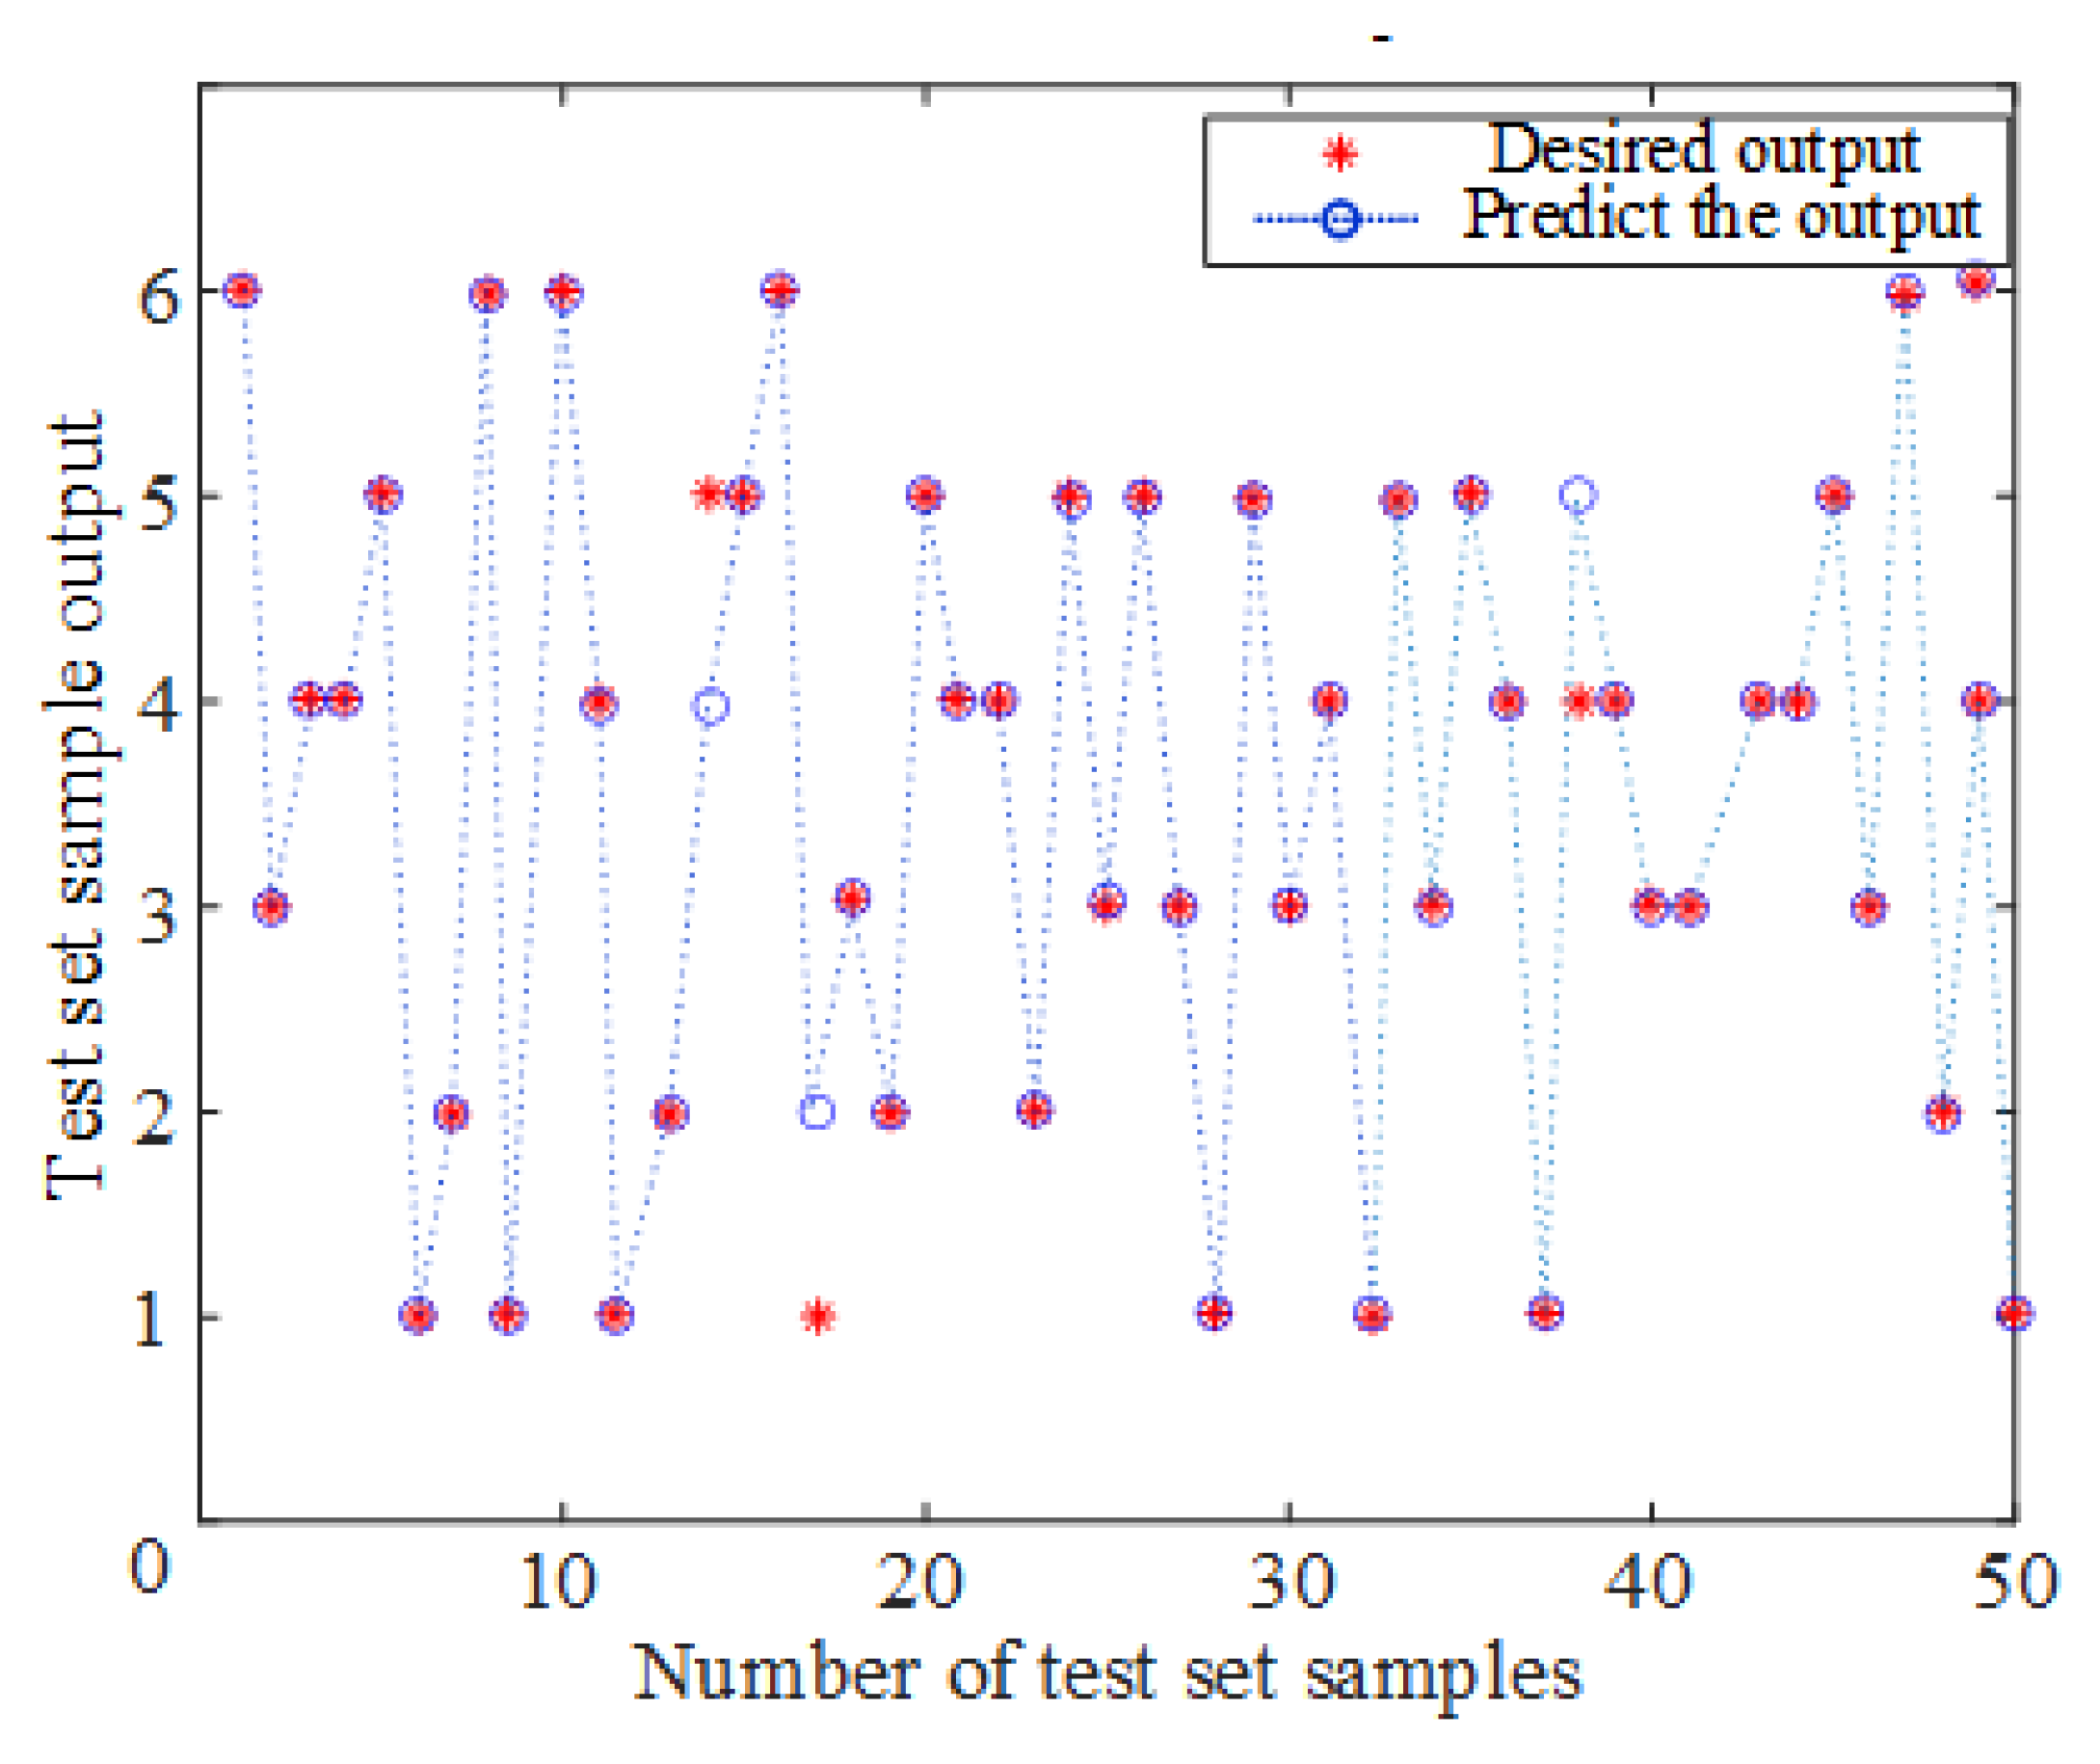
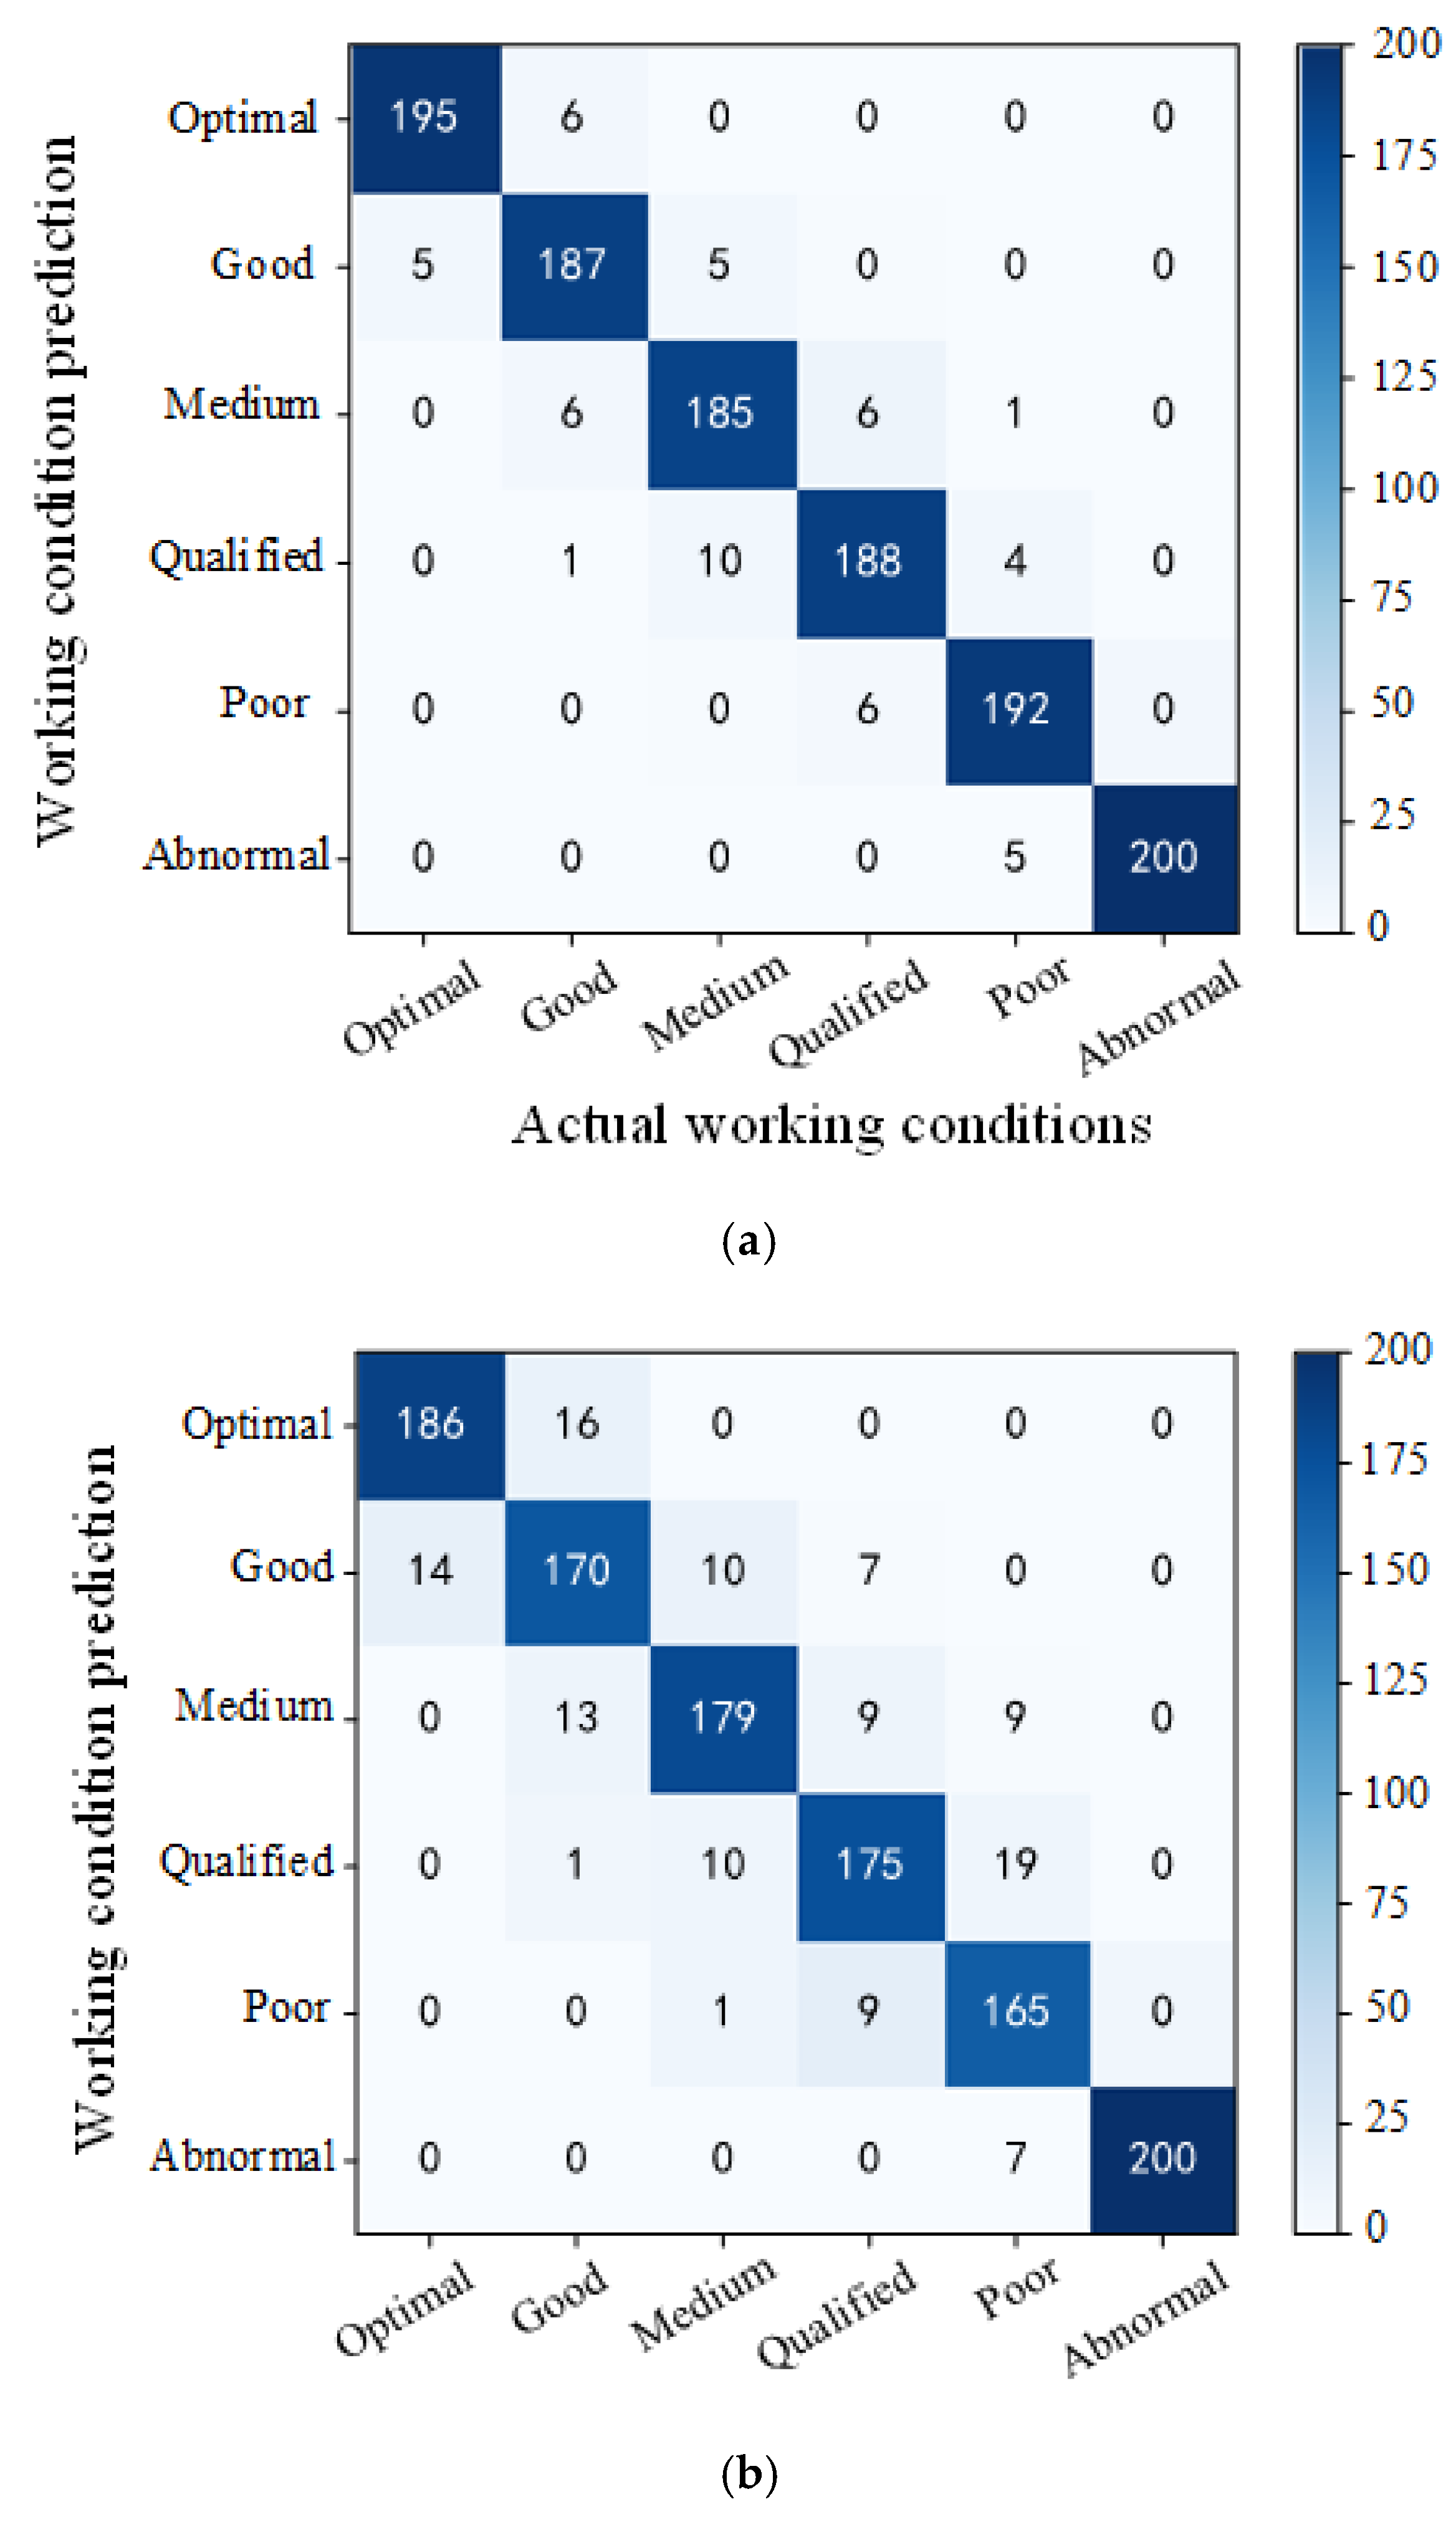
3.3. PSO-RVFLNS Parameter Setting and Classification Effect

The number of hidden layer neurons in RVFLNS has a significant influence on the recognition accuracy. The results of analyzing the impact of the number of neurons under different activation functions on recognition accuracy are shown in Figure 14.
The recognition accuracies of different activation functions and number of neurons are shown in Table 1:
Sigmoid was selected as the activation function, and the recognition accuracy was high when the number of neurons in the hidden layer was 400. To test the optimization performance of particle swarm optimization algorithm on RVFLNS, 50 groups of data were randomly selected from the training sets for testing. The learning factor c1 = c2 = 1.49445, a number of iterations K = 300, and a population size POP = 30 was set for testing. The test output of RVFLNS and PSO-RVFLNS is shown in Figure 15 and Figure 16.
From the results in Figure 15 and Figure 16, it can be seen that the PSO-optimized RVFLNS algorithm has higher classification accuracy and better classification effect than the ordinary RVFLNS algorithm. The model was tested using 6 × 200 sets of data from the test set, and features processed by LBP-TOP and NSST-CNN were extracted, respectively. The features extracted by the two methods in series were combined and then input into PSO-RVFLNS for classification. The confusion matrix of the final classification is shown in Figure 17. In Figure 17, (a) is the recognition result of NSST-CNN and LBP-TOP features, and (b) and (c) are the recognition result of NSST-CNN and LBP-TOP, respectively. The NSST-CNN using LBP-TOP has the highest recognition accuracy and improves the resolution of adjacent conditions. Therefore, the recognition error rate of adjacent conditions is greatly reduced. The average identification accuracy is 95.17%, which is 6.55% and 4.97% higher than NSST-CNN and LBP-TOP, respectively.

4. Conclusions and Future Directions

A PSO-RVFLNS foam flotation performance identification method combining CNN and LBP was proposed to improve the identification accuracy. The method can be used in practical situations to solve problems such as difficult flotation agent dosing state detection, low identification efficiency with existing methods, and even excessive reliance on manual experience.
In this study, an NSST-CNN feature extraction network was constructed on the basis of a VGG16 model. The original foam images were decomposed into different frequency scales through NSST decomposition to better extract the high- and low-frequency features of foam. The low frequency of NSST contains a lot of energy of the foam, and the high frequency contains a lot of information about the boundary and detail texture of the bubble, which can characterize the foam more comprehensively and is beneficial for identification of the final working condition. With the same number of training samples, the NSST-CNN network developed here has higher recognition accuracy than the single-mode CNN feature recognition model. The proposed LBP-TOP model can better extract time-frequency features of foam videos and further improve the recognition accuracy. The combination of the CNN model and LBP-TOP model overcomes the deficiency of CNN in dynamic features. The results show that the recognition accuracy of the multi-scale CNN and LBP-TOP method was improved by 4.97% and 6.55%, respectively, compared with CNN and the traditional LBP algorithm. The average recognition accuracy of flotation states with PSO-RVFLNS reached 95.17%.
In addition, this method is also useful for the flotation of other ores. At this stage, only the working conditions of foam flotation are identified and classified; reagents and machine parameters are not considered. The next step is to control the reagent concentration, type, dosage and parameters of machines for foam flotation classification.

Author Contributions

The conceptualization, algorithm, and code development were carried out by X.J., H.Z., J.L. and S.M. Experiments, manuscript writing, arrangement of resources, planning, design of experiments, and state of the art review were carried out by X.J., H.Z., J.L. and M.H. Part of writing, review, artwork, and code development were carried out by H.Z., J.L. and S.M. The day-to-day supervision and manuscript review were carried out by X.J. and M.H. All authors have read and agreed to the published version of the manuscript.

Funding

This research received no external funding.

Institutional Review Board Statement

Not applicable.

Informed Consent Statement

Not applicable.

Data Availability Statement

Data sharing is not applicable to this article due to the privacy of participants.

Conflicts of Interest

The authors declare no conflict of interest.

References

  1. Zhang, J.; Tang, Z.; Ai, M.; Gui, W. Nonlinear modeling of the relationship between reagent dosage and flotation froth surface image by Hammerstein-Wiener mode. Miner. Eng. 2018, 120, 19–28. [Google Scholar] [CrossRef]
  2. Huang, L.; Liao, Y. Extraction and identification of multi-scale equivalent morphology characteristics of flotation bubbles in NSCT domain. Opt. Precis. Eng. 2020, 28, 704–716. [Google Scholar] [CrossRef]
  3. Li, Z.; Zhang, S.; Lang, J.; Shao, H. The application and research of the liquid level control technology used in mineral flotation process which based on the modbus communication protocol. In Proceedings of the 2013 25th Chinese Control and Decision Conference (CCDC), Guiyang, China, 25–27 May 2013; IEEE: New York, NY, USA, 2013. [Google Scholar]
  4. Zhang, D.; Gao, X. A digital twin dosing system for iron reverse flotation. J. Manuf. Syst. 2022, 63, 238–249. [Google Scholar] [CrossRef]
  5. Bhondayi, C. Flotation froth phase bubble size measurement. Miner. Process. Extr. Metall. Rev. 2022, 43, 251–273. [Google Scholar] [CrossRef]
  6. Yao, Q.L.; Hu, X.; Lei, H. Object detection in remotese1234nsing images using multiscale convolutional neural networks. Acta Opt. Sin. 2019, 39, 1128002. [Google Scholar]
  7. Fu, Y.; Aldrich, C. Froth image analysis by use of transfer learning and convolutional neural networks. Miner. Eng. 2018, 115, 68–78. [Google Scholar] [CrossRef]
  8. Fu, Y.; Aldrich, C. Flotation froth image recognition with convolutional neural networks. Miner. Eng. 2019, 132, 183–190. [Google Scholar] [CrossRef]
  9. Morar, S.H.; Bradshaw, D.J.; Harris, M.C. The use of the froth surface lamellae burst rate as a flotation froth stability measurement. Miner. Eng. 2012, 36–38, 152–159. [Google Scholar] [CrossRef]
  10. Wang, X.; Song, C.; Yang, C.; Xie, Y. Process working condition recognition based on the fusion of morphological and pixel set features of froth for froth flotation. Miner. Eng. 2019, 128, 17–26. [Google Scholar] [CrossRef]
  11. Liao, Y.; Yang, J.; Wang, Z.; Wang, W. Identification of flotation conditions based on dual-mode convolutional neural network adaptive transfer learning. Acta Photonica Sin. 2020, 49, 173–184. [Google Scholar]
  12. Li, Z.-M.; Gui, W.-H.; Zhu, J.-Y. Fault detection in flotation processes based on deep learning and support vector machine. J. Central South Univ. 2019, 26, 2504–2515. [Google Scholar] [CrossRef]
  13. Chen, Y.; Cai, Y.; Li, S. Antimony Flotation Condition Recognition Based on Lightweight Convolutional Visual Transformer. Adv. Laser Electron. 2023, 60, 0615002. [Google Scholar]
  14. Labate, D.; Lim, W.Q.; Kutyniok, G.; Weiss, G. Sparse multidimensional representation using shearlets. In Wavelets XI; SPIE: Philadelphia, PA, USA, 2005. [Google Scholar]
  15. Easley, G.; Labate, D.; Lim, W.Q. Sparse directional image representations using the discrete shearlet transform. Appl. Comput. Harmon. Anal. 2008, 25, 25–46. [Google Scholar] [CrossRef] [Green Version]
  16. Liu, X.; Mei, W.; Du, H. A novel image fusion algorithm based non-subsampled shearlet transform and morphological component analysis. Signal Image Video Process. 2016, 10, 959–966. [Google Scholar] [CrossRef]
  17. Shahdoosti, H.R.; Khayat, O. Image denosing using spars representation classification and non-subsampled shearlet transform. Signal Image Video Process. 2016, 10, 1081–1087. [Google Scholar] [CrossRef]
  18. Wu, J.; Guo, R.; Liu, R.; Ke, Z. Convolutional neural target recognition for missileborne linear array LIDAR. Acta Phoronica Sin. 2019, 48, 0701002. [Google Scholar]
  19. Liu, S.; Qi, L.; Qin, H.; Shi, J.; Jia, J. Path aggregation network for instance segmentation. In Proceedings of the 2018 IEEE/CVF Conference on Computer Vision and Pattern Recognition (CVPR), Salt Lake City, UT, USA, 18–22 June 2018; pp. 8759–8768. [Google Scholar]
  20. Rezatofighi, H.; Tsoi, N.; Gwak, J.; Sadeghian, A.; Reid, I.; Savarese, S. Generalized intersection over union: A metric and a loss for bounding box regression. In Proceedings of the 2019 IEEE/CVF Conference on Computer Vision and Pattern Recognition (CVPR), Long Beach, CA, USA, 16–20 June 2019; pp. 658–666. [Google Scholar]
  21. Zheng, Z.; Wang, P.; Liu, W.; Li, J.; Ye, R.; Ren, D. Distance -IoU Loss: Faster and better learning for bounding box regression. AAAI Conf. Artif. Intell. 2020, 34, 12993–13000. [Google Scholar] [CrossRef]
  22. Yu, Y. Research on Neonatal Pain Expression Recognition Based on LBP-TOP Feature. Master’s Thesis, Nanjing University of Posts and Telecommunications, Nanjing, China, 2016. [Google Scholar]
  23. Zhao, G.; Pietikainen, M. Dynamic Texture Recognition Using Local Binary Patterns with an Application to Facial Expressions. IEEE Trans. Pattern Anal. Mach. Intell. 2007, 29, 915–928. [Google Scholar] [CrossRef] [PubMed] [Green Version]
  24. Zhao, T. Research on Key Technologies of Face Micro-Expression Recognition Based on Video. Master’s Thesis, Southeast University, Nanjing, China, 2018. [Google Scholar]
  25. Li, Q. Research on Micro-Expression Detection and Recognition Technology Based on Video. Master’s Thesis, Southeast University, Nanjing, China, 2017. [Google Scholar]
  26. Guo, C. Research on Spontaneous Facial Micro-Expression Recognition Method. Master’s Thesis, National University of Defense Technology, Changsha, China, 2019. [Google Scholar]
  27. Huang, G.B. An insight into extreme learning machines: Random neurons, random features and kernels. Cogn. Comput. 2014, 6, 376–390. [Google Scholar] [CrossRef]
  28. Ankur, S.; Tharo, S.; Kalyanmoy, D. Using Karush-Kuhn-Tucker proximity measure for solving bilevel optimization problems. Swarm Evol. Comput. 2019, 44, 496–510. [Google Scholar]
  29. Kennedy, J.; Eberhart, R. Particle Swarm Optimization. In Proceedings of the Icnn95-International Conference on Neural Networks, Perth, WA, Australia, 27 November–1 December 1995; IEEE: New York, NY, USA, 1995; Volume 4, pp. 1942–1948. [Google Scholar]
  30. Parsopoulos, K.E.; Vrahatis, M.N. Particle Swarm Optimization and Intelligence: Advances and Applications; IGI Global: Hershey, PA, USA, 2010; pp. 25–40. [Google Scholar]
Figure 1. Foam images from six performance states.
Applsci 13 04028 g001
Figure 2. 3-stage NSST multiscale decomposition of bubble image.
Applsci 13 04028 g002
Figure 3. Working condition 1: Three-dimensional display of bubble image.
Applsci 13 04028 g003
Figure 4. NSST-CNN network feature extraction model.
Applsci 13 04028 g004
Figure 5. (a) Schematic diagram of three orthogonal planes; (b) Each plane extends the neighborhood.
Applsci 13 04028 g005
Figure 6. Schematic diagram of LBP-TOP feature extraction. (a) an image in the XY plane, (b) an image in the XT plane, giving a visual impression of a row over time, and (c) the movement of a column in time space.
Applsci 13 04028 g006
Figure 7. PSO-RVFLNS algorithm flow.
Applsci 13 04028 g007
Figure 8. KRVFLNS condition recognition model combining CNN and LBP features; (a) NSST, RILBP feature map sequence extraction; (b) Multiple dimensional feature map sequence extraction; (c) Feature vector extraction.
Applsci 13 04028 g008
Figure 9. Recognition accuracy under different LBP parameters.
Applsci 13 04028 g009
Figure 10. The processing effect of different values.
Applsci 13 04028 g010
Figure 11. LBP-TOP texture feature diagram.
Applsci 13 04028 g011
Figure 12. Visualization results of CNN features.
Applsci 13 04028 g012
Figure 13. Curve of loss function.
Applsci 13 04028 g013
Figure 14. Accuracy of different activation functions.
Applsci 13 04028 g014
Figure 15. RVFLNS test output.
Applsci 13 04028 g015
Figure 16. PSO-RVFLNS test output.
Applsci 13 04028 g016
Figure 17. Performance recognition results of three modes. (a) Foam flotation condition identification combining multi-scale CNN and LBP features; (b) Multi-scale NSST-CNN condition identification; (c) LBP-TOP condition identification.
Applsci 13 04028 g017aApplsci 13 04028 g017b
Table 1. Accuracy of different activation functions and number of neurons.
Activation FunctionNumber of NeuronsAccuracy (%)
Hardlim35090.5
Sine30053.6
Sigmoid40091.1
Radial basis45081.2
Disclaimer/Publisher’s Note: The statements, opinions and data contained in all publications are solely those of the individual author(s) and contributor(s) and not of MDPI and/or the editor(s). MDPI and/or the editor(s) disclaim responsibility for any injury to people or property resulting from any ideas, methods, instructions or products referred to in the content.

