Article

Selection of Potential Regions for the Creation of Intelligent Transportation Systems Based on the Machine Learning Algorithm Random Forest

by
Aleksey I. Shinkevich
1,*,
Tatyana V. Malysheva
1 and
Irina G. Ershova
2
1
Logistics and Management Department, Kazan National Research Technological University, 420015 Kazan, Russia
2
Department of Finance and Credit, Southwest State University, 305040 Kursk, Russia
*
Author to whom correspondence should be addressed.
Appl. Sci. 2023, 13(6), 4024; https://doi.org/10.3390/app13064024
Submission received: 14 February 2023 / Revised: 15 March 2023 / Accepted: 20 March 2023 / Published: 22 March 2023
(This article belongs to the Special Issue Transportation Planning, Management and Optimization)

Abstract

:
The planning and management of traffic flow networks with multiple input data sources for decision-making generate the need for a mathematical approach. The program of measures for the development of the transport infrastructure of the Russian Federation provides for the selection of pilot regions for the creation of intelligent transportation systems. With extensive knowledge of theoretical and applied mathematics, it is important to select and adapt mathematical methods for solving problems. In this regard, the aim of the study is to develop and validate an algorithm for solving the problem of classifying objects according to the potential of creating intelligent transportation systems. The main mathematical apparatus for classification is the «random forest» machine learning algorithm method. A bagging machine learning meta-algorithm for high accuracy of the algorithm was used. This paper proposes the author’s method of sequential classification analysis for identifying objects with the potential to create intelligent transportation systems. The choice of using this method is justified by its best behavior under the large number of predictor variables required for an objective aggregate assessment of digital development and quality of territories. The proposed algorithm on the example of Russian regions was tested. A technique and algorithm for statistical data processing based on descriptive analytics tools have been developed. The quality of the classification analysis algorithm was assessed by the random forest method based on misclassification coefficients. The admissibility of retrained algorithms and formation of a «fine-grained» «random forest» model for solving classification problems under the condition of no prediction was proven to be successful. The most productive models with the highest probability of correct classification were «reached» and «finalized» on the basis of logistic regression analysis of relationships between predictors and categorical dependent variables. The regions of class 1 with «high potential for the creation of intelligent transportation systems» are most likely to be ready for the reorganization of infrastructure facilities; the introduction of digital technologies in the management of traffic flows was found.

1. Introduction

The importance of creating intelligent transportation systems lies in the regulation of traffic flows, providing users of transport networks with information and security, and improving the quality of traffic participants compared to conventional transportation systems [1,2,3,4]. Intelligent transportation systems make it possible to automate the process of traffic control [5], create a system of photo and video recording of violations of traffic rules [6], automate the weight and size control of cars, organize the work of toll highways [7], organize the work of parking spaces [8], perform meteorological monitoring, and automatically regulate the lighting of highways [9]. In this regard, the issues of creating intelligent transportation systems are relevant and require study based on big data and modern mathematical approaches [10,11,12].
With the increasing volume of information in various fields of applied science and practice, public administration, and industrial production, there is a high demand for intelligent data analysis. The management of complex processes and networks of traffic flows generates the relevance of creating intelligent transportation systems. In this case, improving the efficiency of material flows directly depends on the development of transport infrastructure, the quality of the transport network, and the level of management technology.
The creation of intelligent transportation systems envisages the automation of road traffic control processes in urban agglomerations with a population of over 300 thousand people. The implementation of the project envisages significant financial investments for the development of transport and production infrastructure and other activities, which requires the correct selection of pilot territories. For this purpose, the task has been set to identify the regions with the greatest potential for the creation of intelligent transportation systems.
The issues of creating intelligent transportation systems are widely studied in foreign and domestic literature. Modern aspects of the design and implementation of intelligent transportation systems are outlined in the book by R. Dushkin, a Russian specialist in artificial intelligence technology [13,14]. In foreign scientific publications, the problems of road safety and reliability of automobile networks by means of intellectual transportation systems are considered [15,16,17], and technology for traffic monitoring and event information are proposed [18,19].
In particular, Zhang X. and coauthors investigated security in the cyber-physical system of a vehicle using blockchain knowledge [20]. Alanazi F. conducted an extensive literature review on autonomous and connected vehicles in traffic management [21]. Wu S. et al. studied dynamic scheduling and AGV optimization in manufacturing logistics systems based on the digital twin [22]. Wang S. and the research team modeled a neural network with inverse convolution to predict traffic flow in the frequency domain [23]. Mohammed G.P. and coauthors predicted traffic flows using Pelican optimization with a hybrid network of deep trust in smart cities [24].
Under the leadership of Ahmed Hamza M., a hyperparametric deep autocoding model was built for a road classification model in intelligent transportation systems [25]. Petrov T., Pocta P., and Kovacikova T. carried out a comparative analysis of cellular communications based on 4G and 5G-V2X for transport infrastructure and urban scenarios in collaborative intelligent transportation systems [26]. An approach to assessing cyber-physical risks for transport infrastructure with the support of the Internet of Things was developed by Ntafloukas K., McCrum D.P., and Pasquale L. [27]. Behrooz H. and Hayeri Y.M. studied machine learning applications in ground transportation systems [28].
One of the artificial intelligence algorithms can be an adequate tool for classifying objects according to a number of features. In terms of the development of artificial intelligence, the literature has explored the use of data mining technologies to evaluate intelligent transportation systems [29]. The technological aspects of blockchain applications for transport networks have been reviewed [30,31]. Researchers and practitioners have investigated the use of the Internet of Things for the automotive sensor network, industrial transport [32,33], and spatiotemporal visual analysis of urban traffic characters from CCTV data [34,35,36].
Decision tree methods and algorithms are quite widely used in applied classification problems. They are used to making decisions for the modernization of production processes [37,38,39], improving the environmental friendliness of the industry [40,41,42], and aircraft manufacturing [43]. Random forest-based classification algorithms play a significant role in the banking and financial sectors to ensure the security of work processes, customer identification, and other needs [44,45,46].
«Random forest» classification analysis techniques in market research and social media management [47,48,49,50] are relevant. A large body of work is devoted to the use of machine learning algorithms in medicine for disease diagnosis, the detection of viral infections, and drug monitoring [51,52,53]. The fields of applied mathematics, statistics, and computer science have also extensively developed the apparatus of decision tree methods and algorithms with the flexibility to solve almost any machine learning problem: classification, regression, as well as more complex outlier and anomaly search problems [54,55].
However, despite the availability of extensive theoretical and practical material, certain issues surrounding the use of machine learning algorithms for solving problems in public administration remain unexplored. In particular, it is the creation and development of intelligent transportation systems, including the problems of integration of automated control systems into a single space based on digital technology. Not all developments take into account the specifics of regions as sociotechnical systems with individual features of basic development.

2. Methodology

Data mining technologies were used to assess the potential for creating intelligent transportation systems in the regions. In particular, the method from the «classification trees» group, suitable for a wide range of tasks, is applied to solve the task of classifying objects in order to objectively select potentially capable regions for the development of the integration platform and obtain a high response from investments in the framework of targeted programs. When making a decision using the classification tree method, the values of multiple predictor variables are taken into account simultaneously. Moreover, in contrast to discriminant analysis, the consideration of variables is performed recursively or as the hierarchy is built. The consistent study of the effects of variables and the possibility of using both continuous and categorical predictors for branching make the classification tree method somewhat flexible. Nonessential constraints on the way in which the predictor variable is measured are imposed.
In order to obtain a more reliable classification by reducing the variance of the data, the random forest method, which consists of the use of an ensemble classification method of solver trees, namely the composite learning meta-algorithm of bagging machines, was used. The basic idea is to use a large ensemble of solver trees, each of which by itself is of low classification quality, but at the expense of a large number of trees, the result is good.
Training the classifiers independently on different subsets of the training sample conducted, as a result of the classification, the object is assigned to the class voted for by the majority of the trees, provided that each tree has one vote.
The authors have developed a methodology that includes a sequence of mathematical and logical procedures for selecting pilot regions to implement a large-scale investment project to develop a smart transport and logistics network. The algorithm of the author’s methodology for solving the problem of classifying objects according to their potential for creating intelligent transportation systems using the random forest machine-learning method in Figure 1 is presented. Below, we will describe each step of the procedure.
Step 1: In the first step, the task of classification analysis is set, taking into account the initial database—parameters of the digital development of the regional network x (x = [1, p]) by objects a (a = [1, r]). Six indicative indicators of state statistics are developed as initial parameters:
  • X1a—share of digitalization of telecommunication networks in region a:
X 1 a = T d i g a T a l l a , a = [ 1 , r ]
where
  • Tdiga—is the number of digital nodes in the telecommunication network in the region,
  • Talla—is the total number of nodes in the telecommunication network in the region;
  • X2ais the gross product per capita in the region:
X 2 a = V p a P a   , a = [ 1 , r ]
where
  • Vpa—is the gross domestic product of the region.
  • Pa—population in the region;
  • X3a—proportion of digitalization of the regional telephone network:
X 3 a = C d i g a C a l l a ,   a = [ 1 , r ]
where
  • Cdiga—is the number of digital nodes in the telephone network in the region,
  • Calla—is the total number of nodes in the telecommunication network in the region;
  • X4a—is the share of investment in the reconstruction and modernization of infrastructure in the total investment in fixed capital:
X 4 a = I i n f a I a l l a ,   a = [ 1 , r ]
where
  • Iinfa—is the amount of investment for the reconstruction and modernization of infrastructure in the region,
  • Iinfa—is the total amount of investment in the region,
  • X5a—is the proportion of public roads that meet regulatory requirements:
X 5 a = R n o r m a R a l l a , a = 1 , r ,
where
  • Rnorma—is the length of the public roads that meet regulatory requirements,
  • Ralla—is the total length of public roads in the region,
  • X6a—is the proportion of nondepreciated fixed assets in transport, communications, and information:
X 6 a = F a n a F a l l a ,   a = [ 1 , r ]
where
  • Fana—is the value of nondepreciated fixed assets in transport, communications, and information in the region
  • Falla—total value of fixed assets in transport, communications, and information in the region.
Step 2: Verification of data through statistical processing and selection of variables for random forest classification analysis: categorical dependent variable (Pc_dep), categorical (Pc), and continuous (Pu) predictors.
Data processing can be implemented on the basis of the calculation and analysis of descriptive statistic indicators: sampling variance (Sv), standard error (Es), standard deviation (Ds), mean (Av), kurtosis (Ex), asymmetry (As), interval (Int), minimum (Min), maximum (Max), and number of objects (Ra). The calculation of the indicators according to generally accepted methods of statistical data analysis is carried out.
As a key indicator affecting the choice of variables, we will take the sample variance (Sv), calculated as the deviation of the sample data from the mean:
S y = ( x i x a v ) 2 ( n 1 )
where
  • Xav is the sample average of the indicator;
  • Xi is the i-th element of the sampling frame for the indicator;
  • n is the size of the sampling frame for the indicator.
The variance indicates how much the data of a sample population deviate from its mean. Accordingly, the greater the variance, the greater the dispersion of the data. Let us set the following condition for moving the baseline indicator (X1–X6) into the category of a variable for classification analysis: if the sample variance (Sv) deviates from the mean (Av) by more than 10 times, the baseline indicator Xi cannot participate in the classification analysis of the «random forest»:
i f   S v x A v x > 10 ,   t h e n   x P c d e p , P c , P u .
In contrast, in this condition, the indicator Xi can participate in «random forest» classification analysis as a variable.
Step 3. The next step is the key step, where the random forest algorithm by the ensemble bootstrap method is implemented. This step consists of five sequential procedures.
3.1. Define the basic parameters for classifying objects:
the number of trees (t),
is the number of set parameters to select splitting (n_ss),
maximum tree depth (max_ td),
splitting criterion (Cr).
The Gini criterion (Gt) is used as the criterion for splitting treetops when solving the classification problem:
G t = 1 j = 1 v P 2 ( Y h )
where P (Yh) is the specific weight of objects of class Yh in the subsample of tree nodes t, h = [1, v].
3.2. For each tree (t) from the training sample, a subsample Zt, containing St objects is generated. The formation of a subsample Zt is carried out on the basis of a random selection with a possible repetition of objects. As a result of the described procedure for each tree (t), a subsample of object Zt is formed.
3.3. Splitting of the constructed t-trees is performed. For each split, n_ss numbers of features or variables in the tree are considered. Then, the most informative variable, for which the treetop is split according to the criterion Cr, is selected. When the Gini index is applied, the optimal one is the splitting of the treetop, for which the value of the criterion is minimal. According to Formula (9), in binary classification, the quality index of splitting is evaluated as follows:
G t s p l i t = N 1 N G t 1 + N 2 N G t 2 m i n
where
  • N—is the number of objects in the current tree node t (the «parent» node);
  • N1 and N2—are the numbers of objects in vertices t1 and t2, corresponding to the left and right vertices (node «daughter») in the case of a binary tree.
3.4. In the final step, the tree (t) is traversed until the subsample Ztf is exhausted, i.e., until a single representative is at the top of the tree built.
3.5. The final classifier «random forest» a(Ztf) selects the solution according to the majority of votes of the constructed decision trees:
a z r f = s i g n j = 1 r b ( z t f )
where
  • a(Ztf)—is the solution of the final classifier of the j-th tree t (j = 1, t);
  • b(Ztf)—is the solution of the base classifier of the j-th tree (j = 1, t);
  • sign—is a function that returns the sign of its argument.
Step 4: The next step is to evaluate the quality of the random forest classification analysis algorithm: the misclassification error rate (Kmr), risk assessment for the training, and test samples (Ar):
A r = 1 P r s P s ,
where
  • Ar—is an estimate of the risk of the object classification error;
  • Prs—is the number of cases correctly classified by the tree;
  • Ps—is the total number of times the objects are classified (sample size).
Step 5: The final step is to derive the results of the «random forest» classification of regions according to their level of capacity for building intelligent transportation systems. The procedure involves three steps.
5.1. Formation of a region distribution matrix for the number of decisive trees t with the lowest risk of misclassification. In the case of a classification analysis of regions, the optimal number of trees in a random forest is 300.
5.2. Outputting the final data on the classes of regions according to the level of intelligent transportation system capacity and their parameters. For this purpose, the most informative predictors with respect to the categorical dependent variable based on the Gini tree node splitting criterion Gt are identified (in the case of our analysis, these are Pu3, Pu4, and Pu5).
5.3. The utility of random forest models is estimated for the levels of the categorical dependent variable Pc dep by constructing cumulative lift diagrams. The charts represent a logistic regression to analyze the relationship between predictors and the categorical dependent variable.
An analysis of the magnitude of the lift of the curve or the area between the lift line and the baseline results in a conclusion about the level of productivity and the probability of correct classification of the resulting classification models. This completes the classification analysis task.
To implement the decision tree method, the software package Statistica, which implements intelligent data analysis functions, was used.

3. Results

3.1. Statistical Processing of Raw Data

The digitalization of transport flows requires the integration of all local subsystems into a single organizational set. The effect of the integrated digitalization of transportation systems could be an increase in the efficiency of the overall management system of the territorial unit due to the information interaction of all subsystems in the places where business processes are linked. In our view, a certain level of digitalization of the territory and the level of technical and technological readiness of the transportation industry are required to create an intelligent system.
In this regard, based on the bagging techniques of the random forest (classification analysis), the potential for creating an integration platform in sociotechnical systems is assessed. The studied data set or objects of classification are regions (a = [1, r], where r = 84) as administrative units, characterized by a certain level of development of digital technology and industrial and social infrastructure [20].
Under the conditions of classification analysis, we assume an equal number of misclassification costs (misclassification cost = equal across categories), i.e., the misclassification cost matrix, in this case, will be symmetric. We will take the a priori probability distribution of the value, as the probability that the object falls into one of the classes is proportional to the size of the classes of the dependent variables (prior probability = estimated). The costs of misclassification are combined with the a priori probabilities in calculating the classification probabilities during estimation.
In order to carry out intelligent data analysis, a database of state statistical indicators is formed with the following parameters as the key:
X1 is the share of digitalization of telecommunication networks in the region;
X2 is the gross domestic product per capita in the region;
X3 is the proportion of digitalization of the regional telephone network;
X4 is the share of investment in the reconstruction and modernization of infrastructure in total investment in fixed assets;
X5 is the proportion of public roads that meet regulatory requirements;
X6 is the share of nondepreciated fixed assets in transportation, communications, and information.
In order to verify the data, a descriptive analysis of the sample indicators was carried out. The statistical processing of empirical data, their systematization, and their quantitative description allowed us to identify variables that are adequate to the conditions for the input data of the random forest ensemble using the machine learning method (Table 1). The X2—gross domestic product per capita in the region—has a high sampling variance that does not meet the given condition (8) (Sv = 5439.97 × 108). Standard deviation (Ds = 737,562.14) and standard error (Es = 80,474.63) were excluded from the input data.
The result of data verification is the choice of variables for the classification analysis. Given the random forest conditions denoting the mandatory presence of categorical variables, the indicator X2—gross domestic product per capita in the region—is transformed from a quantitative expression into a qualitative text-independent variable—the standard of living of the population in the region (Pc1).
Thus, the dependent categorical variable Pc_dep as the level of digitalization of telecommunication networks in the sociotechnical system is taken (text variable: achieved, finalized, precompleted, and projected). The independent categorical and continuous predictors are as follows:
Pc1 is the standard of living of the population in the region (average per capita gross product) (text variable: high, medium, or low);
Pu2 is the share of digitalization of the regional telephone network;
Pu3 is the share of investment in the reconstruction and modernization of infrastructure in total investment in fixed assets;
Pu4 is the proportion of public roads that meet regulatory requirements;
Pu5 is the share of nonwearing fixed assets in transportation, communications, and information.

3.2. Quality Assessment of the Random Forest Machine Learning Algorithm

The following presents the results of the quality assessment of the random forest classification analysis algorithm. Figure 2 shows graphs of the misclassification coefficients (Kmr) for successive steps of adding trees. Initially, the number of trees, tmax = 100, is given. The graphs show lines for training data and test data. As can be seen, it took at least 85 trees to achieve the lowest misclassification rate (Kmr0.5). This result is close to the prediction model with the best predictive validity.
However, in the test samples for all variants of the investigated sets of decision trees in «random forest» (tmax = 50, 100, 150, 200, 250, 300, and 400) there is almost a 50% risk of misclassification of trees (interval Ar = (0.471651; 0.579786). Table 2 presents the risk estimation for the training and test samples. For our classification problem, where the condition is the presence of a categorical dependent variable (Pc_dep—level of digitization of telecommunication networks) and equal misclassification costs, the risk as the fraction of cases misclassified by trees is calculated.
The high value of the risk score and the significant difference in the error probability of the trained algorithm on the test sample objects compared to the training sample is probably indicative of the low generalizability of the learning algorithm due to overtraining. Note that machine learning researchers have indicated that samples with high noise or a given data set make the random forest model prone to overtraining [22,44]. In our case, the reason for overtraining is the high complexity of the model due to the unknown stochastic relationship between the objects (predictors) and the response (dependent categorical variables).
Retraining the algorithm means taking a large amount of information from the raw data and using it in the model. In our problem, five predictors are used in the model: categorical Pc1 and continuous Pu2–Pu5. The three numerical continuous predictors (Pu3, Pu4, and Pu5) are highly correlated with the dependent categorical variable Pc_dep and show an importance (informativeness) of over 0.9 (Pu5 = 1.0; Pu4 = 0.99; and Pu3 = 0.95). The informativeness of the predictor Pu2 is moderate at 0.57. Most of the bagging trees use the strong predictors Pu3–Pu5 at their bases. Consequently, most «random forest» trees are similar, and the classification results are highly correlated.
The resulting random forest model can be characterized as «fine-grained», where a large number of variables can lead to complex processing. At the same time, there are no complex models and overfitting algorithms in classification problems, as in this case, which can be erroneous and tolerated. Additionally, taking into account the large number of input data on the situation in the regions is very important when solving management tasks of territorial development and the allocation of financial resources. The optimal value of trees tmax = 300, due to the lowest estimate of the risk of misclassification.
Thus, we believe that the resulting model is adequate for the task of classifying regions according to the probability of developing intelligent transportation systems.

3.3. Classes of Regions According to the Level of Capacity for Building Intelligent Transportation Systems Using the Random Forest Method

As a result of performing all the sequential procedures of constructing a random forest with the number of decision trees t = 300, a given sample of regions is classified into four groups—classes according to the level of capacity to create intelligent transportation systems (ITS) (Table 3). The classification is carried out according to the most informative continuous predictors (Pu3, Pu4, and Pu5) and the dependent categorical variable by voting, where the choice is made on the basis of the highest number of votes (trees) attributing to the classified object to one of the classes.
Class 1, with «high potential for establishing intelligent transportation systems» includes 21 regions with a completed process of digitalization of telecommunication networks in the region, i.e., Pc_dep = 100%. The average values of the variables Pu3, Pu4, and Pu5 per class are 18.90%, 44.80%, and 42.16%, respectively.
Class 2, with an «average intelligent transportation system capacity» comprises 52 regions with a telecom network digitalization share of 95.0% < Pc_dep < 100.0%. The average values of the variables Pu3, Pu4, and Pu5 across the classes are 19.20%, 42.70%, and 41.03%, respectively.
Class 3, with a «low potential for establishing intelligent transportation systems» includes 20 regions with a share of 90.0% < Pc_dep < 95.0% of the digitization of telecommunication networks. The average values of the variables Pu3, Pu4, and Pu5 across the classes are 19.90%, 47.50%, and 37.49%, respectively.
Class 4, “Establishment of intelligent transportation systems is not feasible” includes seven regions with a share of digitalization of telecommunication networks Pc_dep < 90.0. The average values of variables Pu3, Pu4, and Pu5 per class are 18.30%, 46.60%, and 40.72%, respectively.
The distribution matrix of the regions by the random forest method with the number of decision trees t = 300 is shown in Table 4.
The data obtained provide objective information for making decisions on the participation of regions in the pilot project for the creation of intelligent transportation systems. Regions of Class 1 with «high potential for the creation of intelligent transportation systems» are most likely to have high readiness in reorganizing infrastructure facilities and introducing digital technologies in the management of traffic flows.
To confirm the above, cumulative lift charts were constructed to evaluate the utility and performance of the random forest model on the levels of the categorical dependent variable Pc_dep «level of digitalization of telecommunication networks in a sociotechnical system». The charts reflect a logistic regression to analyze the relationship between the predictors Pc1, Pu2–Pu5, and the categorical dependent variable Pc_dep (Figure 3).
Logistic regression is a special case of the linear classifier random forest a(ztf) and has the ability to estimate the probability of assigning an object to a class. The observations in the diagram in descending order of predicted probability are ordered. The rising curve shows the ratio of the number of positive observations to the expected number of positive outcomes based on the random model. The rise on the Y-axis corresponds to the k-th percentile on the X-axis, which allows us to estimate the frequency distribution of the observations. The Y-axis is a multiplier of the underlying random choice model expressed.
The largest lift in the curve was observed at the Pc_dep «prefinal» and «project» variable levels, where the Y-axis values at the first 10 percent reached 4.6 and 5.5, respectively. However, these models show a significant drop in the lift curve after 20–30% and a lower probability of classification.
Compared to the «prefinal» and «project» charts, in the Pc_dep «reached» and «final» charts, the angle of the lift line is closer to 45°. Accordingly, the area between the lift line and the baseline is the largest, which characterizes these models as the most productive, with the highest probability of correct classification.

4. Conclusions

Thus, in the process of solving the problem of classifying objects according to the potential of creating intelligent transportation systems using the random forest machine learning algorithm, the following scientific and practical results were obtained:
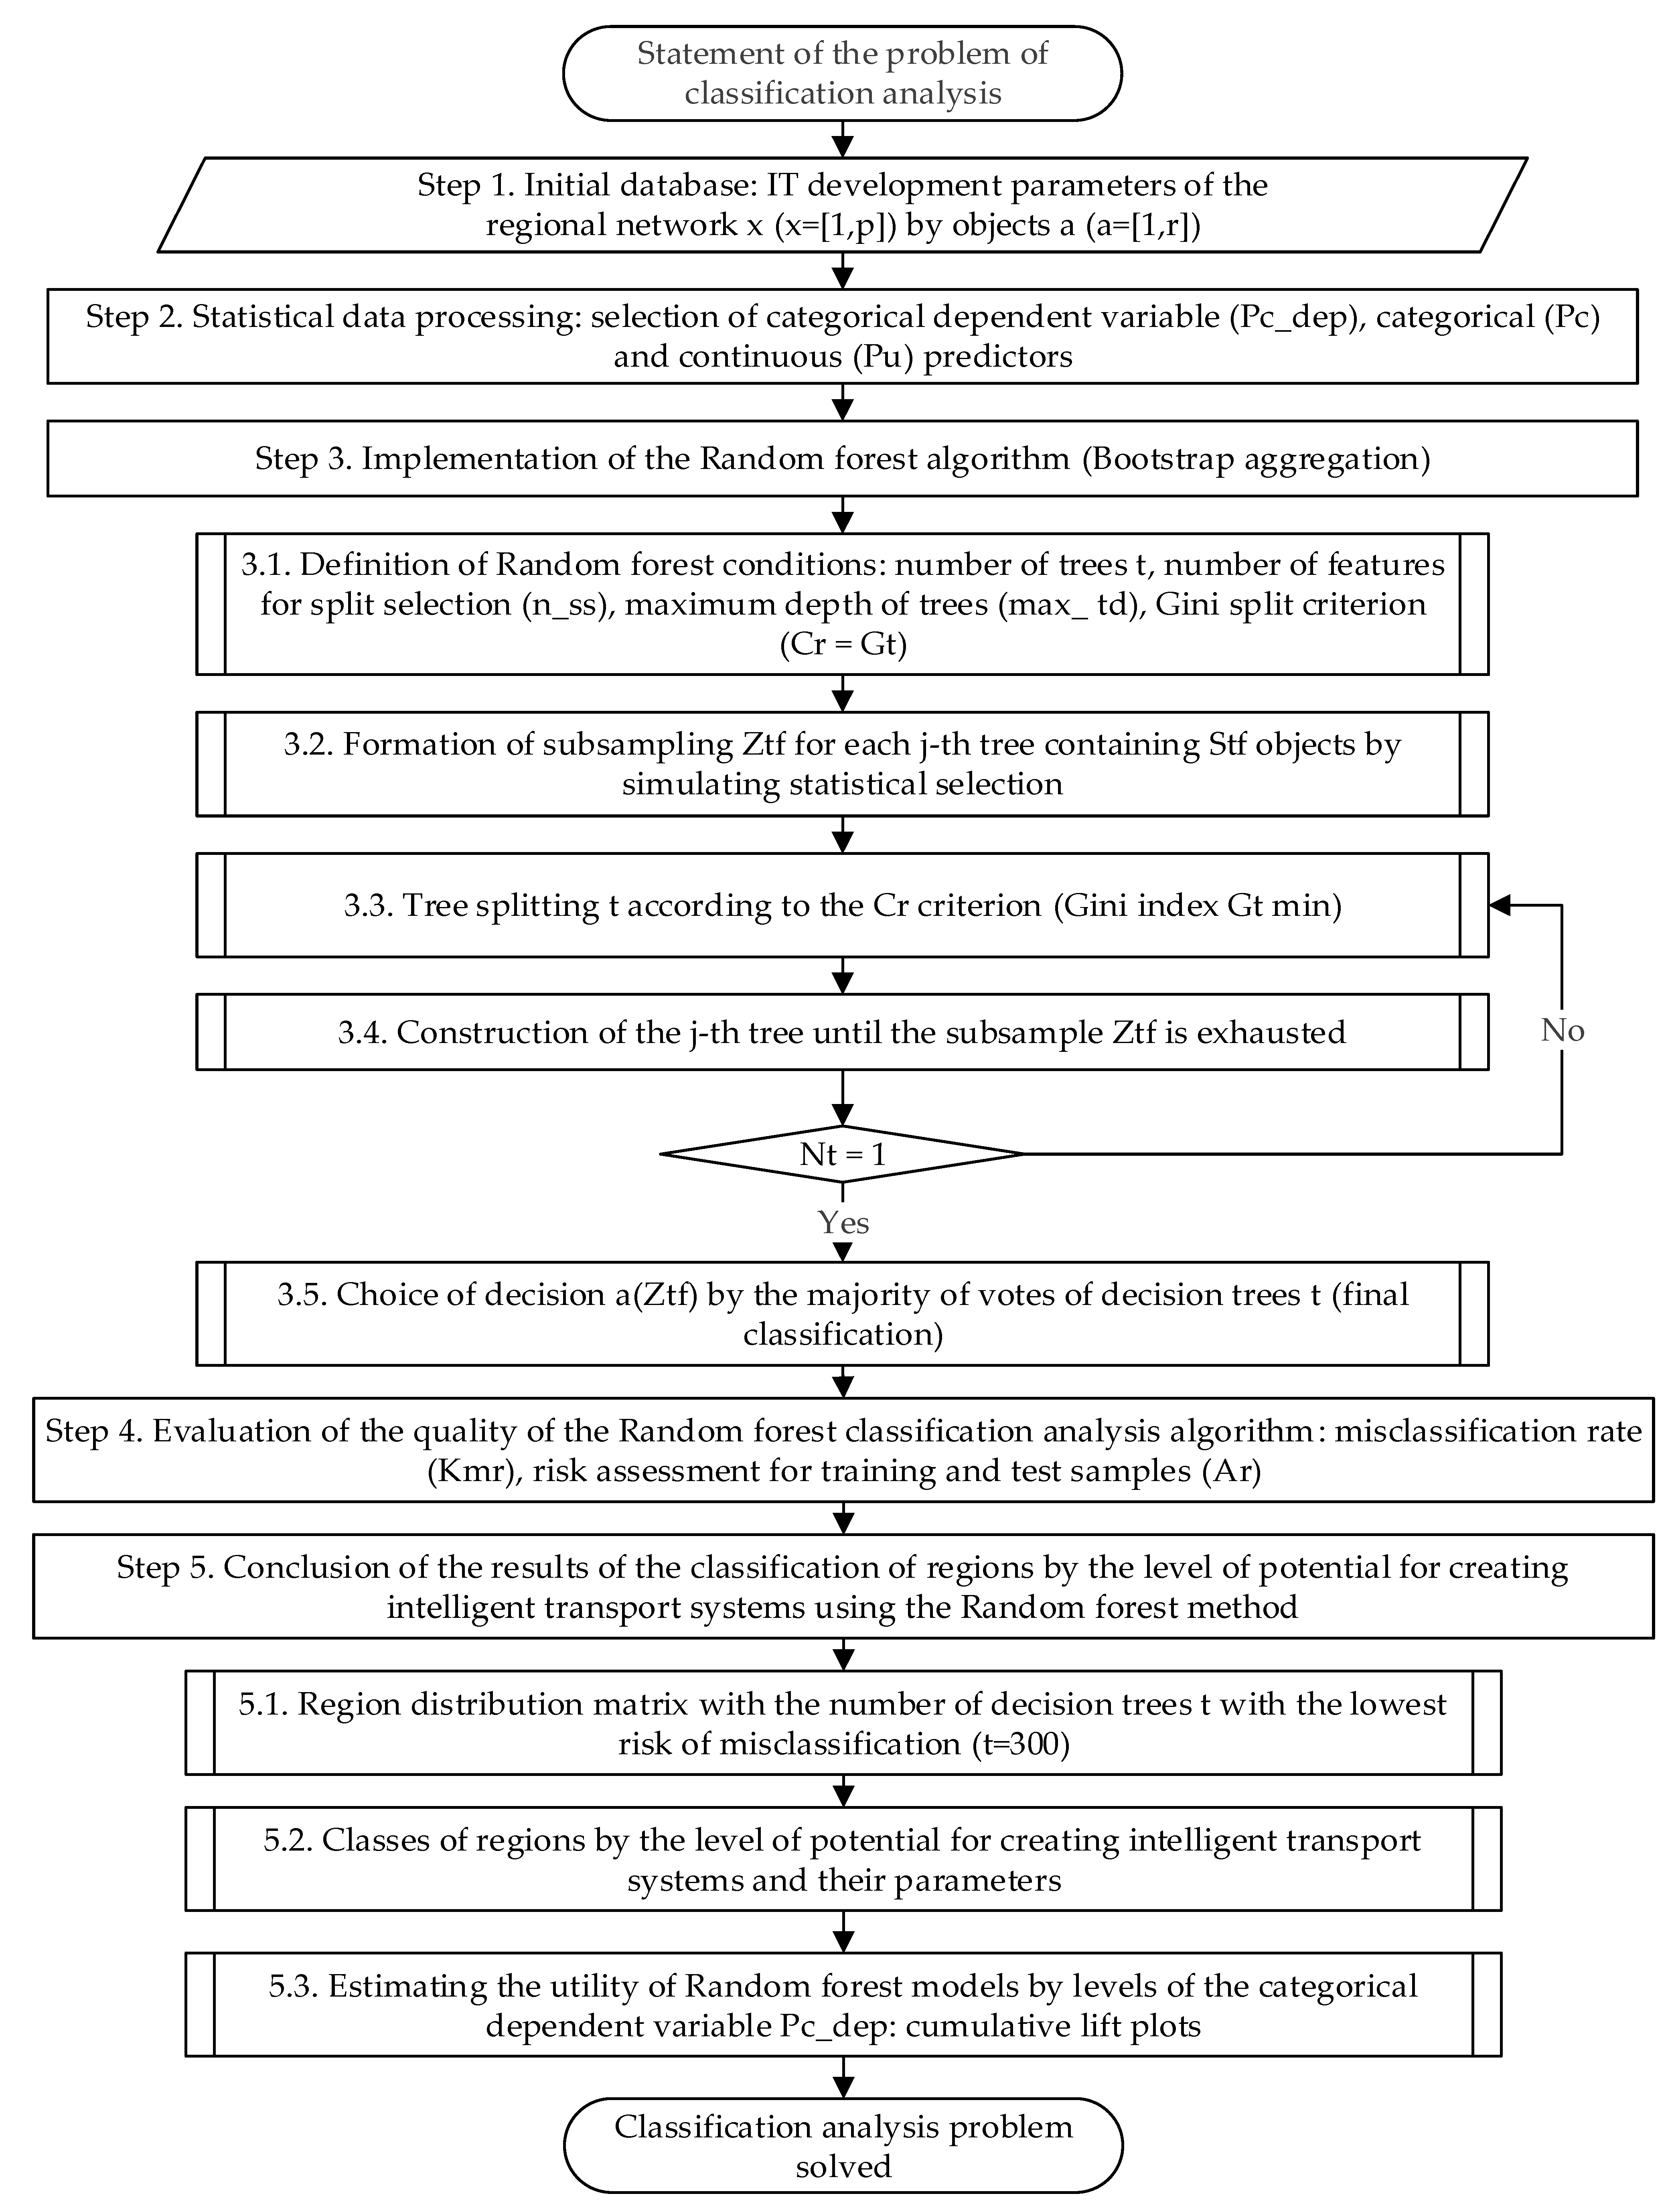
  • The author’s methodology for sequential classification analysis for identifying objects with the potential to create intelligent transportation systems is proposed. The methodology is based on the random forest method of classifying trees using a bagging machine and a composite learning meta-algorithm. The choice of the method is justified by its best behavior, with a large number of predictor variables required for an objective aggregate assessment of digital development and the quality of territories. For the convenience of potential users, the method is presented as an algorithm of five key procedures: (1) setting the analysis task and forming the initial database; (2) statistical data processing based on descriptive analytics; (3) step-by-step implementation of the random forest algorithm by the ensemble bootstrap aggregation method; (4) quality assessment of the classification analysis algorithm based on the misclassification error rate and risk assessment for training and test samples; and (5) the output of the random forest method classification of regions by the level of intelligent transportation system creation potential.
  • The proposed classification analysis algorithm is demonstrated using the example of selecting Russian regions for the creation of intelligent transportation systems. The procedure for statistical data processing based on descriptive analytics is shown. Continuous and classification predictors for random forest machine learning are defined from the set of basic indicators, taking into account the conditions of sample variance established in the methodology: Pc1—living standard of the population in the region; Pu2—share of digitalization of the regional telephone network; Pu3—share of investments aimed at reconstruction and modernization of the infrastructure in total investment in fixed capital; Pu4—share of public roads that meet regulatory requirements; and Pu5—the share of depreciated fixed assets in transport, communications, and information.
  • The quality of the classification analysis algorithm is evaluated by the random forest method based on the misclassification coefficients. Analysis of the coefficients for all variants of the studied sets of solving trees (tmax = 50, 100, 150, 200, 250, 300, and 400) showed a low generalization ability of the learning algorithm due to its retraining. The reason for overtraining is the high complexity of the model due to the large amount of information, as well as the stochastic relationship between the predictors and the dependent categorical variable. The admissibility of retrained algorithms and the formation of the «fine-grained» random forest model for solving the classification problems under the condition of no prediction is proven. The optimal value of trees, tmax = 300, is established in view of the smallest estimate of the risk of misclassification.
  • As a result of performing all the sequential procedures for constructing a random forest with the number of decision trees t = 300, the given sample of regions is classified into four classes according to the most informative continuous predictors (Pu3, Pu4, and Pu5). The classes formed by certain standards for the values of intelligent transportation system capacity are characterized. The numerical distribution of the population of regions in the form of a matrix is presented. The cumulative lift diagrams to assess the probability of assigning an object to a class, utility, and performance of random forest class models are constructed. Based on logistic regression analysis of the relationship between predictors and the categorical dependent variable, the Pc_dep «reached» and Pc_dep «finalized» models obtained are the most productive with the highest probability of correct classification.
The data obtained provide objective information for making decisions on the participation of regions in the pilot project for the creation of intelligent transportation systems. Regions of Class 1 with «high potential for the creation of intelligent transportation systems» are most likely to have high readiness for reorganizing infrastructure facilities and introducing digital technologies into the management of traffic flows.
The results can be used by government officials, design engineers, and academics to design programs for the development of intelligent transportation systems as part of the national project «Safe and Quality Roads», involving the automation of road traffic control processes.

Author Contributions

Conceptualization, A.I.S.; methodology, T.V.M.; formal analysis, I.G.E.; investigation, A.I.S. and T.V.M.; data curation, I.G.E.; writing—original draft preparation, A.I.S. and T.V.M.; writing—review and editing, A.I.S. and T.V.M. All authors have read and agreed to the published version of the manuscript.

Funding

This research received no external funding.

Acknowledgments

The research was carried out within the framework of the Russian Federation President’s grant for state support of leading scientific schools in the Russian Federation. Project number NSh–1886.2022.2.

Conflicts of Interest

The authors declare no conflict of interest.

References

  1. Alex, C.; Pierre-Olivier, V.; Romain, N. Enhancement of Vehicle Eco-Driving Applicability through Road Infrastructure Design and Exploitation. Vehicles 2023, 5, 367–386. [Google Scholar] [CrossRef]
  2. Cao, B.; Shahraki, A.A. Planning of Transportation Infrastructure Networks for Sustainable Development with Case Studies in Chabahar. Sustainability 2023, 15, 5154. [Google Scholar] [CrossRef]
  3. Kim, D.; Kwon, D.; Han, J.; Lee, S.M.; Elkosantini, S.; Suh, W. Data-Driven Model for Identifying Factors Influencing Electric Vehicle Charging Demand: A Comparative Analysis of Early- and Maturity-Phases of Electric Vehicle Programs in Korea. Appl. Sci. 2023, 13, 3760. [Google Scholar] [CrossRef]
  4. Wang, J.; Yang, X.; Kumari, S. Investigating the Spatial Spillover Effect of Transportation Infrastructure on Green Total Factor Productivity. Energies 2023, 16, 2733. [Google Scholar] [CrossRef]
  5. De Fabiis, F.; Mancuso, A.C.; Silvestri, F.; Coppola, P. Spatial Economic Impacts of the TEN-T Network Extension in the Adriatic and Ionian Region. Sustainability 2023, 15, 5126. [Google Scholar] [CrossRef]
  6. Efron, B. Resampling Plans and the Estimation of Prediction Error. Stats 2021, 4, 1091–1115. [Google Scholar] [CrossRef]
  7. Mohammed, G.P.; Alasmari, N.; Alsolai, H.; Alotaibi, S.S.; Alotaibi, N.; Mohsen, H. Autonomous Short-Term Traffic Flow Prediction Using Pelican Optimization with Hybrid Deep Belief Network in Smart Cities. Appl. Sci. 2022, 12, 10828. [Google Scholar] [CrossRef]
  8. Malysheva, T.; Shinkevich, A.; Ostanin, L.; Zhandarova, L.; Muzhzhavleva, T.; Kandrashina, E. Organization challenges of competitive petrochemical products production. Espacios 2018, 39, 28. [Google Scholar]
  9. Quessada, M.; Pereira, R.; Revejes, W. ITSMEI: An intelligent transport system for monitoring traffic and event information. Int. J. Distrib. Sens. Netw. 2020, 16, 1550147720963751. [Google Scholar] [CrossRef]
  10. Andrade, J.L.; Valencia, J.L. A Fuzzy Random Survival Forest for Predicting Lapses in Insurance Portfolios Containing Imprecise Data. Mathematics 2022, 11, 198. [Google Scholar] [CrossRef]
  11. Makond, B.; Pornsawad, P.; Thawnashom, K. Decision Tree Modeling for Osteoporosis Screening in Postmenopausal Thai Women. Informatics 2022, 9, 83. [Google Scholar] [CrossRef]
  12. Rajawat, A.S.; Goyal, S.B.; Bedi, P.; Verma, C.; Ionete, E.I.; Raboaca, M.S. 5G-Enabled Cyber-Physical Systems for Smart Transportation Using Blockchain Technology. Mathematics 2023, 11, 679. [Google Scholar] [CrossRef]
  13. Ahmed Hamza, M.; Alqahtani, H.; Elkamchouchi, D.H.; Alshahrani, H.; Alzahrani, J.S.; Maray, M.; Ahmed Elfaki, M.; Aziz, A.S.A. Hyperparameter Tuned Deep Autoencoder Model for Road Classification Model in Intelligent Transportation Systems. Appl. Sci. 2022, 12, 10605. [Google Scholar] [CrossRef]
  14. Alanazi, F. A Systematic Literature Review of Autonomous and Connected Vehicles in Traffic Management. Appl. Sci. 2023, 13, 1789. [Google Scholar] [CrossRef]
  15. Zadobrischi, E.; Dimian, M. Vehicular Communications Utility in Road Safety Applications: A Step toward Self-Aware Intelligent Traffic Systems. Symmetry 2021, 13, 438. [Google Scholar] [CrossRef]
  16. Kaja, H.; Beard, C. A Multi-Layered Reliability Approach in Vehicular Ad-Hoc Networks. Int. J. Interdiscip. Telecommun. Netw. 2020, 12, 132–140. [Google Scholar] [CrossRef]
  17. Mohapatra, S.; Mohanachandran, D.; Dwivedi, G.; Kesharvani, S.; Harish, V.S.K.V.; Verma, S.; Verma, P. A Comprehensive Study on the Sustainable Transportation System in India and Lessons to Be Learned from Other Developing Nations. Energies 2023, 16, 1986. [Google Scholar] [CrossRef]
  18. Zhang, X.; Han, D.; Zhang, X.; Fang, L. Design and Application of Intelligent Transportation Multi-Source Data Collabora-tion Framework Based on Digital Twins. Appl. Sci. 2023, 13, 1923. [Google Scholar] [CrossRef]
  19. Almalaq, A.; Albadran, S.; Mohamed, M.A. Deep Machine Learning Model-Based Cyber-Attacks Detection in Smart Power Systems. Mathematics 2022, 10, 2574. [Google Scholar] [CrossRef]
  20. Wang, S.; Zhang, Y.; Fu, E.; Tang, S. Multiscale Backcast Convolution Neural Network for Traffic Flow Prediction in The Frequency Domain. Appl. Sci. 2022, 12, 11912. [Google Scholar] [CrossRef]
  21. Subramani, N.; Easwaramoorthy, S.; Mohan, P.; Subramanian, M.; Sambath, V. A Gradient Boosted Decision Tree-Based In-fluencer Prediction in Social Network Analysis. Mathematics 2023, 7, 6. [Google Scholar]
  22. Hastie, T.; Tibshirani, R.; Friedman, J. The Elements of Statistical Learning, 2nd ed.; Springer: New York, NY, USA, 2009; p. 533. [Google Scholar]
  23. Al-Turjman, F.; Lemayian, J. Intelligence, security, and vehicular sensor networks in internet of things (IoT)-enabled smart-cities: An overview. Comput. Electr. Eng. 2020, 87, 106776. [Google Scholar] [CrossRef]
  24. Lin, T.-H.; Jiang, J.-R. Credit Card Fraud Detection with Autoencoder and Probabilistic Random Forest. Mathematics 2021, 9, 2683. [Google Scholar] [CrossRef]
  25. Khoei, T.T.; Ismail, S.; Al Shamaileh, K.; Devabhaktuni, V.K.; Kaabouch, N. Impact of Dataset and Model Parameters on Machine Learning Performance for the Detection of GPS Spoofing Attacks on Unmanned Aerial Vehicles. Appl. Sci. 2022, 13, 383. [Google Scholar] [CrossRef]
  26. Azeez, N.; Odufuwa, O.; Misra, S.; Oluranti, J.; Damaševičius, R. Windows PE Malware Detection Using Ensemble Learning. Informatics 2021, 8, 10. [Google Scholar] [CrossRef]
  27. Mazhar, T.; Asif, R.N.; Malik, M.A.; Nadeem, M.A.; Haq, I.; Iqbal, M.; Kamran, M.; Ashraf, S. Electric Vehicle Charging System in the Smart Grid Using Different Machine Learning Methods. Sustainability 2023, 15, 2603. [Google Scholar] [CrossRef]
  28. Behrooz, H.; Hayeri, Y.M. Machine Learning Applications in Surface Transportation Systems: A Literature Review. Appl. Sci. 2022, 12, 9156. [Google Scholar] [CrossRef]
  29. Brennand, C.A.R.L.; Filho, G.P.R.; Maia, G.; Cunha, F.; Guidoni, D.L.; Villas, L.A. Towards a Fog-Enabled Intelligent Transportation System to Reduce Traffic Jam. Sensors 2019, 19, 3916. [Google Scholar] [CrossRef] [Green Version]
  30. Chen, X.; Zheng, D.; Liu, Y.; Wu, X.; Jiang, H.; Qiu, J. Multiaxial Strength Criterion Model of Concrete Based on Random Forest. Mathematics 2023, 11, 244. [Google Scholar] [CrossRef]
  31. De Morais, G.R.; Calil, Y.C.D.; de Oliveira, G.F.; Saldanha, R.R.; Andrey Maia, C. A Sustainable Location Model of Transshipment Terminals Applied to the Expansion Strategies of the Soybean Intermodal Transport Network in the State of Mato Grosso, Brazil. Sustainability 2023, 15, 1063. [Google Scholar] [CrossRef]
  32. Cornelius, E.; Akman, O.; Hrozencik, D. COVID-19 Mortality Prediction Using Machine Learning-Integrated Random Forest Algorithm under Varying Patient Frailty. Mathematics 2021, 9, 2043. [Google Scholar] [CrossRef]
  33. Zou, H.; Cao, K.; Jiang, C. Spatio-Temporal Visual Analysis for Urban Traffic Characters Based on Video Surveillance Camera Data. ISPRS Int. J. Geo-Inf. 2021, 10, 177. [Google Scholar] [CrossRef]
  34. Dushkin, R. Intelligent Transport Systems; DMK Press: Moscow, Russia, 2020; p. 282. [Google Scholar]
  35. Elagin, V.; Spirkina, A.; Buinevich, M.; Vladyko, A. Technological Aspects of Blockchain Application for Vehicle-to-Network. Information 2020, 11, 465. [Google Scholar] [CrossRef]
  36. Farag, M.M.G.; Rakha, H.A. Development and Evaluation of a Cellular Vehicle-to-Everything Enabled Energy-Efficient Dynamic Routing Application. Sensors 2023, 23, 2314. [Google Scholar] [CrossRef] [PubMed]
  37. Faroqi, H.; Mesbah, M.; Kim, J. Behavioural advertising in the public transit network. Res. Transp. Bus. Manag. 2019, 32, 100421. [Google Scholar] [CrossRef]
  38. Federal State Statistics Service. Available online: http://www.gks.ru (accessed on 25 December 2022).
  39. Gkikas, D.C.; Theodoridis, P.K.; Beligiannis, G.N. Enhanced Marketing Decision Making for Consumer Behaviour Classification Using Binary Decision Trees and a Genetic Algorithm Wrapper. Informatics 2022, 9, 45. [Google Scholar] [CrossRef]
  40. Paz, H.; Maia, M.; Moraes, F.; Lustosa, R.; Costa, L.; Macêdo, S.; Barreto, M.E.; Ara, A. Local Processing of Massive Databases with R: A National Analysis of a Brazilian Social Programme. Stats 2020, 3, 444–464. [Google Scholar] [CrossRef]
  41. Kovalnogov, V.; Fedorov, R.; Klyachkin, V.; Generalov, D.; Kuvayskova, Y.; Busygin, S. Applying the Random Forest Method to Improve Burner Efficiency. Mathematics 2022, 10, 2143. [Google Scholar] [CrossRef]
  42. Li, X.; Qin, B.; Luo, Y.; Zheng, D. A Differential Privacy Budget Allocation Algorithm Based on Out-of-Bag Estimation in Random Forest. Mathematics 2022, 10, 4338. [Google Scholar] [CrossRef]
  43. Mallidis, I.; Yakavenka, V.; Konstantinidis, A.; Sariannidis, N. A Goal Programming-Based Methodology for Machine Learning Model Selection Decisions: A Predictive Maintenance Application. Mathematics 2021, 9, 2405. [Google Scholar] [CrossRef]
  44. Malysheva, T.; Kudryavceva, S. Use of Data Mining technologies in solving the problems of developing resource-saving environmentally-oriented production systems. MMTT 2020, 3, 143–148. [Google Scholar]
  45. Petrov, T.; Pocta, P.; Kovacikova, T. Benchmarking 4G and 5G-Based Cellular-V2X for Vehicle-to-Infrastructure Communication and Urban Scenarios in Cooperative Intelligent Transportation Systems. Appl. Sci. 2022, 12, 9677. [Google Scholar] [CrossRef]
  46. Mateichyk, V.; Kostian, N.; Smieszek, M.; Mosciszewski, J.; Tarandushka, L. Evaluating Vehicle Energy Efficiency in Urban Transport Systems Based on Fuzzy Logic Models. Energies 2023, 16, 734. [Google Scholar] [CrossRef]
  47. Ntafloukas, K.; McCrum, D.P.; Pasquale, L. A Cyber-Physical Risk Assessment Approach for Internet of Things Enabled Transportation Infrastructure. Appl. Sci. 2022, 12, 9241. [Google Scholar] [CrossRef]
  48. Shen, P.; Yin, P.; Niu, B. Assessing the Combined Effects of Transportation Infrastructure on Regional Tourism Development in China Using a Spatial Econometric Model (GWPR). Land 2023, 12, 216. [Google Scholar] [CrossRef]
  49. Shinkevich, A.; Malysheva, T.; Ryabinina, E.; Morozova, V.; Sokolova, N.; Vasileva, A.; Ishmuradova, I. Formation of network model of value added chain based on integration of competitive enterprises in innovation-oriented cross-sectorial clusters. Int. J. Environ. Sci. Educ. 2016, 11, 10347–10364. [Google Scholar]
  50. Shinkevich, A.I.; Malysheva, T.V.; Vertakova, Y.V.; Plotnikov, V.A. Optimization of Energy Consumption in Chemical Production Based on Descriptive Analytics and Neural Network Modeling. Mathematics 2021, 9, 322. [Google Scholar] [CrossRef]
  51. Taisheva, G.; Ismagilova, E. System-logistic approach in the field of recycling of municipal solid waste in the Chuvash republic. In Proceedings of the International Scientific and Practical Conference on Sustainable Development of Regional Infrastructure (ISSDRI 2021), Yekaterinburg, Russia, 14–15 March 2021; pp. 305–311. [Google Scholar]
  52. Tékouabou, S.C.K.; Gherghina, C.; Toulni, H.; Mata, P.N.; Martins, J.M. Towards Explainable Machine Learning for Bank Churn Prediction Using Data Balancing and Ensemble-Based Methods. Mathematics 2022, 10, 2379. [Google Scholar] [CrossRef]
  53. Wu, S.; Xiang, W.; Li, W.; Chen, L.; Wu, C. Dynamic Scheduling and Optimization of AGV in Factory Logistics Systems Based on Digital Twin. Appl. Sci. 2023, 13, 1762. [Google Scholar] [CrossRef]
  54. Zhang, C.; Wang, W.; Liu, L.; Ren, J.; Wang, L. Three-Branch Random Forest Intrusion Detection Model. Mathematics 2022, 10, 4460. [Google Scholar] [CrossRef]
  55. Zhao, L.; Zhu, Y.; Zhao, T. Deep Learning-Based Remaining Useful Life Prediction Method with Transformer Module and Random Forest. Mathematics 2022, 10, 2921. [Google Scholar] [CrossRef]
Figure 1. The author’s methodology algorithm for solving the problem of classifying objects according to their potential for creating intelligent transportation systems using random forest machine learning.
Applsci 13 04024 g001
Figure 2. Plots of misclassification coefficients by successive tree addition steps (given number of solver trees, tmax = 100, tmax = 200, tmax = 300, and tmax = 400).
Applsci 13 04024 g002
Figure 3. Cumulative lift diagrams for estimating the utility of the random forest model by the level of the categorical dependent variable Pc_dep.
Applsci 13 04024 g003
Table 1. Descriptive data statistics for intelligent analysis of the probability of creating an integration platform in sociotechnical systems.
X1X2X3X4X5X6
Sampling variance (Sv)1.125439.97 × 10860.1068.87285.0960.13
Standard error (Es)0.1280,474.630.850.911.840.85
Standard deviation (Ds)1.06737,562.147.758.3016.887.75
Average (Av)2.24635,182.0294.8619.0744.7940.71
Excess (Ex)−1.0027.819.60−0.030.45−0.34
Asymmetry (As)0.444.71−2.600.410.250.23
Interval (Int)3.005,564,744.3047.0040.4091.3235.60
Minimum (Min)1.00145,723.1053.002.905.7025.30
Maximum (Max)4.005,710,467.40100.0043.3097.0360.90
Number of objects (Ra)848484848484
Table 2. Risk assessment for the training and test samples when constructing a random forest with different numbers of trees.
Number of Trees in Random Forest (tmax)Name of SampleRisk Assessment (Ar)Standard Error (Es)
50Train data0.0748350.003651
Test data0.5797860.009371
100Train data0.0373890.002632
Test data0.5076960.009492
150Train data0.0566410.003207
Test data0.5076960.009492
200Train data0.0542730.003144
Test data0.5076960.009492
250Train data0.0542730.003144
Test data0.4716510.009478
300Train data0.0735260.003621
Test data0.4716510.009478
400Train data0.0542730.003144
Test data0.5063620.009492
Table 3. Modeled classes of regions according to the level of capacity to create intelligent transportation systems using the random forest method.
Name of Decisive VariablesClass 1 «High Capacity to Create ITS»Class 2 «Average Capacity to Create ITS»Class 3 «Low Capacity to Create ITS»Class 4 «Creating an ITS Is not Feasible»
Share of digitalization of telecommunication networks in the region, %Pc_dep100.095.0 < Pc_dep < 100.090.0 < Pc_dep < 95.0Pc_dep < 90.0
share of investments in
reconstruction and modernization of infrastructure in the total volume of investments in fixed assets, % (group average)
Pu318.9019.2019.9018.30
proportion of public roads that
meet regulatory requirements,
% (group average),
Pu444.8042.7047.5046.60
share of nondepreciated fixed
assets in transportation, communications, and information, % (group average)
Pu542.1641.0337.4940.72
Table 4. «Random forest» distribution matrix for the number of decision trees t = 300.
Pc_dep Variable LevelClass 1 «High Capacity to Create ITS »Class 2 «Average Capacity to
Create ITS»
Class 3 «Low Capacity to Create ITS»Class 4 «Creating an ITS
Is Not
Feasible»
Distribution of Regions by Pc_dep Level, %
Reached
Share in Class 1–4, %85.8420.8217.9851.4136.00
Share in reached, %50.0030.0010.0010.00
Final
Share in Class 1–4, %0.0054.2417.840.0031.00
Share in final, %0.0088.7411.260.00
Prefinal
Share in Class 1–4, %0.0019.1733.1048.5920.00
Share in prefinal, %0.0049.7833.1817.03
Project
Share in Class 1–4, %14.165.7731.090.0013.00
Share in project, %24.3724.5751.060.00
Distribution of regions
by ITS capacity
(Grades 1–4), %
21.0052.0020.007.00
Disclaimer/Publisher’s Note: The statements, opinions and data contained in all publications are solely those of the individual author(s) and contributor(s) and not of MDPI and/or the editor(s). MDPI and/or the editor(s) disclaim responsibility for any injury to people or property resulting from any ideas, methods, instructions or products referred to in the content.

