Article

Sensitivity Improvement of an Optical Fiber Sensor Based on Surface Plasmon Resonance with Pure Higher-Order Modes

1
School of Precision Instrument and Opto-Electronics Engineering, Key Laboratory of Micro Opto-Electro Mechanical System Technology, Key Laboratory of Opto-Electronics Information Technology, Ministry of Education, Tianjin University, Tianjin 300072, China
2
Wenzhou Safety (Emergency) Institute of Tianjin University, Tianjin University, Wenzhou 325000, China
*
Authors to whom correspondence should be addressed.
Appl. Sci. 2023, 13(6), 4020; https://doi.org/10.3390/app13064020
Submission received: 18 February 2023 / Revised: 14 March 2023 / Accepted: 20 March 2023 / Published: 22 March 2023
(This article belongs to the Topic Machine Learning and Biomedical Sensors)

Abstract

:

Featured Application

We propose an SPR sensor with high sensitivity and resolution based on the higher-order modes, which can be applied in the measurement of the refractive index.

Abstract

In this paper, we propose an approach to improve the sensitivity of an optical fiber surface plasmon resonance (SPR) sensor with a pure higher-order mode excited by a designed mode selective coupler (MSC). We calculate the proportion of the power of the higher-order mode in the cladding. Compared to the LP 01 mode, the power proportion of the LP 11 mode ( LP 21 mode) in the cladding theoretically improves by 100% (150%). To generate a relatively pure LP 11 mode or LP 21 mode, a mode selective coupler (MSC, 430–580 nm) is designed. The coupling efficiency of the LP 01 LP 11 mode coupler is over 80%, and that of the LP 01 LP 21 mode coupler is over 50%. The simulation results show that the sensitivity of the LP 11   mode and the LP 21 mode increases by approximately 330% and 360%, respectively, using the intensity modulation (n = 1.33–1.38, 430–580 nm); the resolution of the refractive indices of our sensor, using the LP 11 mode ( LP 21 mode), is 2.6 × 10 4 RIU ( 2.4 × 10 4 RIU). The higher sensitivity and resolution of our presented fiber SPR sensor containing a visible MSC make it a promising candidate for the measurement of refractive indices.

1. Introduction

The surface plasmon resonance (SPR) technique has been widely used in biosensing due to its high sensitivity and rapid response [1,2]. The key to improve the sensitivity of optical fiber SPR sensors is to enhance the intensity of the interaction between the evanescent wave and the metal film [3]. Compared with the fundamental mode, the higher-order modes (the LP 11 and LP 21 modes) easily leak to the fiber cladding due to a greater angle of incidence, leading to much more power remaining in the cladding [4]. Given this, when the evanescent wave to excite the SPR in sensing is used, the sensitivity can be improved by higher-order modes. Therefore, several methods have been proposed to excite higher-order modes to enhance the sensitivity of fiber SPR sensors, such as D–shaped structures [5], tilted fiber Bragg gratings (TFBGs) [6], and lens illumination [7]. Although the existing studies can improve the sensitivity of SPR sensors using higher-order modes, the power proportion of higher-order modes used to excite SPR is unknown due to the mixing with the fundamental mode. If the proportion of the fundamental mode can be reduced to the minimum, or even to zero, along the optical fiber, the sensitivity of the SPR fiber sensors could be further improved.
Utilizing higher-order modes to improve the sensitivity of fiber SPR sensors has been explored by many researchers [7,8,9,10]. For instance, using a Bessel-Gauss beam as a light source, a sensor with a high sensitivity of 11,928.25 dB/RIU is obtained, which is 10 times that of a Gaussian beam [7]. The higher-order modes in the cladding can be generated by TFBGs with different angles, which provides a sensitivity of around 500 nm/RIU [8]. Moreover, a biosensor shows a detection limit of 1.5 × 10 3 colony-forming units (CFU)/mL, using a U-shaped fiber to tilt the incident angle to generate higher-order modes [9]. Meanwhile, these higher-order modes can be generated by changing the mode field using a mismatched junction between two fibers, which improves the performance of the sensor with a sensitivity of 4816.092 nm/RIU [10]. However, these approaches fail to further improve their sensitivity because the mixing of higher-order modes with the fundamental mode is inevitable, and the fundamental mode dominates in the optical fiber. In particular, the latter is the main reason preventing the enhancement of the sensitivity of fiber SPR sensors. Hence, if we want to further improve the sensing performance of SPR sensors, it is reasonable to consider using relatively pure higher-order modes. However, it is difficult to excite the pure higher-order modes according to the existing methods. In 2020, Yao et al. [11] fabricated a visible mode selective coupler (MSC), generating the LP 11 mode at a specific wavelength range (480–540 nm), almost without the fundamental mode. The presented approach gives us a new practical way to apply this MSC to excite the pure higher-order mode (not just the LP 11 mode) after slight modifications. With this method, we can intensify the SPR on the surface of the core by generating relatively pure higher-order modes.
In this paper, we propose a SPR sensor with a designed MSC to obtain a pure higher-order mode for sensitivity improvement. Section 2 describes the mechanism of the sensor for the refractive index (RI) measurement using higher-order modes. Then, in Section 3, we calculate the power proportion of different modes in the cladding and design an MSC, using two optical fibers. Finally, the parameters of the MSC are optimized to produce a pure higher-order mode for RI measuring, and simulations of the designed SPR sensor are shown in Section 4, proving that this sensor is an effective device to achieve highly sensitive RI measuring.

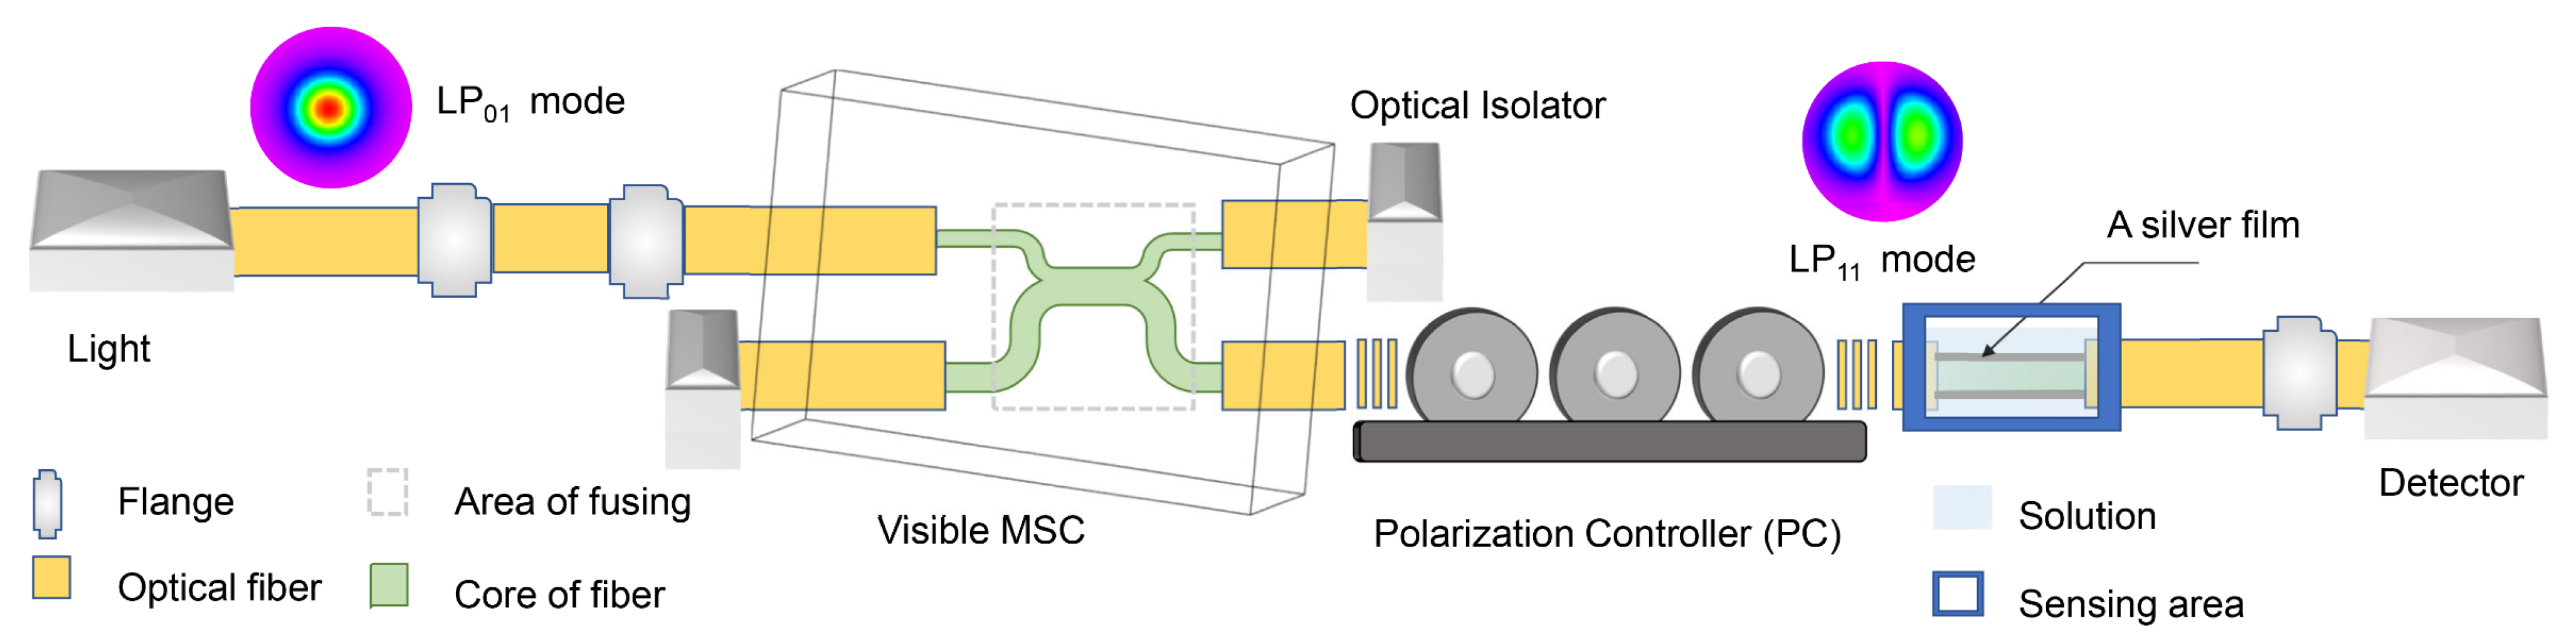
2. Sensing Mechanism

The designed sensor consists of three parts, the MSC, the polarization controller (PC), and the sensing area of this sensor, as shown in Figure 1.
In the sensor, the light beam is coupled into the fiber by Flange and propagates as the fundamental mode into the MSC. The MSC is made from two fused fibers and is used to produce a pure higher order mode in the visible band. In general, as the fundamental mode propagates in the fusion region, the energy transitions periodically from one fiber to another, propagating as the LP11 (LP21) mode when the coupling length increases. It is, therefore, possible to optimize the MSC parameters so that the fiber output is purely the LP11 (LP21) mode. An optical isolator is used to avoid reflections from the fiber output affecting the output LP11 (LP21) mode.
The PC controls the light field distribution of the modes by adjusting the polarization direction of the higher order modes, which in turn concentrates the power for excitation of the SPR in the sensing area.
The sensing area of this sensor for RI measuring is made by stripping part of the cladding from the few-mode fiber and coating it with silver film to excite SPR in the solution. Then, the output light intensity through different RI solutions is received by the detector, where the sensitivity and RI resolution of the sensor can be measured.
Based on the proposed fiber SPR sensor, in order to obtain a higher order mode with a higher power proportion for full excitation of the SPR, in the next section, the power proportion of different higher order modes in the cladding is theoretically analyzed and an MSC with a central wavelength of 500 nm is designed. In addition, all parameters related to the sensor and used in the Section 3 and the Section 4 are listed in Table 1.

3. Theoretical Analysis

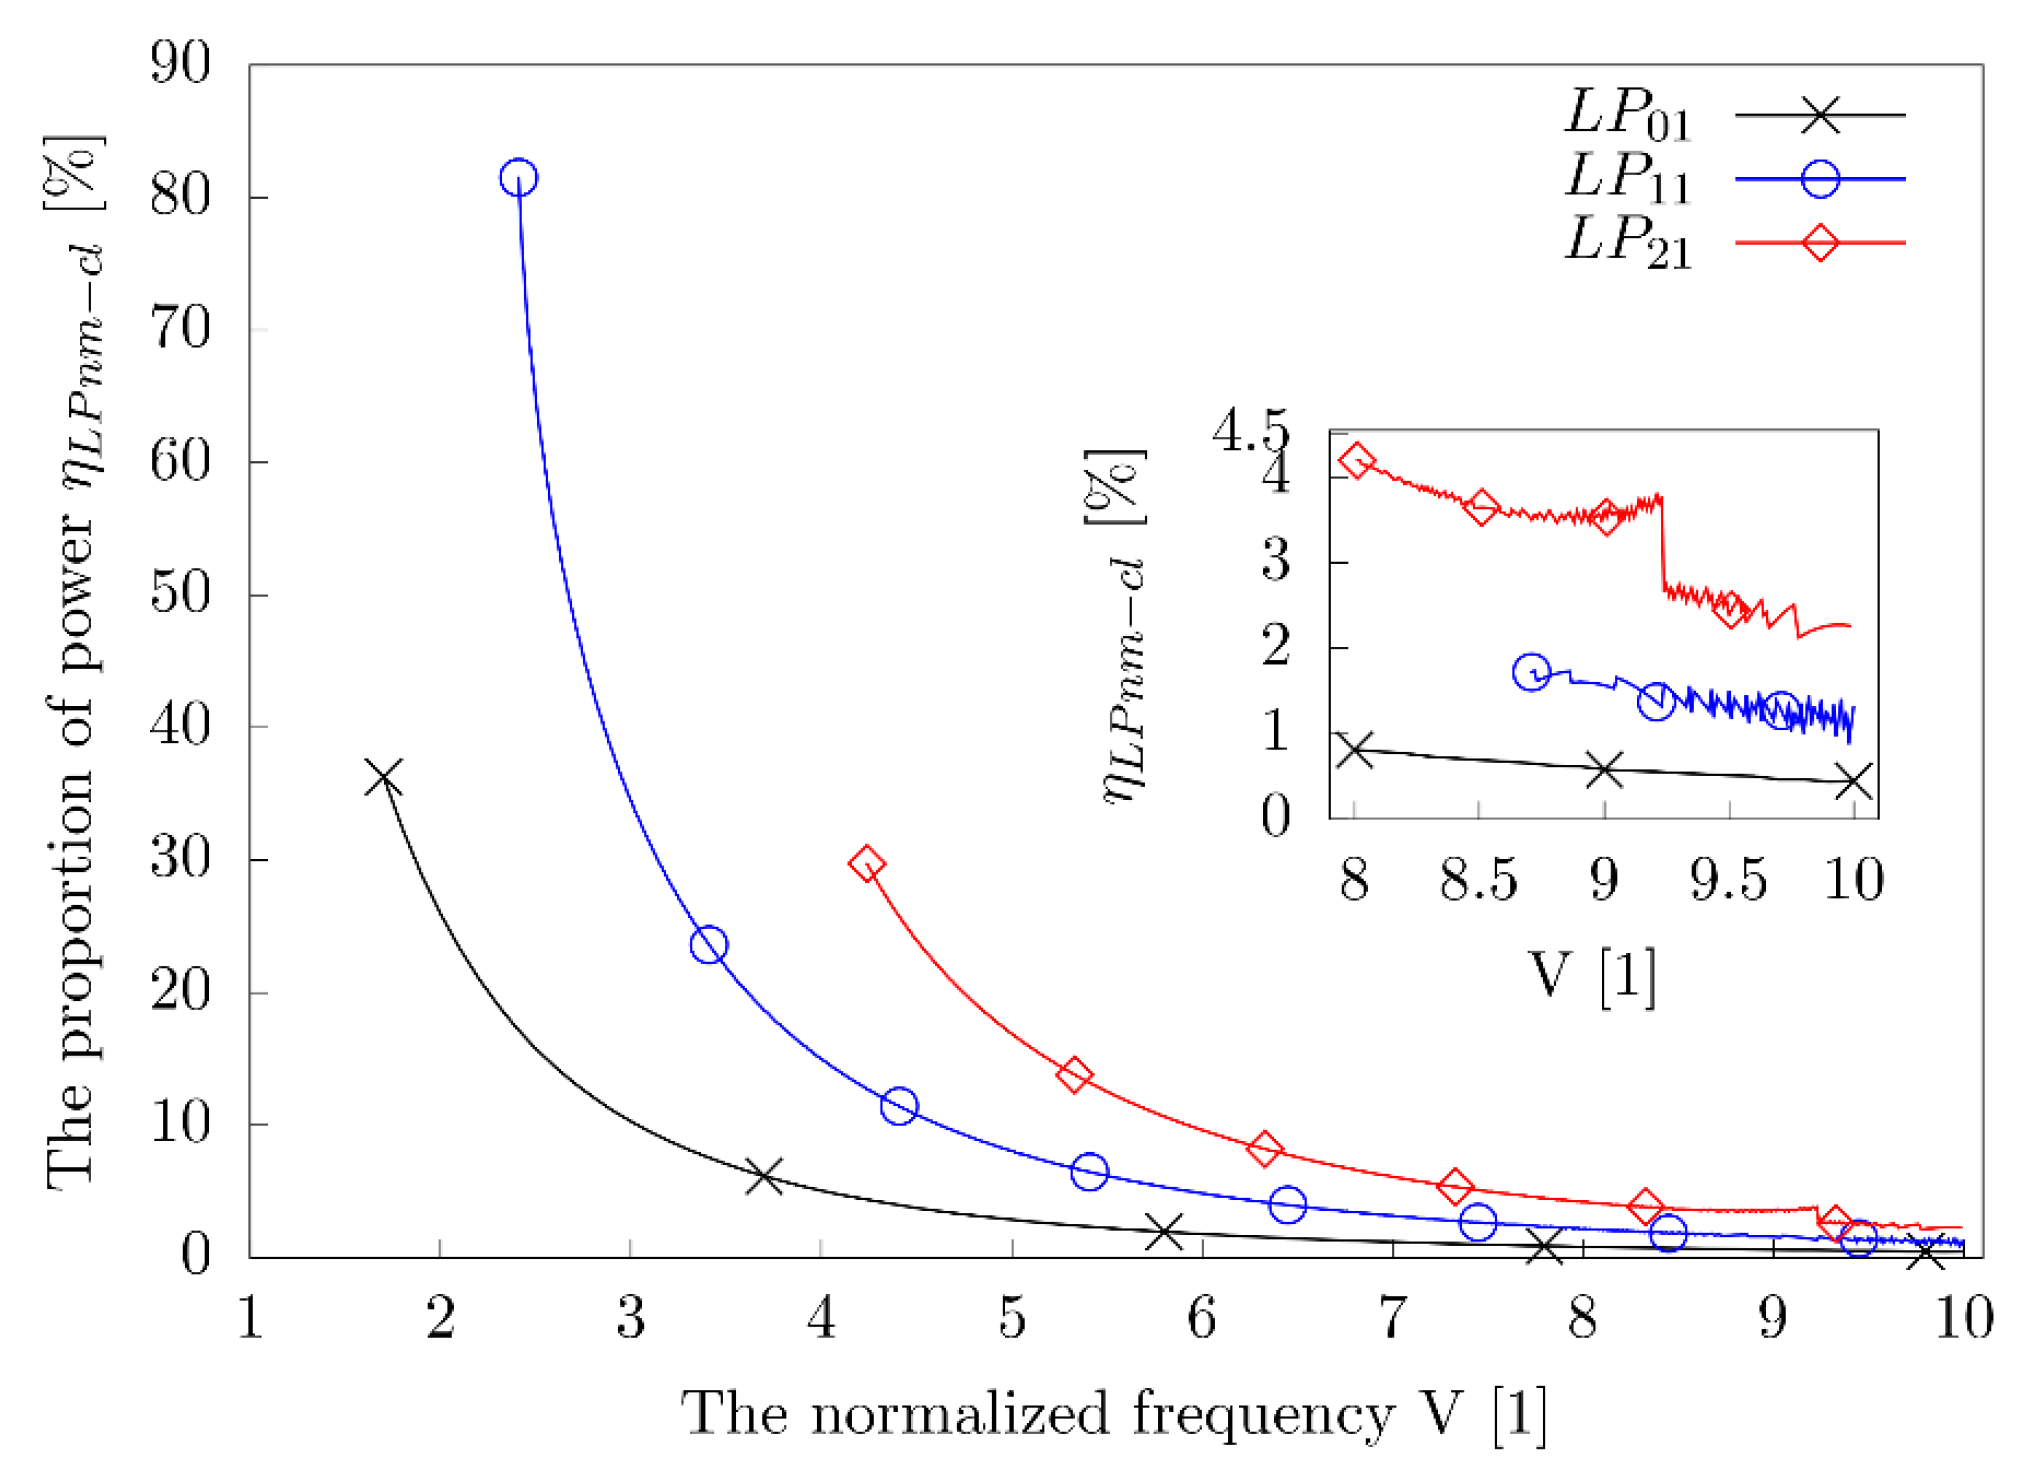
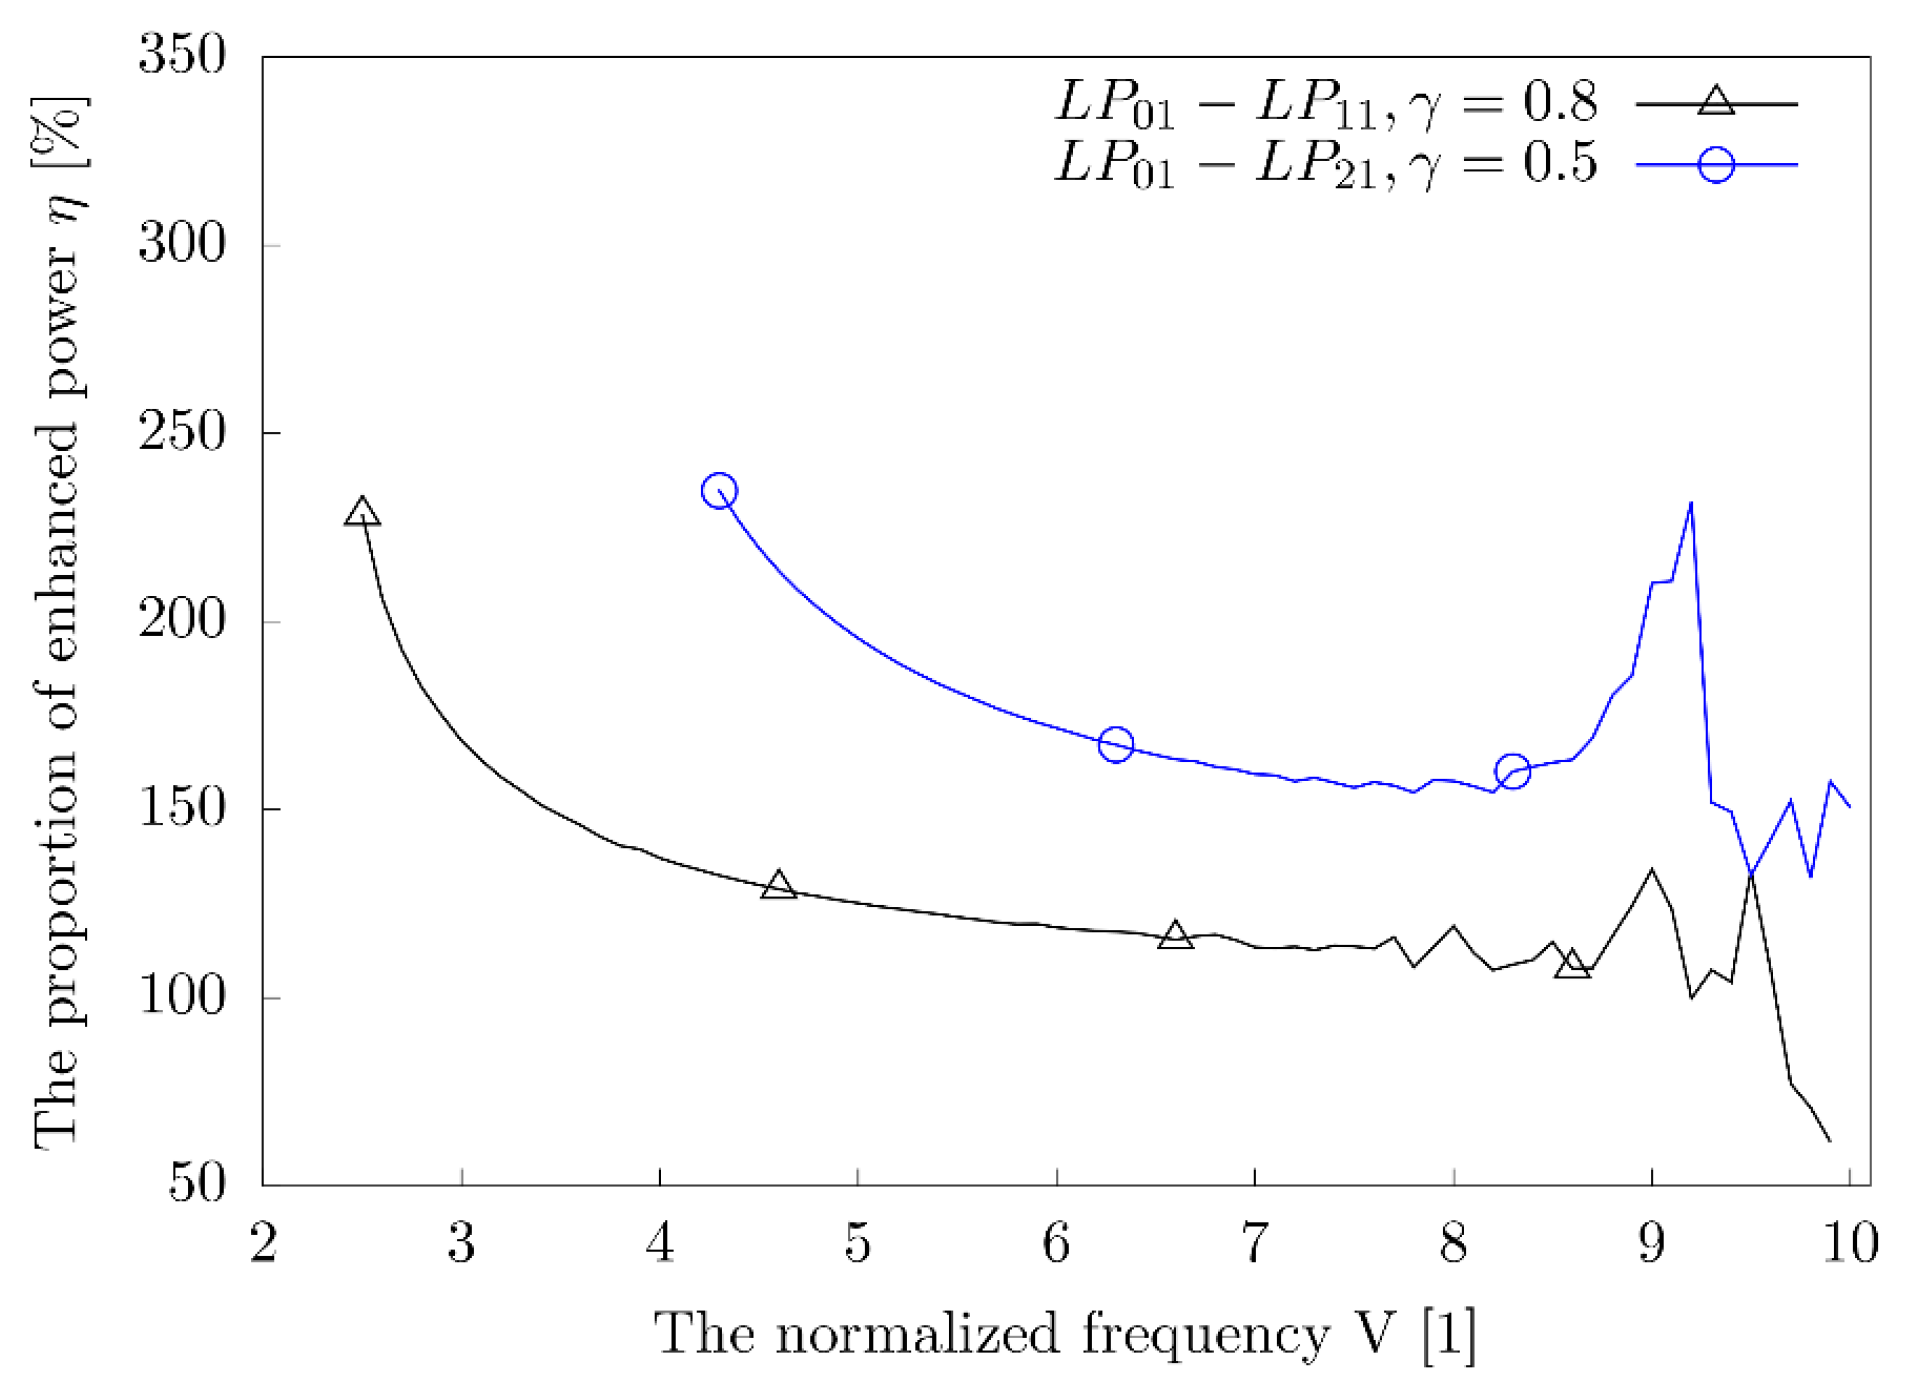
3.1. The Power of Different Modes in the Cladding

The sensitivity of the sensor could be improved by using only the higher-order mode to excite SPR in this sensor. To verify this assertion, the powers of the LP 01 , LP 11 , and LP 21 modes in the cladding are calculated.
The electric field Fl(R) of the LP nm mode (ignoring the phase e i l ϕ , l = 0 , 1 , ) in the step fiber is expressed as [4]
  [ d d R 2 + 1 R d d R l 2 R 2 + a 2 ( k 2 n c o 2 β 2 ) ] F l ( R ) = 0   0 R < 1    
  [ d d R 2 + 1 R d d R l 2 R 2 a 2 ( β 2 k 2 n c l 2 ) ] F l ( R ) = 0   1 R <  
where R is the normalized radius, a is the radius of the fiber, k is the wavenumber in the vacuum, β is the propagation constant, n c o is the core index, and n c l is the RI of the cladding.
By substituting Equation (1) into the boundary conditions that Fl(R) and F l continue when R = 1, characteristic eigenequations follow these relationships:
U   J n + 1 ( U ) / J n ( U ) = W K n + 1 ( W ) / K n ( W )  
U   J n 1 ( U ) / J n ( U ) = W K n 1 ( W ) / K n ( W )  
V = U 2 + W 2 = k a n c o 2 n c l 2  
where n is the order of mode, U is the core parameter, W is the cladding parameter, and V is the normalized frequency [4]. The bisection method is adopted to solve these equations using some subroutines of Fortran [12] (GNU Fortran 10.3.0, Rev5, built by the MSYS2 project).
The proportion of the power of the LP nm mode in the cladding to the total power is expressed as [4]
η L P n m c l = 1 F l 2 ( R ) R d R 0 F l 2 ( R ) R d R
The percentage of cladding power to the total power of the first three modes (the LP01, LP11, and LP21 mode) is illustrated in Figure 2. The value of the LP21 mode is discontinuous in the inset of Figure 2 due to the defined error range (0.00001) of the bisection method. This indicates that in the cladding, the power of the higher-order modes is higher than that of the fundamental mode. In other words, compared to the fundamental mode, the higher-order modes can effectively improve the power of the evanescent wave for SPR excitement.
In the designed sensor, the loss of the light source and the efficiency of converting the fundamental mode into a higher order mode of MSC are considered. Thus, in the sensing area of this sensor, the ratio of the power enhancement of the higher order mode to the fundamental mode is defined as
η = η L P 01 l i g h t × γ × η L P n m c l η L P 01 l i g h t × η L P 01 c l η L P 01 l i g h t × η L P 01 c l = γ × η L P n m c l η L P 01 c l η L P 01 c l  
where η represents the proportion of the power increase of the LP nm   mode to the fundamental mode in the cladding. η L P 01 l i g h t indicates the efficiency of a light source producing the fundamental mode. η L P n m c l represents the proportion of the power of the LP nm mode in the cladding to the total power in the optical fiber. γ of the MSC is defined as the ratio between the generated higher-order mode power and the total power of the MSC.
As shown in Figure 3, in this sensing area, the proportion of the cladding power increases by approximately 100% and 150% when the LP 11 and LP 21 modes are adopted, where γ of the LP 01 P 11 mode coupler is set as 0.8, and γ of the LP 01 LP 21 mode coupler is set as 0.5, according to the calculation in Section 4.1. The abnormal peak of the blue curve is caused by the error of the numerical method, which coordinates with the inset of Figure 2. These results indicate that the advantage of applying higher-order modes for sensing is that higher order modes have more power in the cladding to excite a higher intensity of SPR, and the loss of these modes can be fully detected by intensity modulation, whose variation can reflect the change trend of RI. Therefore, the evanescent wave power enhanced by these modes contributes to the sensitivity enhancement of the RI, which is verified by simulations of the sensing area of this sensor.

3.2. The Principle of an MSC Working in the Visible Band

The MSC is made by fusing two fibers of the same material, but with different diameters. In order to achieve a high γ for MSC, the dispersion effect of the fiber is taken into account for a given doping ratio, and the γ is increased by optimizing structural parameters of the MSC without adjusting the fiber doping ratio to change the RI of the fiber. Assuming that the optical fiber used is only doped with GeO2, the core is doped with 13.28%, and the cladding is doped with 9.78%. The dispersions of the two fibers, taken from the Sellmeier equation, are expressed as
n c o = 1 + 0.7108675759 × λ 2 λ 2 0.0684800426 2 + 0.4491392689 × λ 2 λ 2 0.1219252124 2 + 0.8917276872 × λ 2 λ 2 10.1760054835 2  
n c l = 1 + 0.7069927717 × λ 2 λ 2 0.0684600885 2 + 0.4383817131 × λ 2 λ 2 0.12045325052 2 + 0.8932435754 × λ 2 λ 2 10.1030035705 2  
where n c o is the RI of the core, n c l is the RI of the cladding, and the unit of wavelength ( λ ) is micrometers ( μ m ).
The key to designing the MSC is that the wave-vector of different modes should be matched, which means that different modes have an equal RI [11].Under such conditions, the fundamental modes propagating in one fiber can all be converted into higher-order modes propagating in the other fiber, as shown in Figure 1. During propagation, the fundamental mode gradually passes through the fusion area into another fiber and propagates for a certain length to satisfy γ = 1 . If the fusion area is too long, energy will propagate from one fiber to another periodically which will lead to the fluctuation of γ .
However, because of the dispersion effect caused by the RI of the fiber, not all the power of the fundamental modes in a wavelength range totally propagates to another fiber and converts into the power of the higher-order modes, resulting in γ < 1 . Given the RI of the fiber, the variation in the RI of the LP nm mode can be calculated by Equation (2) and Equation (5), as illustrated in Figure 4. Considering reasonable structural parameters of the MSC, the mode effective RI is set as 1.482248. Then, the radius of the fiber core for the LP 01 mode is identified as 2.99 μ m ; this parameter for the LP 11 mode ( LP 21 mode) is 5.15 μ m (7.15 μ m ) at λ = 500   nm .
As shown in Figure 4, the dispersion effect caused by the RI changing with wavelength leads to a mismatch of the effective refractive indices for different modes within a wavelength range. Therefore, γ < 1 . To achieve the overall maximum value of γ in the visible band, the structural parameters of MSC are optimized in Section 4.1.

4. Simulations and Discussions

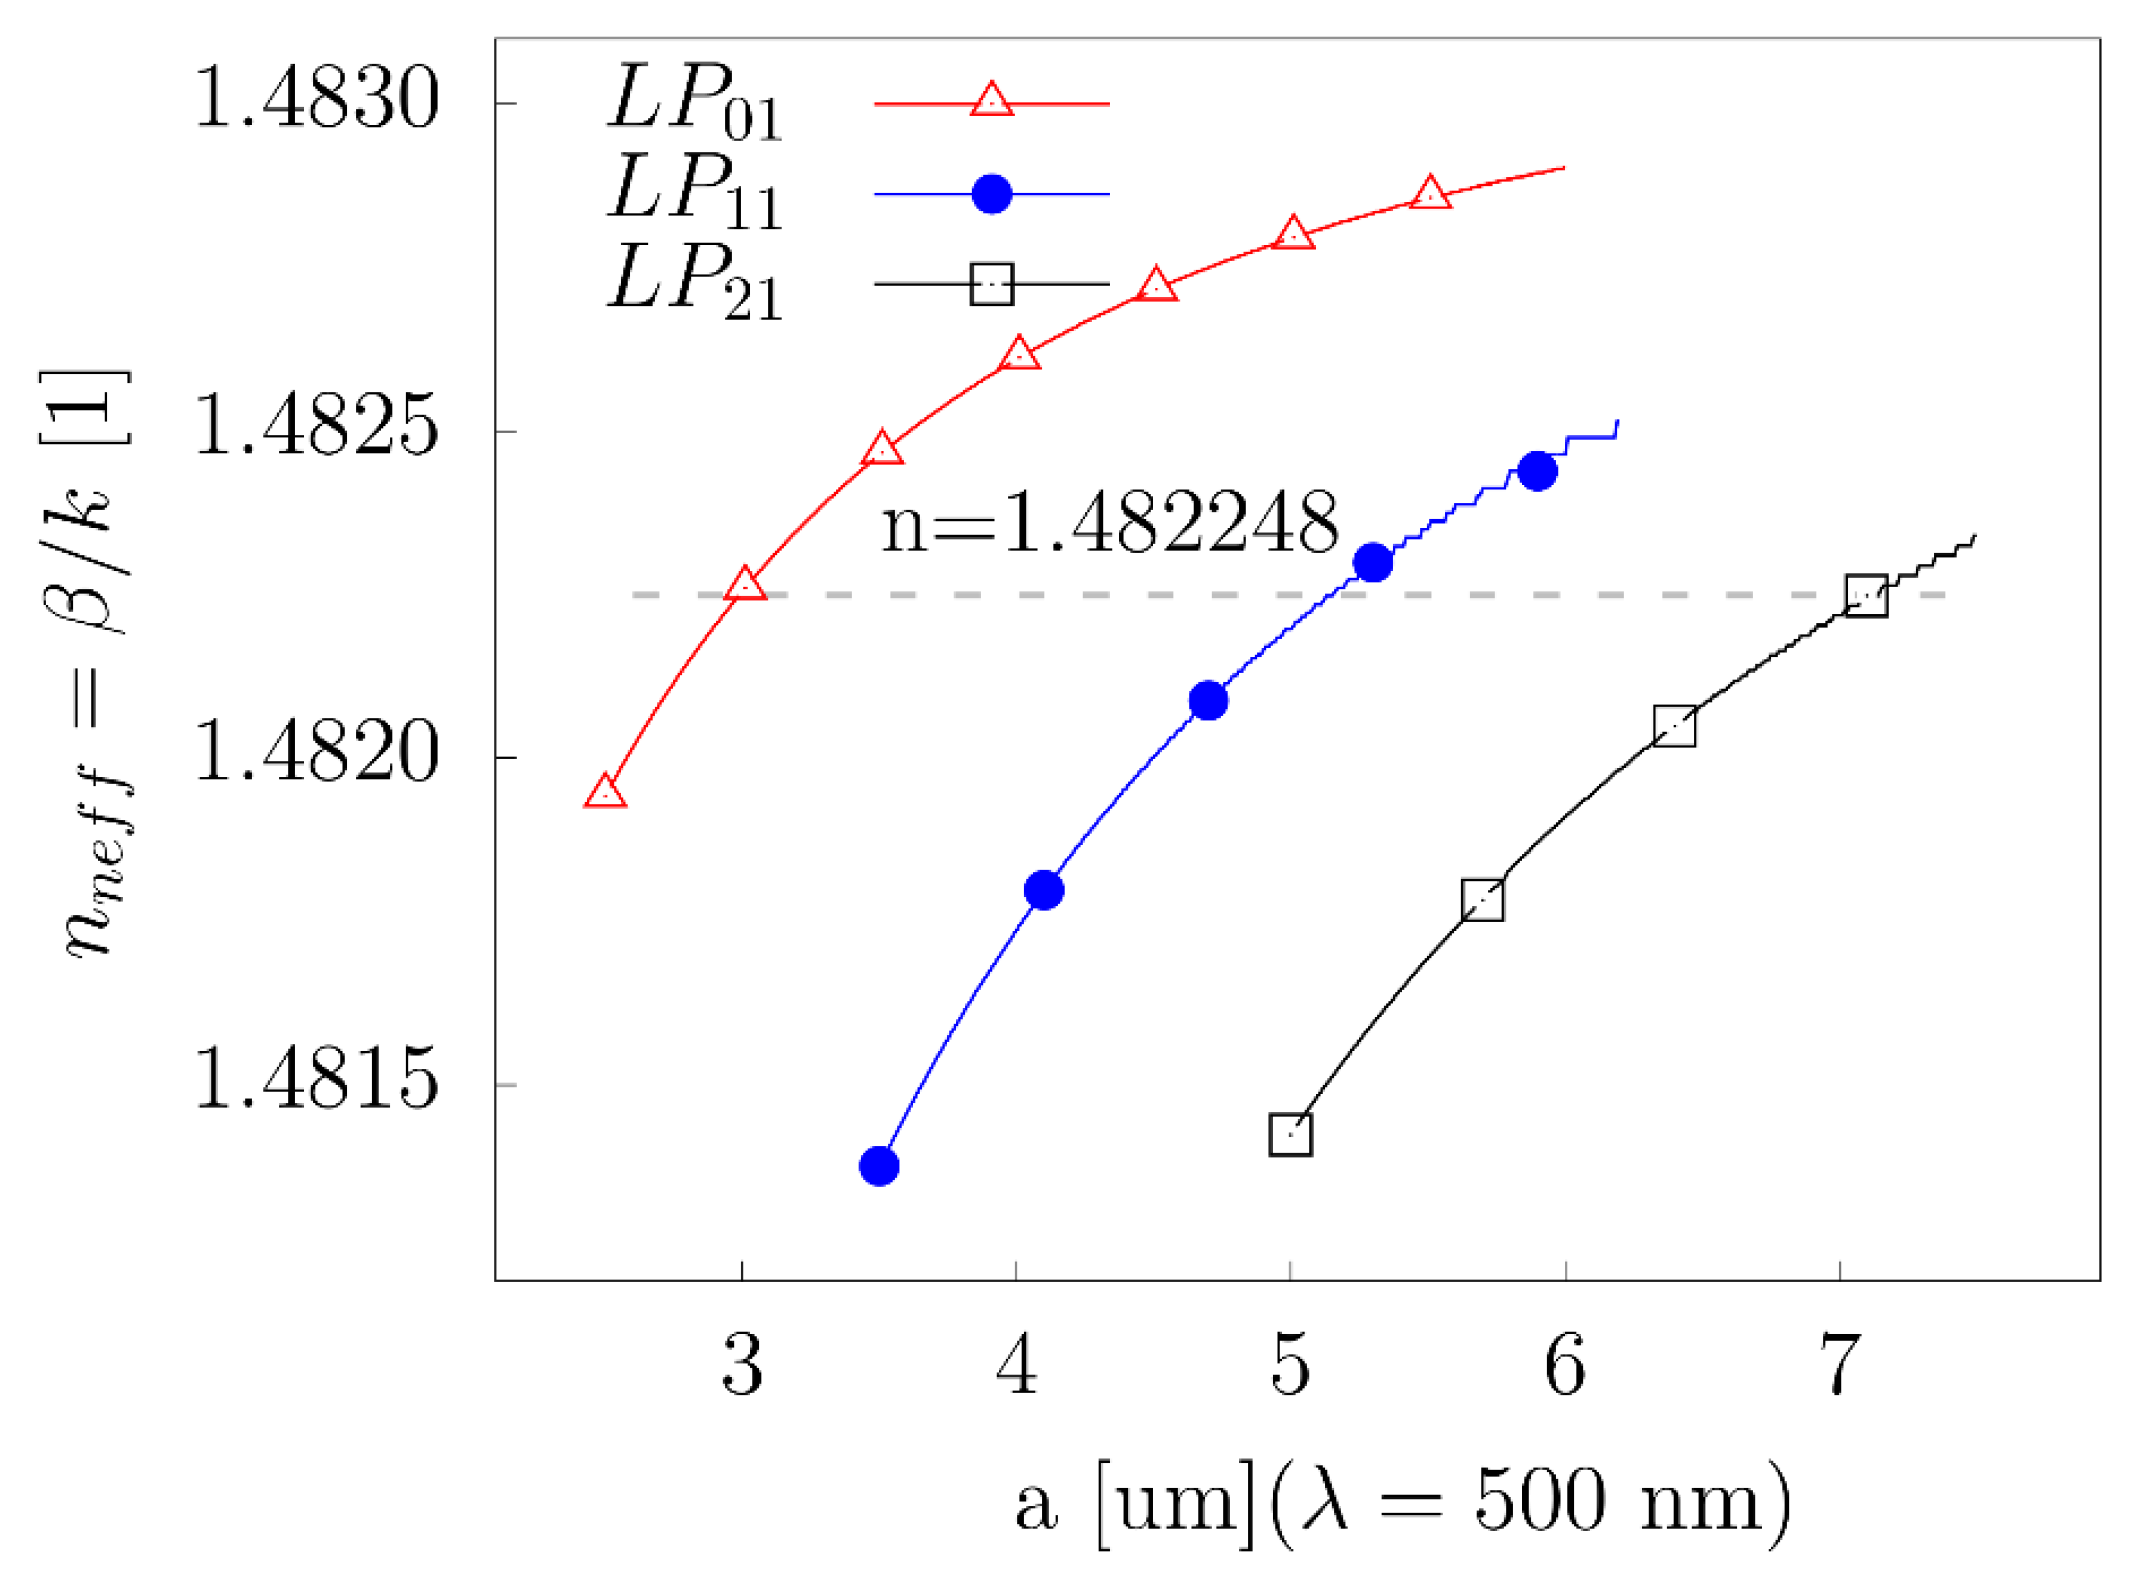
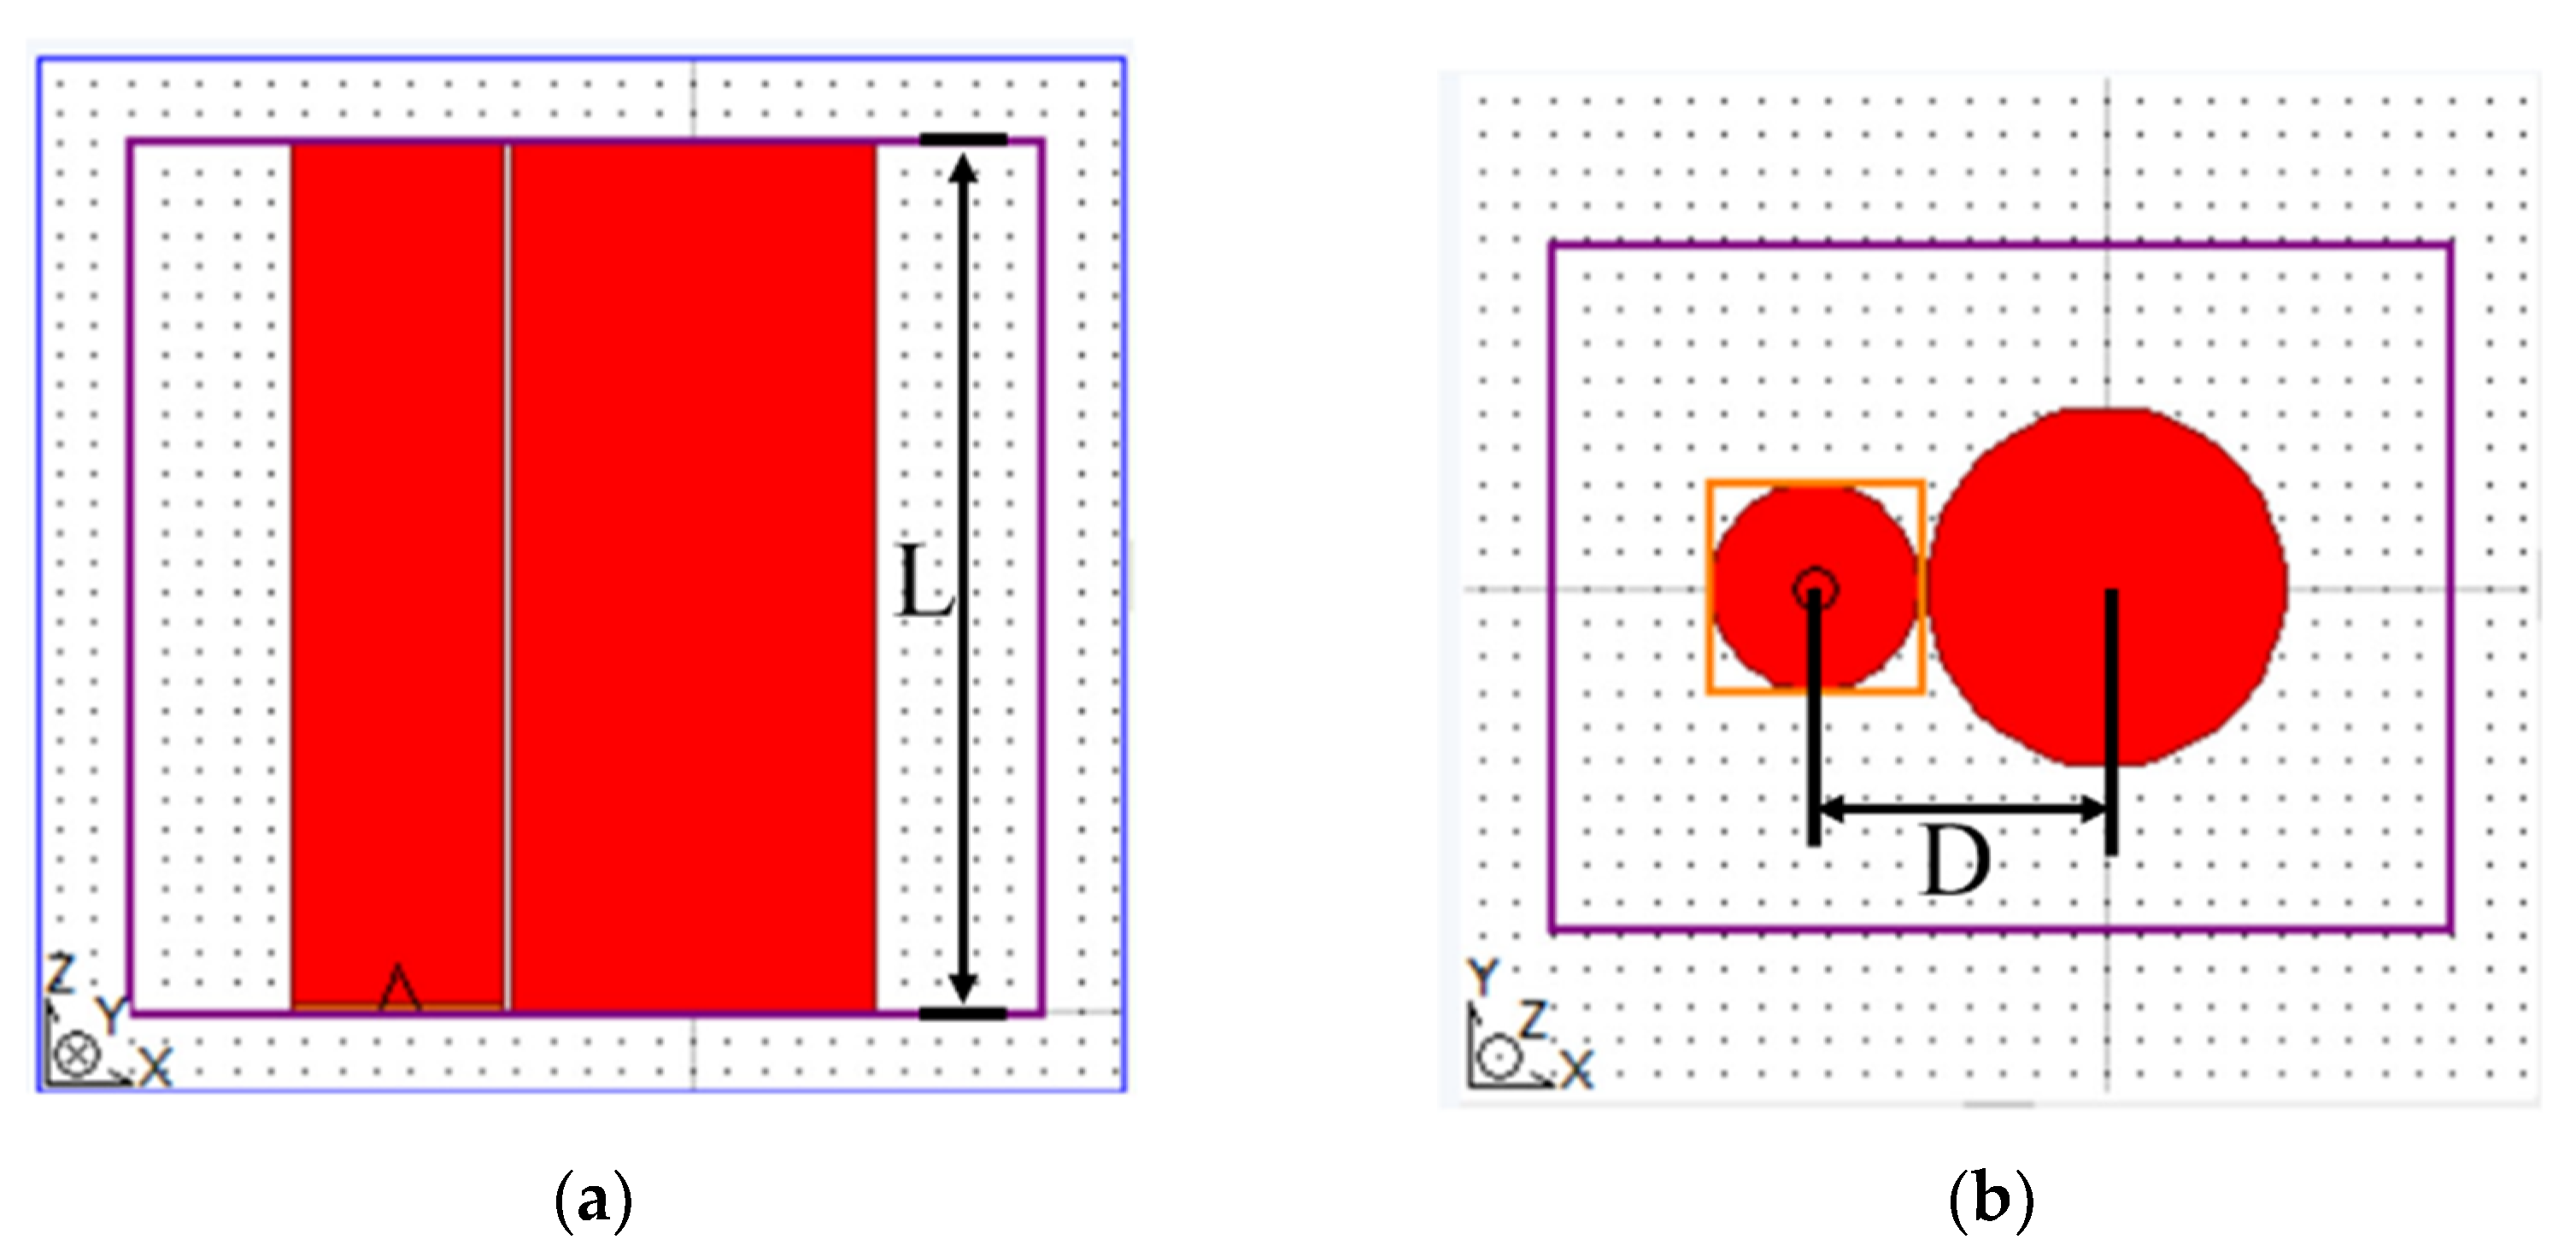
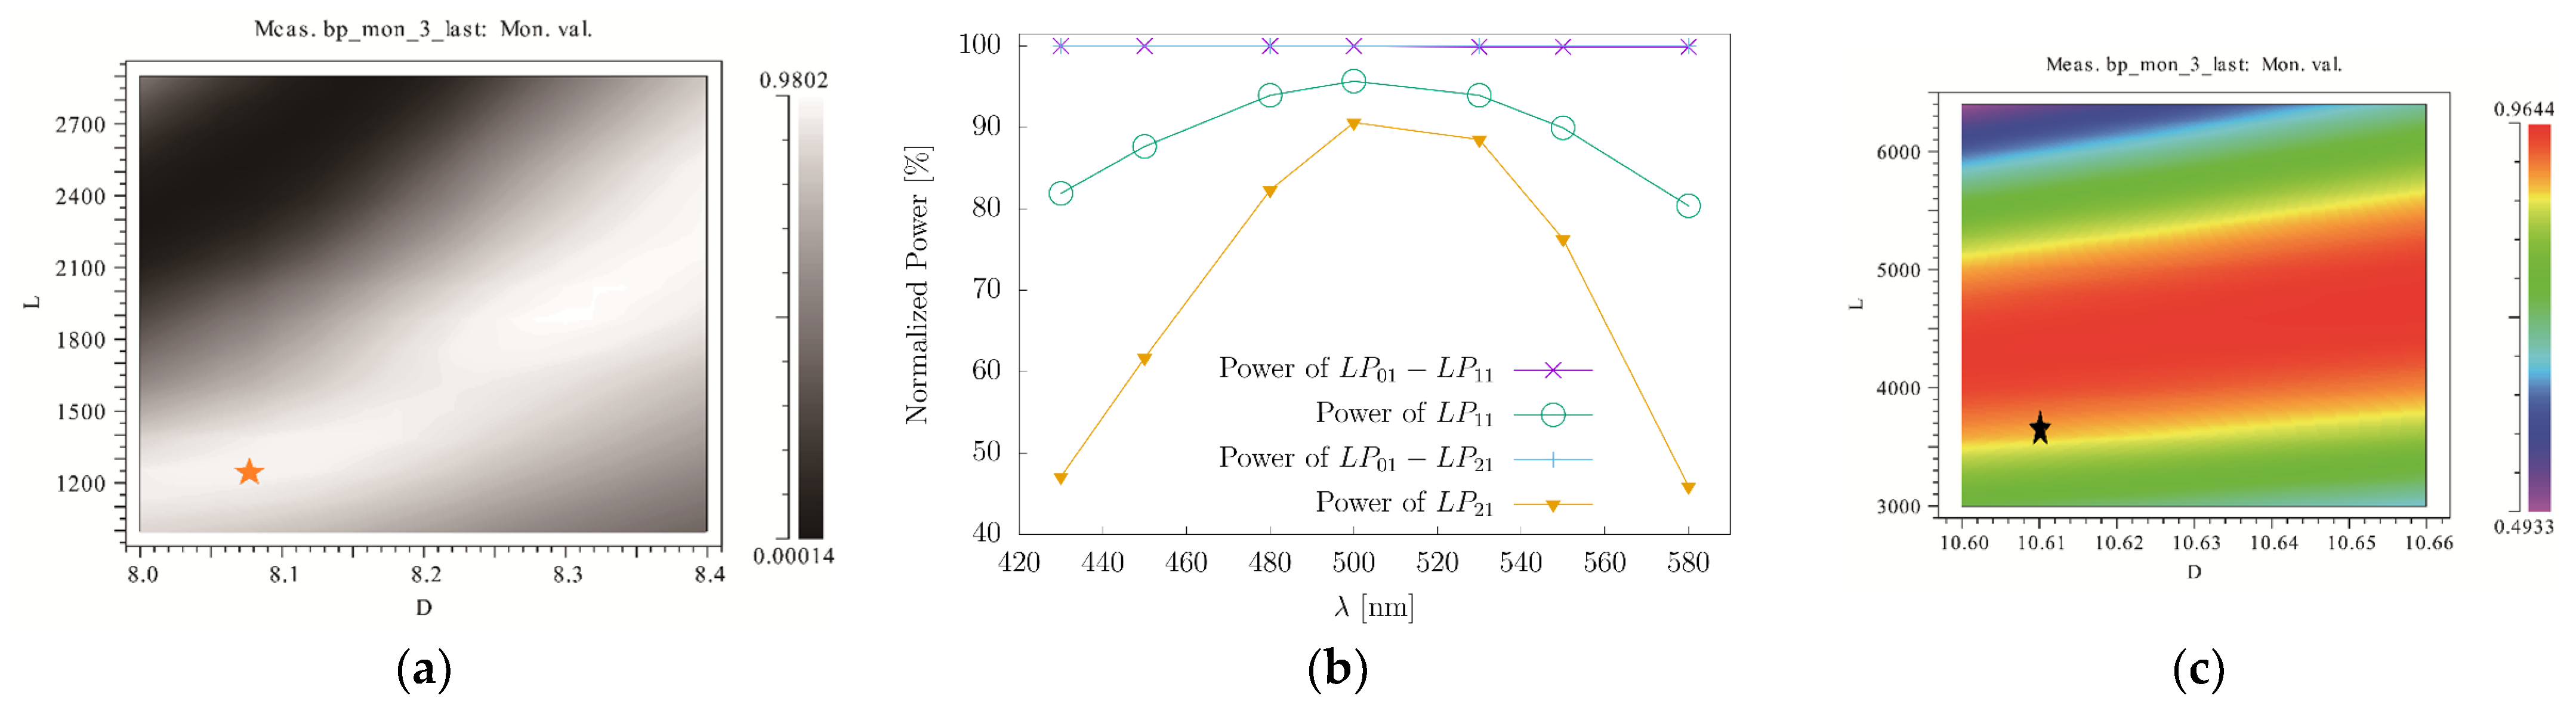
4.1. Simulation of MSC

In our sensor, the wavelength of SPR ranges from 430 nm to 580 nm. Thus, to produce a relatively pure higher-order mode in the visible band and to maximize γ , the optimized central wavelength of visible MSC is selected to be 500 nm.
Ignoring the influence of external fiber bending on the coupling area, we establish a model of the MSC with Rsoft; the area of fusing is shown in Figure 1 and Figure 5. In this model, the radius of two optical fibers is 2.99 um for LP 01 mode, and 5.15 µm (7.15 µm) for LP 11 mode ( LP 21 mode). The model aims to analyze how the core distance (D) and the fusion length of fiber (L) affect γ .
As shown in Figure 5, the fundamental mode originates from the bottom of the left fiber as the triangle marked in Figure 5a. It should be noted that the incident power equals the total power. In the fusion area, the total power transmits from one fiber to another fiber periodically. In the end, most of the power flows out of the top of the right fiber corresponding to the right fiber shown in Figure 5b, in the form of the LP11 mode or the LP21 mode, and a small amount of power, the power of the fundamental mode, exits from the top of the left fiber, corresponding to left fiber, depicted in Figure 5b. Therefore, D and L are related to the ratio of the power distribution between the two fibers, which affects γ . Thus, optimizing these parameters can improve the γ in the visible band (430–580 nm).
Using the MOST module, the optimized result is achieved, as shown in Figure 6a. It clearly shows that there are many options for D and L to realize γ > 0.95 at λ = 500   nm . However, when D and L are determined, γ will peak at the central wavelength and decline on both sides, as shown in Figure 6b. Therefore, in order to obtain high γ in the entire visible band, the choice of the parameters for D and L is limited. According to our simulation, for the LP 11 mode and the LP 21 mode, D is 8.08, and 10.61 µm, and L is 1253.3 and 3700 µm. For example, at the central wavelength, the orange pentagram indicates the parameters (D = 8.08 um and L = 1253.3 um) of the LP 01 LP 11 coupler shown in Figure 6(a), and the coupling efficiency γ of this coupler is derived from the power of LP11 over the power of LP 01 P 11 in Figure 6b, which is 95.69%. Similarly, γ of the LP 01 P 21 coupler is 90.60%, which is marked with the black pentagram shown in Figure 6c.
As shown in Figure 6b, the efficiency of conversion ( γ ) is less than 1 and it is relatively low for the LP 01 LP 21 mode coupler in the visible wavelength range. This is because the evanescent field of the higher-order mode extends significantly, which easily allows the higher-order mode to transition to another fiber and propagate forward as the fundamental mode during the propagation in the fusion area.
To further improve γ to obtain a pure higher-order mode, one method is to optimize D and L under a certain type of optical fiber, which has been fully described. Another way is to change the components of the fiber to study the effect of dispersion on γ . However, due to limitations of the experimental conditions, we do not adopt this approach.

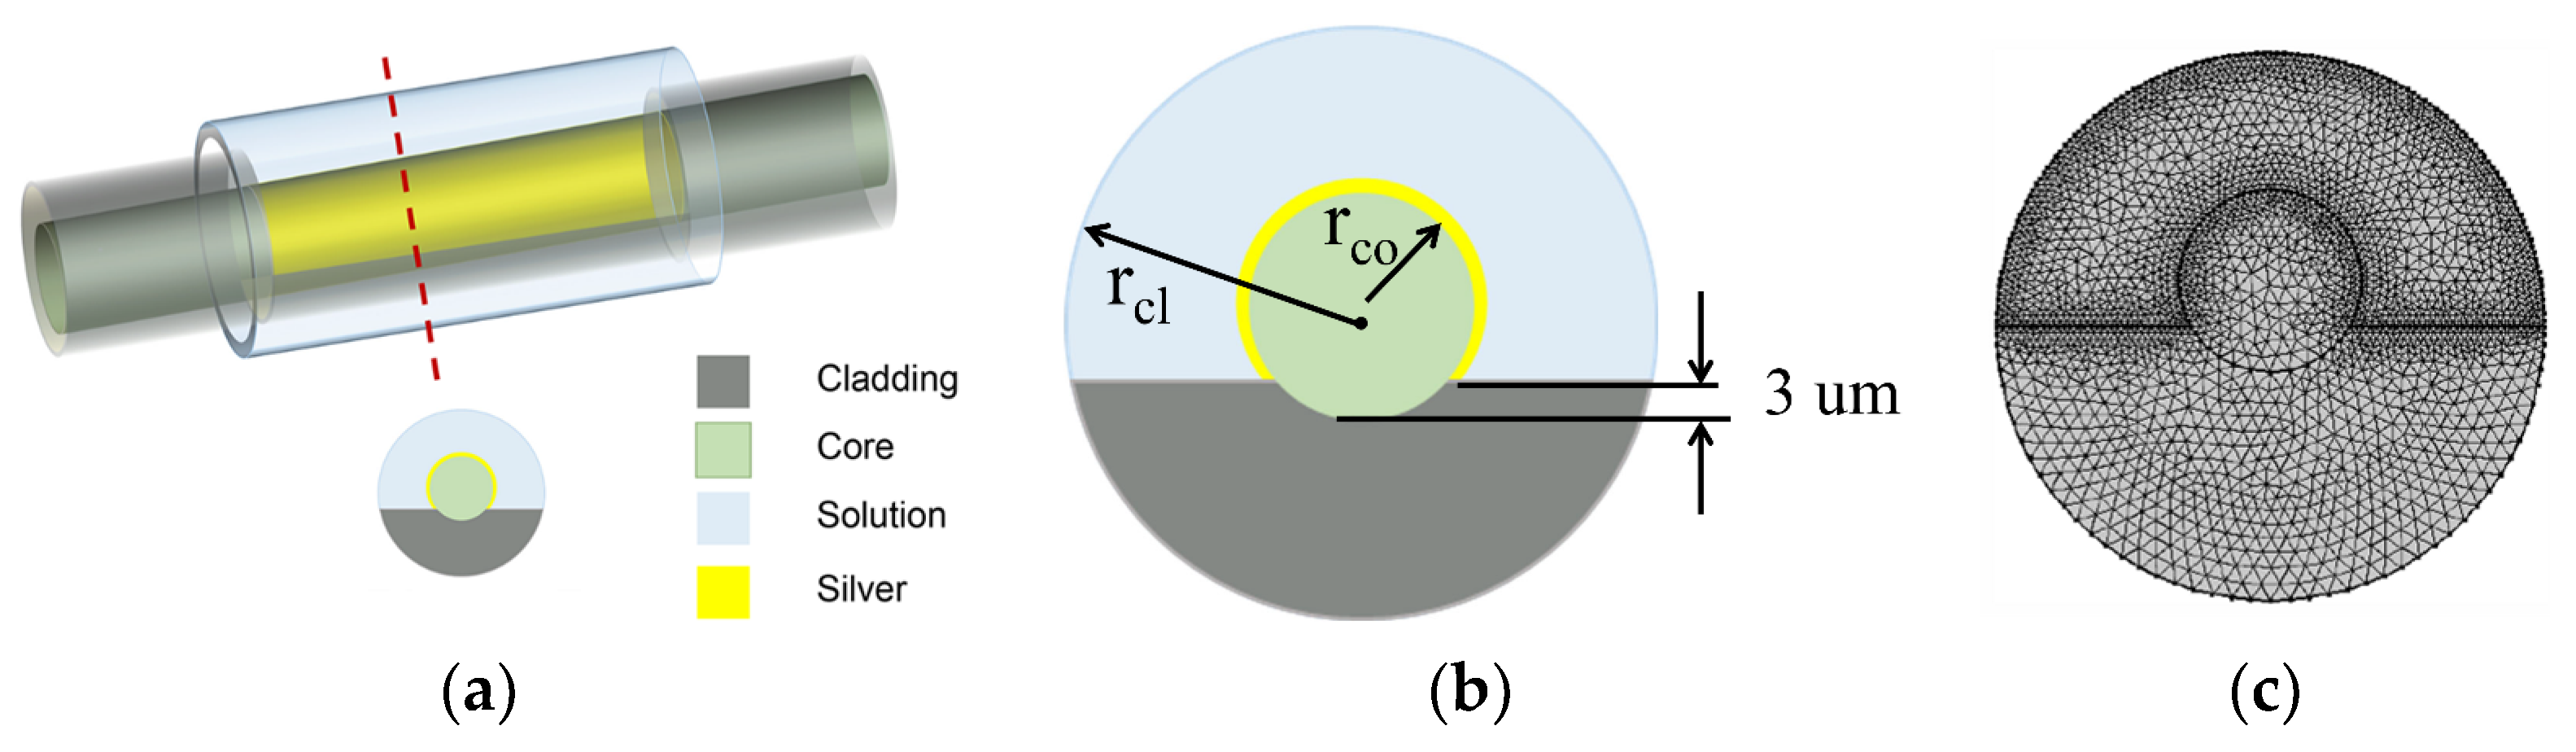
4.2. Simulation of the Sensing Area for RI Measurement
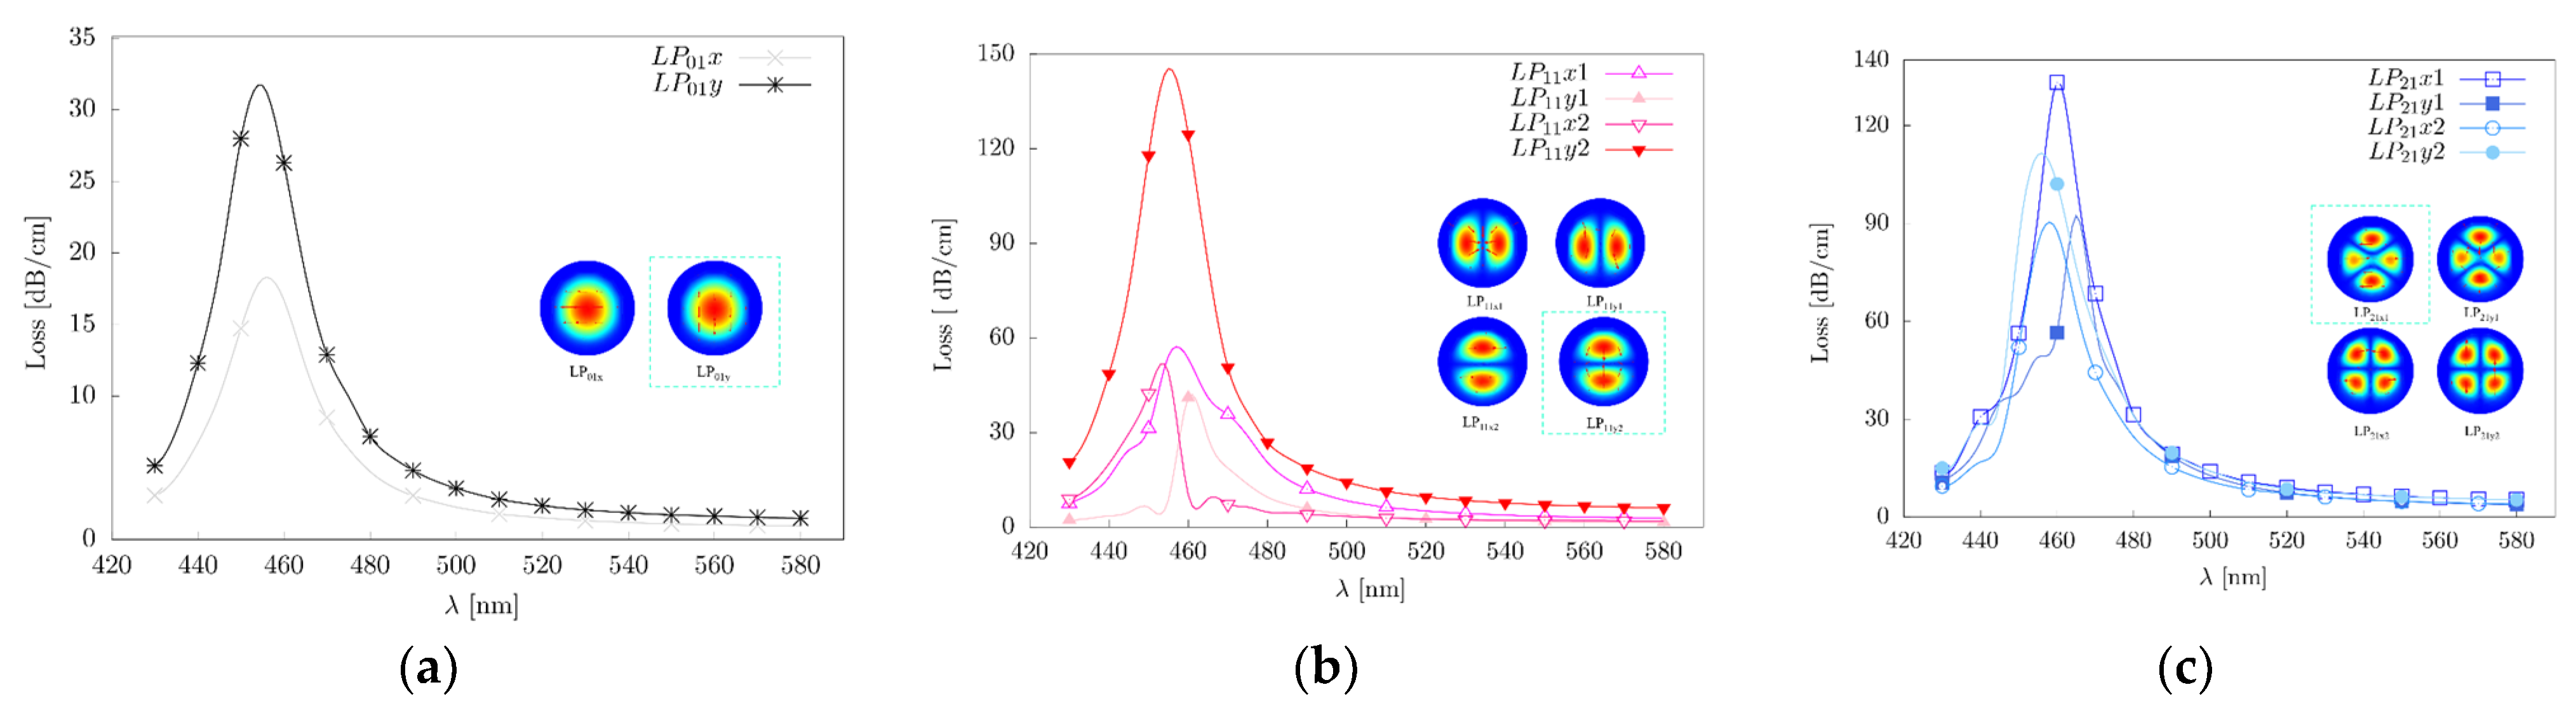
Utilizing the higher-order modes produced by the MSC, we designed an RI sensing area of this sensor based on SPR, as shown in Figure 7.
In this sensing area, most cladding of the fiber has been removed, and the exposed core is coated by a 40 nm thick silver film [13]. The thickness of the 40 nm silver film is selected according to multiple simulations of structures with different thicknesses. Such a structure can excite SPR between the silver film and the evanescent wave.
Ignoring the discontinuity of the interface between the sensing region and the optical fiber, we conduct a simplification of the 3D model shown in Figure 7a; thus, we simulate it in a 2D form, as shown in Figure 7b, since the mode field is same in the direction of propagation. In our model (COMSOL Multiphysics), the radius of the core is 6 um and that of the cladding is 18 um. We select Frequency Domain (ewfd) in Electromagnetic Waves module in which the scattered wave type is set as the plane wave in the Scattering Boundary Condition and the Transition Boundary Condition is set to Ag film. Additionally, the physis-controlled mesh is used in the Mesh, as depicted in Figure 7c.
The loss of SPR is given by [14]
L o s s = 8.686 2 π λ n n e f f   ( dB / m )
where n n e f f is the RI of the LP nm mode.
As shown in Figure 8, the loss of the LP nm mode is related to the polarization because of the noncircumferential symmetry of the sensing area of this sensor, as shown in Figure 7. If all the cladding of the sensing area is replaced by silver film, the loss of the LP nm mode is assumed to be independent of the polarization, and its distribution is marked by the boxes in Figure 8.
Among the modes shown in Figure 8, the LP01y, LP11y2, and LP21x1 mode are identified as the LP01, LP11, and LP21 modes due to their loss curves with the largest variation. Under such conditions, where these polarization direction modes are adopted, the sensing structure shows high loss and are extremely sensitive in solutions with different RI. To verify this view, the response curves of the three modes to RI are shown in Figure 9.
The intensity modulation method [15] is adopted to demodulate the losses of the above modes (the LP 01 , LP 11 , and LP 21 mode), ranging from 430 nm to 580 nm. This result is defined as Iloss. The fitting results of Iloss are shown in Figure 10, and the sensitivity defined as the loss over RI of each order mode is shown in Table 2. Actually, in the sensing area, the LP 11 mode and the LP 21 mode are used separately to excite SPR to improve the sensitivity of this sensor. The sensitivity of the fundamental mode is calculated only for the comparison among modes. It illustrates clearly that the sensitivity of the sensing area of this sensor for each mode exhibits high linearity. Besides linearity, the value of sensitivity of the LP 11 mode and the LP 21 mode is increased by approximately 330% and 360%, respectively. These values are attributed to the controlled energy distribution of the mode in the sensing area. Therefore, this means that using higher-order modes can improve the sensitivity of the SPR sensor.
Besides the sensitivity of the sensor, another important indicator is the resolution of the RI. Referring to the parameters of a photodetector (0.1–0.35 A/W, 430–600 nm, DET10A2, THORLABS), we set the minimum detected photocurrent as 1.0 nA and the dark current as 0.3 nA, with a photoelectric conversion rate of 0.2 A/W. Then, the minimum detected loss I m i n can be calculated by
I m i n = 10 l o g ( Δ P / P i n )  
Δ P = P i n P o u t  
Assuming that the incident power ( P i n ) of the sensing area of this sensor is 10 mW and the output power ( P o u t ) is 5 × 10⁻⁶ mW corresponding to the minimum detected photocurrent, I m i n is 2.1715 × 10 6 dB . According to the sensitivity shown in Table 2, the RI resolution of our sensor, using the LP 11 mode ( LP 21 mode), increases to 2.6 × 10 4 RIU ( 2.4 × 10 4 RIU), which is 7.6 times higher than that of a similar sensing area ( 1.83 × 10 3 RIU ), determined by Kort Bremer et al. [16]. Therefore, these results show that because of the higher-order modes, the sensitivity and the RI resolution of the SPR sensor can be improved significantly.

4.3. Discussions

In this section, we will discuss the reliability and drawbacks of the simulation model. Additionally, the experimental feasibility and strategies to improve the performance of our sensor are described through the theoretical analysis and existing technology.
The model of the sensing area is inferred to be reliable based on the following reasons. Firstly, the simulation results are consistent with the theoretical analysis results. This indicates that the higher-order mode has a high energy proportion in the cladding, and can fully excite SPR; therefore, in the sensing area, the RI sensitivity and resolution of higher-order modes are much higher than those of the fundamental mode. Secondly, the reliability of the model is verified from the experimental results of others. According to Table 1 and I m i n , the RI sensitivity of the fundamental mode is 1.1 × 10 3 RIU. This result roughly equals the experimental results of Kort Bremer et al.( 1.83 × 10 3 RIU ) [16], but is slightly lower than that of Liu et al. ( 6.1 × 10 4 RIU ) [17]. The reason is that there is still a small part of cladding left in the sensing area. The cladding is not completely removed, which fails to fully utilize the energy of the cladding in the sensing area to excite SPR.
Although the reliability of the model is verified, it also shows that the shortcoming of the model is that it cannot fully utilize the energy in the cladding. As we use the LP11 and the LP21 mode to excite SPR, these modes can be obtained only by partially stripping the cladding in the simulations, which is different from the results in the actual experiments. In reality, these modes propagate in the core of fiber without cladding, exposed to the solution with high loss. However, this cannot be acquired in the simulations, since the simulations need to meet the boundary condition.
The proposed sensor is experimentally feasible, using higher-order modes. In the experiment, the usage and generation of the LP11 and the LP21 mode is of great necessity and importance. First, the loss of these modes is low, which has little effect on the intensity modulation compared to other higher-order modes, such as the LP0m (m ≥ 2), the LP1m (m ≥ 2), and the LP2m (m ≥ 2) mode. Second, it is possible to fabricate a few-mode fiber with low loss in the visible band. On the one hand, in the area of communication, a few-mode fiber has already been developed which can support the LP 01 , LP 11 , and LP 21 mode, propagating with a loss of less than 0.21 dB/km (FM GI-4, 1550 nm, Yangtze Optical Fiber and Cable Co., Ltd., Shanghai, China). The processing experience and fabricating procedures of this fiber may be helpful to make a few-mode fiber in the visible band. On the other hand, the length of few-mode fiber is short (~cm) in the sensor, resulting in low loss of transmission, which can be ignored. Third, it is realistic to make the LP01-LP11 coupler and the LP01-LP21 coupler with high γ in a wide range of visible bands due to the former coupler has been fabricated [11]. Finally, the processes associated with the manufacture of sensing zones are well established. The sensing area can be processed by the wheel-based side grinding method [18,19]. Then, Ag layers (40 nm in thickness) can be deposited on the sensing area using a vacuum deposition machine (ZZS-700B, Chengdu Vacuum Machinery, Chengdu, China) at a certain working pressure and specific rates [20].
To further improve the performance of our sensor, we present two methods. One is to replace the sensing area with a new structure. In view of the experiment, the performance of the sensor might be improved by removing all the cladding or replacing the sensing area by some complex structures which can leak more power [21,22,23,24]. However, due to the complexity of these structures, it is unrealistic to evaluate the performance of these structures using theory and simulations. The other method is by enhancing the intensity sensitivity of the detector to achieve a high RI resolution of the sensor. For example, adding the pixel number is a method to achieve this goal, which can be proved by Kort’s experiment, where the RI solution increases from 1.83 × 10 3 RIU to 5.96 × 10 4   RIU [16]. Moreover, in other experiments, using a smart phone camera instead of a CMOS camera increases the RI resolution of the sensor from 6.1 × 10 4 RIU [17] to 7.4 × 10 5 RIU [25]. As for our model, if the minimum detected photocurrent is 0.4 nA and the maximum dark current is 0.3 nA, the minimum detected loss can be improved to 5.7891 × 10 7 dB. Then, according to the sensitivity shown in Table 2, the RI resolution of our sensor, using the LP 11 mode ( LP 21 mode), increases to 6.8 × 10 5 RIU ( 6.4 × 10 5 RIU).
Here we list a commercial SPR instrument (Biosuplar 6), whose RI resolution is 2.7 × 10 5 RIU [25] as a comparison. It shows that, through the proposed methods, it is promising to improve the performance of our sensor at a low cost, making it comparable with the above-mentioned instrument in terms of the RI resolution.
Based on this model, it is possible to fabricate a sensor using a higher-order mode to achieve high sensitivity and resolution of the RI at a low cost.

5. Conclusions

An SPR-based optical fiber sensor with pure high-order modes produced by an MSC is proposed and simulated. This designed SPR sensor containing an MSC can enhance the strength of the interaction between the propagation mode and the silver film. Thus, the sensitivity of the sensor using the LP11 mode (the LP21 mode) increases by approximately 330% (360%), which can be explained by theoretical calculations. The structural parameters of MSC are optimized to produce pure higher-order modes. In the sensing area of this sensor, the intensity modulation is adopted to calculate the variation of detected light intensity to measure RI. The RI resolution of our sensor, using the LP 11 mode ( LP 21 mode), is 2.6 × 10 4 RIU ( 2.4 × 10 4 RIU). Therefore, the sensor presented in this study provides an optimum device for the measurement of RI. Related experiments will be carried out in the future to further verify our results.

Author Contributions

Conceptualization, C.Y. and J.Z.; methodology, C.Y., H.Y. and D.J.; software, C.Y. and J.Z.; validation, C.Y., B.Y., Q.W. and J.Z.; formal analysis, C.Y. and B.Y.; investigation, C.Y.; writing—original draft preparation, C.Y.; writing—review and editing, C.Y., B.Y., Q.W., J.Z. and D.J.; visualization, C.Y.; supervision, H.Z., H.Y., H.F. and D.J.; project administration, D.J.; funding acquisition, D.J. All authors have read and agreed to the published version of the manuscript.

Funding

This work was funded in part by the National Natural Science Foundation of China (grant number: U1813207, 61875152) and the Key Projects in the Tianjin Science and Technology Pillar Program, grant number 20YFZCSY00390, and in part by the Foundation of Wenzhou Safety (Emergency) Institute of Tianjin University under grant TJUWYY2022029.

Institutional Review Board Statement

Not applicable.

Informed Consent Statement

Not applicable.

Data Availability Statement

The data underlying this article will be shared upon reasonable request to the corresponding author.

Conflicts of Interest

The authors declare no conflict of interest.

References

  1. Homola, J. Surface Plasmon Resonance Sensors for Detection of Chemical and Biological Species. Chem. Rev. 2008, 108, 462–493. [Google Scholar] [CrossRef]
  2. Xue, T.; Liang, W.; Li, Y.; Sun, Y.; Xiang, Y.; Zhang, Y.; Dai, Z.; Duo, Y.; Wu, L.; Qi, K.; et al. Ultrasensitive detection of miRNA with an antimonene-based surface plasmon resonance sensor. Nat. Commun. 2019, 10, 28. [Google Scholar] [CrossRef] [PubMed]
  3. Liu, Y.; Peng, W. Fiber-Optic Surface Plasmon Resonance Sensors and Biochemical Applications: A Review. J. Light. Technol. 2021, 39, 3781–3791. [Google Scholar] [CrossRef]
  4. Snyder, A.W.; Love, J.D. Optical Waveguide Theory; Springer: New York, NY, USA, 1983; p. 208. [Google Scholar]
  5. Feng, D.; Liu, G.; Zhang, M.; Jia, D. D-shaped fiber optic SPR biosensors based on a metal-graphene structure. Chin. Opt. Lett. 2013, 11, 110607. [Google Scholar] [CrossRef] [Green Version]
  6. Zhang, Y.; Wang, F.; Qian, S.; Liu, Z.; Wang, Q.; Gu, Y.; Wu, Z.; Jing, Z.; Sun, C.; Peng, W. A Novel Fiber Optic Surface Plasmon Resonance Biosensors with Special Boronic Acid Derivative to Detect Glycoprotein. Sensors 2017, 17, 2259. [Google Scholar] [CrossRef] [Green Version]
  7. Saha, B.; Goswami, N.; Saha, A. Highly sensitive surface-plasmon-resonance- based fiber optic breast cancer detection by shining a Bessel–Gauss beam: A wave-theory-based approach. Appl. Opt. 2021, 60, 7027–7035. [Google Scholar] [CrossRef]
  8. Baiad, M.D.; Kashyap, R. Concatenation of surface plasmon resonance sensors in a single optical fiber using tilted fiber Bragg gratings. Opt. Lett. 2015, 40, 115–118. [Google Scholar] [CrossRef]
  9. Arcas, A.D.S.; Dutra, F.D.S.; Allil, R.C.S.B.; Werneck, M.M. Surface Plasmon Resonance and Bending Loss-Based U-Shaped Plastic Optical Fiber Biosensors. Sensors 2018, 18, 648. [Google Scholar] [CrossRef] [Green Version]
  10. Ren, Z.-H.; Wang, Q.; Zhao, W.-M.; Wang, L.; Jiang, C.-Q.; Cong, X.-W.; Yan, X.; Zhu, A.-S.; Qiu, F.-M.; Chen, B.-H.; et al. A High-FOM surface plasmon resonance sensor based on MMF-TUMMF-MMF structure of optical fiber. Opt. Fiber Technol. 2022, 72, 102970. [Google Scholar] [CrossRef]
  11. Yao, H.; Shi, F.; Wu, Z.; Xu, X.; Wang, T.; Liu, X.; Xi, P.; Pang, F.; Zeng, X. A mode generator and multiplexer at visible wavelength based on all-fiber mode selective coupler. Nanophotonics 2020, 9, 973–981. [Google Scholar] [CrossRef] [Green Version]
  12. Zhang, S.J.; Jin, J.M. Computation of Special Functions; John Wiley & Sons: New York, NY, USA, 1996; p. 126. [Google Scholar]
  13. Rakić, A.D.; Djurišić, A.B.; Elazar, J.M.; Majewski, M.L. Optical properties of metallic films for vertical-cavity optoelectronic devices. Appl. Opt. 1998, 37, 5271–5283. [Google Scholar] [CrossRef] [PubMed]
  14. Du, Y.; Li, S.-G.; Liu, S. Wavelength-selective characteristics of high birefringence photonic crystal fiber with Au nanowires selectively filled in the cladding air holes. Chin. Phys. B 2012, 21, 094219. [Google Scholar] [CrossRef]
  15. Yuhashi, K.; Ida, J.; Kubodera, S.; Watanabe, K.; Nishiyama, M. A surface plasmon resonance temperature sensor using TiO2 nanoparticles on hetero-core fiber optic structure with Au thin film. Jpn. J. Appl. Phys. 2022, 61, 056501. [Google Scholar] [CrossRef]
  16. Bremer, K.; Roth, B. Fibre optic surface plasmon resonance sensor system designed for smartphones. Opt. Express 2015, 23, 17179–17184. [Google Scholar] [CrossRef]
  17. Liu, Y.; Chen, S.; Liu, Q.; Masson, J.-F.; Peng, W. Compact multi-channel surface plasmon resonance sensor for real-time multi-analyte biosensing. Opt. Express 2015, 23, 20540–20548. [Google Scholar] [CrossRef]
  18. Wang, Q.; Jing, J.Y.; Wang, X.Z.; Niu, L.Y.; Zhao, W.M. A D-Shaped Fiber Long-Range Surface Plasmon Resonance Sensor with High Q-Factor and Temperature Self-Compensation. IEEE Trans. Instrum. Meas. 2020, 69, 2218–2224. [Google Scholar] [CrossRef]
  19. Tang, J.; Zhou, J.; Guan, J.; Long, S.; Yu, J.; Guan, H.; Lu, H.; Luo, Y.; Zhang, J.; Chen, Z. Fabrication of Side-Polished Single Mode-Multimode-Single Mode Fiber and Its Characteristics of Refractive Index Sensing. IEEE J. Sel. Top. Quantum Electron. 2017, 23, 238–245. [Google Scholar] [CrossRef]
  20. Luo, J.; Liu, G.-S.; Zhou, W.; Hu, S.; Chen, L.; Chen, Y.; Luo, Y.; Chen, Z. A graphene–PDMS hybrid overcoating enhanced fiber plasmonic temperature sensor with high sensitivity and fast response. J. Mater. Chem. C 2020, 8, 12893–12901. [Google Scholar] [CrossRef]
  21. Ning, W.; Zhang, C.; Tian, Z.; Wu, M.; Luo, Z.; Hu, S.; Pan, H.; Li, Y. Ω-shaped fiber optic LSPR biosensor based on mismatched hybridization chain reaction and gold nanoparticles for detection of circulating cell-free DNA. Biosens. Bioelectron. 2023, 228, 115175. [Google Scholar] [CrossRef]
  22. Chauhan, M.; Singh, V.K. TiO2 coated tapered optical fiber SPR sensor for alcohol sensing application. J. Opt. 2023, 1–11. [Google Scholar] [CrossRef]
  23. Li, G.; Singh, R.; Guo, J.; Zhang, B.; Kumar, S. Nb2CTx MXene-assisted double S-tapered fiber-based LSPR sensor with improved features for tyramine detection. Appl. Phys. Lett. 2023, 122, 083701. [Google Scholar] [CrossRef]
  24. Liu, Y.; Chen, Y.; Li, C.; Yang, X. Copper-multiwalled carbon nanotubes decorated fiber-optic surface plasmon resonance sensor for detection of trace hydrogen sulfide gas. Opt. Fiber Technol. 2023, 76, 103221. [Google Scholar] [CrossRef]
  25. Liu, Y.; Liu, Q.; Chen, S.; Cheng, F.; Wang, H.; Peng, W. Surface Plasmon Resonance Biosensor Based on Smart Phone Platforms. Sci. Rep. 2015, 5, 12864. [Google Scholar] [CrossRef] [PubMed] [Green Version]
Figure 1. Schematic diagram of SPR sensor with a pure higher-order mode.
Applsci 13 04020 g001
Figure 2. The proportion of power of the L P n m mode in the cladding with the different normalized frequency. The inset clearly depicts this proportion when V > 8.
Applsci 13 04020 g002
Figure 3. The proportion of enhanced power as the normalized frequency increases.
Applsci 13 04020 g003
Figure 4. The mode effective RI curves for the LP 01 ,   LP 11 , and LP 21 modes with the core radius of the fiber a   ( um ) .
Applsci 13 04020 g004
Figure 5. A model of the visible MSC in the area of fusing. (a) is the OXZ plane, and (b) is the OXY plane, L is the fusing length of the fiber, and D is the core distance between two cores.
Applsci 13 04020 g005
Figure 6. Simulations of γ at the central wavelength and the power of the MSC in the visible band. (a) the coupling efficiency ( γ ) of the MSC at λ = 500   nm , with different core distance (D) and varied coupling length (L). (b) The normalized power under different wavelengths. (c) γ of the LP 01 LP 21 coupler at λ = 500   nm , with different D and varied L.
Applsci 13 04020 g006
Figure 7. Schematic diagram of the sensing area of this sensor with material settings. (a) 3D mode. (b) Cross section of the sensing area. (c) Mesh of the sensing area.
Applsci 13 04020 g007
Figure 8. The spectrum of loss spectra of the LP nm mode and the corresponding optical field (n = 1.33). (a) Spectra and electricity of the LP 01 mode; (b) spectra and electricity of the LP 11 mode; (c) spectra and electricity of the LP 21 mode.
Applsci 13 04020 g008
Figure 9. The spectrum of loss of the LP nm mode at different RI. (a) The spectrum of loss of the LP 01 mode. (b) The spectrum of loss of the LP 11 mode. (c) The spectrum of loss of the LP 21 mode. The loss data are not provided when n = 1.38, since there are no stable electric fields in our simulation.
Applsci 13 04020 g009
Figure 10. The loss of the LP nm mode under different RI.
Applsci 13 04020 g010
Table 1. Parameter indices related to the SPR sensor.
IndexParametric MeaningIndexParametric Meaning
Fl (R)The electric field γ The efficiency of converting the fundamental mode into a higher order mode of MSC
RThe normalized radius λ The wavelength
aThe radius of the fiber n e f f The effective RI of the LP nm mode
kThe wavenumber in the vacuumDThe core distance
β the propagation constantLThe fusion length of fiber
n c o the RI of the core r c o The radius of the core in the simulations
n c l the RI of the cladding r c l The radius of the cladding in the simulations
Uthe core parameter L o s s The loss of SPR in the sensing area
Wthe cladding parameternThe refractive index in the simulations
VThe normalized frequencyIlossThe total loss of the LP nm mode, including the LP 01 , LP 11 , and LP 21 mode
η L P 01 l i g h t The efficiency of a light source producing the fundamental mode I m i n The minimum detected loss
η L P n m c l The proportion of the power of the LP nm mode in the cladding to the total power P i n The incident power
η The ratio of the power enhancement of the higher order mode to the fundamental mode P o u t The output power
Table 2. The sensitivity of the LP nm mode by intensity modulation ( × 10 3   dB /RIU).
L P 01 L P 11 L P 21
Sensitivity1.958.459.03
Normalization
of Sensitivity
1.004.324.62
Correlation coefficient0.980.980.98
Disclaimer/Publisher’s Note: The statements, opinions and data contained in all publications are solely those of the individual author(s) and contributor(s) and not of MDPI and/or the editor(s). MDPI and/or the editor(s) disclaim responsibility for any injury to people or property resulting from any ideas, methods, instructions or products referred to in the content.

