1. Introduction
The corpus callosum (CC) is the largest and most clearly identifiable white matter (WM) structure of the mammalian brain; it is the main telencephalic commissure, and connects the two cerebral hemispheres, integrating their activities and linking two cognitive systems that would be able to work independently. The CC is involved in cognitive and social mental operations, such as imitative behavior [
1] and moral judgement [
2]. The CC’s integrity is, therefore, fundamental to executing the functions allowing the relationships between individuals and between the human and physical environment, thus, contributing to making us what we are. The CC also plays a crucial role in cognitive functions, including motor coordination, processing speed, and visuospatial memory [
3,
4], and in emotional awareness, which all tend to decline with age [
5]. A large body of experimental evidence and several clinical studies have evidenced that human pathologies with behavioral and cognitive deficits (such as schizophrenia, multiple sclerosis, and dementia, including Alzheimer’s disease [
6,
7,
8,
9]) are associated with important changes in the shape, dimensions, and/or composition of the CC, which are likely due to a net loss of interhemispheric fibers [
10]. The CC is a thick bundle of myelinated and unmyelinated axons, mostly originating from pyramidal neurons in the II/III and V layers of the cerebral cortex [
11]; they release glutamate as a neurotransmitter, also at specific axoglial junctions within the CC [
12,
13], and a very low percentage use γ-aminobutyric acid [
14]. Myelin, the insulating lipidic layers of membrane wrapped around axons by oligodendrocytes (ODCs), is essential for normal impulse conduction. The myelin sheath is composed mainly of lipid (phospholipid, glycolipid and cholesterol; 70 to 85%) and a low proportion of protein (15 to 30%) [
15]. Myelin production is regulated by a category of ODCs precursor cells that fire action potentials and dynamically interact with electrical impulse transmission in neural circuits [
10].
The human CC is divided into five anatomical regions, which comprise, from front to back, the genu, body or trunk (subdivided into anterior, middle, and posterior body), isthmus, and splenium [
16]. Several methods, principally based on geometric criteria, have been proposed and exploited to define these subregions, given the lack of clear edges between them [
16,
17,
18,
19]. These callosal regions display different fiber compositions: fibers with a large diameter have been identified in the posterior part of the splenium and in the body, regions known to contain interhemispheric sensory fibers that cross the commissure and exchange information at high speed; on the other hand, smaller fibers, mainly connecting associated cortical areas, have been described in the rostrum, genu, and anterior body [
20,
21]. Accordingly, a different myelination is reported: in vitro (histological) and in vivo (functional) analyses evidenced a higher amount of myelin in the posterior splenium and posterior body [
22,
23]. The difference in composition is also related to different functions, as evidenced in patients who have undergone surgical resection of the posterior or anterior part of the CC.
The process of fiber myelination becomes significant at about 6 months of postnatal life in the splenium and at around 8 months in the genu. Myelination proceeds from posterior to anterior [
24,
25], consistently with the known mechanism through which myelination of primary cortical areas (somatic sensory, motor, auditory, visual), connected through the isthmus and splenium, precedes the myelination of the body, genu, and rostrum, connecting the more anterior associative areas. Myelination is faster during childhood and adolescence and continues slowly during middle age. Moreover, besides the variation in myelin content, maturation and aging are also characterized by deep changes in the caliber and density of myelinated and unmyelinated axons, with structural degradation of myelin sheaths typical of advanced age [
26].
Recently, different profiles of protein expression have also been described in the three main CC regions (genu, body, and splenium). In particular, the expression of proteins related to antioxidant activity and glucose metabolism was shown to be higher in the splenium compared with the genu and body [
27]. During aging, the CC is subject to a physiological loss of myelin content, which is more pronounced and occurs earlier in the anterior regions than in posterior [
28].
Among the many analytical techniques available, Fourier-transform infrared imaging (FTIRI) spectroscopy is a powerful and label-free vibrational tool, extensively applied to analyze the biomolecular composition and building of cells and tissues [
29,
30,
31,
32]. FTIRI can provide, at the same time and on the same sample, an overview of the chemical composition and features of the cellular components and of the changes induced by pathologies or biological conditions [
33], through an analysis of the position, intensity, and width of IR bands, providing the molecular fingerprints of the most relevant biological molecules (proteins, lipids, carbohydrates, and nucleic acids) within the studied samples.
Very recently, FTIRI has been applied to study brain damage in animal models, specifically to study axonal changes after traumatic brain injury [
34,
35] or to study, in rat brain, the axonal changes intervening during aging [
36]. It was reported that modifications in the commissure’s chemical composition could be detected before the structural alteration; moreover, it was possible to estimate the injury intervals in animal models of traumatic axonal injury, detecting how the composition of the CC changed according to the time elapsed from the head trauma, and, therefore, suggesting a potential application of this analysis in the field of forensic science and neurology [
34,
35].
In the present study, for the first time, a hyperspectral imaging analysis of post-mortem samples of human corpus callosum was performed by combining histological and Fourier-transform infrared Imaging data with multivariate and univariate analyses, with the aim of morpho-chemically characterizing the anterior and posterior regions of human CC, mainly focusing on lipids and proteins, and to highlight eventual differences in relation with aging.
2. Materials and Methods
2.1. Samples Collection and Preparation
A post-mortem study was performed on autopsy samples of human CC retrieved at the Department of Biomedical Sciences and Public Health, Legal Medicine Unit, Università Politecnica delle Marche. Human autopsy brains were obtained from 11 adult males who died of sudden death (myocardial infarction, traffic accident, etc.) in the period September 2021–February 2022. Subjects were divided into two groups according to their age at death: 6 donors with an average age of 30.7 ± 5.7 years (young, named Y), and 5 donors with an average age of 69.6 ± 8.5 years (old, named O). The study was conducted in accordance with the Declaration of Helsinki of 1975, as revised in 2013, and approved by the Ethics Committee of Università Politecnica delle Marche (protocol code 2019-373, date of approval 1 October 2020). Furthermore, all samples were rigorously anonymous and identified only using a numeric code.
CC samples were collected from both hemispheres, within a postmortem interval (PMI, the time between death and removal of the brain tissue from the cranial cavity) of 24–96 h, including the refrigeration of the corpses after their discovery. More in detail, the interhemispheric fissure was exposed and gently retracted. The CC was extracted and three cubic portions (ca. 0.5 × 0.5 × 0.5 cm) were collected from the areas corresponding to the genu (named
A), body (named
B), and splenium (named
C) [
37]. Samples with visible signs of decomposition were excluded. All samples were immediately frozen at −80 °C.
From each cubic portion, six sections (~10 µm thick) were cut at ~150 µm away from each other using a cryomicrotome. Sections were alternatively deposited onto CaF
2 optical windows (1 mm thick, 13 mm diameter) for FTIRI measurement, and onto glass supports for histological analysis [
38].
2.2. Histological Analysis
The sections deposited onto glass supports were stained using the Luxol Fast Blue sec. Klüwer-Barrera kit. This is specific for highlighting the presence of myelin, which appears colored in turquoise blue, while neurons and glial nuclei are pink/violet, and Nissl bodies are light pink. Then, sections were washed in distilled water and dehydrated very quickly through 95% absolute alcohol and xylene and mounted with resinous mounting medium (Bio-Optica, Milan, Italy). Samples were then analyzed using a Zeiss Axio Imager.A2 optical microscope. Images were acquired using an Axiocam 503 high-resolution camera.
2.3. Fourier-Transform Infrared Imaging Measurements and Data Analysis
FTIRI measurements were performed using a Bruker INVENIO-R interferometer coupled with a Hyperion 3000 Vis-IR microscope and equipped with a Focal Plane Array (FPA) detector operating at liquid nitrogen temperature (Bruker Optics, Ettlingen, Germany).
First, to identify the areas of interest, the microphotograph of each section was acquired using a television camera. Then, on each section, IR maps were acquired in transmission mode with a 15× condenser/objective. Each IR image was 164 × 164 µm size and was composed of 4096 pixel/spectra; the spatial resolution of each pixel was 2.56 × 2.56 µm. IR maps were acquired in the 4000–900 cm−1 spectral range, with a spectral resolution of 4 cm−1. Each pixel/spectrum was the result of 256 scans. Before starting acquisition of each sample, the background spectrum was acquired with the same parameters on a clean portion of the CaF2 optical window. All IR maps were opportunely pre-processed (OPUS 7.5 software package, Bruker Optics, Ettlingen, Germany); more in detail, they were submitted to the Atmospheric Compensation routine, to avoid carbon dioxide and water vapor atmospheric contributions, and then to Vector Normalization routine in the 4000–900 cm−1 spectral range, to correct differences in sample quantity; in fact, it is known that the intensity of the bands in absorption spectra is proportional not only to the concentration of the sample but also to the optical length of the light within it.
To pinpoint the topographical distribution of meaningful macromolecules, false color images were generated by integrating pre-processed IR maps under the following regions of interest (ROI): 3030–3000 cm−1 (stretching vibrations of =CH groups in unsaturated lipid alkyl chains; UNSAT); 3000–2800 cm−1 (stretching vibrations of CH2 and CH3 groups in saturated lipid alkyl chains; SAT), and 1700–1480 cm−1 (Amide I and II bands, representative of the vibrational modes of the peptide linkage in proteins; PRT). Different scales were adopted due to different IR absorbances displayed by the investigated macromolecules: black/blue colors indicated areas with the lowest absorbance values, while pink/white colors indicated areas with the highest ones (OPUS 7.5 software package, Bruker Optics, Ettlingen, Germany).
For each experimental group, 500 spectra were randomly extracted from each IR map and used for both multivariate and univariate analyses. Firstly, extracted IR spectra were converted in second derivative mode (Savitzky–Golay filter, 9 points of smoothing) and submitted to principal component analysis in the 3030–900 cm
−1 spectral range with no further preprocessing. PCA scores plots, and corresponding PC loadings were obtained (Origin PRO 2018 software). Then, the above-described extracted spectra were integrated under the following regions of interest: 3030–2800 cm
−1 (representative of saturated and unsaturated alkyl chains in lipids; LIP), 1780–1700 cm
−1 (representative of fatty acids; FA), and 1700–1480 cm
−1 (representative of proteins; PRT) [
39,
40]. Finally, for each experimental group, the average spectrum (centroids) and the average spectrum ± standard deviation (S.D.) spectra were also calculated (Averaging routine, OPUS 7.5), and submitted to a peak-fitting procedure in the 3030–2800 cm
−1 and 1700–1480 cm
−1 spectral regions, containing the vibrational modes of lipids and proteins, respectively. The number and position of all the underlying bands were evaluated using second derivative minima analysis and fixed during fitting procedure with Gaussian functions (GRAMS/AI 9.1, Galactic Industries, Inc., Salem, NH, USA). For each underlying peak, the exact position (expressed as wavenumbers) and the integrated area were obtained. Peaks assignment was performed according to the scientific literature. By using the integrated areas of meaningful bands, obtained as described above, specific band area ratios were calculated and statistically analyzed.
2.4. Statistical Analysis
Statistical analysis was performed with the software package Prism 6.0 (GraphPad Software, San Diego, CA, USA). All data were presented as mean ± standard deviation (S.D.). Statistical significance among groups was evaluated using Student’s t-test. Statistical significance was set at p < 0.05.
3. Results
Selected IR spectra of all the experimental groups were submitted to principal component analysis (PCA) in the 3050–900 cm
−1 range. In
Figure 1, the PCA scores plots obtained for the
A,
B, and
C spectral populations of both the
Y and
O groups and the corresponding PC1 loadings are displayed. With regard to the CC samples of young specimens (
Y), only a poor segregation was observed between
AY and
CY (explained variance 48.2% along PC1 axis), with
BY spectra in an intermediate position and overlapping
AY ones (
Figure 1a). A better separation was displayed between
AO and
CO (explained variance 15.8% along PC2 axis); in this case, even if more grouped, the
BO spectra were in the middle, although they were closer to the
AO ones (
Figure 1b). The analysis of PC1 loadings evidenced that the main spectral differences were observed in both
Y and
O experimental groups in the 3030–2800 cm
−1 region, which was related to t he vibrational transitions of CH, CH
2, and CH
3 moieties in lipid alkyl chains (grey boxes); to a minor extent, spectral differences were observed in the 1780–1480 cm
−1 region, which was attributable to the vibrational modes of peptide linkage in proteins (pink boxes) (
Figure 1c,d).
The lack of segregation between the spectral population of CC portions, collected in the body region (B spectra) and the genu and splenium ones (A and C spectra, respectively), observed in the PCA scores plots of both Y and O experimental groups could be ascribable to the nature of the samples: in fact, there was an objective lack of a definite separation among the three regions within the tissue, and, hence, it is difficult to precisely collect CC portions in the intermediate region. Hence, to obtain reliable and reproducible data, we decided to continue the study focusing only on the anterior (genu, A) and posterior (splenium, C) regions of young (Y) and old (O) experimental groups.
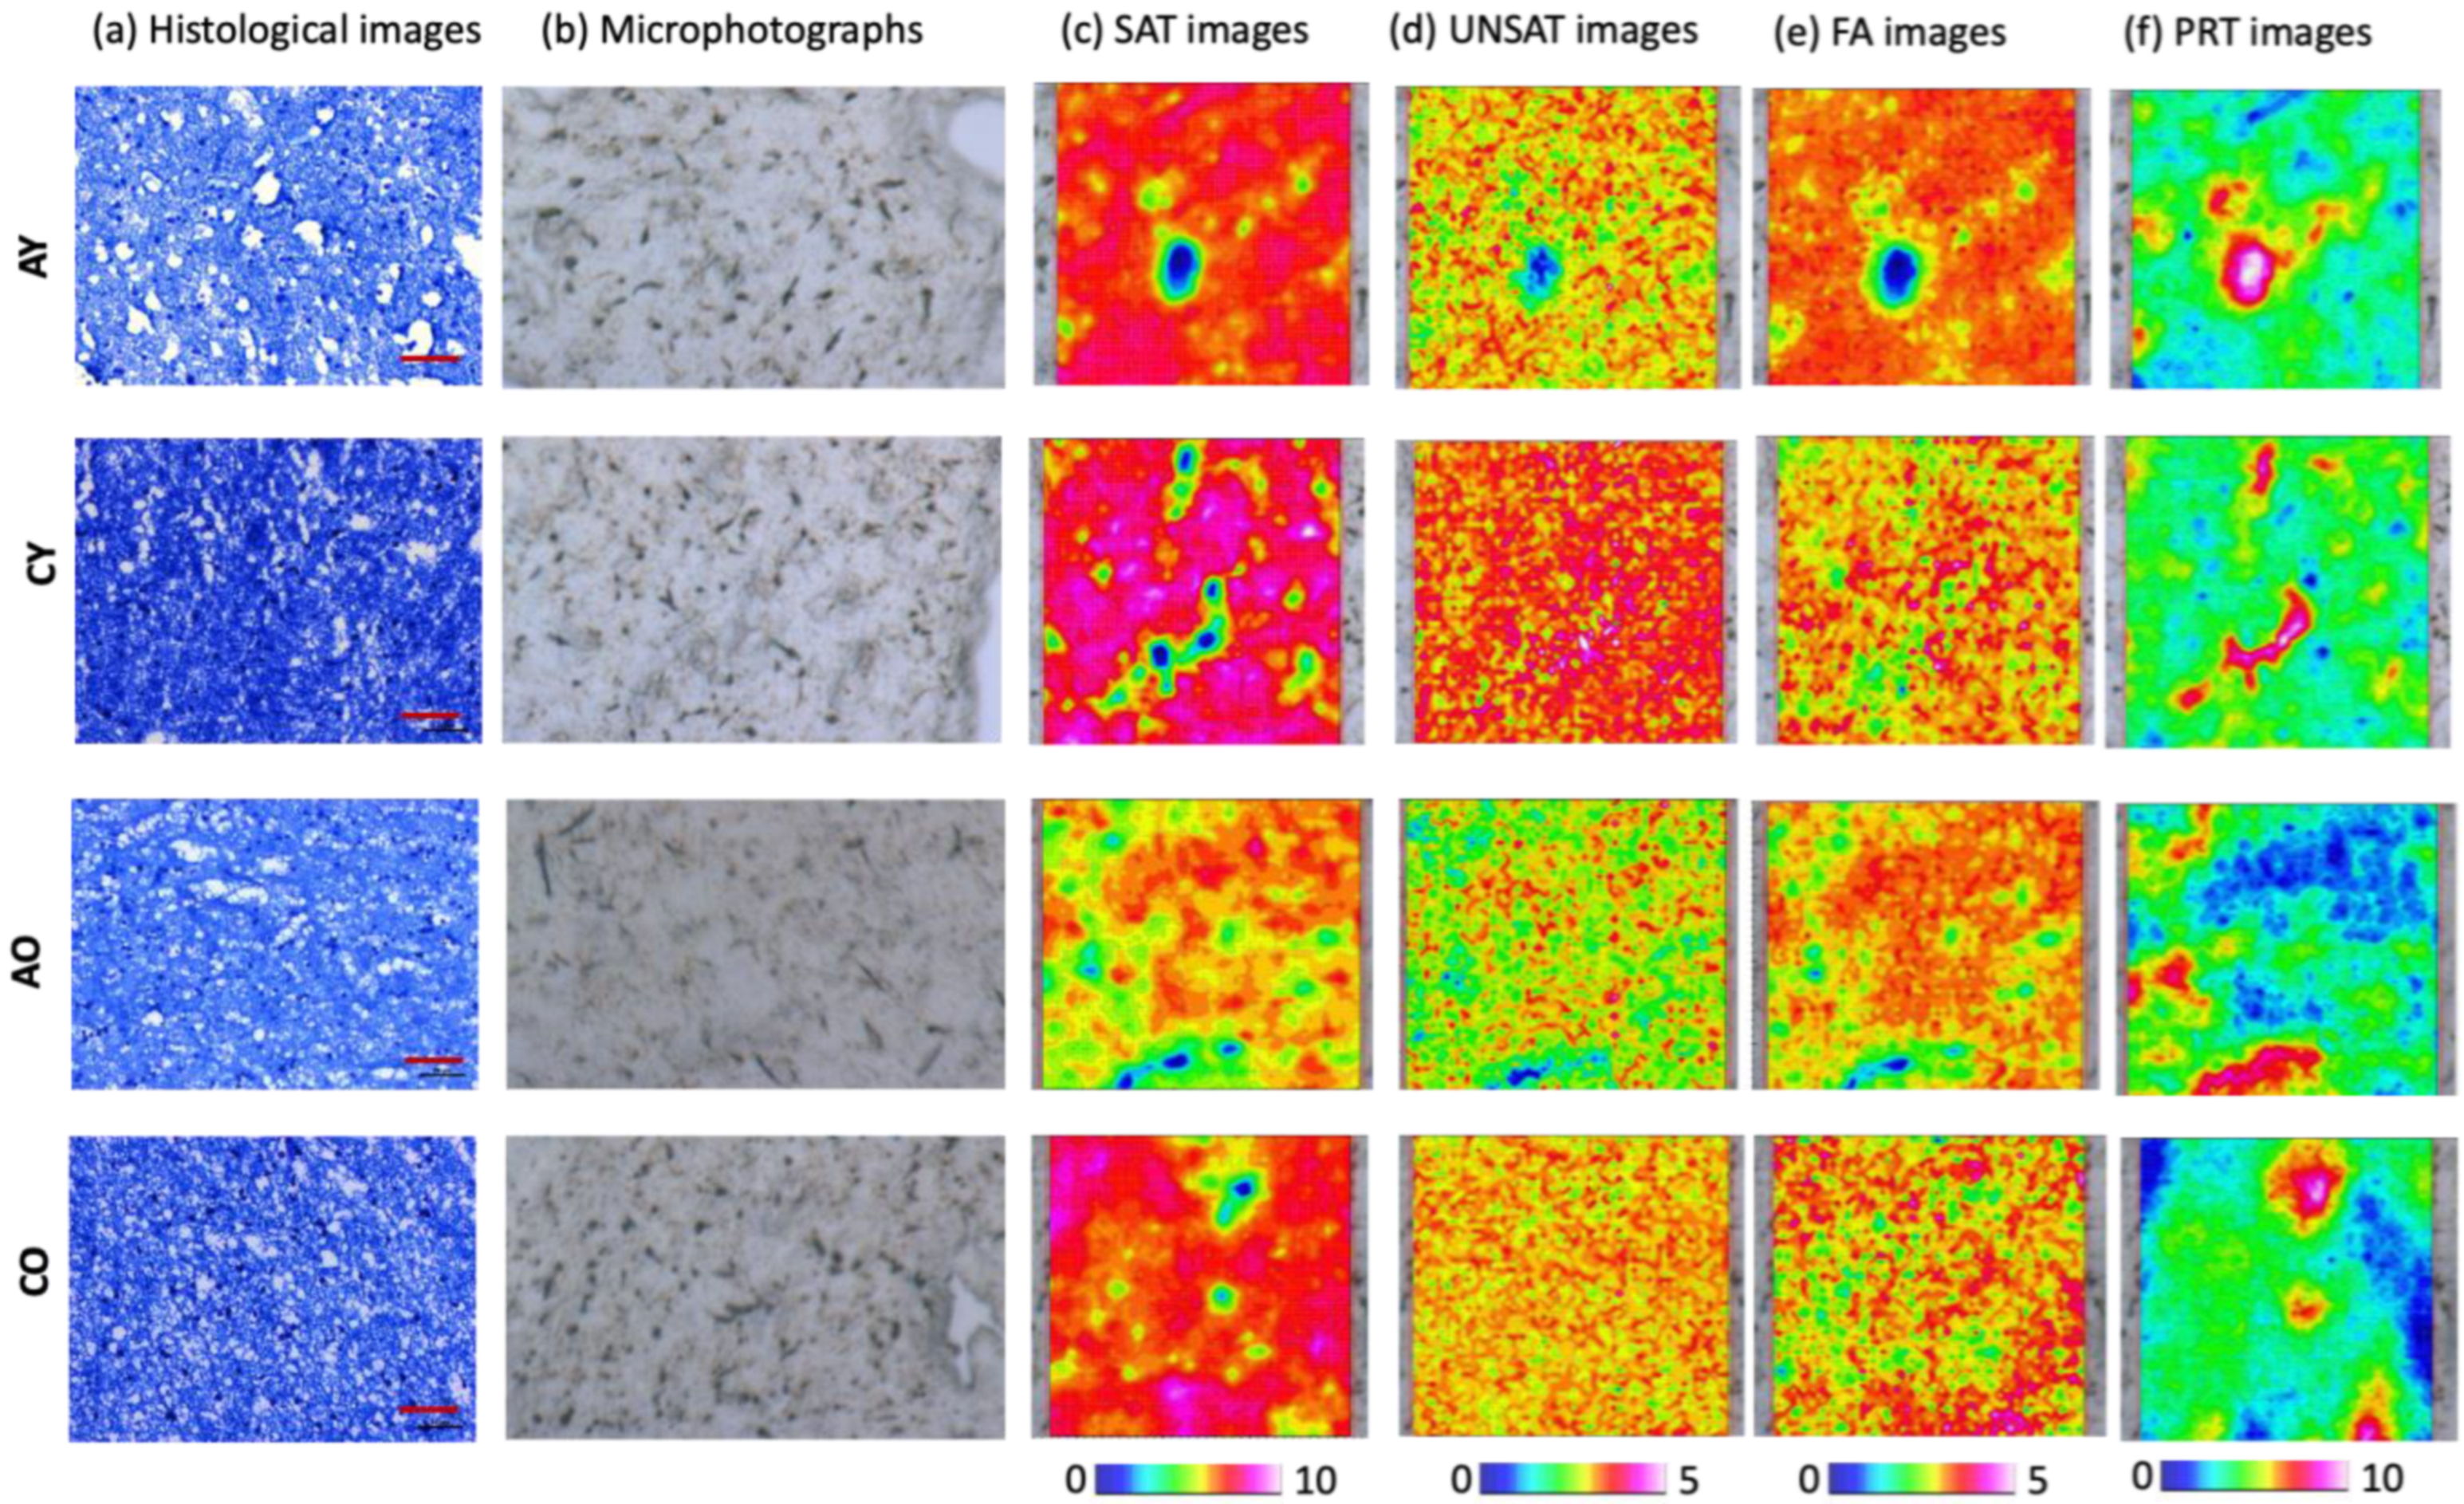
In
Figure 2, the imaging analysis combining histological and spectral images of the genu (
A) and splenium (
C) regions of the CC of
Y and
O groups is reported. The histological images, obtained using Luxol Fast Blue sec. Klüwer-Barrera staining, which allowed us to highlight the presence of both myelin (turquoise) and neurons and glial nuclei (violet), evidenced a homogeneous turquoise stain in all the analyzed sections, suggesting a ubiquitous presence of myelin. In particular, higher amounts of myelin were observed in the
CY sections than the
AY ones, and in
CO with respect to
AO; no evident difference was highlighted between
AY and
AO, nor between C
Y and C
O. The analysis of IR images provided additional information regarding the chemical composition and topographical distribution of meaningful macromolecular compounds, such as unsaturated and saturated lipids, fatty acids, and proteins (
Figure 2c–f). As expected, the main component of all the analyzed sections was represented by lipids, including the saturated (SAT images,
Figure 2c) and unsaturated (UNSAT images,
Figure 2d) fractions, as well as fatty acids (FA images,
Figure 2e). Interestingly, higher levels of lipids were found in A
Y samples than
AO ones, and in
CY samples with respect to
CO (SAT, UNSAT, and FA images,
Figure 2c–e). Moreover, within each group, all the lipid components displayed an increasing gradient from the genu (
A) to the splenium region (
C). No meaningful differences were found in the protein content (PRT images,
Figure 2f).
In
Figure 3, the IR spectra of representative regions of
AY,
CY,
AO, and
CO are displayed. Assignments of the most relevant bands were performed according to relevant literature [
39,
41,
42,
43,
44,
45] and taking into account the biological nature of the samples: in this light, bands were not merely related to chemical groups, but also the most represented biomolecules within tissue samples were taken into account, leading us to divide, as commonly accepted, the biological infrared spectrum into regions assigned to specific groups of molecules [
30,
39]. The most significant bands are as follows: ~3010 cm
−1 (stretching vibration of =CH moiety in lipid alkyl chains); ~2956 cm
−1 and ~2870 cm
−1 (asymmetric and symmetric stretching vibrations of CH
3 groups in lipid alkyl chains); ~2921 cm
−1 and ~2850 cm
−1 (asymmetric and symmetric stretching vibrations of CH
2 groups in lipid alkyl chains); ~1735 cm
−1 (stretching vibration of C=O ester moiety in fatty acids), and ~1650 cm
−1 and ~1560 cm
−1 (Amide I and II band of proteins).
The macromolecular composition of the genu (
A) and splenium (
C) regions was better explored, also in relation with the age of donor subjects, by statistically analyzing the following band area ratios (
Figure 4): LIP/TBM (calculated as the ratio between the integrated areas of the range 3030–2800 cm
−1 and the sum of the ranges 3030–2800 cm
−1 and 1780–900 cm
−1, considered as the Total BioMass, TBM); FA/LIP (calculated as the ratio between the integrated areas of the 1780–1700 cm
−1 and 3030–2800 cm
−1 ranges); PRT/TBM (calculated as the ratio between the integrated areas of the 1700–1480 cm
−1 and TBM, already defined); and LIP/PRT (calculated as the ratio between the integrated areas of the 3030–2800 cm
−1 and 1700–1480 cm
−1 ranges). In particular, (i) by comparing
AY and
AO samples, significantly lower levels of lipids and fatty acids were found in
AO ones, as suggested by the LIP/TBM (total amount of lipids), FA/LIP (representative of the fatty acids fraction), and LIP/PRT (relative amount of lipids to proteins) ratios (
p < 0.05). Conversely, no different amounts of proteins were found (PRT/TBM;
p > 0.05). (ii) A similar trend was observed by comparing
CY and
CO samples, with a lower amount of lipids and fatty acids in
CO ones (LIP/TBM, FA/LIP, and LIP/PRT;
p < 0.05); in this case, no statistically significant difference was found in the protein component (PRT/TBM;
p > 0.05). (iii) With regard to the composition of the two regions, higher amounts of lipids and fatty acids were found in
CY than
AY, and in
CO than
AO (LIP/TBM, FA/LIP, and LIP/PRT;
p < 0.05); no statistically significant difference was found between
AY and
CY, nor between
AO and
CO with regard to the protein component (PRT/TBM;
p > 0.05).
To better elucidate the composition of the lipid fraction, the following band area ratios were investigated: A
CH/A
CH3 (calculated as the ratio between the areas of the peaks at 3010 cm
−1 and 2956 cm
−1), which was representative of the unsaturation degree in lipid alkyl chains; and A
CH2/A
CH3 (calculated as the ratio between the areas of the peaks at 2921 cm
−1 and 2956 cm
−1), which was representative of the saturation degree in lipid alkyl chains. From the statistical analysis of these ratios, which is shown in
Figure 5, the following considerations can be drawn: (i) with regard to the A
CH/A
CH3, a higher degree of unsaturation was observed in
Y than
O CC samples (
p < 0.05); furthermore, within each group, statistically significant higher amounts were found in
CY than
AY samples and
CO than
AO ones (
p < 0.05); (ii) a similar trend was displayed by the A
CH2/A
CH3 ratio, with longer saturated alkyl chains in
CY compared to
CO CC samples, and in
AY compared to
CO samples (
p < 0.05); within each group, higher values were found in
C samples compared to
A samples (
p < 0.05).
With regard to proteins, the peak-fitting analysis allowed us to identify the following underlying peaks related to proteins’ secondary structure [
46,
47]: 1697 cm
−1, 1682 cm
−1, and 1627 cm
−1 (β-sheet structures); 1655 cm
−1 (α-helix structures); and 1640 cm
−1 (random coil structures). The following band area ratios were taken into account: ALPHA (calculated as the ratio between the area of the peak at 1655 cm
−1 and the sum of the areas of all the peaks in the 1700–1480 cm
−1 interval); BETA (calculated as the ratio between the sum of the areas of the peaks at 1697 cm
−1, 1682 cm
−1, and 1627 cm
−1, and the sum of the areas of all the peaks in the 1700–1480 cm
−1 interval); RANDOM (calculated as the ratio between the area of the peak at 1640 cm
−1 and the sum of the areas of all the peaks in the 1700–1480 cm
−1 interval); and FOLDED/UNFOLDED (calculated as the ratio between the sum of the areas of the peaks at 1697 cm
−1, 1682 cm
−1, 1655 cm
−1, and 1627 cm
−1, corresponding to β-sheet and α-helix structures, named FOLDED, and the area of the peak at 1640 cm
−1, corresponding to random coil structures, named UNFOLDED). From the statistical analysis of these ratios, which is shown in
Figure 6, the following considerations can be drawn: (i) significantly higher amounts of α-helix and -sheet structures (ALPHA and BETA ratios;
p < 0.05), as well as lower levels of random coil ones (RANDOM ratio;
p < 0.05), were found in
AY compared to
AO and
CY compared to
CO samples; moreover, a higher amount of folded structures was displayed in
Y samples (in particular in
CY) than in
O ones (FOLDED/UNFOLDED;
p < 0.05); (ii) a higher quantity of α-helix structures was found in
CY samples compared to
AY ones (ALPHA;
p < 0.05), while similar levels were observed in
AO and
CO (ALPHA;
p > 0.05); (iii) higher amounts of -sheet structures were found in
A compared to
C samples, and both in
Y and
O samples (BETA;
p < 0.05); (iv) higher amounts of random coil structures (RANDOM) were observed in
AO and
CO samples compared to A
Y and
CY ones (RANDOM;
p < 0.05).
4. Discussion
To date, to the best of our knowledge, a complete characterization of the macromolecular composition of CC has not been available in humans, nor in relation to different regions or to the age of the specimen. Hence, in this study, for the first time, hyperspectral imaging analysis of the genu and splenium regions of this commissure has been performed, by exploiting a multidisciplinary approach that combined histological, FTIRI, and multivariate analyses.
FTIR spectroscopy is an analytical technique which studies how chemical bonds can change their vibration due to the interaction with an appropriate infrared frequency. It has been first used to identify the functional groups/bonds in homogeneous organic compounds, both solid and liquid. This IR analysis provided an average information on the chemical nature of the sample. In the early 2000s, IR interferometers were coupled with Vis-IR microscopes; this new setup made it possible to also study non-homogeneous samples, such as biological ones (tissues and cells). Concerning the tissues, the microscope allows an investigation of the morphology of thin sections (7–10 microns) and detection of the areas of interest on which the IR analysis can be performed. In these positions, the FPA detector acquired IR images of 164 × 164 µm constituted of 4096 pixel/spectra with a spatial resolution of 2.56 µm. Thus, this technique allowed us to perform a morpho-chemical analysis of tissues and cells, in order to investigate not only the morphology of the sample but also its chemical composition.
Since corpus callosum is mainly made up of myelinated axons, whose sheath contains lipids and proteins in different proportions, the analysis was focused on saturated and unsaturated lipids, fatty acids, and proteins. The multivariate analysis performed on the IR data allowed us to achieve some interesting information on the spectral populations of the genu, body, and splenium regions, also in relation with the age at death of the specimen. In fact, a good segregation was observed only between the spectra collected in the genu and splenium regions, and this was more evident in old than young samples; in these two regions, as expected, the main differences were ascribable to the lipid and protein components. Given the high similarity between the spectra of the body and those of the other two regions, they were not included in further analysis, which was focused then on the genu and splenium regions. The histological images evidenced a regular tissue organization in both the genu and splenium regions, which was also confirmed by the hyperspectral imaging analysis, which displayed, in these two CC areas, a homogeneous distribution of saturated, unsaturated lipids, and fatty acids. In agreement with previous observations, both analyses suggested a greater amount of lipids, and, hence, of myelin in the posterior portion (
C, splenium) [
48]. Notably, while histological images did not pinpoint relevant age-related differences, FTIRI evidenced higher amounts of lipids in younger subjects than in older ones, suggesting an age- and region-related reorganization in the structure and composition of myelin. These results were also confirmed using univariate analysis, which highlighted a higher relative amount of lipids (LIP/TBM, FA/LIP, and LIP/PRT) in splenium with respect to genu, as well as in younger than older subjects. Furthermore, FTIRI images of proteins showed a spot arrangement, similar in both callosal regions (genu and splenium), as also suggested by the PRT/TBM ratio, which did not display statistically significant differences among groups. Moreover, the peak-fitting procedure highlighted statistically significant higher amounts of the saturated (A
CH2/A
CH3 band area ratio) and unsaturated (A
CH/A
CH3 band area ratio) lipids found in the splenium than the to genu, and in younger than older specimens. This biochemical variation of lipids was best described by the CH/CH
3 ratio, which indicated the content of unsaturated lipids, and by the CH
2/CH
3 ratio, which was related to the length of the alkyl chains; it is known that the oxidative stress-related intracellular free radicals trigger lipid peroxidation, mainly affecting unsaturated ones, leading to their rapid degradation and, hence, clearance [
44,
49,
50]
The relationship among lipid and protein components represents an index of the stability and integrity of the myelin membrane. To evaluate this aspect, the LIP/PRT ratio was calculated. In the old group, lower values were measured than in the young group in both the analyzed regions, indicating a reduction of the lipidic component due to the phenomenon of oxidation; moreover, both in younger and older samples, the splenium displayed a higher value of the LIP/PRT band area ratio than the genu. Furthermore, the shorter length of the chains, caused by fragmentation, lipid degradation, and protein denaturation, caused an increase in membrane fluidity, with a loss of stability and integrity, leading to demyelination [
51]. Demyelination has been observed to begin in middle age and continues slowly over the years, following a rostrocaudal trajectory [
26].
Similar amounts of proteins were found in all the experimental groups (PRT/TBM band area ratio), regardless of the age or region. Nevertheless, some interesting differences were observed about their secondary structure. In general, higher amounts of random coil structures (RANDOM and FOLDED/UNFOLDED band area ratios) were found in older specimens. These results agreed with several studies, which specified the role of oxidative stress on the biochemical composition of macromolecules [
35,
51,
52]. It is known that oxidative stress, caused by reactive oxygen species (ROS) accumulation, is one of the mechanisms responsible for aging and is capable of causing changes in the secondary structure of proteins, including a partial conversion of α-helices in β-sheets, and a fragmentation and denaturation of the amino acid chains with consequent loss of functionality [
35,
51,
52]. Although the present results showed an increase in random disordered structures with advancing age, the same transformation was not observed for the β-sheets, which appeared to decrease in the older compared to the younger samples.
This research represents the first FTIRI investigation on the human CC; therefore, results from other investigations are not available. A recent study with a similar purpose has been carried out on rats to study the biochemical changes provoked by traumatic axonal injury (TAI) [
34,
35] and traumatic brain injury (TBI) [
51] in an animal model, and the age-related changes in the WM and CC in the rat brain [
36]. In these studies, in the injured groups, FTIR revealed changes within the rat CC related to protein conformation (increased β-sheet and β-turn contents together with a decrease in α-helix content), and a significant decrease in the lipid/protein ratio. Moreover, FTIR was also able to discriminate normal from injured WM at different time points after TBI by examining these infrared spectral parameters [
34,
35], suggesting that this kind of analysis could also be useful in neurological and forensic fields.
A more recent study applied FTIR spectroscopy to investigate biochemical changes after TBI in cortex and CC of rats [
51]. The study evidenced the potential of FTIR imaging in sensing temporal biochemical alterations provoked by TBI in rats; moreover, the reported homogeneity of the lipid/protein ratio data allowed the authors to conclude that the detected molecular alterations within the cortex and CC were not due to oxidative damage.
A similar analysis, considering the time course of changes after death, could not be performed in the present study because of the small size of the sample. The CC samples were selected from a larger population as the most numerous with a homogeneous characteristic, in this case sudden death. Within this group, it was possible to define two sub-groups, young and old, according to their age. A grouping according to the gender or the duration of agonal time would have produced very small samples, with three cases or fewer.
The most recent research, which investigated age-related changes in the WM and CC of the rat brain [
36], reported biochemical changes in WM that were detectable prior to visible structural changes, mostly in the CC anterior regions. This was biochemically supported by the analysis of the composition of fatty acids that evidenced an overall trend towards increased monounsaturated and decreased polyunsaturated fatty acids according to age. In agreement with this evidence, in the present study, lower values of the following ratios were calculated in the genu of older samples than in the splenium, and in the genu portion of younger subjects: LIP/TBM, FA/TBM, LIP/PRT, CH/ CH
3 and CH
2/CH
3. All these ratios changed strongly, indicating increase in monounsaturated fatty acids and a decrease in polyunsaturated fatty acids. This was in relation to the greater oxidative stress on the genu. The same protein ratios, on the other hand, showed higher values in the C portion (BETA/TOT, RANDOM/TOT, FOLDED/RANDOM), since it correlated with a greater protein disaggregation in the splenium.
The present results, reporting an increase in polysaturated and a decrease in unsaturated fatty acids, as well as an increase in proteins, allowed us to hypothesize that myelin changes physiologically in the human CC with aging, and evolves according to an anterior–posterior gradient [
28], and that this is likely due to a biochemical alteration in the lipidic components of myelin, provoked in turn by oxidative stress [
44,
50].
Further studies, hopefully in a larger sample, could shed further light on the temporal modification of CC and WM after death, confirming the potential contribution of FTIRI analysis in the forensic field.


 ,
, 


