Article

Use of Sample Entropy to Assess Sub-Maximal Physical Load for Avoiding Exercise-Induced Cardiac Fatigue

1
Institute of Biomedical Engineering, College of Electrical and Computer Engineering, National Yang Ming Chiao Tung University, Hsinchu 30010, Taiwan
2
Institute of Computer Science and Engineering, College of Computer Science, National Yang Ming Chiao Tung University, Hsinchu 30010, Taiwan
3
Department of Computer Science, College of Computer Science, National Yang Ming Chiao Tung University, Hsinchu 30010, Taiwan
*
Author to whom correspondence should be addressed.
Appl. Sci. 2023, 13(6), 3813; https://doi.org/10.3390/app13063813
Submission received: 11 February 2023 / Revised: 14 March 2023 / Accepted: 15 March 2023 / Published: 16 March 2023

Abstract

:

Featured Application

Sample entropy is applied to the analysis of physiological signals assessing sub-maximal physical load during exercise, and thus applied to sports science.

Abstract

Sub-maximal physical load (sub-max) training is optimal for athletes. However, few methods can directly assess whether training is sub-max. Therefore, this study aimed to identify metrics that could assess sub-max training by predicting maximal physical load, helping athletes to avoid the risks associated with maximal training. Physiological data were collected from 30 participants in a bicycle incremental exercise experiment, including the R-R interval (RR), stroke volume (SV), breath-to-breath interval (BB), and breathing rate (BR). Sample Entropy (SampEn) analysis was used to assess the complexity of the physiological data. BR increased with exercise time but could not be used to identify the sub-max stage; however, SampEn BB could effectively identify the sub-max stage (p < 0.05), as could the novel indicators SampEn SV and cardiac output (p < 0.01). This study also identified the threshold value of each SampEn value in sub-max, which can be used as a sports science indicator to assess the load of athletes. The results suggest that SampEn-based indicators can be used to assess sub-max and maximal physical load. These findings can be used as a guide for quantitative exercise healthcare.

1. Introduction

In 2018, Michael Goolaerts died suddenly at the age of 23 in Paris during the Paris–Roubaix bike race [1]. This death was the first of more than 10 sudden deaths of cyclists due to heart disease since 2004. Sudden death in sports is becoming a critical focus of sports health care [2]. Sudden death during exercise is often caused by exercise-induced cardiac fatigue (EICF) [3]. The literature has revealed that the majority of sudden deaths in sports occur in endurance sports; the highest proportion is in cycling, followed by marathon running, soccer, and hiking. From 2005 to 2010, the prevalence of sudden death in connection with sporting activity was approximately 4.6 per 10,000,000 people per year [4]. Approximately 6% of this cohort comprises young athletes. Recently, the number of studies investigating EICF and the cardiovascular response to exercise has increased [4].
Some key cardiac indicators are heart rate (HR, in beats/min); stroke volume (SV, in ml/cycle), the amount of blood ejected per heartbeat; cardiac output (CO, in mL/min); and the amount of blood pumped per minute. In general, CO is derived as SV × HR (assuming that HR is steady) [5]. During exercise, CO must continually increase to provide peripheral nutrients; hence, HR also increases [6]. However, the heart comprises muscle tissue, which eventually becomes fatigued. Moreover, the left ventricle cannot expand indefinitely; it has a maximum size, and thus, a maximum SV exists. The aerobic capability plateau (ACP) is a state in which the left ventricle is unable to expand due to cardiac fatigue after exercise for an excessive intensity or duration; at the ACP, SV can no longer increase, and EICF may occur. ACP typically occurs in maximum physical load training, and the maximum value of SV and oxygen consumption (VO2) is the standard metric for the clinical judgment of a person’s ACP [7]. Researchers have demonstrated that training in the stage before ACP is optimal for increasing athletic performance [8]. Training at sub-maximal load (sub-max) can avoid exhaustion and enhance the training efficiency of athletes [8]. ACP may lead to myocardial injuries due to ventricular tachycardia or fibrillation [9]. ACP may also directly cause right ventricular overload and left ventricular dysfunction. It may also cause patchy myocardial fibrosis, particularly in the atria, interventricular septum, and right ventricle, which creates a substrate for atrial and ventricular arrhythmias [10]. Studies have indicated that ventricular dysfunction occurs after prolonged and intense exercise. One study reported that the right ventricular volume increased after a race, but the right ventricular postrace ejection fraction decreased by 9% relative to the baseline [11]. Although the left ventricular volume increases after exercise, the ejection fraction remains unchanged. These findings indicate that investigating exercise-related health care is critical for increasing safety during sports [12].
Denniston demonstrated that the impedance cardiogram (ICG) method operates under the principle that blood has electrical impedance. ICG could be used to obtain accurate SV values [13]. Another study demonstrated that ICG can be performed during dynamic exercise. Furthermore, SV measurements produced using ICG have been compared with gold standard measurements and found to be accurate [14]. Cardiac echocardiography can also be used to measure SV; however, echocardiogram measurements must be performed at a precise angle, which is challenging during dynamic exercise. Therefore, ICG is the optimal method of measuring SV during exercise. Breathing rate (BR) can be measured using spirometry and body plethysmography [15]. However, the wearing of a mask during exercise can be restrictive. Respiratory inductance plethysmography (RIP) is a noninvasive method for measuring BR. In RIP, a participant wears two straps with insulated coils around the thorax and abdomen; obtaining the waveform through these coils through a transducer and demodulating it can reveal changes in the diameter of the thorax and abdomen during respiration. Monitoring of these changes enables observation of respiratory patterns and respiratory control responses. Studies have demonstrated that RIP calibrated a priori is accurate during exercise conditions [16].
The maximum physical load, ACP, is typically determined using the maximum values of SV and VO2 [7]; however, several other methods of evaluating ACP have been developed. The American College of Sports Medicine recommends using 40%, 60%, 80%, and 85% of VO2 max for developing prescriptions for various exercise intensity levels, and 55%, 70%, 85%, or 90% of HRmax may be used as indices of these VO2max levels [17]. Hence, the percentage of HRmax can be used as a proxy for VO2max. Studies have also examined breathing patterns before and after the induction of inspiratory fatigue during incremental exercise. BR increased from 22.5 ± 4.4 (SD) during rest to 27.0 ± 6.7 breaths/min (p < 0.02) at 75% of maximum work load following the induction of fatigue [18].
Training at sub-maximal physical loads is key for athletes because it does not cause exhaustion, has high training efficiency, and avoids the risk of injuries caused by ACP [8]. Various studies have explored metrics that could indicate sub-max training, such as HR variability (HRV) and SV variability (SVV). No gold standard exists for measuring the optimal training load (TL). One study used HRV indices to evaluate TL during exercise. Another study demonstrated that ratings of perceived exertion (RPE), blood lactate (BLa), and HF could be used to determine TL, and RPE and BLa were negatively correlated with HF [19]. In a previous study, we attempted to identify indicators for determining sub-max to avoid ACP. We determined that SVV has a high-correlation bandwidth with HRV. Moreover, the maximum cross-correlation R value between SVV and HRV at sub-max was significantly greater than that at rest and significantly lower than that during ACP. The spectral analysis correlation coefficient between SVV and HRV during ACP was less than those at all other stages [20]. Although the ACP assessment metrics are clear, the sub-max physical load assessment metrics are still insufficiently accurate.
The complexity of a physiologic signal may be a helpful metric in both dynamical models of biological control systems and bedside diagnostics [21]. Disease and aging appear to reduce the adaptive capacity of individuals, and loss of complexity has been proposed to be a generic feature of pathologic dynamics [22]. Entropy is an appropriate measure of the complexity of a time series. Signals from diseased individuals have lower entropy values than those from healthy individuals [23]. Time series signals, such as HR variability, respiratory rate, and gait, generated by healthy physiological systems are complex [22]. Low signal complexity has been associated with system dysfunction. For example, fatigue resulted in a substantial loss of knee extensor torque complexity, as measured by signal entropy [22]. Complexity is associated with system adaptability, and fatigue-induced loss of complexity may contribute to an inability to engage in sustained physical exercise [24]. Because entropy is an effective measure of complexity, it has been increasingly used in recent studies. Clausius first introduced the concept of entropy in thermodynamics [25]. Shannon first applied entropy to information science [26]. Kolmogorov entropy was the first introduction of the concept of fractals to entropy theory [27]. Pincus introduced approximate entropy (ApEn), which was derived from Kolmogorov entropy [28]. ApEn can be used to quantify temporal unpredictability for various applications, such as medical–physiological research (e.g., HR), meteorology, and finance. ApEn has been used in numerous clinical applications [29]. However, the self-matching of sequences in the ApEn technique may produce inconsistent results if the sequence length of a data set is changed. In 2000, Richman proposed an ApEn technique, Sample Entropy (SampEn) [30], which overcomes bias from self-matching in ApEn. SampEn results are independent of data length, and the method is powerful and has no major flaws. Hence, SampEn is the most widely used entropy method for physiological signals and is the second most widely used in all clinical applications (after Shannon entropy). ApEn [28] and SampEn [30] are the two most commonly used methods for handling biological data. In this study, SampEn was selected because its results are more consistent than those of ApEn, it achieves faster processing of short data sets, and it is more common in the medical literature, facilitating comparisons. A study investigating SampEn RR data are correlated with normalized HF (nHF) but negatively correlated with normalized LF (nLF) and LF/HF parameters in cardiac control, confirming that the complexity of cardiac interval time series is associated with the ANS functional status [31]. SampEn at the highest intensity tends to decline during the exercise [32]. Another study demonstrated that both SampEn RR and SampEn-breath-to-breath (BB) were significantly different for exercise and non-exercise signals. Analyzing SampEn trend line gradients is an effective method for fatigue detection [33].
Sports players often overtrain, resulting in fatigue and an inability to continue training; overtraining could be avoided by ensuring that training is in the sub-max range. Although metrics for ACP assessment are well understood, further research is required regarding those for sub-max physical load assessment. In the literature, fatigue has been shown to affect the complexity of physiological signals. This study aims to identify a novel scientific indicator of fatigue to increase the efficiency of training.

2. Materials and Methods

2.1. Participants

The Institutional Review Board B (IRB-B) of National Yang Ming Chiao Tung University (NYCU-REC-110-026F) approved the protocol of the study. All experiments were conducted following the principles of the Declaration of Helsinki. We enrolled 17 male and 13 female patients between December 2018 and November 2019. All patients were healthy students of National Yang Ming Chiao Tung University, including some baseball players of National Yang Ming Chiao Tung University, aged from 18 to 30 years old. We excluded individuals with cardiovascular or respiratory diseases, cardiac arrhythmia, and those taking medication. All participants understood the experimental protocol and provided signed informed consent prior to starting the study.

2.2. Protocol

An incremental cycle experiment involving 3 min stages, with power output increases of 25 W per stage, was conducted. The aim was for participants to maintain a 60 revolutions per minute (rpm) pedaling rate on an air-powered bicycle dynamometer (Wattbike Pro, Wattbike, Nottingham, UK). The bicycle ergometer setup was individually tailored to the participants’ height. The study ensured that participants did not consume alcohol or caffeinated beverages for at least 24 h prior to the experiment. A flowchart of the experimental procedure is presented in Figure 1. To normalize the riding time for all participants, the SV maximum stage for each subject was defined as the ACP stage—the maximum physical load. The stage before the ACP stage was defined as the sub-max stage (Figure 1).
The procedure includes the following steps:
  • Survey patients about their exercise habits.
  • Rest at 0 watts. At each stage, the difficulty of each stage increases by 25 W.
  • The experiment continues until the patients are unable to maintain 60 rpm or are exhausted.
  • The patient is in recovery the experiment ends.

2.3. Measurement and Signal Processing

An AESCULON ICG device (Osypka Medical, Berlin, Germany) [34] was used for simultaneous HR and SV measurements. The time variate thoracic bioimpedance was acquired using a set of four electrodes (each) on the thorax and neck (sampling frequency = 200 Hz, sampling period = 5 ms). The erythrocyte orientation changes during opening and closing of the aortic valves; the corresponding change in impedance with each beat enables SV estimation. The AESCULON ICG device uses one-lead electrocardiography (ECG). QRS waves in the ECG were identified and the time-domain index of the R-peak was recorded as index [n].
HR   [ n ] = round {   60 × 200 Index   [ n ]   Index   [ n   1 ] ,   0   }
The function round {X,0} represents where X is rounded to the specified number of digits (0). The number will round to the nearest integer. For instance, round{98.98, 0} = 99.
Missing RR interval and SV series points occur during riding stages due to motion artifacts during impendence acquisition. If HR[n] > 200 or HR[n] < 2 bpm, an autoregression extrapolation using the first 10 points of n were used to calculate a reasonable R peak. Similarly, if SV[n] > 200 or SV[n] < 2 bpm, the first 10 points of n were selected for autoregression and extrapolation of the point to calculate a reasonable SV value. The calculation equation for each beat is SV × HR = CO, and the standard deviation (SD) and mean of CO, HR and SV were also calculated for every stage. The maximum SV value indicates the ACP stage; SV begins to decrease from this stage, which is also the limit of left ventricular volume diastolic expansion. The results of time-domain were used to compare physiological responses between rest and incremental exercise. The phase of SVV might affect the correlation between HRV and SVV, using cross-correlation to test the correlation in SV and RR intervals. Fast Fourier transform analysis was used for frequency domain analysis of HR and SV, and a power spectrum was generated for analyzing the spectrum. The distribution of components in the power spectrum of HRV power is divided into LF (0.04–0.15 Hz) and HF (0.15–0.4 Hz); both are absolute values (ms2). On the basis of the results of our previous study, the distribution of components in the power spectrum of SVV power is divided into LF (0.035–0.13 Hz) and HF (0.13–0.28); both are absolute values too (ms2). HRV and SVV are normalized from 0 to 1 × 100%, as is conventional in HRV and SVV analysis, as follows:
nHF = HF LF + HF × 100 %
nLF = LF LF + HF × 100 %
The LabVIEW (LabVIEW 2020, National Instruments Corp., Austin, TX, USA) platform was used to develop programs for processing RIP signals. The original raw RIP signal has substantial noise; thus, complementary ensemble empirical mode decomposition (CEEMD) was used to decompose the RIP signal into intrinsic mode functions (IMFs) to filter this noise [35]. An IMF is defined as follows: (1) the number of local maxima and local minima must be equal to the number of zero-crossings or dissimilar by at most one, and (2) at any point, the value of the average envelope must be approximately equal to zero. The main IMF among various IMFs was found in order to calculate the BR. CEEMD was used to identify the IMFs from the raw data, and the main signal was extracted on the basis of the correlation between the main IMF and raw data.
The next step is to time-shift the main IMF component in order to identify the peak of the RIP signal; these acquired peaks are used to calculate BR. The time difference between adjacent peaks was calculated as well as breath-to-interval for subsequent analysis. A flowchart of the RIP signal processing method is displayed in Figure 2.

2.4. Sample Entropy Analysis

Entropy is defined as the loss of information in a time series or signal. Over the past 30 years, entropy methods have been increasingly used to quantify the periodicity or regularity of physiological data. The two most commonly used entropy methods for biological data are ApEn and SampEn. According to the literature, SampEn is more reliable for short-gait data sets (N < 200) because SampEn is less sensitive to changes in data length, is more consistent, and does not contain the inherent bias associated with the ApEn algorithm. Hence, SampEn was used as the complexity analysis method in this study. A flowchart of the entropy analysis is presented in Figure 3.
The procedure includes the following steps:
  • Input a time-domain signal u with length N.
  • Define the sequence xm, which is a vector with length m.
  • Define the distance d i , j m between xm(i) and xm(j) as the largest difference between these elements for all elements i and j.
  • Count the number of d i , j m less than a given threshold r as B i m ( r ) .
  • The average value of these counts for all i is calculated as B m   ( r ) .
  • Similarly, calculate these values for m + 1.
  • SampEn ( m , r , N ) = ln [ B m + 1   ( r ) B m   ( r ) ] .
For clinical data, m should be set to 2 for the ApEn algorithm. The setting m = 2 was also used in the earliest studies reporting SampEn. In this study, the SampEn parameters were as follows: N = input data, m = 2, r = 0.2 SD.

2.5. Statistical Analysis

Data were analyzed using descriptive statistics (mean, SD, and median). Statistical analyses were performed using SPSS (SPSS Statistics 22, International Business Machines Corporation, Armonk, NY, USA) and LabVIEW (LabVIEW 2020, National Instruments Corp., Austin, TX, USA). The Wilcoxon test was used to identify statistically significant differences between the SampEn values for each BR stage, and the Mann–Whitney U test was used to test for statistically significant differences between groups. The ROC curve was used to find the critical value of sub-max. The Pearson’s correlation coefficient between the SampEn results and HRV or SVV was calculated. Statistical significance was set at p < 0.05.

3. Results

In total, 17 men and 13 women participated in this study. All patients accepted the experimental protocol and signed informed consent prior to the experiment. The participants were divided into three groups in accordance with the number of hours of exercise they performed each week. The sedentary group (S) performed less than 2 h of exercise, the normal group (N) had over 3–6 h of exercise, and the exercise group (E) had over 6 h of exercise. Table 1 presents the participant data. The final ACP stage in the N group was significantly lower than that of the E group.

3.1. Cardiovascular Response Results

The results of SampEn RR, SV, and CO are shown in Table 2. Six participants reached the SV maximum in the first stage; hence, the number of sub-max stages was 24 (E = 8, N = 8, S = 8). SampEn RR at rest was significantly different to the sub-max stage and ACP stage (p < 0.05). SampEn RR increased during exercise (1.24 to 1.35). However, SampEn RR in the sub-max stage is not significantly different than that in the ACP stage. Hence, SampEn RR may not be an effective indicator for identifying the sub-max stage and predicting the ACP stage. The SampEn SV results are listed in Table 2 (E = 8, N = 8, S = 8). SampEn SV at rest, in the sub-max stage, and in the ACP stage were all significantly different (p < 0.01). SampEn SV increased during exercise (1.43 to 2.15). These results suggest that SampEn SV can be used to predict the ACP stage because the SampEn SV is the greatest in the ACP stage; moreover, the SD of SampEn in the ACP stage was the smallest. These results suggest that SampEn SV could be used as an effective indicator in exercise-related health care. The SampEn CO results are presented in Table 2 (E = 8, N = 8, S = 8). SampEn CO at rest, in the sub-max stage, and in the ACP stage were all significantly different (p < 0.01). SampEn CO increased during exercise (1.38 to 2.18). This result indicates that SampEn SV and SampEn CO can be used to predict the ACP stage; SampEn CO can also be used in exercise health care.
The Pearson correlation coefficient test results for SampEn RR and HRV and for SampEn SV and SVV are displayed in Table 3. SampEn RR and RR have a strong positive correlation in the rest stage (R = 0.51, p < 0.01) as do SampEn SV and SVV nHF (R = 0.46, p < 0.05).
We tried to find the threshold value of sub-max by using the ROC curve module. The input is the result of the SampEn of sub-max and rest (lower limit), and the result of SampEn of sub-max and ACP (upper limit). Figure 4, Figure 5 and Figure 6 are the results of the ROC curve in SampEn RR, SV, and CO. The SampEn RR sub-max threshold is 0.7971–1.0482. The SampEn SV sub-max threshold is 1.3218–1.8813. The SampEn CO sub-max threshold is 1.4520–1.9286.

3.2. Breathing Results

The BR and SampEn BB results are presented in Table 4. Four of the thirty participants were excluded due to excessive noise in their breathing signals. Therefore, the total number of remaining participants was 26. In total, 6 of these participants reached the SV maximum in the first stage; hence, the number of sub-max stages was 20 (E = 8, N = 5, S = 6). For 2 participants, the final stage was the ACP stage; hence, the number of final stages was 24 (E = 9, N = 6, S = 6). The BR of participants increased in this experiment (from 15.42 to 21.33). BR in the sub-max stage was not significantly different from that in the ACP stage (18.83 and 21.42). Hence, BR cannot be used to predict the ACP stage or sub-max stage. The SampEn BB value decreased in the ACP stage (2.04 to 1.69) and then increased in the final stage (1.69 to 2.07). SampEn BB in the sub-max stage was significantly higher than at rest and then in the ACP stage (p < 0.05). Hence, calculating SampEn BB can enable the observation of changes that cannot be identified by using BR alone. Thus, SampEn BB is an effective indicator for predicting the ACP and sub-max stages. Figure 7 shows the results of the ROC curve in SampEn BB. The SampEn BB sub-max threshold is 2.2589–2.1538.

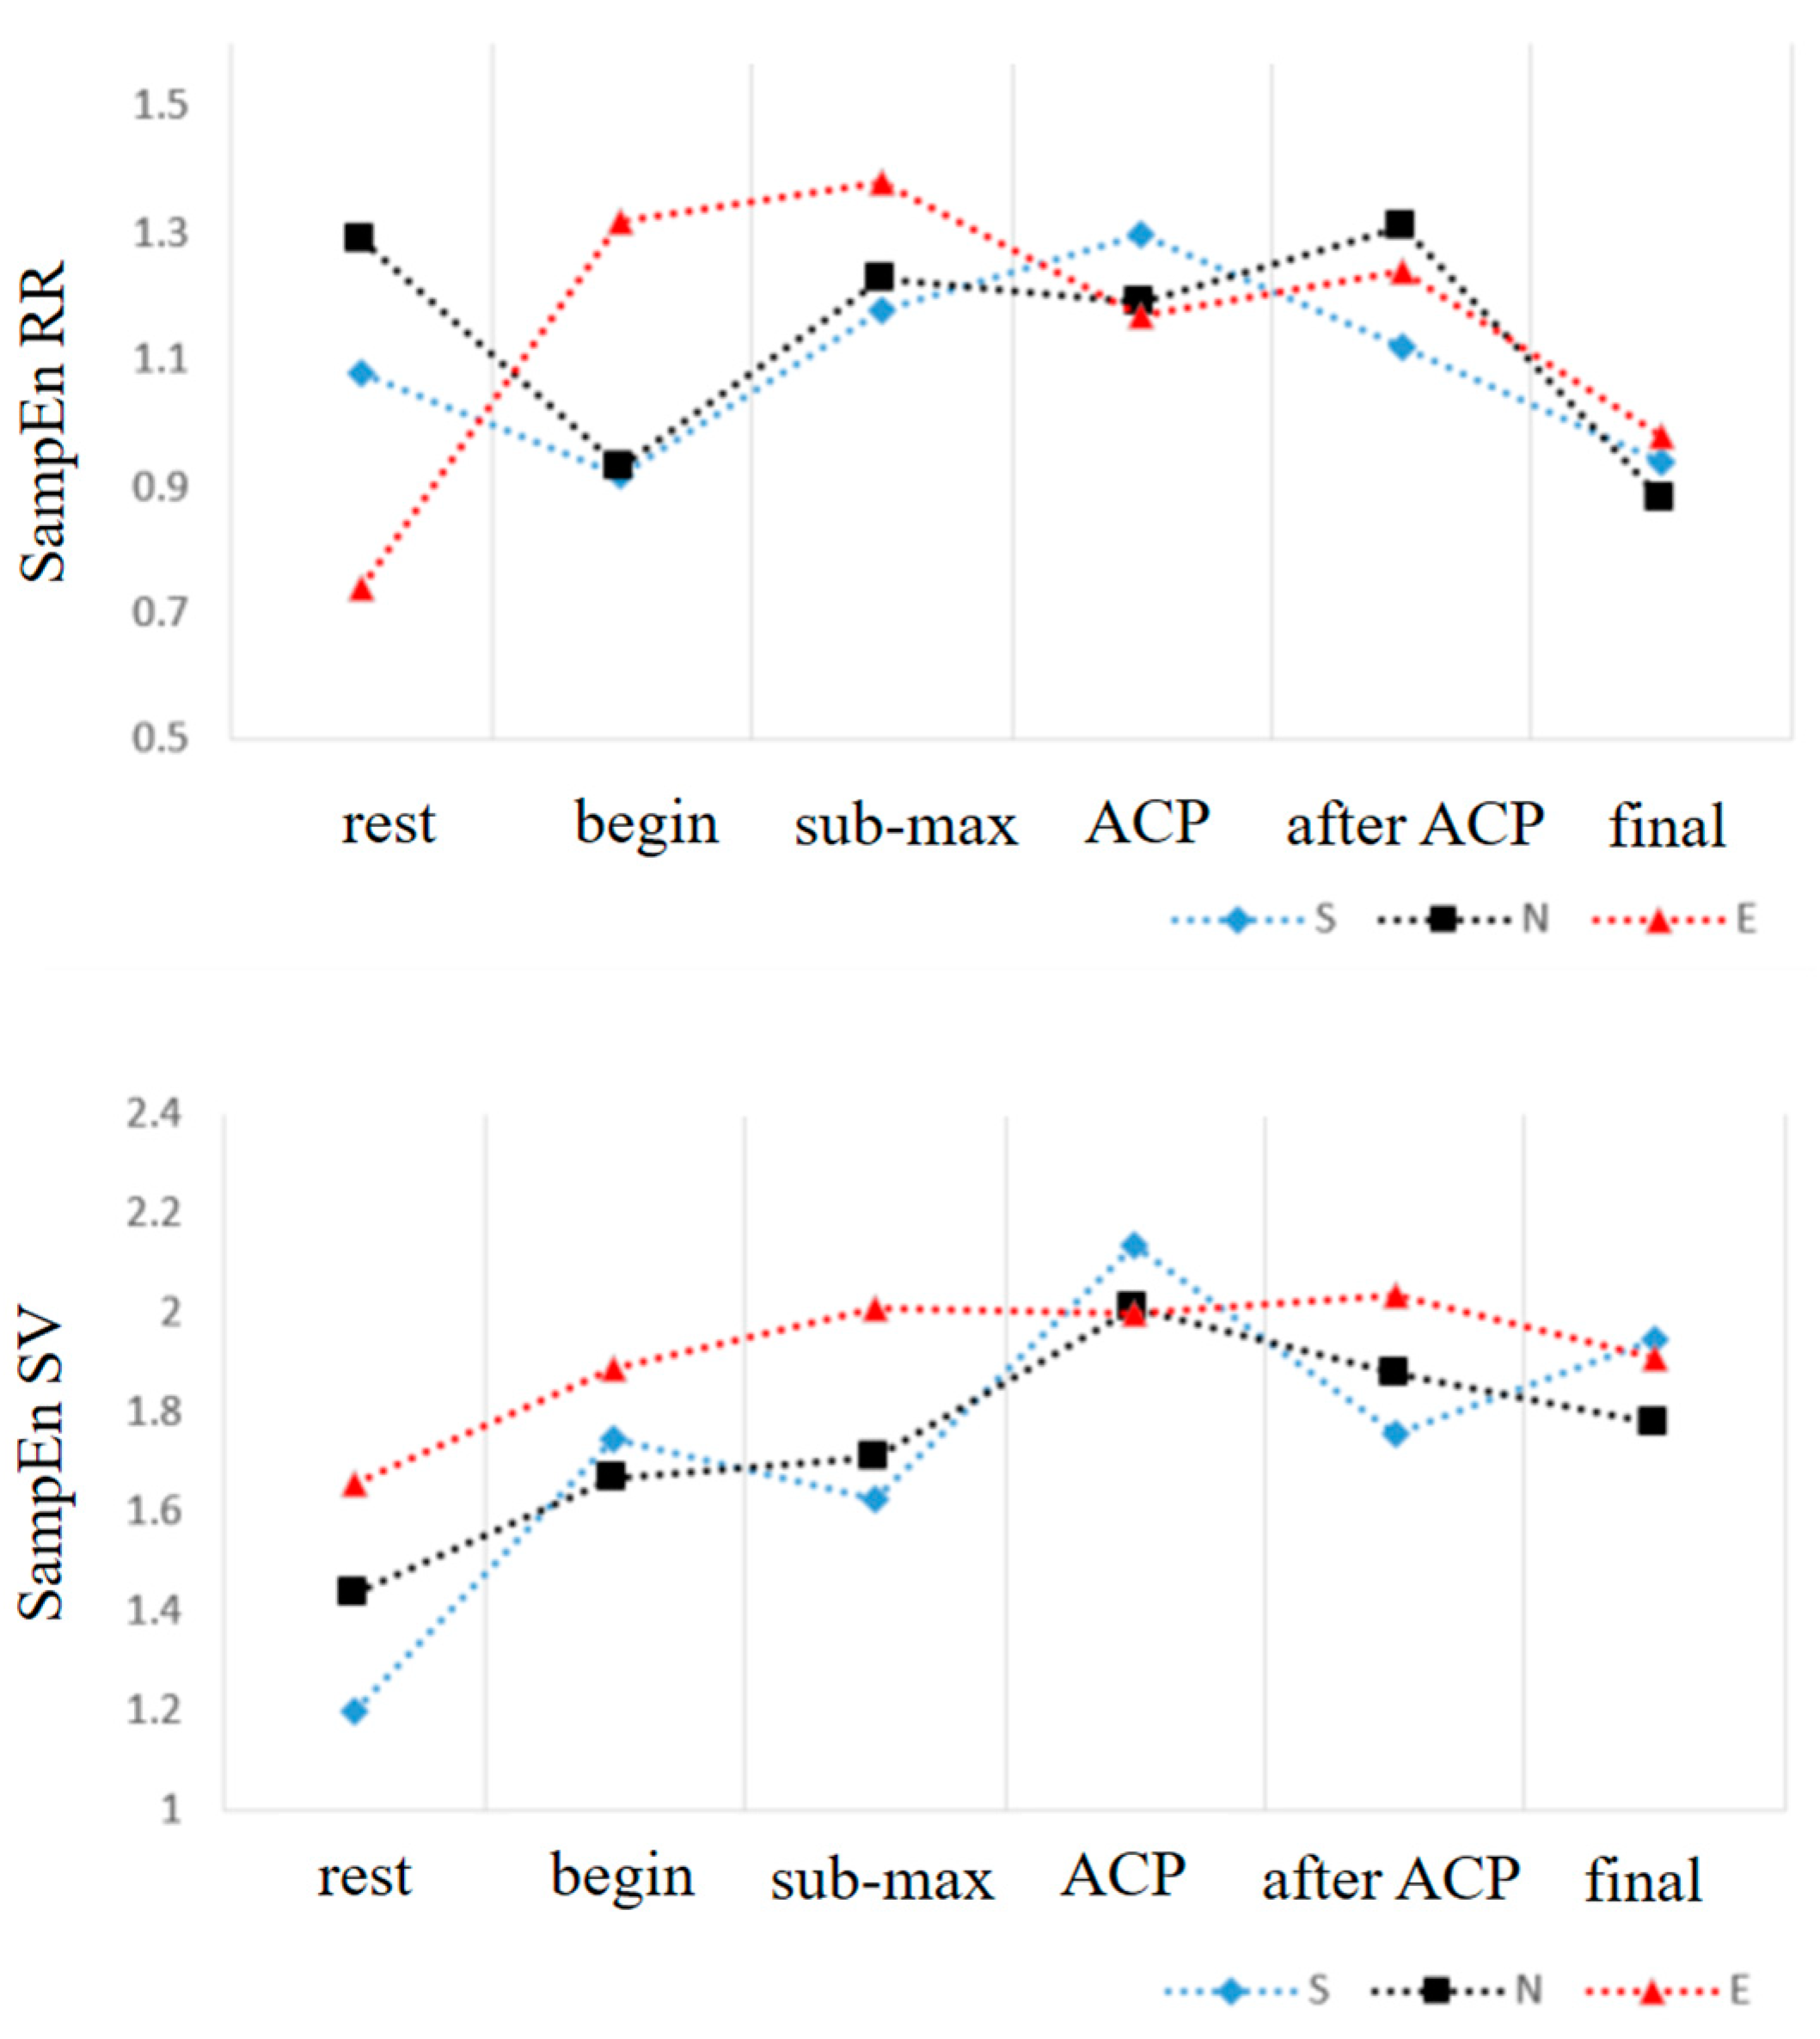
3.3. Sub-Group Results

The results of SampEn RR, SampEn SV, SampEn CO, SampEn BB, and BR in the three groups are shown in Table 5. There was no significant difference in each stage in BR for the S group. The BR of the S group was significantly different from that of the E group in both the sub-max stage and the ACP stage (p < 0.05). The BR of the N and E groups increased with exercise time, and the change in the E group was larger than that of group N. The results for SampEn SV show that the S group was significantly different (p < 0.05) at each stage. SampEn RR in the N and E Groups was significantly higher than in the S group at rest. The SampEn RR values were similar in both groups at the ACP stage. The results for SampEn RR and SampEn SV in the three groups are shown in Figure 8. The SampEn RR results were significantly different in the E group between rest, sub-max, and ACP.

4. Discussion

4.1. SampEn Parameters

The two most commonly used entropy analysis methods for biological data are ApEn [28] and SampEn [30]. ApEn was proposed by Pincus in 1991 but has shortcomings, which were addressed in the SampEn algorithm proposed by Richman in 2000. These shortcomings include self-matching of vectors resulting in bias, inconsistent results due to differing input data lengths, and a requirement for fixed parameters. SampEn does not calculate self-vectors, is independent of data length, and has been demonstrated to produce consistent results [36]. SampEn is more reliable for short-step data sets, is less sensitive to changes in data length, and has fewer relative consistency problems [37].
In the literature, the parameter m is typically set to 2; studies have shown that m = 2 produces reasonable results for theoretical data and results in few self-matches for experimental data. Because m does not have an upper bound in SampEn, comparing results between studies is challenging if m is increased to 3.
In 2002, Bandt proposed permutation entropy (PE) [38], which is an appropriate complexity measure for chaotic time series in the presence of dynamic and observational noise. In 2016, Rostaghi proposed dispersion entropy (DE) [39], which is superior to PE for discriminating between groups in a data set of real-valued signals. Its computation time is less than those of SampEn and PE for long signals—the DE analysis of signals with size 12,000 is 8 s faster than the SampEn analysis [39]. However, the sample size N of the data segments in this study were typically less than 400; hence, processing speed was not a concern. Although ApEn and SampEn are still the most widely used entropy methods in biomedical research, DE may be superior for future research involving large data sets.
The experiment in this study was an incremental exercise experiment in which cyclists began riding at 60 W and the power was increased by 30 W every 3 min for five stages [31]. However, previous studies did not measure SV to judge the ACP stage. Moreover, the different setting of r in SampEn produced different results. If r = 0.1 or 0.15, the SampEn RR value decreased with exercise time; by contrast, if r = 0.2 or 0.25, SampEn RR first increased and then decreased.
The objective of this study was to identify indicators for determining the sub-max stage to predict the ACP stage. Based on previous studies, the SampEn trends of r = 0.2 and r = 0.25 were unique and this may be an observable indicator. Hence, SampEn RR with r = 0.2 may be an indicator of sub-max training. Further, r = 0.2 is also the parameter set in many SampEn papers. Therefore, the SampEn parameters of r = 0.2, m = 2, and N = input data were used in this study.

4.2. SampEn RR at Rest and during Exercise

The exercise experiment in a previous study was divided into three 30 min rest periods and three 20 min exercise periods [40]. However, the study differs from this study in that it was not an incremental exercise test.
The SampEn RR results of this study are presented in Table 2; SampEn RR is higher during exercise than at rest. The results in this study had a similar trend; SampEn RR values at rest were significantly lower than in the sub-max stage and ACP stage.
Some other studies have used SampEn to analyze human behavior during exercise. A study investigated low-intensity isometric and dynamic lower limb exercises and used SampEn to analyze differences between exercise and rest [41]. SampEn RR was significantly lower during low-intensity isometric exercise than at rest. However, SampEn RR increased during dynamic exercise, and SampEn RR values at rest and during exercise were not significantly different. By contrast with [41], the exercise in this study was dynamic, and SampEn RR increased more after exercise; this may be attributable to the negative load applied in this study. The authors of [41] also investigated the correlation between SampEn RR and HRV and reported that SampEn RR and RR were positively correlated (R = 0.46, p < 0.01). This result is similar to our results, as SampEn RR was correlated with RR at rest (R = 0.51, p < 0.01). This study is the first to investigate the association between SampEn SV and SVV, and the results revealed that SampEn RR at rest was associated with SVV nHF (R = 0.46, p < 0.05). These results may indicate some correlation between cardiovascular variability and complexity.
One study examined differences in RR complexity between young healthy trained and untrained boys [42]. Electrocardiograms were recorded during supine rest, standing, an incremental running exercise, and relaxation. SampEn RR was different between the trained and untrained groups; the overall SampEn RR distribution was saddle-like in the untrained group but more widely distributed in the trained group. In this study, the data of participants with different exercise habits were also investigated; the SampEn RR results were significantly different in the E group between rest, sub-max, and ACP. By contrast, no significant differences in SampEn RR between stages was observed for the S or N groups. Hence, our results are consistent with [41] in that SampEn RR appeared to change significantly in the trained group; hence, it could be an indicator for advanced assessment.
In a study published in 2021, data on RR intervals were collected during treadmill exercise and recovery in young people with a maximum VO2 [43]. Differences and the residual of SampEn RR were associated with VO2. This result demonstrates that the SampEn assessment system is useful for assessing physical load. It also suggests that the direction of this study is promising.
In 2018, Entropy of Entropy (EoE) was proposed for hybrid analysis applied to heartbeat interval time series, and disorder and complexity were analyzed separately [44]. Recently, a method has been proposed to measure instantaneous complexity, named intrinsic entropy (IE) [45]. The results of SampEn RR cannot effectively distinguish between ACP and sub-max, which is not consistent with the hypothesis, perhaps because conventional entropy may not explain the fact that complexity is different from irregularity. Alternatively, maybe it is because conventional entropy may not be able to calculate instantaneous changes. In the future, EoE and IE are methods that can be applied to the analysis of heartbeat interval time series to gather more advanced information.

4.3. Loss of Complexity in Physiological Systems

A reduction in complexity is well-documented to be associated with poor system adaptation. Studies comparing the complexity of healthy and pathophysiological systems have shown that pathophysiological system complexity is lower [23]. Many studies have also demonstrated that aging is responsible for a decrease in system complexity [46]. Moreover, a loss of systemic complexity leads to impairment in the ability to adapt to physiological stress [24]. This hypothesis is supported by observations showing age-related complexity variability in a variety of physiological processes, including cardiovascular control.
The correlation between knee extensor torque complexity and fatigue was investigated in [22]. The results suggest that fatigue causes a substantial loss of knee extensor torque complexity. Fatigue decreases the values of ApEn and SampEn. Complexity is related to systemic adaptation, and fatigue-induced loss of complexity may result in an inability to perform physical exercise.
We hypothesized that the ACP stage is a state in which the body cannot adapt, resulting in a decrease in signal complexity. The SampEn BB results in Table 4 and Table 5 fully support this hypothesis. SampEn BB was significantly higher at rest than during exercise, consistent with the results of the previous study, and SampEn BB at ACP was also lower than at sub-max. Hence, the increase in SampEn BB is a suitable indicator for identifying the ACP stage and sub-max stage.
In a previous study, changes in SampEn BB during exercise were investigated [33]. The results revealed that SampEn BB increased significantly during exercise. These results differ from those of this study because that study only compared pre-exercise and post-exercise SampEn BB; we compared SampEn BB during exercise and fatigue.

4.4. Sub-Max Physical Load

Recently, endurance sports such as triathlons have become increasingly popular. Triathletes are advised to do exercise at sub-max physical load for a long time to avoid reaching the fatigue state (ACP stage) [8], which confers a high risk of myocardial injury [9]. Moreover, heart complications during long-duration exercise in the ACP stage have been identified [10]. As humans continue to exercise during ACP, ventricular tachycardia or fibrillation might affect myocardial injury; in addition, left ventricular dysfunction or right ventricular overload may occur after exercise. Methods of avoiding ACP have caused widespread concern; this is a key research topic in exercise health care [12]. Even if ACP can be identified according to physiological signals, few methods of identifying sub-max physical load and avoiding ACP have been developed. The assessment of sub-max physical load can be judged by measuring 90% VO2 max; however, VO2 max measurement is uncommon and inconvenient.
To the best of our knowledge, this study is the first study to introduce SampEn SV and SampEn CO as measurement methods. The results for SampEn SV and SampEn CO in Table 2 and those for BB reveal that these indicators are effective for differentiating the sub-max stage from the rest and ACP stages. Current technology has made it possible to perform non-contact breath testing, which is a remote breath detection method via radar. This is a method that does not require any wearable sensors, making it more comfortable and convenient for users. The transmission signal can even go through walls [47]. These results could be applied to wearable devices for assessing the physical load of a person to alert them if the ACP stage is reached, enabling them to stop exercising to avoid injuries and increase training efficiency.

4.5. Sub-Groups

The World Health Organization (WHO) recommends that all adults should undertake 150–300 min of moderate-intensity exercise per week [48]. According to this recommendation, subjects were classified into three categories. Those who do not reach 150 min of exercise per week were classified as the sedentary group (S), those who reach 150–300 min of exercise per week as the normal group (N), and those who exceed 300 min as the exercise group (E). The sub-group results suggest that SampEn SV is a suitable indicator for predicting sub-max physical load of body in group S. The SampEn CO difference among the three groups was not significant during rest and ACP. However, the sub-max stage SampEn CO values were significantly higher in the E group (p < 0.01). SampEn in the S and N groups showed similar trends, with little change from rest to sub-max, but a significant increase from sub-max to ACP (p < 0.01). The results for SampEn RR and SampEn SV in the three groups are shown in Figure 8. By contrast, no significant differences in SampEn RR between stages was observed for the S or N groups. Hence, our results are consistent with [40] in that SampEn RR appeared to change significantly in the trained group; hence, it could be an indicator for advanced assessment. However, the presentation of SampEn SV was different from that of SampEn RR. The least variation was observed in group E. There was no significant difference in group E. SampEn SV showed the greatest variation in group S, followed by group N.
We speculate that there is no significant difference in SampEn RR for the S and N groups due to the difference in physical ability between the three groups of subjects. Generally, subjects without exercise habits could not support the maximum exercise load, while those with exercise habits could. Therefore, it is possible that only the E group in this study reached the maximum exercise load (ACP). The behavior of SampEn RR in group E was similar to the trend for SampEn BB. We speculate that perhaps the SampEn RR, like the SampEn BB, will increase in complexity at sub-max and lose complexity at ACP.

5. Limitations

The experiment only included bicycle exercise; other exercise methods, such as treadmills and stair climbing, were not considered. Cycling was chosen because a fixed point of motion must be selected to collect dynamic data. Moreover, participants’ cycling experience was not investigated, and exercise habits were surveyed by questionnaire only. Exercise habits were distinguished as either aerobic or anaerobic exercise. The sample sizes of 9, 10, and 11 for the Sedentary, Normal, and Exercise groups are too small in this study. Finally, only SampEn data were used; other entropy methodologies could produce different results.

6. Conclusions

Physiological data were collected from 30 participants using a bicycle-based incremental exercise experiment. Time-domain, frequency domain, and SampEn analyses were performed, and the results are as follows: BR increases with exercise time (15.42 to 21.33) but cannot be used to identify the sub-max stage. SampEn BB can effectively identify the sub-max stage (p < 0.05). SampEn RR increases with exercise time but cannot effectively identify the sub-max stage. However, the novel indicators of SampEn SV and CO can identify the sub-max stage (p < 0.01). SampEn RR is correlated with RR (R = 0.51, p < 0.01), and SV is correlated with SVV nHF at rest (R = 0.46, p < 0.05). This study also identified the threshold value of each SampEn value in sub-max, which can be used as a sports science indicator to assess the load of athletes. This study is one of the few that have used SampEn to assess physical load, and the results suggest that SampEn can be used to identify the sub-max and ACP stages. Hence, exercise habits can be effectively assessed with the various proposed SampEn indicators. The results can be applied to sports science to help athlete assess their physical load in a more quantitative manner.

7. Future Work

The results of this study can be used to predict the physical load of cyclists, triathletes, and other athletes to avoid the risk of injury caused by training at ACP. For example, baseball coaches could use these indicators to determine whether a pitcher should be changed. Future experiments could investigate these indicators for older adults to assess their applicability for rehabilitation exercises, such as rehabilitation cycling. Although SampEn is a powerful technique, it is not sufficiently fast for analyzing signals; DE could be used to analyze signals of larger size. Moreover, multiscale entropy methods may be more effective for observing changes in physiological signals than the single-scale entropy methods used in this study. Entropy of entropy (EoE) can be also used to measure complexity and disorder.

Author Contributions

Conceptualization, Y.-H.L.; software, Y.-H.L., P.-H.H. and T.-C.H.; validation, P.-H.H. and T.-C.H.; formal analysis, Y.-H.L.; investigation, Y.-H.L.; resources, T.-C.H.; data curation, Y.-H.L.; writing—original draft preparation, Y.-H.L.; writing—review and editing, P.-H.H. and T.-C.H.; visualization, Y.-H.L.; supervision, T.-C.H. All authors have read and agreed to the published version of the manuscript.

Funding

This research was funded by Ministry of Science and Technology, Taiwan under grant numbers MOST109-2221-E-009-117-MY3. This research was funded by the National Science and Technology Council of Taiwan under grant number MOST111-2221-EA49-011-MY3. This work was supported by the Higher Education Sprout Project of National Yang Ming Chiao Tung University and the Ministry of Education (MOE).

Institutional Review Board Statement

The study was conducted in accordance with the Declaration of Helsinki, and approved by the Research Ethics Committee for Human Subject Protection (REC) at the National Yang Ming Chiao Tung University (NYCU-REC-110-026F).

Informed Consent Statement

Informed consent was obtained from all subjects involved in the study.

Data Availability Statement

The data presented in this study are available on request from the corresponding author. The data are not publicly available due to the privacy of subjects.

Conflicts of Interest

The authors declare no conflict of interest.

References

  1. Goolaerts Suffered heart Attack before Crash: Autopsy. AFP. April 2018. Available online: https://www.france24.com/en/20180411-goolaerts-suffered-heart-attack-before-crash-autopsy (accessed on 1 January 2022).
  2. Marijon, E.; Tafflet, M.; Celermajer, D.S.; Dumas, F.; Perier, M.-C.; Mustafic, H.; Toussaint, J.-F.; Desnos, M.; Rieu, M.; Benameur, N.; et al. Sports-related sudden death in the general population. Circulation 2011, 124, 672–681. [Google Scholar] [CrossRef] [PubMed] [Green Version]
  3. Claessen, G.; La Gerche, A. Exercise-induced cardiac fatigue: The need for speed. J. Physiol. 2016, 594, 2781. [Google Scholar] [CrossRef] [PubMed] [Green Version]
  4. Leischik, R. Sports cardiology: Lessons from the past and perspectives for the future. F1000Research 2015, 4, 94. [Google Scholar] [CrossRef] [PubMed]
  5. Ganong, W.F. Review of medical physiology. Rev. Med. Physiol. 1975, 26, 599. [Google Scholar]
  6. Lai, W.-C.; Huang, P.-H.; Hsiao, T.C. Relationship between breath regulation and stroke volume with exercise intensity: A pilot study. In Proceedings of the 12th International Conference on eHealth, Telemedicine, and Social Medicine (eTELEMED 2020), Valencia, Spain, 21–25 November 2020. [Google Scholar]
  7. Stöhr, E.J.; González-Alonso, J.; Shave, R. Left ventricular mechanical limitations to stroke volume in healthy humans during incremental exercise. Am. J. Physiol.-Heart Circ. Physiol. 2011, 301, 478–487. [Google Scholar] [CrossRef] [PubMed] [Green Version]
  8. Leischik, R.; Spelsberg, N. Endurance sport and “cardiac injury: A prospective study of recreational ironman athletes. Int. J. Environ. Res. Public Health 2014, 11, 9082–9100. [Google Scholar] [CrossRef] [PubMed] [Green Version]
  9. James, H.O.; Patil, H.R.; Lavie, C.J.; Magalski, A.; Vogel, R.A.; McCullough, P.A. Potential adverse cardiovascular effects from excessive endurance exercise. Mayo Clin. Proc. 2012, 87, 736–740. [Google Scholar]
  10. George, K.P.; Wolfe, L.A.; Burggraf, G.W. The ‘athletic heart syndrome’. Sport. Med. 1991, 11, 300–331. [Google Scholar] [CrossRef]
  11. La Gerche, A.; Burns, A.T.; Mooney, D.J.; Inder, W.J.; Taylor, A.J.; Bogaert, J.; MacIsaac, A.I.; Heidbüchel, H.; Prior, D.L. Exercise-induced right ventricular dysfunction and structural remodelling in endurance athletes. Eur. Heart J. 2012, 33, 998–1006. [Google Scholar] [CrossRef] [Green Version]
  12. Leischik, R. Endurance sport and cardiac injury. Kardiol. Pol. Pol. Heart J. 2014, 72, 587–597. [Google Scholar] [CrossRef]
  13. Denniston, J.C.; Maher, J.T.; Reeves, J.T.; Cruz, J.C.; Cymerman, A.; Grover, R.F. Measurement of cardiac output by electrical impedance at rest and during exercise. J. Appl. Physiol. 1976, 40, 91–95. [Google Scholar] [CrossRef] [PubMed]
  14. Northridge, D.B.; Findlay, I.N.; Wilson, J.; Henderson, E.; Dargie, H.J. Non-invasie determination of cardiac output by Doppler echocardiography and electrical bioimpedance. Heart 1990, 63, 93–97. [Google Scholar] [CrossRef] [PubMed] [Green Version]
  15. Mead, J. Volume displacement body plethysmograph for respiratory measurements in human subjects. J. Appl. Physiol. 1960, 15, 736–740. [Google Scholar] [CrossRef]
  16. Heyde, C.; Leutheuser, H.; Eskofier, B.; Roecker, K.; Gollhofer, A. Respiratory inductance plethysmography-a rationale for validity during exercise. Med. Sci. Sport. Exerc. 2014, 46, 488–495. [Google Scholar] [CrossRef]
  17. Swain, D.P.; Abernathy, K.S.; Smith, C.S.; Lee, S.J.; A Bunn, S. Target heart rates for the development of cardiorespiratory fitness. Med. Sci. Sport. Exerc. 1994, 26, 112–116. [Google Scholar] [CrossRef]
  18. Mador, M.J.; Acevedo, F.A. Effect of respiratory muscle fatigue on breathing pattern during incremental exercise. Am. Rev. Respir. Dis. 1991, 143, 462–468. [Google Scholar] [CrossRef]
  19. Kaikkonen, P.; Hynynen, E.; Mann, T.; Rusko, H.; Nummela, A. Can HRV be used to evaluate training load in constant load exercises? Eur. J. Appl. Physiol. 2010, 108, 435–442. [Google Scholar] [CrossRef]
  20. Lai, Y.-H.; Lai, W.-C.; Huang, P.-H.; Hsiao, T.-C. Time- and frequency-domain analysis of stroke volume variability using indoor cycling to evaluate physical load of body. Information 2022, 13, 148. [Google Scholar] [CrossRef]
  21. Costa, M.; Goldberger, A.L.; Peng, C.-K. Multiscale entropy analysis of complex physiologic time series. Phys. Rev. Lett. 2002, 89, 068102. [Google Scholar] [CrossRef] [Green Version]
  22. Pethick, J.; Winter, S.L.; Burnley, M. Fatigue reduces the complexity of knee extensor torque fluctuations during maximal and submaximal intermittent isometric contractions in man. J. Physiol. 2015, 593, 2085–2096. [Google Scholar] [CrossRef]
  23. Goldberger, A.L.; Peng, C.-K.; A Lipsitz, L. What is physiologic complexity and how does it change with aging and disease? Neurobiol. Aging 2002, 23, 23–26. [Google Scholar] [CrossRef]
  24. Lipsitz, L.A.; Goldberger, A.L. Loss of ‘complexity’ and aging: Potential applications of fractals and chaos theory to senescence. JAMA 1992, 267, 1806–1809. [Google Scholar] [CrossRef] [PubMed]
  25. Cropper, W.H. Rudolf Clausius and the road to entropy. Am. J. Phys. 1986, 54, 1068–1074. [Google Scholar] [CrossRef]
  26. Shannon, C.E. A mathematical theory of communication. Bell Syst. Tech. J. 1948, 27, 379–423. [Google Scholar] [CrossRef] [Green Version]
  27. Kolmogorov, A.N. On tables of random numbers. Sankhyā: Indian J. Stat. Ser. A 1963, 25, 369–376. [Google Scholar] [CrossRef] [Green Version]
  28. Pincus, S.M. Approximate entropy as a measure of system complexity. Proc. Natl. Acad. Sci. USA 1991, 88, 2297–2301. [Google Scholar] [CrossRef] [PubMed] [Green Version]
  29. Delgado-Bonal, A.; Marshak, A. Approximate entropy and sample entropy: A comprehensive tutorial. Entropy 2019, 21, 541. [Google Scholar] [CrossRef] [Green Version]
  30. Richman, J.S.; Moorman, J.R. Physiological time-series analysis using approximate entropy and sample entropy. Am. J. Physiol.-Heart Circ. Physiol. 2000, 278, H2039–H2049. [Google Scholar] [CrossRef] [Green Version]
  31. Lewis, M.J.; Short, A.L. Sample entropy of electrocardiographic RR and QT time-series data during rest and exercise. Physiol. Meas. 2007, 28, 731. [Google Scholar] [CrossRef]
  32. Naranjo-Orellana, J.; Nieto-Jiménez, C.; Ruso-Álvarez, J. Non-linear heart rate dynamics during and after three controlled exercise intensities in healthy men. Physiol. Int. 2021, 107, 501–512. [Google Scholar] [CrossRef]
  33. Bandara, K.; Wijesiriwardana, R. Sample entropy analysis of cardiac and respiratory responses during four limbs exercise. In Proceedings of the 3rd International Conference on Electrical Engineering (EECon) 2021, Colombo, Sri Lanka, 24 September 2021; pp. 106–111. [Google Scholar]
  34. Schmidt, C.; Theilmeier, G.; Van Aken, H.; Korsmeier, P.; Wirtz, S.P.; Berendes, E.; Hoffmeier, A.; Meissner, A. Comparison of electrical velocimetry and transoesophageal Doppler echocardiography for measuring stroke volume and cardiac output. Br. J. Anaesth. 2005, 95, 603–610. [Google Scholar] [CrossRef] [PubMed] [Green Version]
  35. Yeh, J.-R.; Shieh, J.-S.; Huang, N.E. Complementary ensemble empirical mode decomposition: A novel noise enhanced data analysis method. Adv. Adapt. Data Anal. 2010, 2, 135–156. [Google Scholar] [CrossRef]
  36. Yentes, J.M.; Hunt, N.; Schmid, K.K.; Kaipust, J.P.; McGrath, D.; Stergiou, N. The appropriate use of approximate entropy and sample entropy with short data sets. Ann. Biomed. Eng. 2013, 41, 349–365. [Google Scholar] [CrossRef]
  37. Lake, D.E.; Richman, J.S.; Griffin, M.P.; Moorman, J.R. Sample entropy analysis of neonatal heart rate variability. Am. J. Physiol.-Regul. Integr. Comp. Physiol. 2002, 283, R789–R797. [Google Scholar] [CrossRef] [PubMed] [Green Version]
  38. Bandt, C.; Pompe, B. Permutation entropy: A natural complexity measure for time series. Phys. Rev. Lett. 2002, 88, 174102. [Google Scholar] [CrossRef]
  39. Rostaghi, M.; Azami, H. Dispersion entropy: A measure for time-series analysis. IEEE Signal Process. Lett. 2016, 23, 610–614. [Google Scholar] [CrossRef]
  40. Liu, Y.; Liu, C.; Wang, B.; Yu, M. Sample Entropy analysis of heart rate variability during rest and exercise in hypoxia. Int. J. Control Autom. 2014, 7, 1–8. [Google Scholar] [CrossRef] [Green Version]
  41. Weippert, M.; Behrens, M.; Rieger, A.; Behrens, K. Sample entropy and traditional measures of heart rate dynamics reveal different modes of cardiovascular control during low intensity exercise. Entropy 2014, 16, 5698–5711. [Google Scholar] [CrossRef] [Green Version]
  42. Platiša, M.; Mazic, S.; Nestorovic, Z.; Gal, V. Complexity of heartbeat interval series in young healthy trained and untrained men. Physiol. Meas. 2008, 29, 439. [Google Scholar] [CrossRef]
  43. NBerry, N.T.; Bechke, E.; Shriver, L.H.; Calkins, S.D.; Keane, S.P.; Shanahan, L.; Wideman, L. Heart rate dynamics during acute recovery from maximal aerobic exercise in young adults. Front. Physiol. 2021, 12, 627320. [Google Scholar]
  44. Hsu, C.F.; Wei, S.-Y.; Huang, H.-P.; Hsu, L.; Chi, S.; Peng, C.-K. Entropy of entropy: Measurement of dynamical complexity for biological systems. Entropy 2017, 19, 550. [Google Scholar] [CrossRef] [Green Version]
  45. Huang, P.-H.; Hsiao, T.-C. Intrinsic Entropy: A Novel Adaptive Method for Measuring the Instantaneous Complexity of Time Series. IEEE Signal Process. Lett. 2023, 2023, 3244508. [Google Scholar] [CrossRef]
  46. Lipsitz, L.A. Dynamics of stability: The physiologic basis of functional health and frailty. J. Gerontol. Ser. A Biol. Sci. Med. Sci. 2002, 57, B115–B125. [Google Scholar] [CrossRef] [PubMed] [Green Version]
  47. Vanegas, E.; Igual, R.; Plaza, I. Sensing systems for respiration monitoring: A technical systematic review. Sensors 2020, 20, 5446. [Google Scholar] [CrossRef] [PubMed]
  48. Bull, F.C.; Al-Ansari, S.S.; Biddle, S.; Borodulin, K.; Buman, M.P.; Cardon, G. World Health Organization 2020 guidelines on physical activity and sedentary behavior. Br. J. Sport. Med. 2020, 54, 1451–1462. [Google Scholar] [CrossRef] [PubMed]
Figure 1. Protocol flowchart and stage normalization.
Applsci 13 03813 g001
Figure 2. RIP signal processing flowchart.
Applsci 13 03813 g002
Figure 3. Flowchart of SampEn calculation. N: the time series length. m: the sequence length to be compared. r: accepting matches tolerance.
Applsci 13 03813 g003
Figure 4. The results for SampEn RR ROC curve.
Applsci 13 03813 g004
Figure 5. The results for SampEn SV ROC curve.
Applsci 13 03813 g005
Figure 6. The results for SampEn CO ROC curve.
Applsci 13 03813 g006
Figure 7. The results for SampEn BB ROC curve.
Applsci 13 03813 g007
Figure 8. The results of SampEn RR and SampEn SV in the three groups.
Applsci 13 03813 g008
Table 1. Participant data.
S (Sedentary)N (Normal)E (Exercise)
Exercise time/week (hour)0.6 ± 0.52 *3.00 ± 1.00 *11.64 ± 8.37
Gender (male/female)4/64/59/2
Body mass index22.52 ± 3.5722.14 ± 2.7123.59 ± 2.25
Riding time (min)20.50 ± 4.8821.67 ± 3.6122.91 ± 2.43
ACP stage2.6 ± 1.172.00 ± 0.71 *4.45 ± 2.58
* p < 0.05, compared with E group.
Table 2. SampEn RR, SV, and CO during the rest, sub-max, and ACP stages.
SampEn RRSampEn SVSampEn CO
Rest (N = 24)mean ± SD1.01 ± 0.481.44 ± 0.391.33 ± 0.41
median1.241.431.38
Sub-max (N = 24)mean ± SD1.26 ± 0.441.78 ± 0.371.86 ± 0.29
median1.22 *1.77 **,##1.82 **,##
ACP stage (N = 24)mean ± SD1.31 ± 0.462.14 ± 0.092.18 ± 0.13
median1.35 *2.15 **2.18 **
* p < 0.05, ** p < 0.01 compared with rest. ## p < 0.01 compared with the ACP stage.
Table 3. Pearson correlation coefficients between SampEn RR and HRV and between SampEn SV and SVV.
RestSub-Max StageACP Stage
RR0.51 **−0.010.17
HRV nHF0.190.36 *0.11
HRV nLF−0.19−0.36 *−0.11
SV0.300.13−0.05
SVV nHF0.46 *−0.020.16
SVV nLF−0.46 *0.02−0.16
Statistically significant correlation, * p < 0.05, ** p < 0.01.
Table 4. BR and SampEn BB during the rest, sub-max, and ACP stages.
BRSampEn BB
Rest (N = 20)Mean ± SD16.62 ± 3.931.98 ± 0.44
median15.582.06
Sub-max (N = 20)Mean ± SD20.08 ± 4.252.34 ± 0.44
median18.83 **2.32 *,##
ACP stage (N = 20)Mean ± SD21.48 ± 6.501.71 ± 0.36
median19.17 **1.77 *
* p < 0.05, ** p < 0.01 compared with rest. ## p < 0.01 compared with the ACP stage.
Table 5. SampEn RR, SampEn SV, SampEn CO, SampEn BB, and BR in the three groups during rest, sub-max, and ACP stages.
RestSub-MaxACP
Mean ± SDMedianMean ± SDMedianMean ± SDMedian
SampEn RRS (N = 8)1.04 ± 0.451.111.11 ± 0.441.021.41 ± 0.571.51
N (N = 8)1.26 ± 0.421.31 ^1.29 ± 0.511.231.36 ± 0.441.38
E (N = 8)0.73 ± 0.450.671.36 ± 0.441.38 *1.16 ± 0.381.07 *
SampEn SVS (N = 8)1.01 ± 0.481.241.26 ± 0.441.22 *1.31 ± 0.461.35 *
N (N = 8)1.18 ± 0.331.151.65 ± 0.391.54 *,#2.13 ± 0.122.15 *
E (N = 8)1.39 ± 0.351.42 †1.68 ± 0.281.64 *2.13 ± 0.102.13 *
SampEn COS (N = 8)1.76 ± 0.271.77 ††2.01 ± 0.35 †2.132.16 ± 0.082.16 *
N (N = 8)1.44 ± 0.391.431.78 ± 0.371.77 **,##2.14 ± 0.092.15 **
E (N = 8)1.37 ± 0.351.401.76 ± 0.271.80 ##,2.17 ± 0.112.18 **
SampEn BBS (N = 5)1.88 ± 0.431.982.34 ± 0.352.30 #1.87 ± 0.231.91
N (N = 8)1.99 ± 0.482.15 †2.29 ± 0.782.471.80 ± 0.391.83
E (N = 7)2.10 ± 0.452.252.38 ± 0.252.35 #1.47 ± 0.381.51 *,
BRS (N = 5)15.79 ± 2.816.5017.65 ± 1.7918.17 ^17.15 ± 4.8515.75 ^
N (N = 8)16.47 ± 4.415.3320.87 ± 5.0920.67 *22.50 ± 6.0621.50 *
E (N = 7)17.69 ± 4.915.6722.29 ± 4.6924.0025.69 ± 5.9526.33 *
* p < 0.05, ** p < 0.01 compared with rest. # p < 0.05, ## p < 0.01 compared with the ACP stage. † p < 0.05, †† p < 0.01 compared with group S. ^ p < 0.05 compared with group E.
Disclaimer/Publisher’s Note: The statements, opinions and data contained in all publications are solely those of the individual author(s) and contributor(s) and not of MDPI and/or the editor(s). MDPI and/or the editor(s) disclaim responsibility for any injury to people or property resulting from any ideas, methods, instructions or products referred to in the content.

