Article

Wi-NN: Human Gesture Recognition System Based on Weighted KNN

School of Software, Xinjiang University, Urumqi 830091, China
*
Author to whom correspondence should be addressed.
Appl. Sci. 2023, 13(6), 3743; https://doi.org/10.3390/app13063743
Submission received: 27 November 2022 / Revised: 7 March 2023 / Accepted: 9 March 2023 / Published: 15 March 2023
(This article belongs to the Special Issue New Insights into Pervasive and Mobile Computing)

Abstract

:
Gesture recognition, the basis of human–computer interaction (HCI), is a significant component for the development of smart home, VR, and senior care management. Most gesture recognition methods still depend on sensors worn by the user or video-based gestures for recognition, can be used for fine-grained gesture recognition. our paper implements a gesture recognition method that is independent of environment and gesture drawing direction, and it achieves gesture recognition classification by using small sample data. Wi-NN, proposed in this study, does not require the user to wear additional device. In this case, channel state information (CSI) extracted from Wi-Fi signal is used to capture the action information of the human body via CSI. After pre-processing to reduce the interference of environmental noise as much as possible, clear action information is extracted using the feature extraction method based on time domain to obtain the gesture action feature data. The gathered data are integrated with the weighted k-nearest neighbor (KNN) classification recognizer for classification task. The experiment outcomes revealed that the accuracy scores of the same gesture for different users and different gestures for the same user under the same environment were 93.1% and 89.6%, respectively. The experiments in different environments also achieved good recognition results, and by comparing with other experimental methods, the experiments in this paper have better recognition results. Evidently, good classification results were generated after the original data were processed and incorporated into the weighted KNN.

1. Introduction

The rapid progress of the Internet of Things (IOT) has accelerated the applications of human–computer interaction (HCI) [1] and gestures, such as in enabling smart homes, VR, as well as elderly care management. Therefore, gesture recognition in the simplest and most efficient ways has become a significant research direction in this present era.
To date, the mainstream approaches to gesture recognition include gesture recognition based on wearable devices [2,3], gesture recognition based on computer vision [4], and gesture recognition based on RFID [5]. Although wearable-based gesture recognition has been studied in recent years with high recognition accuracy, a device plastered on human body undeniably causes inconvenience to the users at the extent of affecting one’s interaction experience. Meanwhile, computer vision-based gesture recognition approach demands the use of a camera [6], which denotes privacy violation, vision blockage in specific areas, and the requirement for adequate lighting at the target region. Turning to gesture recognition based on Wi-Fi and radio frequency (RF) approaches, there is neither privacy violation, a wearable device on the body, nor lighting demand. Real-time gesture recognition based on Wi-Fi and RF signals via RFID has garnered popularity within the academic research area [7,8]. The RFID-based recognition of human gestures studied by Wang et al. [9] yielded good results, despite the strict requirements for its signal characteristics in tagging location and notable unsatisfactory scenarios when applied in the actual setting.
The Wi-Fi-based gesture recognition system is classified based on received signal strength (RSSI), phase, and amplitude. Among them, RSSI (coarse-grained signal) displays poor stability performance in the environment of signal interference and indoor multipath. As for the phase-based gesture recognition, Wang et al. [9] reported good results despite the intricate processing. Meanwhile, channel state information (CSI)-based gesture recognition has garnered much attention due to its high sensitivity towards changes in action (fine-grained signal), high diversity in both frequency and spatial domains, as well as possession of more information than RSSI. Zheng et al. [10] proposed Widar 3.0 to capture and estimate the velocity profile of gestures at a lower signal level, which only required training of the classifier once to identify recognition of gestures in various domains. However, the complexity of the algorithm for feature extraction disrupted real-time computation. Next, Li et al. [11] proposed a cross-domain-based gesture recognition using deep neural network (DNN) and reported good experimental results. However, the use of deep learning method to classify and recognize gestures required huge amount of dataset for training, while the use of additional hardware resources led to complex models and lengthy training time. Such complex deep learning models could easily cause an overfitting issue.
In the attempt to address the problems stated above, an easy-to-implement and resource-efficient method for gesture recognition is proposed in this study. In doing so, the extracted CSI amplitude information was deployed in a series of processing to classify the gestures using a public dataset [12]. The contributions of this study are listed as follows:
(1)
Original information extracted from complex environment, while omitted user’s gesture direction and velocity vector, Hampel, discrete wavelet pre-processing, and principal component analysis (PCA) were employed to select the optimal subcarrier for feature extraction and selection.
(2)
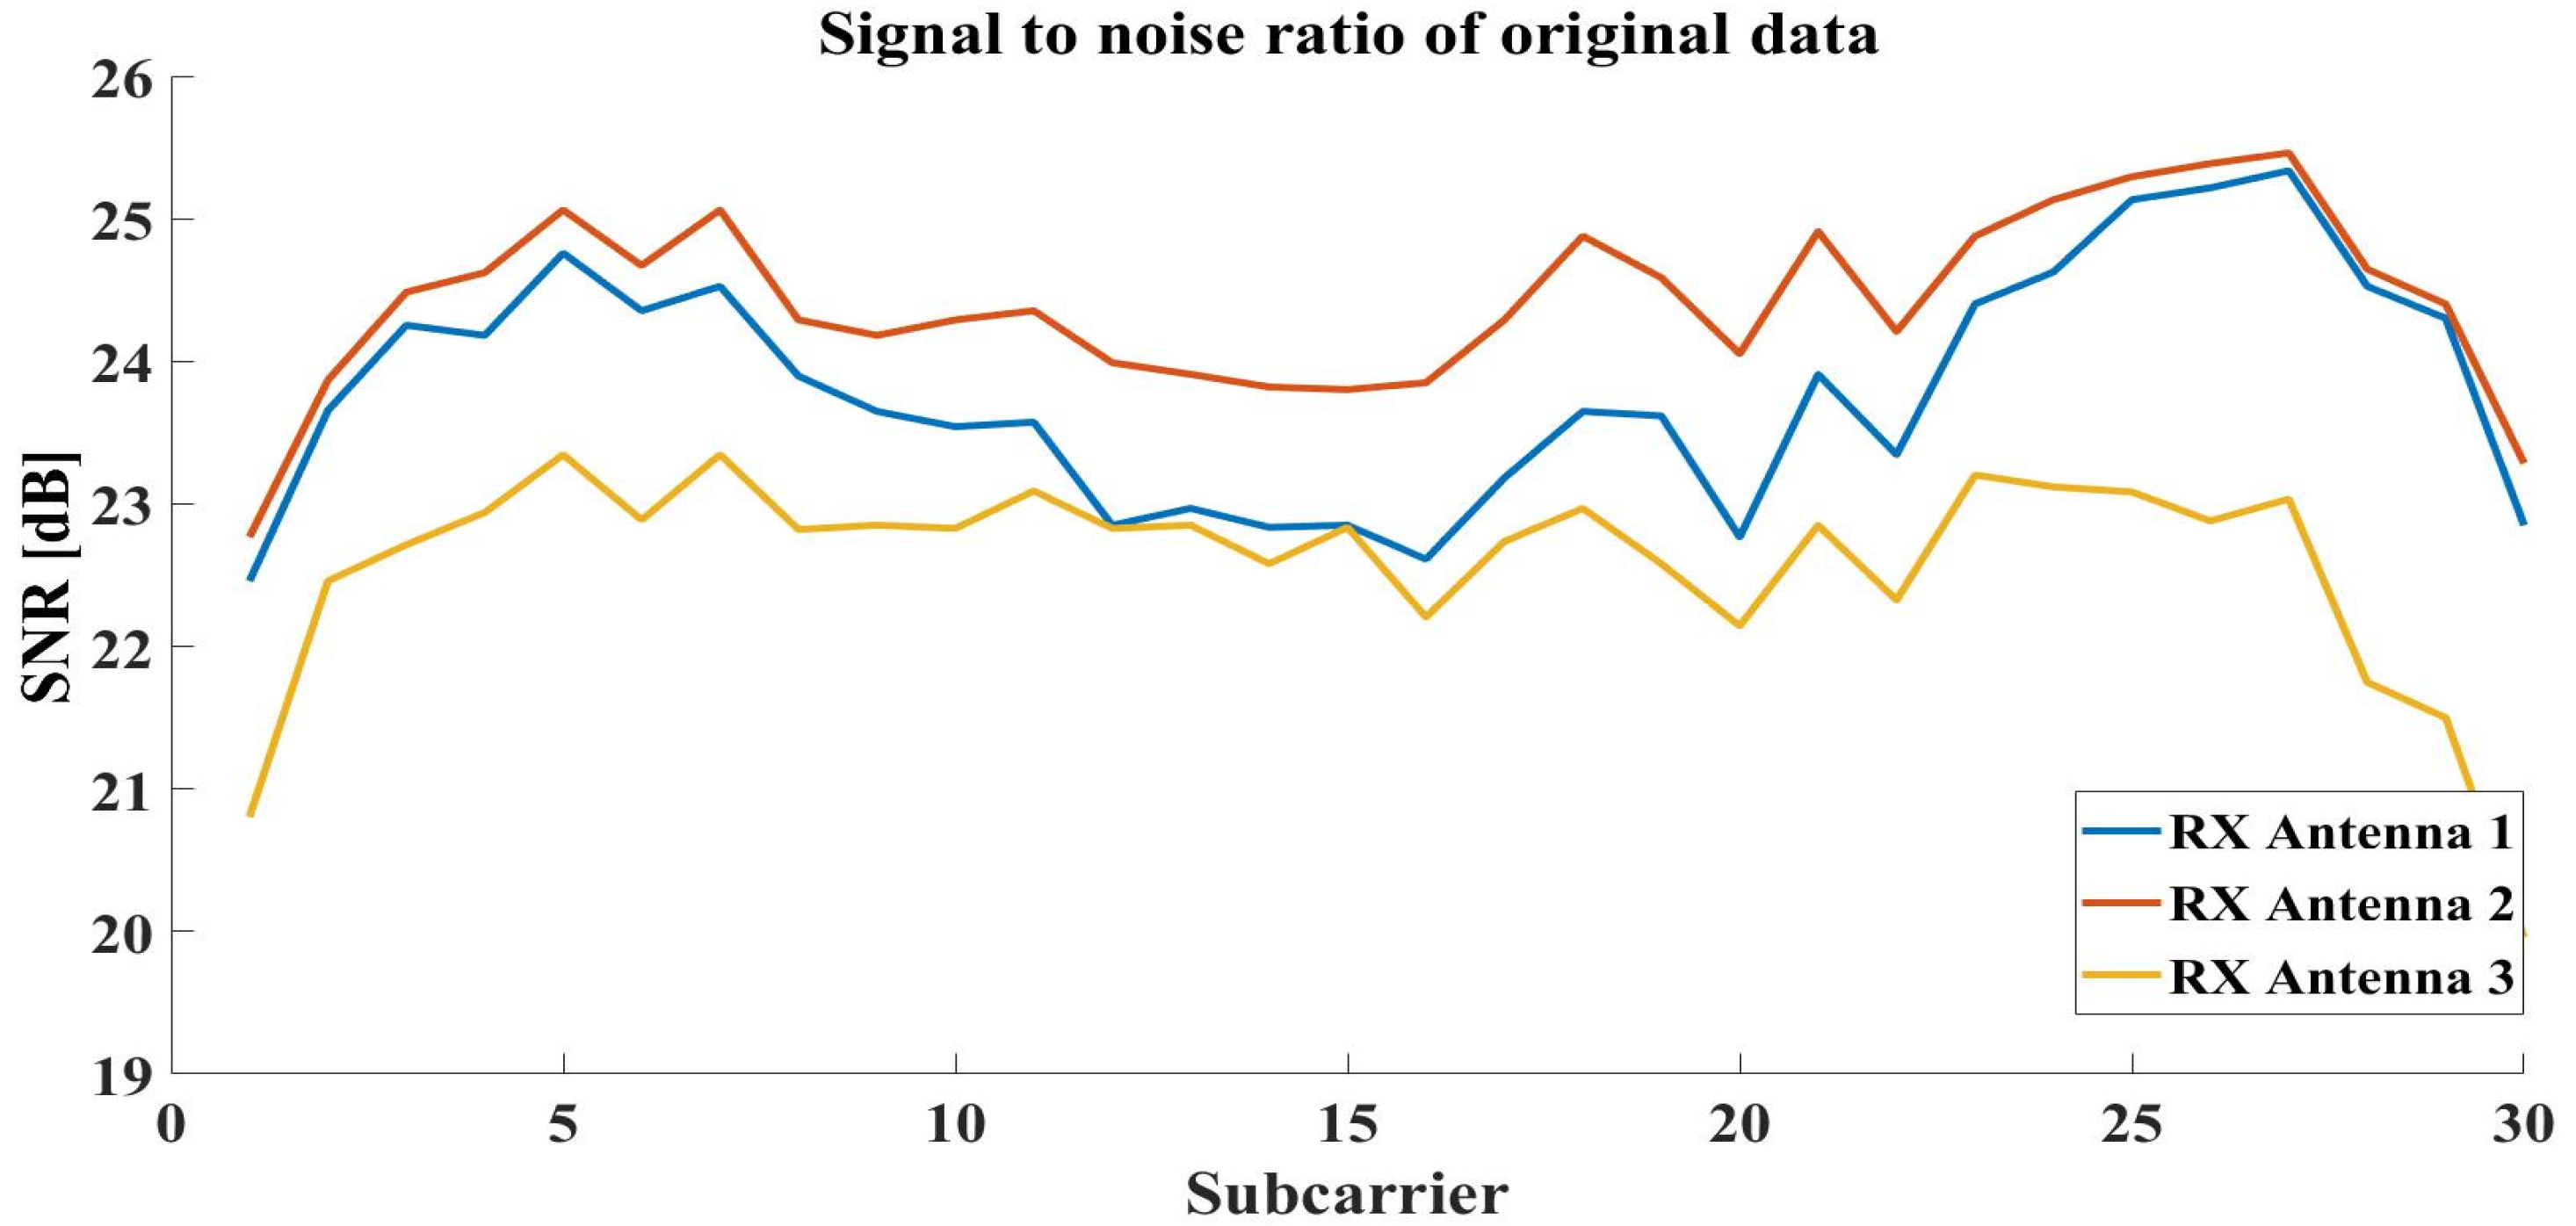
For the selection of antenna, this paper is the first to use signal-to-noise ratio (S/N), variance size, as well as amplitude maximum and minimum differences, as the indicators.
(3)
For gestures recognition and classification, this study adopted the feature selection based on time domain by selecting the appropriate feature values and, finally, integrating the feature dataset into the weighted KNN classifier for classification and recognition.

2. Related Work

2.1. Gesture Recognition Technology

The techniques of gesture acquisition can be divided into three categories: computer vision, wearable devices, and wireless devices. Computer vision-based gesture recognition is enabled by using the camera [13] under sufficient lighting to predict a gesture action of the target object via joint learning to detect people and objects. Nonetheless, this computer vision approach necessitates adequate lighting conditions and, in some cases, to the extent of violating users’ privacy in recognizing gestures at private locations. Next, gesture recognition techniques based on wearable devices rely on motion sensors [14,15], millimeter waves [16], ultrasonic waves [17], as well as accelerometers and gyroscopes mounted on integrated smart watches. Although this approach yields high recognition accuracy, wearing smart devices for a long time may cause fatigue to the users and affect their interaction experience.

2.2. Studies on the Technology of Sensing Based on Wi-Fi
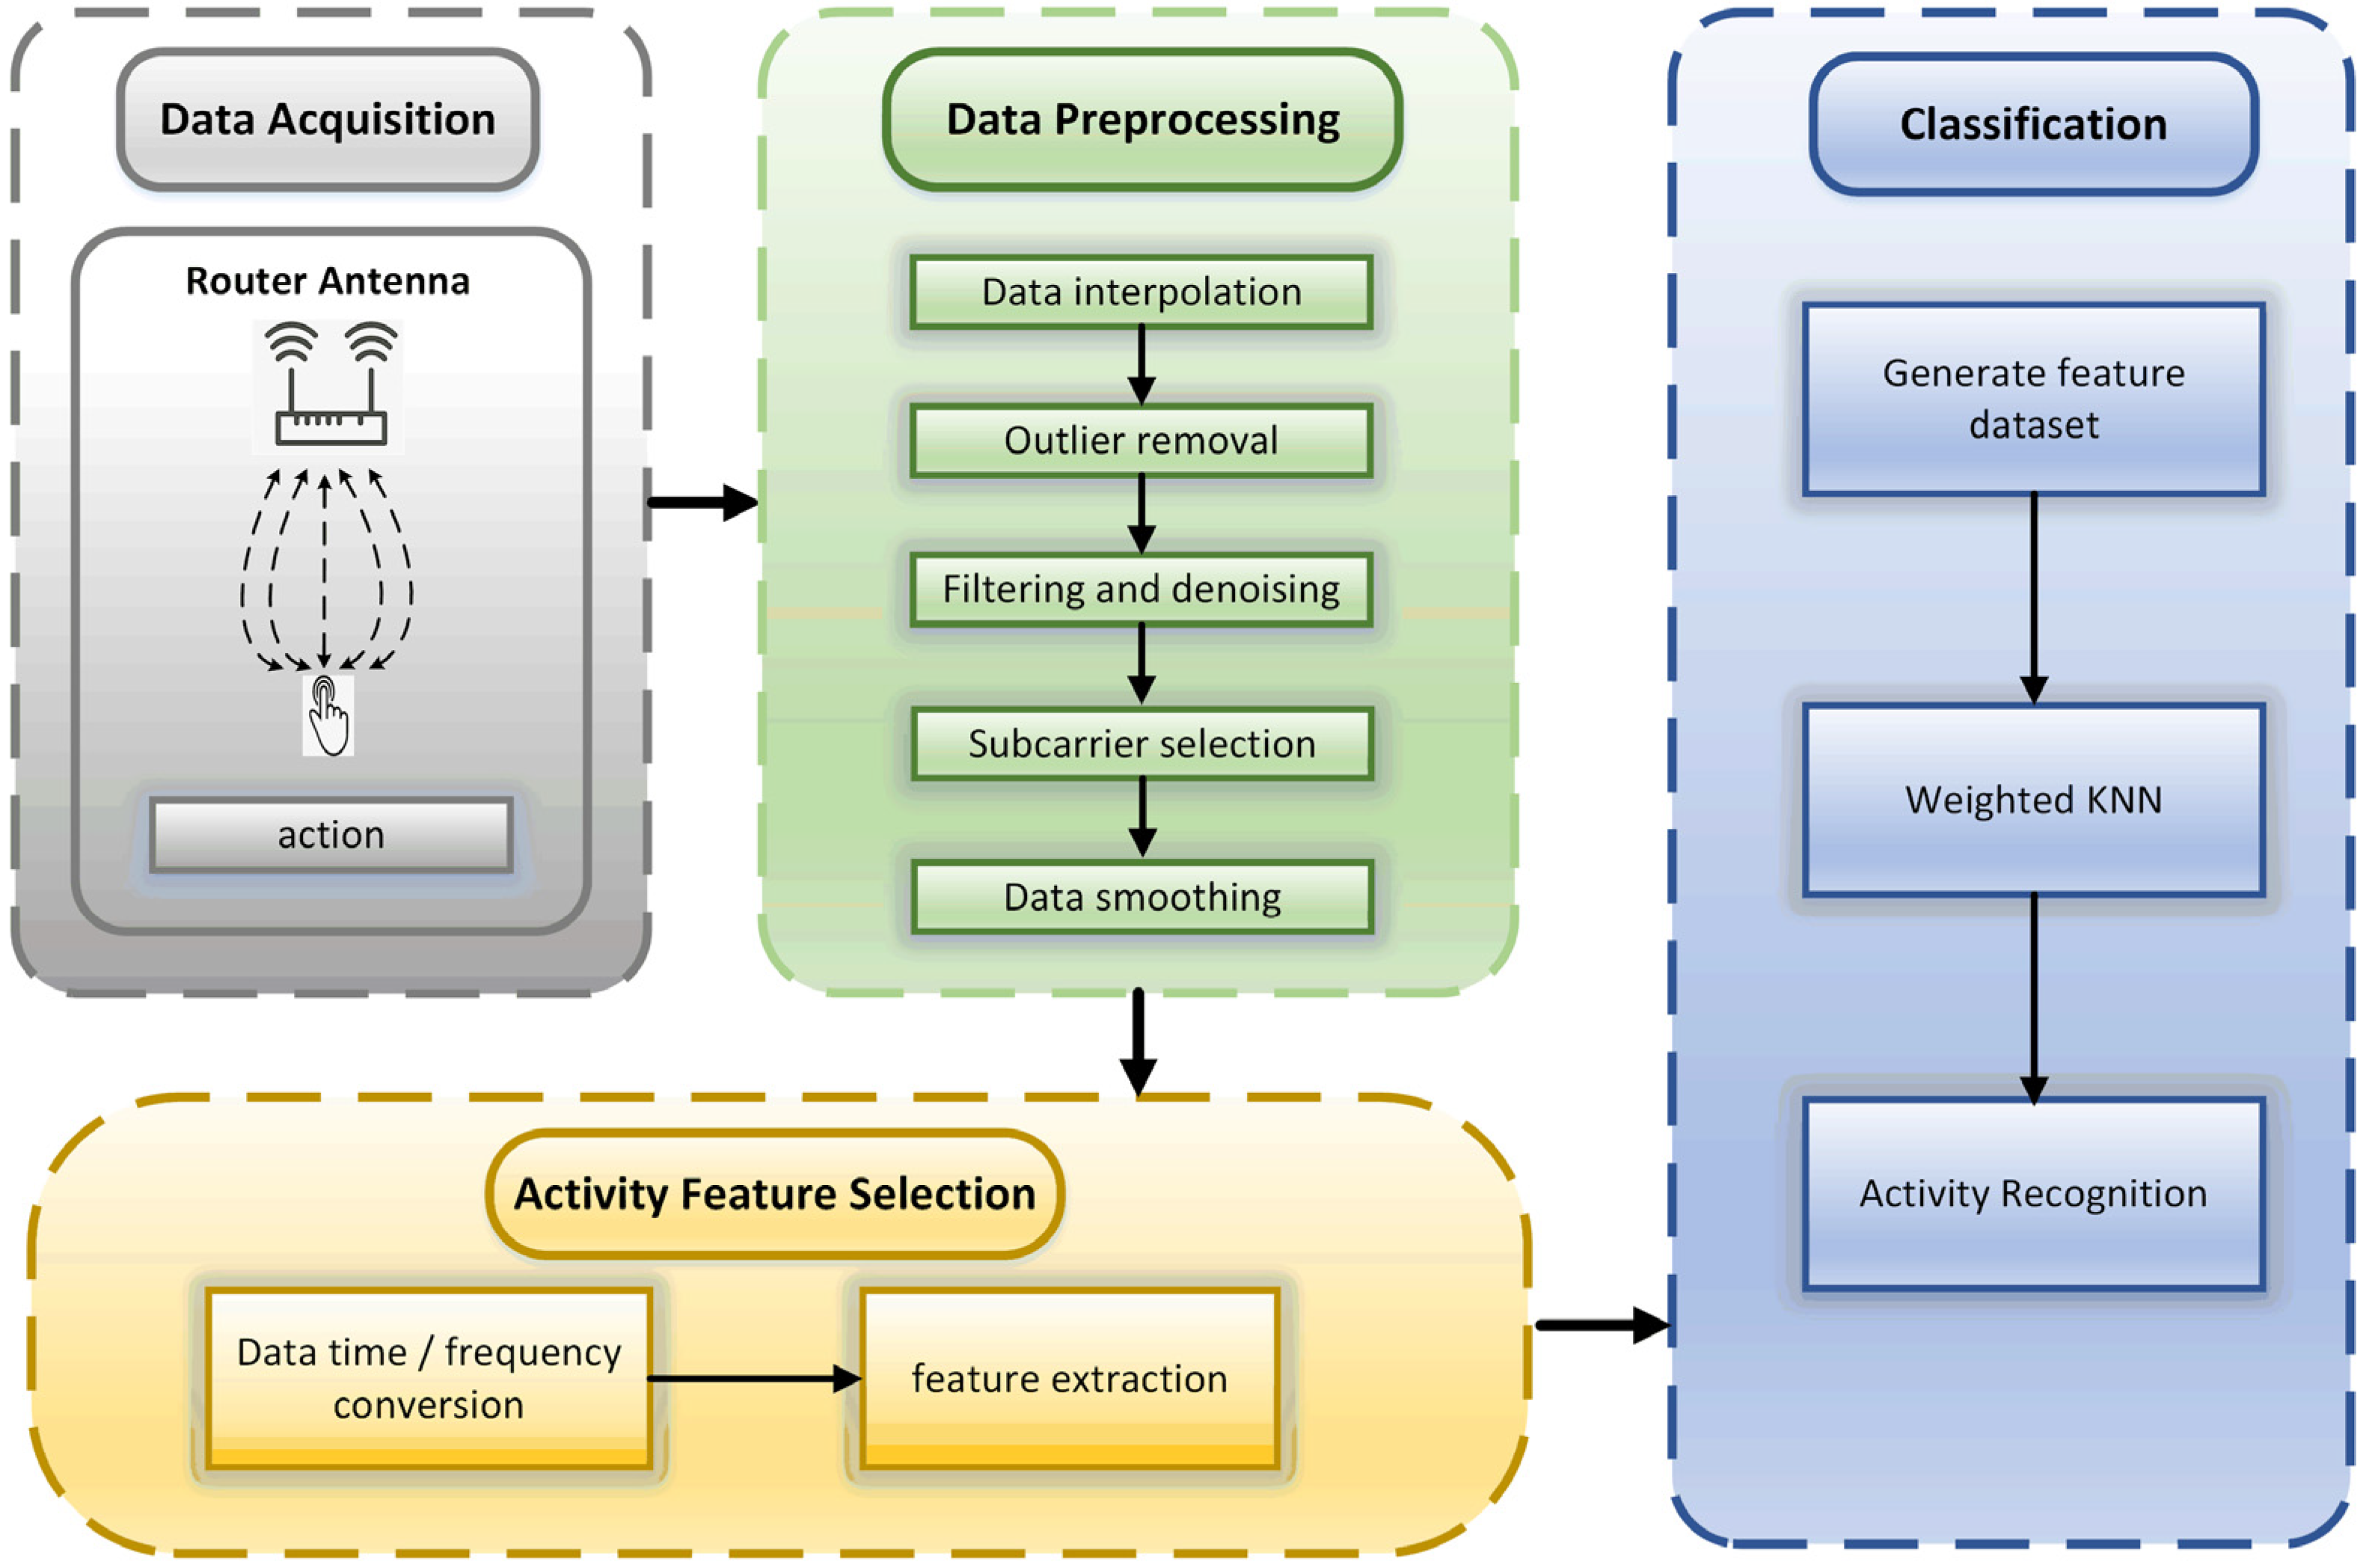
The commercial technology of Wi-Fi has penetrated into all aspects of people’s lives. The Wi-Fi technology has been applied in multiple research areas, including indoor localization [18,19], fall detection [20,21], motion detection [22], human identification [23], and gesture recognition [24,25]. A Wi-Fi-based indoor 3D positioning system using a multi-signal classification algorithm was used to estimate the angle of arrival for linear propagation of the signal, and later, the calibration data were deployed to estimate the time of flight [26]. In another study, an optimized non-uniform planar array was applied in the world-first array at the receiver side. In the field of gesture recognition, location-independent gesture features only related to the mechanical orientation of the gesture were extracted in [23]. In [21], high recognition accuracy was achieved by extracting the part of the signal that displayed fall by using the short-time Fourier (STFT) algorithm to extract time-frequency features. The study applied a forward selection algorithm to filter out feature data sensitive to environmental changes after integrating them into a Support Vector Machine (SVM) classifier for classification. It was proposed in [27] to combine a motion detection method using RF system and Wi-Fi to achieve human motion detection. Human gait was extracted and combined with CSI and acoustic information of footsteps for human identification [23]. A study by [28] generated effective feature signals to prevent Wi-Fi APs from being used by unauthorized people. In [29], gesture recognition was implemented in multi-user scenarios using multiple Wi-Fi links after filtering out noise. The study designed an outlier detection algorithm that can determine if the gesture is a predefined gesture and can reduce the impact of other irrelevant features on the accuracy by using a dynamic link selection algorithm. Despite its good experimental results, the signal processing process is complex and difficult to implement.

3. System Principle

This section elaborates on the basic principles of Wi-Fi recognition to build a flexible and easy-to-deploy gesture recognition system model.

Principle of Human Behavior Recognition Based on Channel State Information

The wide usage of Wi-Fi devices covers every nook and corner of cities. The success of Wi-Fi is attributed to an important technology called Multiple Input Multiple Output (MIMO), which is characterized by high throughput to meet the growing demand for wireless Internet access by combining orthogonal frequency division multiplexing (OFDM) with CSI. In light of the propagation of wireless signals from a transmitter to a receiver at a specific frequency, CSI can be expressed by channel frequency (CFR), as expressed below:
H f : t = n N a n t e j 2 π f τ n t
where a n t is the amplitude fading factor, τ n t is the propagation delay, and f is the carrier frequency. The expression of wireless channel matrix at a carrier frequency is:
H = H e j H
Both amplitude H and phase H can be easily affected by the transmitter receiver, their surrounding moving objects, and human motion, whereas CSI that is affected by moving objects or human motion can be used for sensing applications with the aid of mathematical modelling or algorithms.

4. Experimental Design
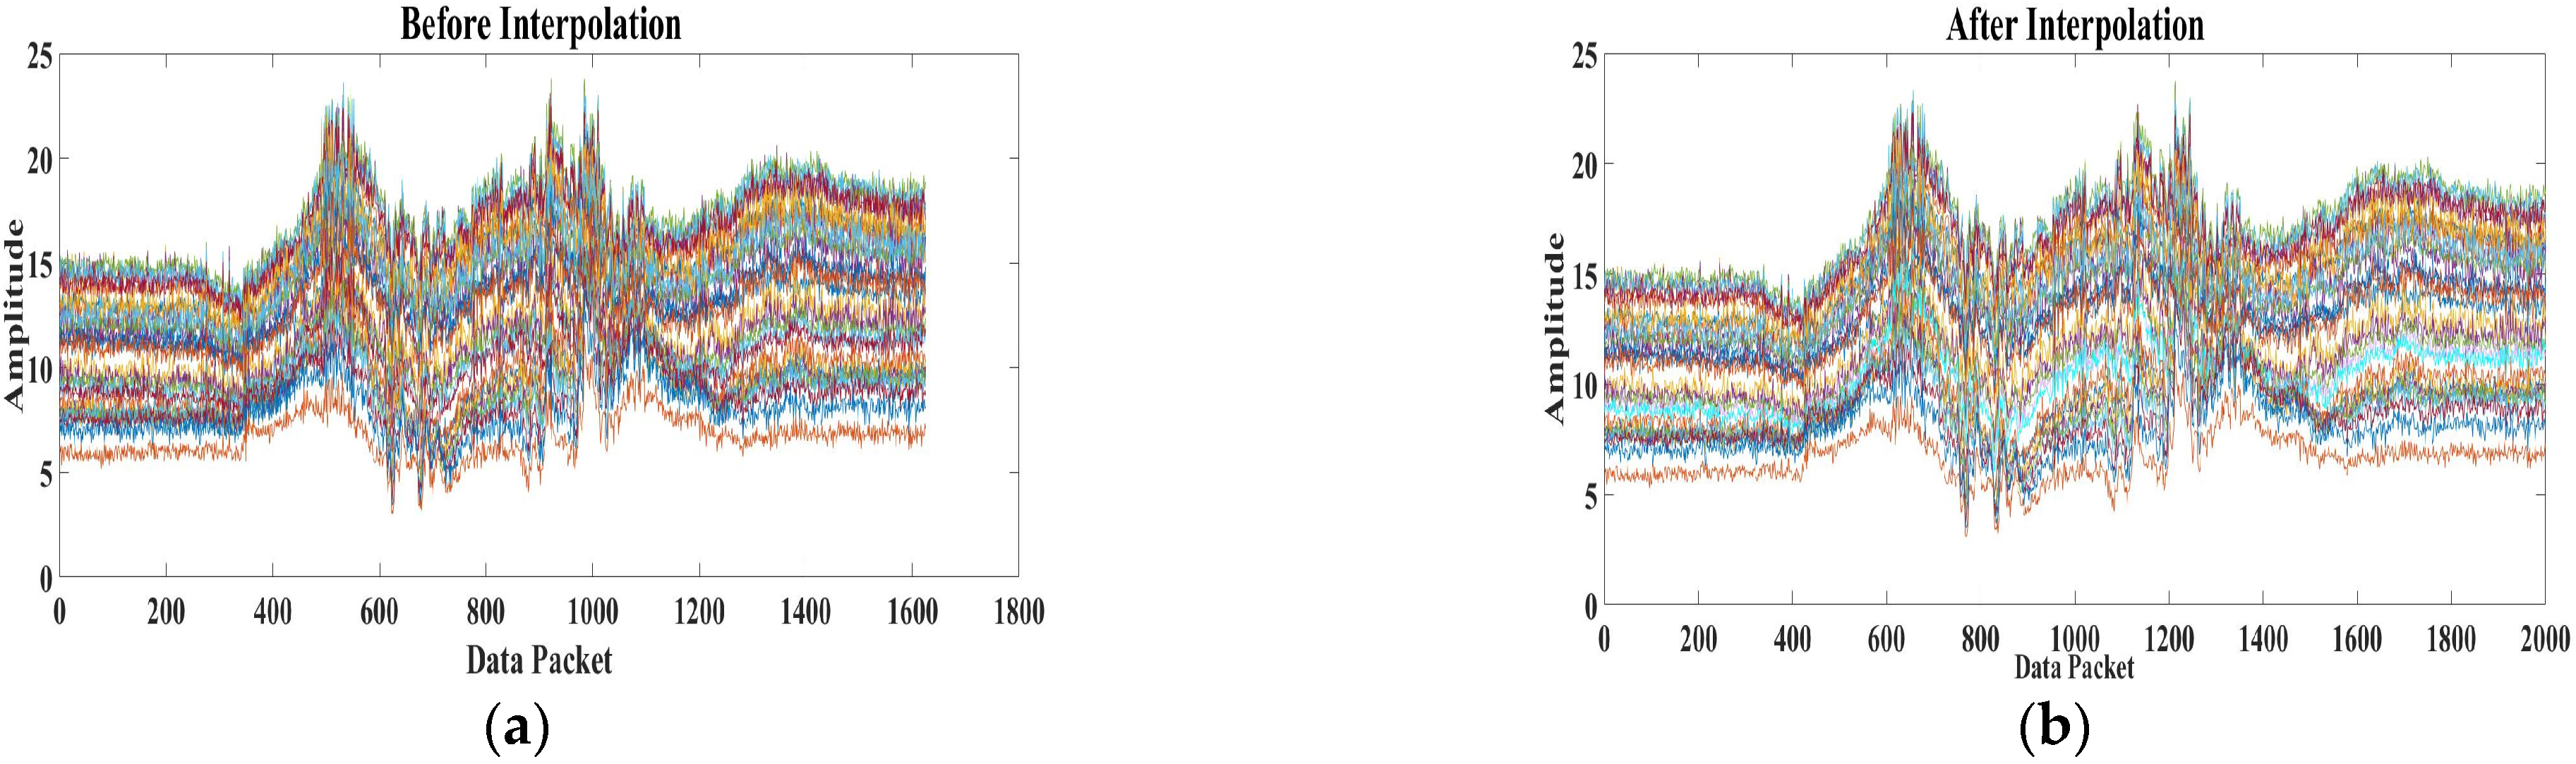
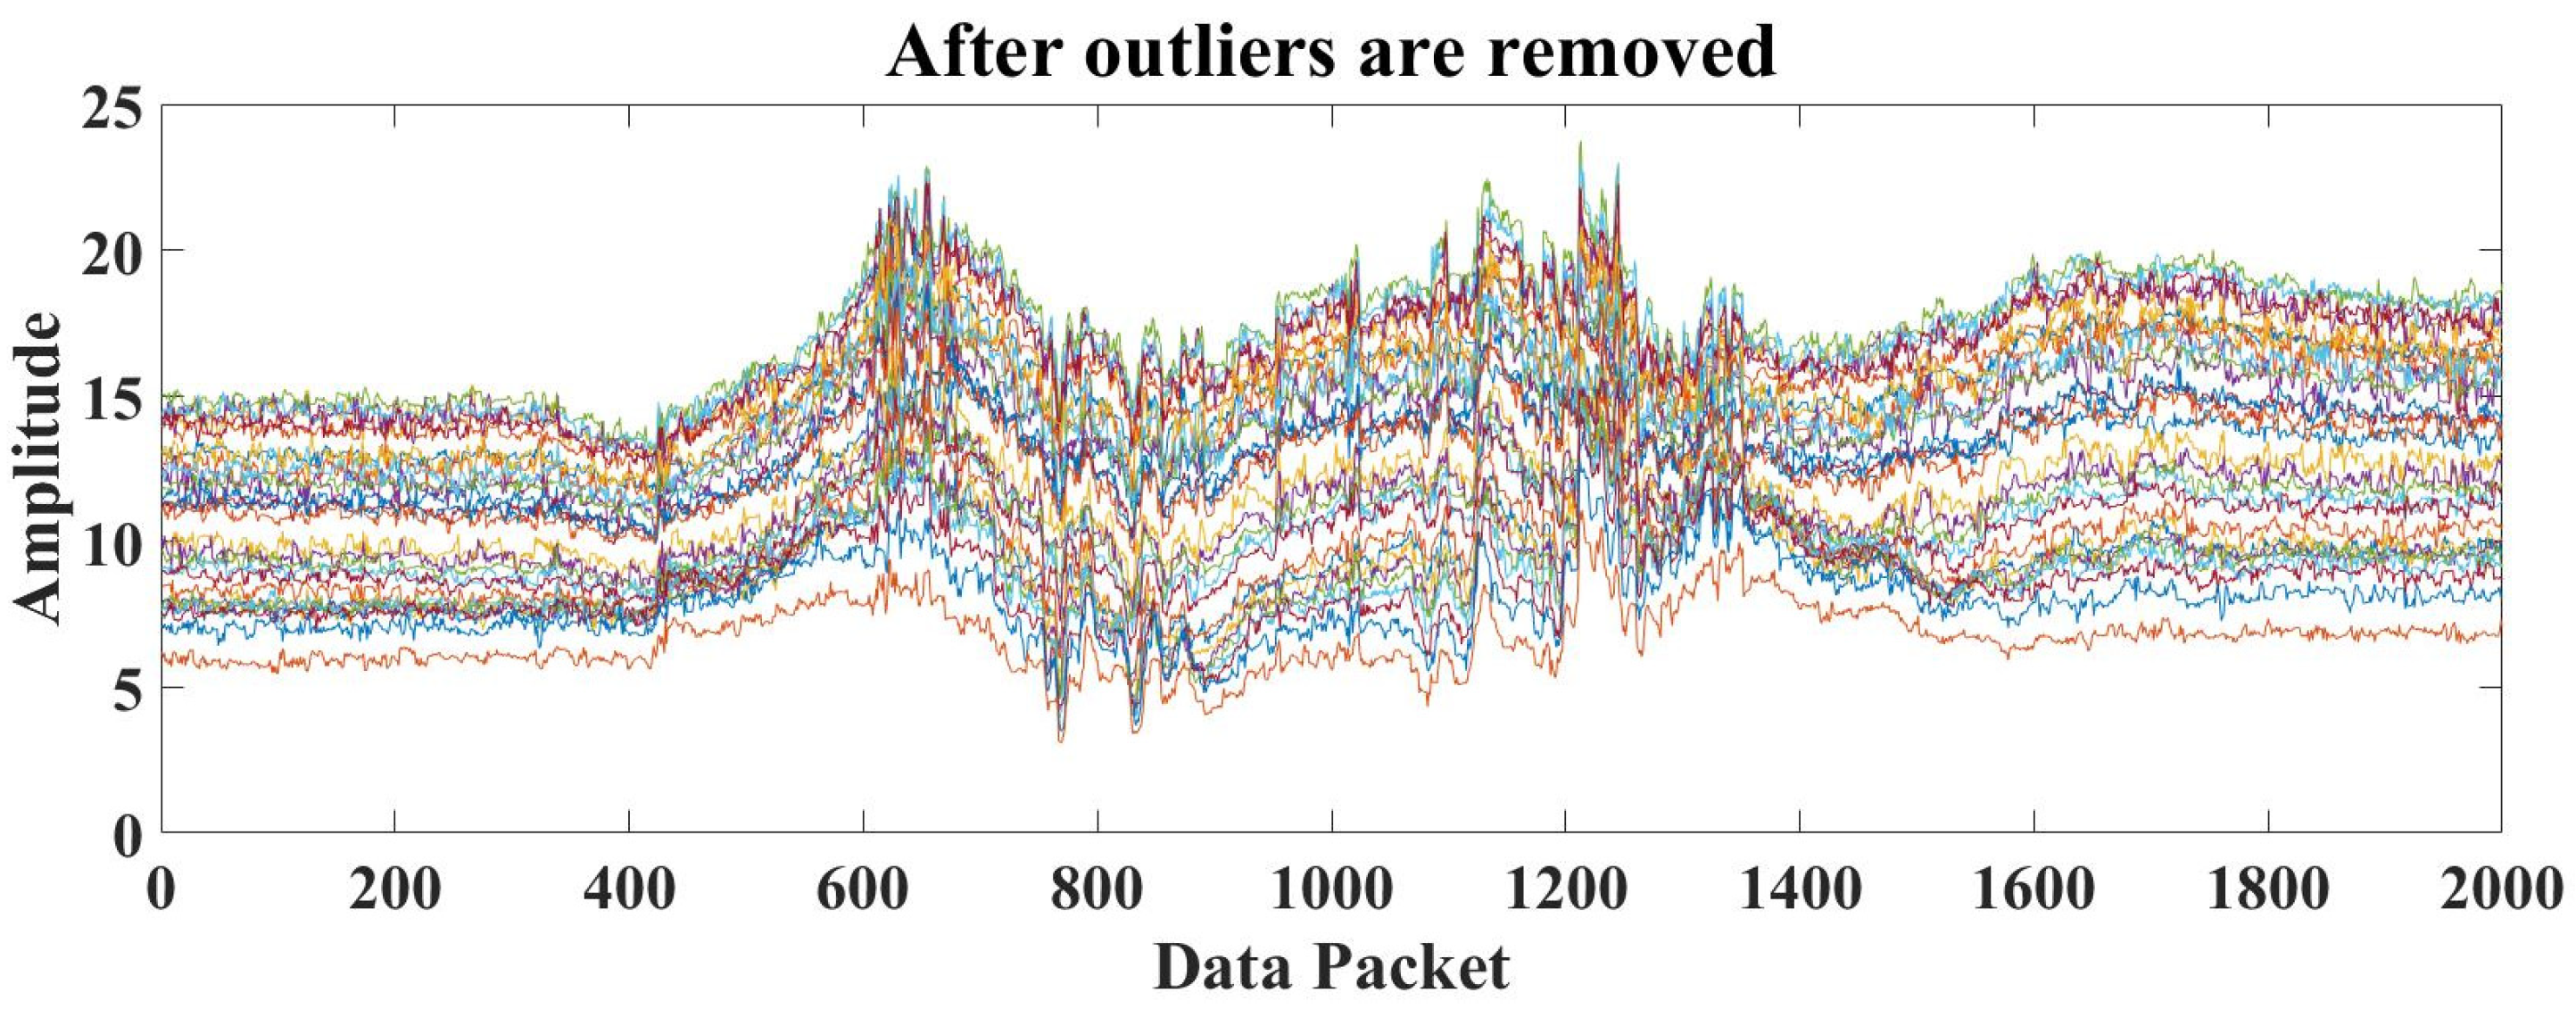
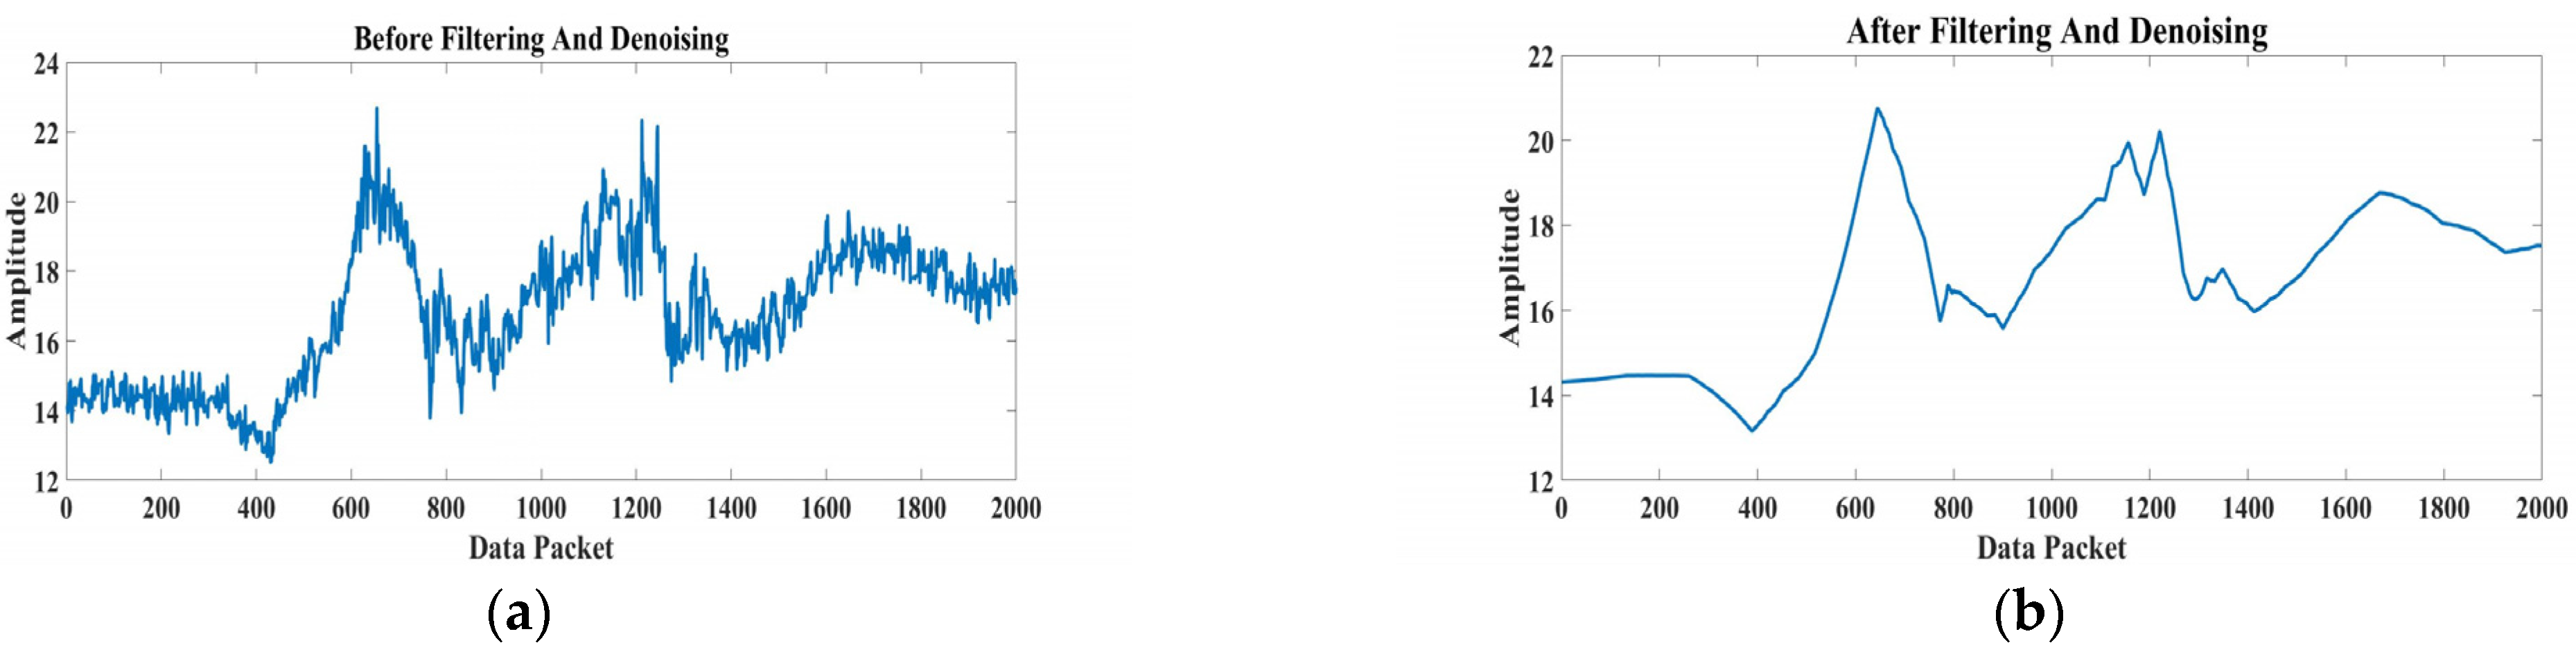
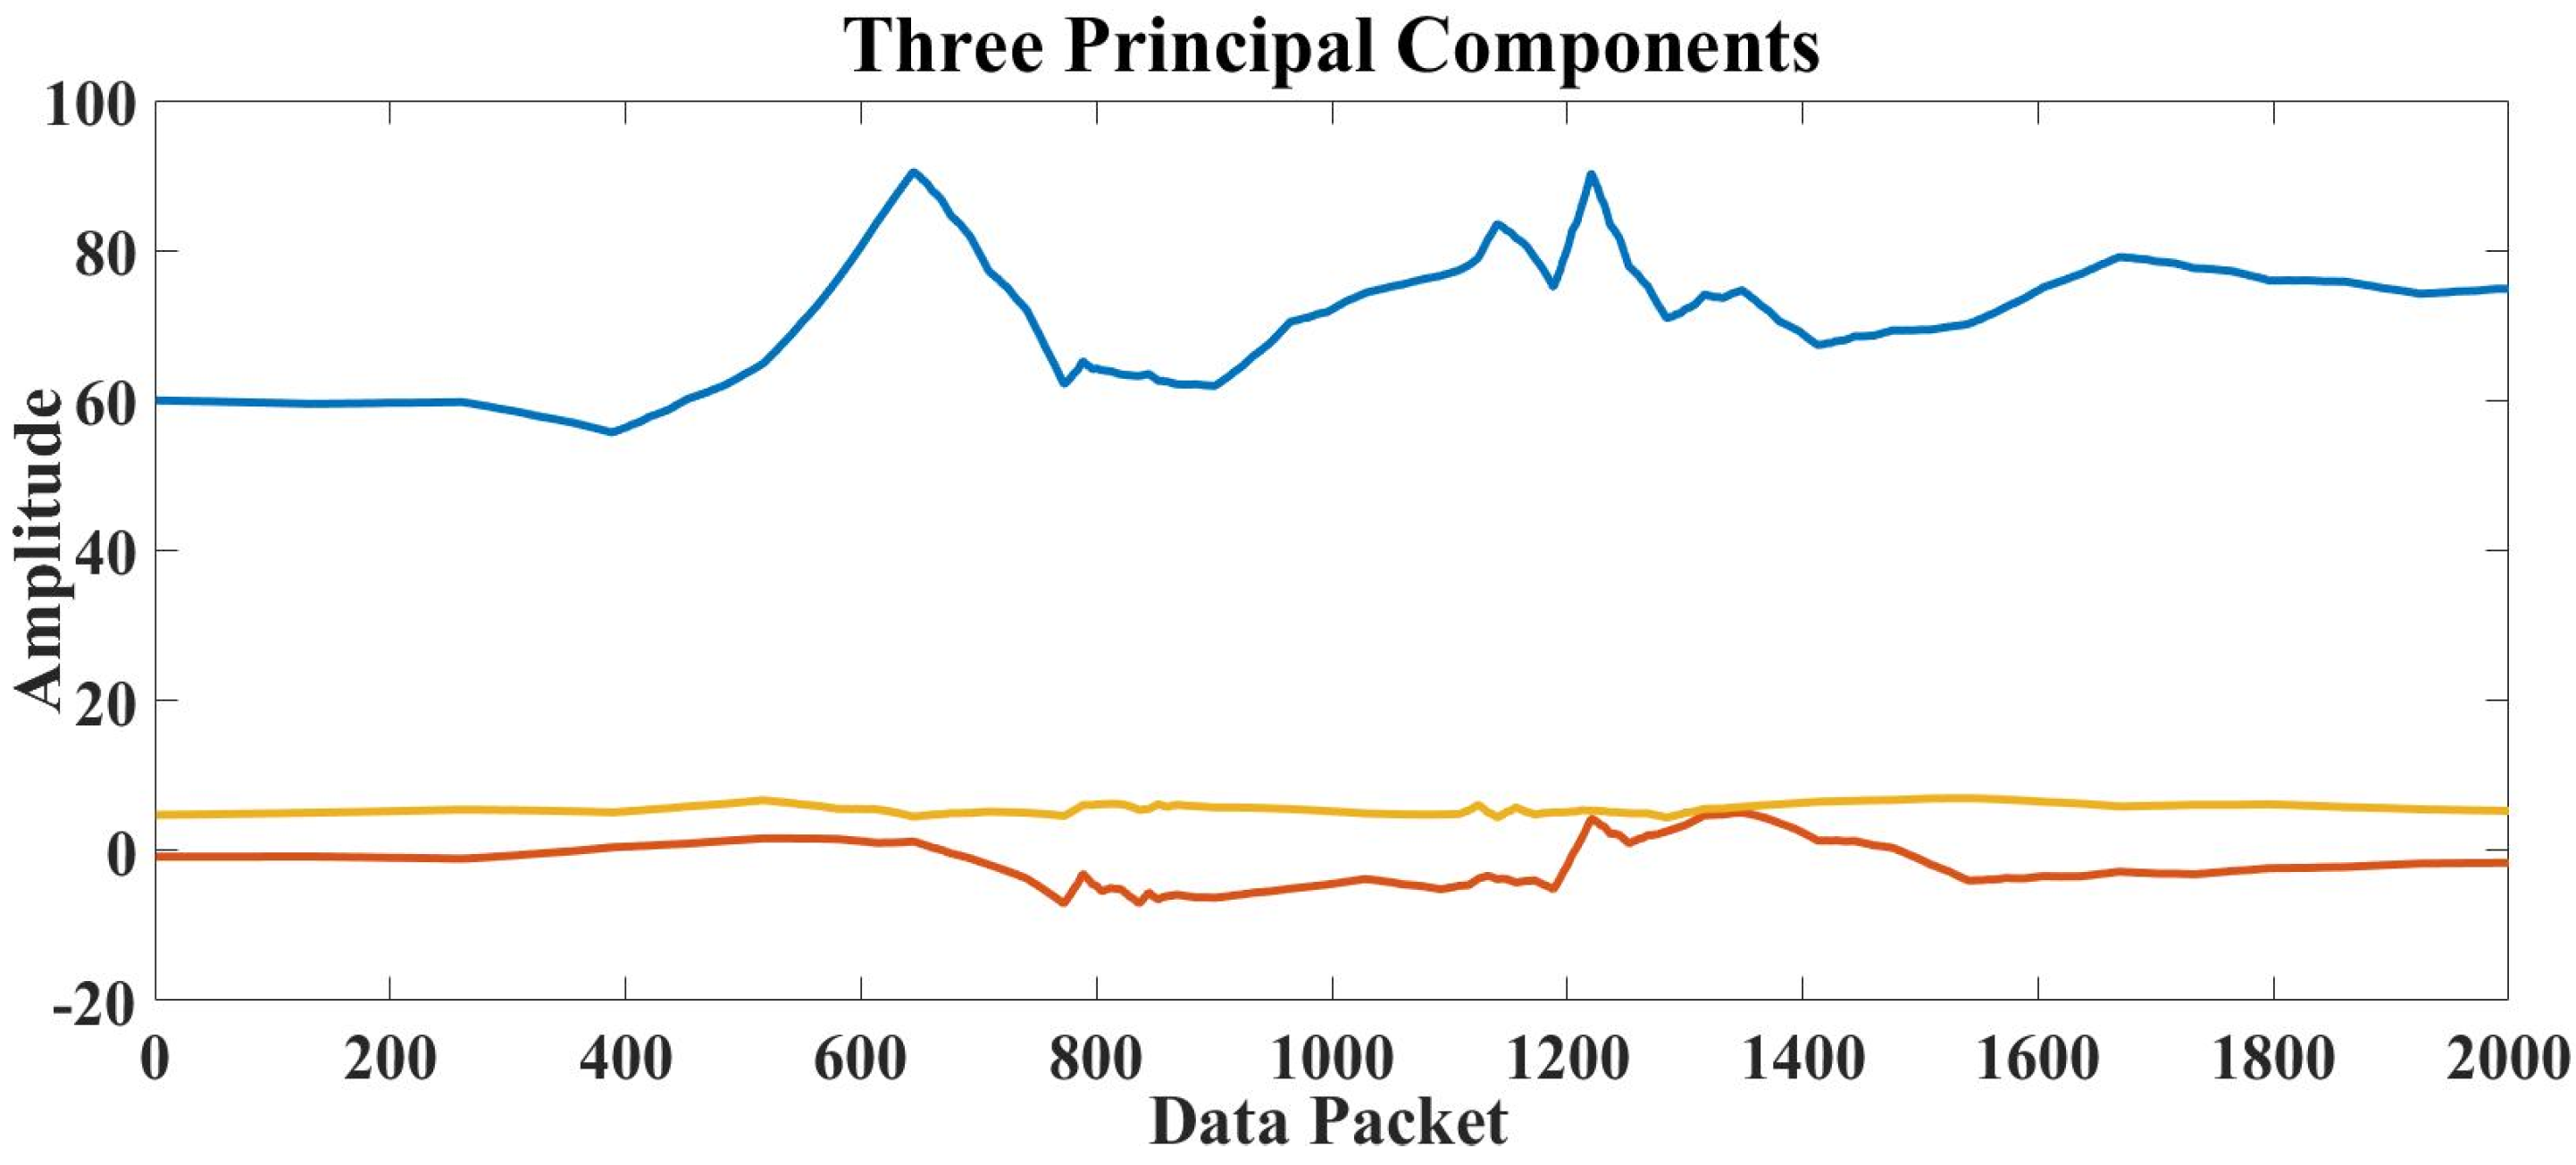
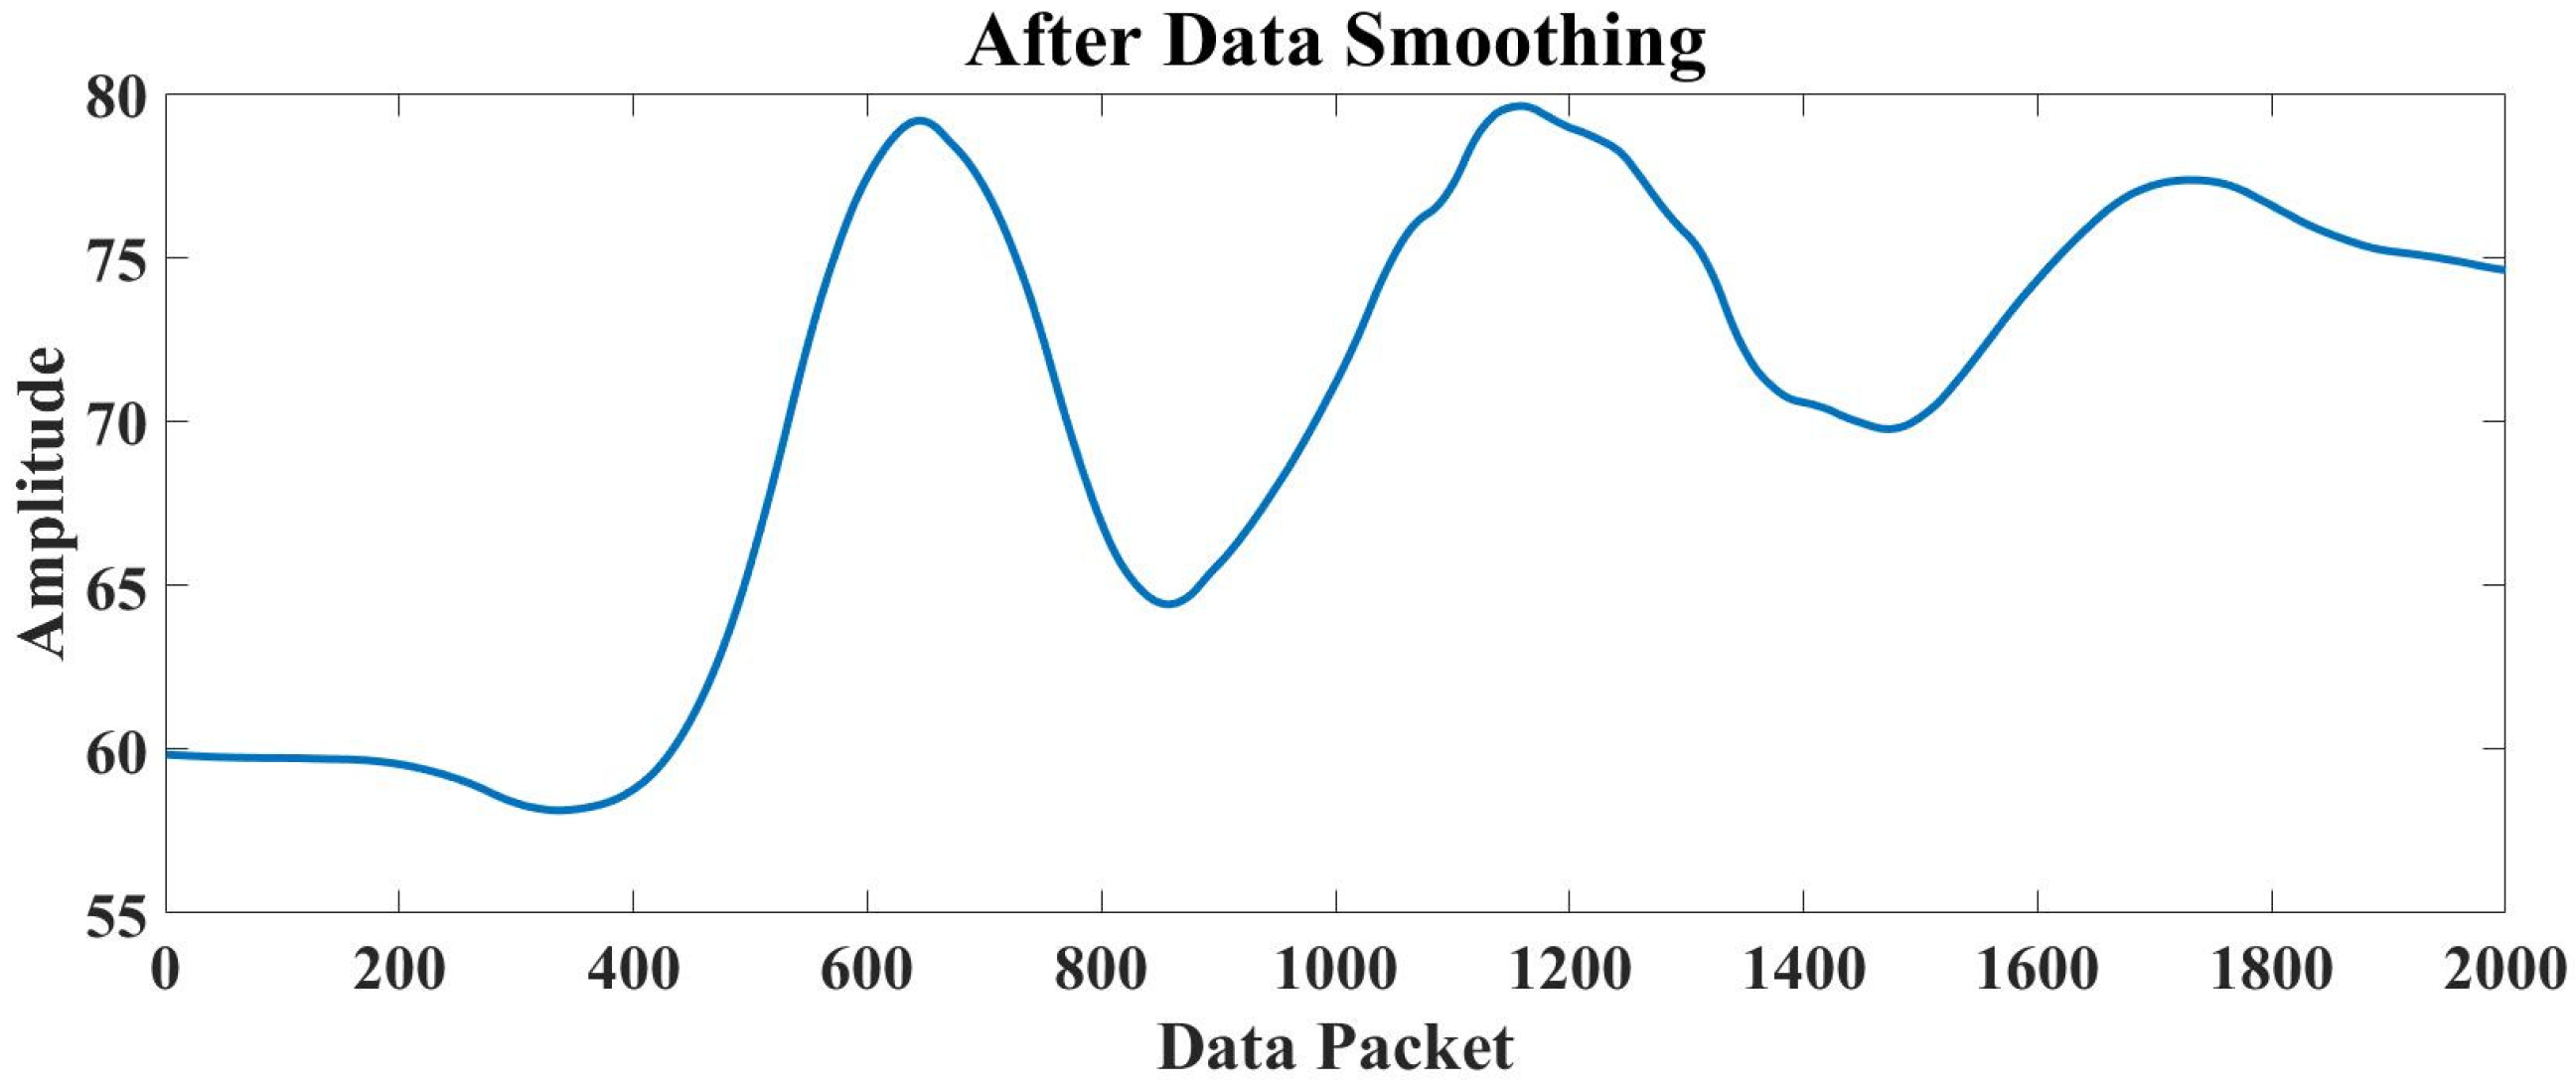
The CSI-based gesture recognition approach proposed in this study is composed of four main parts: data acquisition, data pre-processing, feature extraction, and classification recognition. Figure 1 illustrates the flow of the model based on CSI gesture recognition:

Data Pre-Processing

Antenna pair selection. The dataset used in this study was retrieved from one antenna transmitting wireless signals and three receiving signal antennas. Due to the changes in CSI frequency, the internal environment of the device, and the impact of antenna location; the varied antenna signal sensitivity to the environment can cause each receiving antenna to perform differently in gaining the best antenna data. Thus, the S/N was deployed in this study. Signal-to-noise ratio (S/N) refers to the ratio of signal-to-noise in electronic devices to measure the parameter of audio imbalance in players. Hence, the S/N was used as a parameter indicator to measure different antenna signals. As displayed in Figure 2, the S/N was obtained by processing raw data, whereby the S/N of antenna 2 was higher than the S/N of the other two antennas. Thus, data from antenna 2 were selected for the next processing.
Interpolation. In wireless signal transmission, there are issues related to non-line-of-sight connections indoors and missing packets after the signal is received by the receiver upon going through the wall. To reduce the signal interference issue caused by the above reasons and to obtain CSI data with the same packet length, linear interpolation algorithm was used. Linear interpolation refers to a method that is used to connect the line segments of two known quantities in determining the unknown quantity between the known quantities. The original CSI data served as the input variable, while the interpolated mean value was determined by two known points without affecting the fluctuation of sub-data. Figure 3 present the comparison graphs before and after processing.
Outlier removal. After interpolation, the data obtained seemed to possess a uniform packet length that greatly facilitated in the subsequent processing. However, due to the signal in the transmission process, the reflection of the internal electronics of the device, and the mutual interference between the receiving antennas; some data points with errors were visible to the naked eye. For such interference, the Hampel algorithm was used to remove outliers. For each subcarrier of the input, this study attained the effect of removing outliers by selecting three sample points before and after a sample point, and replacing the sample with the median value if the value of that sample exceeds the median deviation, as shown below.
For sample data x, taking the data on each side of the data with a sliding window length of 2, the median value within the window can be expressed as follows:
x ¯ = m e d i a n   ( x i L , x i L + 1 , x i , x i + L 1 , x i )
The scale of the median absolute deviation is estimated as given below:
y i = 1.4826 × m e d i a n   x i L x ¯ i , , x i + L x ¯ i
The inserted data are expressed as follows:
δ = x i ,                         x i x ¯ i 3 y i x ¯ i ,                   x i x ¯ i > 3 y i
From Equation (5), it can be concluded that if the value in the window exceeds thrice the absolute deviation from the median, it is considered as an outlier and replaced by the median of the window. If it is less than thrice the absolute deviation from the median, it is not considered as an error point at time. Figure 4 displays the results after processing with Hampel algorithm, in which some noise points were removed.
Filtering and denoising. After outlier removal, due to multipath, other objects interference resulted in noise in the CSI time series, which contained a huge amount of high frequency noise. In order to extract the best gesture characteristics, the data were denoised. To enable real-time recognition and classification of the experimenter’s gestures, good time complexity of the denoising algorithm was required. Wavelet transform denoising is fast and suitable for detection systems with high real-time requirements. Since wavelet transform permits adjustment in time-domain resolution, it can be optimized by selecting suitable parameters based on the user’s signal to obtain the best denoising effect. It is also convenient to extract the gesture information afterwards.
The threshold-based wavelet transform denoising model is expressed below:
s n = f n + σ e n
where s n is the data interposed with high frequency noise, f n is the required data after removing high frequency noise, which is the signal to be filtered out in this study, e n is the Gaussian white noise, and σ is the noise intensity. As for threshold selection, this study adopted the wavelet transform based on heuristic thresholding for denoising. Figure 5 illustrates the flow of wavelet denoising.
The noise reduction process was executed using the following three steps:
First, wavelet transform was performed on s n to obtain wavelet transform coefficients ω n . Second, threshold r was selected and combined with the wavelet coefficients obtained after processing, thus making the reconstructed signal smoother by taking a threshold to avoid intermittent points. Third, the scale coefficients were reconstructed to complete the noise removal and obtain the reconstructed signal f n .
  • Wavelet decomposition;
  • The two most commonly used wavelet bases are Daubechies ( d b ) and Symlets ( s y m ) wavelet systems. Although the d b wavelet system has an excellent effect of signal smoothness after denoising, its division in the frequency domain leads to a weaker support in the time domain, thus increasing computation time and worsening real-time performance. Meanwhile, the s y m Wavelets system has better regularity and is comparable to the d b wavelet system in terms of continuity and filter length. Its better symmetry can reduce the phase distortion caused by the decomposition and reconstruction of the signal to a certain extent. Hence, the s y m wavelet was selected in this study to carry out the wavelet decomposition of the signal in three layers. The s y m wavelet function is presented below:
S W ( ω ) = 1 2 k = 0 2 N 1 h k e j k ω
where ω is the wavelet coefficient.
3.
Threshold processing;
4.
The four thresholds are unbiased likelihood estimation, fixed threshold, heuristic threshold, and extreme value threshold. Heuristic threshold is a combination of unbiased and fixed thresholds based on the algorithm of unbiased likelihood estimation. Let m be the sum of squares of wavelet coefficients and n be the number of wavelet coefficients. When m = i = 1 n ω i 2
, let α = m n / n , β = l o g 2 n 1.5 n , and the heuristic threshold is:
T = c ,         α < β ; d ,       α β ;
where c is the unbiased threshold, and d is the fixed threshold.
Figure 6 (below) portrays the comparison of before and after the wavelet denoising.
As can be seen from the comparison above, after the wavelet filter for denoising, the perturbations in the data were successfully processed, and we obtained clearer data on the trend of gesture changes. The next step will be the selection of subcarriers.
Subcarrier selection. After the above pre-processing steps, the data were clear from high-frequency noise and outliers. Since the data had 30 subcarriers, but due to the different sensitivity of each subcarrier to environmental changes, the amplitude of the extracted subcarrier amplitudes differed. In order to facilitate the subsequent feature extraction and improve the real-time of the system model, the number of subcarrier inputs was reduced as much as possible. In order to select the subcarriers with obvious features, the PCA algorithm was deployed to calculate the principal components of each subcarrier and to select the subcarriers with better principal components for the next step.
The PCA refers to a method that recombines the input variables into new variables by using some methods to extract fewer variables from them to reflect as much information changes of the original variables as possible based on the actual needs. The selection is made by comparing the variance of each subcarrier. The larger the variance, the more information the subcarrier contains, and the largest variance is the first principal component. The PCA steps are listed as follows:
  • Find the covariance matrix C of the data.
  • Find the matrix eigenvalues and the corresponding eigenvectors from the covariance matrix.
  • Normalize eigenvectors and eigenvalues.
  • Reduce the dimensionality of the data.
Referring to [21], the principal components contained in the 30 subcarriers were extracted and implanted in the same coordinate system. As noise was removed in the prior step, only the principal component with the best effect on noise reduction was selected.
Figure 7 shows the variation of the principal components of each subcarrier. Notably, the first principal component varied significantly. The best subcarrier was available for extraction in each sample and was selected for subsequent feature extraction.
Data Smoothing. For sample data x, each side of the data was taken with a sliding window length of 2, and the median value within the window is expressed as follows:
After selecting the best subcarrier by using the PCA method, due to the sensitivity of CSI to environmental changes and despite the removal of high-frequency noise via wavelet transform, some noise was still present due to the perturbation of the data caused by the environment during data transmission. To remove this subtle noise interference and to make the subsequent classifier learning more accurate, data smoothing was performed by dividing it into moving average and exponential smoothing algorithms. The moving average smoothing algorithm collects observations and calculates the mean value of the set of observations, whereby the mean value is used as the next prediction value. Before calculating the moving average smoothing algorithm, the actual number of past observations must be determined, and each time a new observation appears, the earliest observation is subtracted and the moving average is calculated. The new moving average is used as the forecast value for the next period. Let the time series be y 1 , y 2 y t . The formula of moving average algorithm is presented below:
F t 1 = y t + y t 1 + + y t n 1 n
where n is the moving interval and F t 1 is the moving average at t interval. The moving average method has the advantage of being less computational and better reflects both the trend and the change of amplitude information.
The essence of the exponential-based data smoothing algorithm is the weighted moving average method, which differs from the moving average data smoothing algorithm, as the former algorithm assigns different weights to different observations using the formula below:
S t 1 = μ y t + 1 μ S t 1 1
where S t is the predicted value at moment t, and μ is the smoothing factor.
Although the implementation of exponential-based data smoothing algorithm is relatively simple, it needs to find the best value. To achieve this, it must be calculated repeatedly via experiments. After weighing in the pros and cons of the two algorithms, the moving average smoothing algorithm was selected for this study. The results are presented below (Figure 8).

5. Experimental Design

5.1. Feature Extraction

Features are the embodiment of certain salient properties in a dataset that function as the key to distinguish data information, while feature extraction is the selection of representative features in the dataset. In the pre-processed wireless sensing data, the noise signal was processed, and the rest of the information containing features that reflected human action on the signal perturbation was extracted from the pre-processed data. To train the classifier, the extracted features were used to distinguish the data action belonging to the category. In Wi-Fi action recognition, the common feature extraction methods include statistical features, Doppler shift features, wavelet transform features, and time-frequency map-based features. Time-domain-based feature extraction was deployed in this study. The common time-domain features are listed in Table 1 (below):
where s i is the sampled data point amplitude of the signal, while N is the number of sampled data points per sample.

5.2. Feature Selection

Although features can reflect the category of human activities, different feature methods extract different feature roles. In addition, redundancy may result between individual features and feature values. For example, redundancy could occur between maximum and extreme values, but it is not necessary for both to exist concurrently. Although feature selection can reduce feature redundancy and the number of representative feature values selected can be reduced a lot, the effect will be improved substantially when integrated with the classifier. As a result, the robustness of the system model can be enhanced, and the time complexity of the model can be lowered.
One of the principles of feature selection is the dispersion of features. If a feature has similar effect as other features, it means that the feature is redundant and can be discarded. The idea of feature selection is that by inputting features into the model, different predicted classification effects are recorded. If the accuracy of the classification enhances, then the features are retained, but discarded if otherwise.
This section presents maximum and minimum values, skewness, root mean square, standard deviation, and peak values that served as input features of the classifier. After feature selection, the weighted K-nearest neighbor algorithm (weighted KNN) was selected as the classifier for feature identification in this study.

5.3. Identification and Classification

After extracting the feature sets for each action and building a feature database, the gathered perceptual signals were analyzed and identified. For the classification recognition of actions, the main classifiers were classified into machine and deep learning algorithms. The weighted KNN classifier was used for action classification and recognition in this study.

5.3.1. KNN Algorithm Basic Principle

The KNN refers to a basic machine learning algorithm that is vastly applied due to its simplicity, ease of understanding, ease of implementation, and the property that excellent recognition accuracy can be generated with a small dataset.
The KNN classification statistically classifies test samples based on multiple classes in the feature space, which is intuitive and disregards a priori statistics. In KNN algorithm, the similarity measure between two feature variables is usually determined using Euclidean distance. The following figure presents the formula of Euclidean distance:
d x i , x j   = r = 1 n a r x i a r x j 2
where a r is the rth feature vector, and x is the test data.
The rationale can be summarized based on the following points:
  • Obtain K sample data from the training set at the closest distance from the band prediction sample.
  • If the input category is continuous, then the test sample output is the average. The opposite output is the category with the highest number of nearest neighbors. The distance between two examples is usually tested using Euclidean distance. Shorter distance denotes higher similarity.
  • The difficulty in predicting the target attribute value of the current sample to be predicted based on the obtained K samples is that it is difficult to find a suitable K value.
Although KNN algorithm is the simplest and the most effective classification algorithm, in practice, KNN is poor at classifying randomly distributed datasets to improve the classification of unbalanced samples.

5.3.2. Weighted KNN

In the feature selection section, six-dimensional feature data were selected as input for the classifier. To improve the classification task, a weight parameter was used to each dimension of the data to make it more effective. As the feature data were discrete, the data were weighted with the inverse of the nearest neighbor square, as follows:
w i = 1 d x q , x i 2
After assigning weights to each feature, the k data were differentiated with weights such that the probability that the predicted outcome is the same as the i-th data label:
P i = W i n = 1 k W i
The above idea takes distance weighting on the basis of the original KNN.

6. Experimental Results

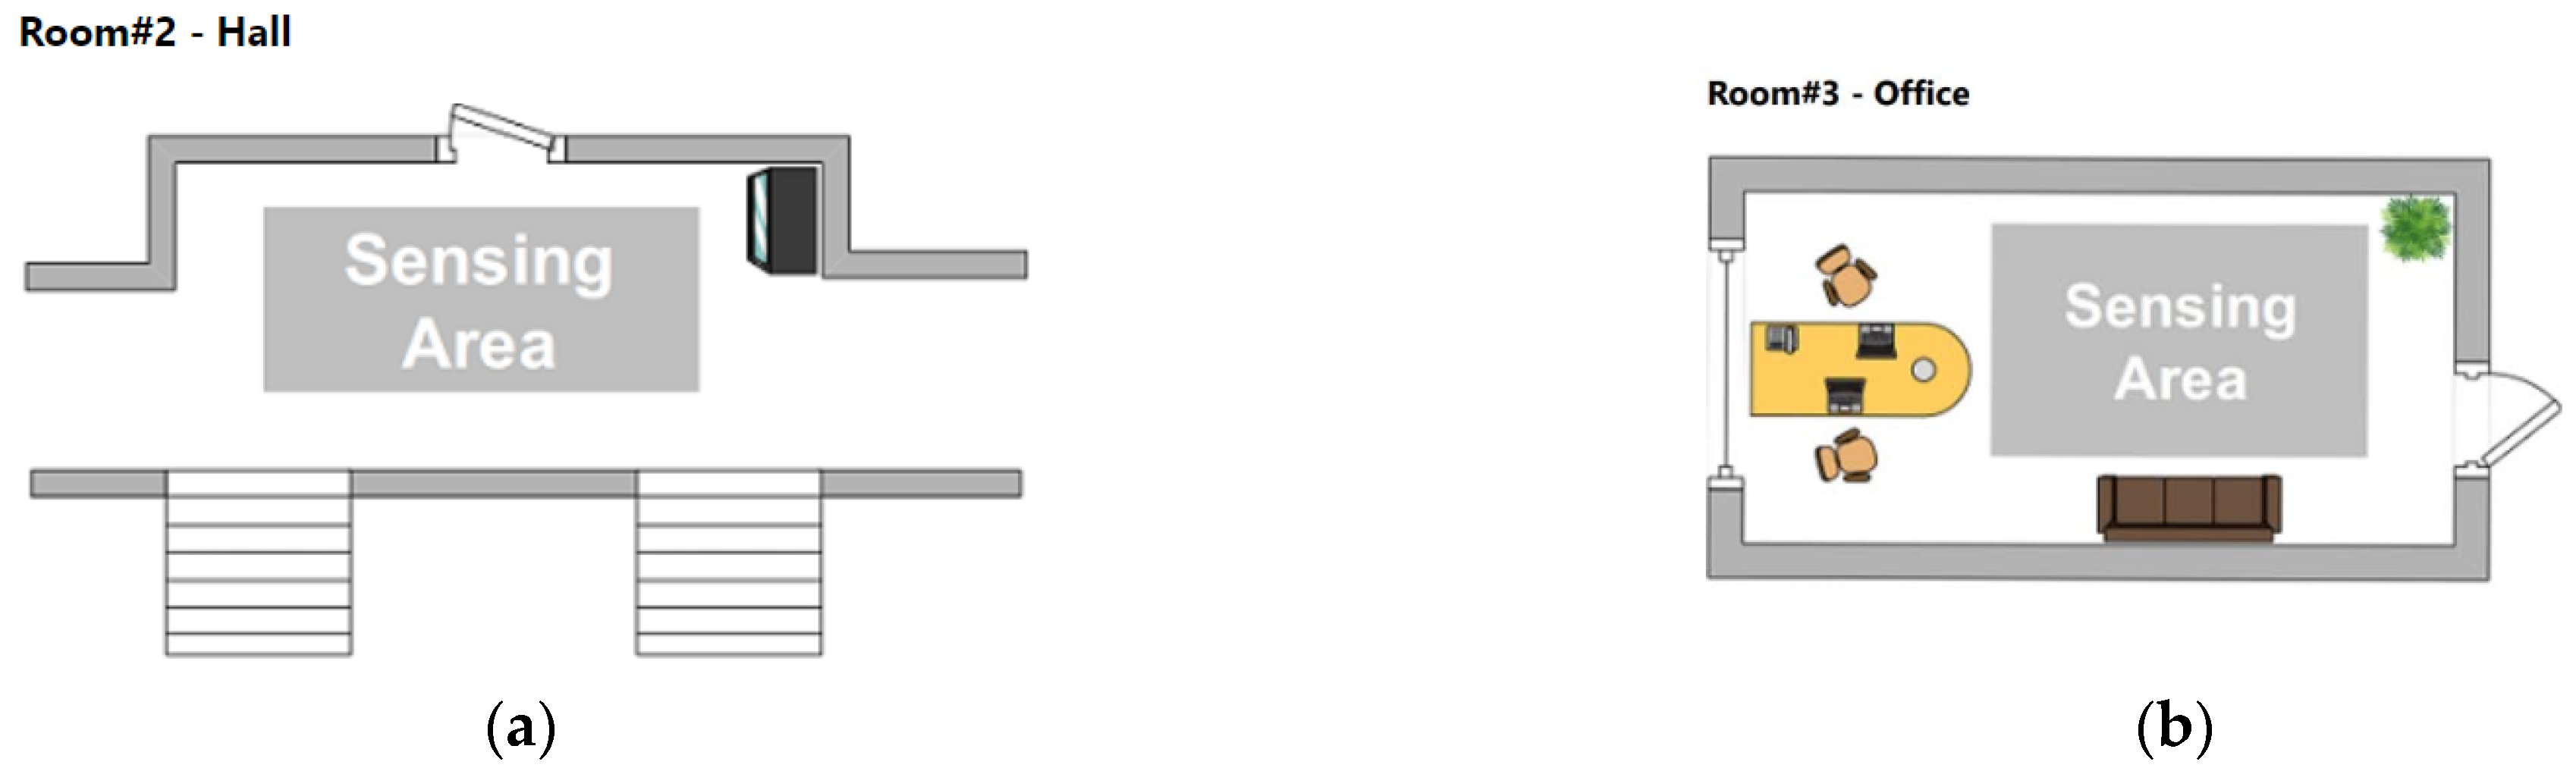
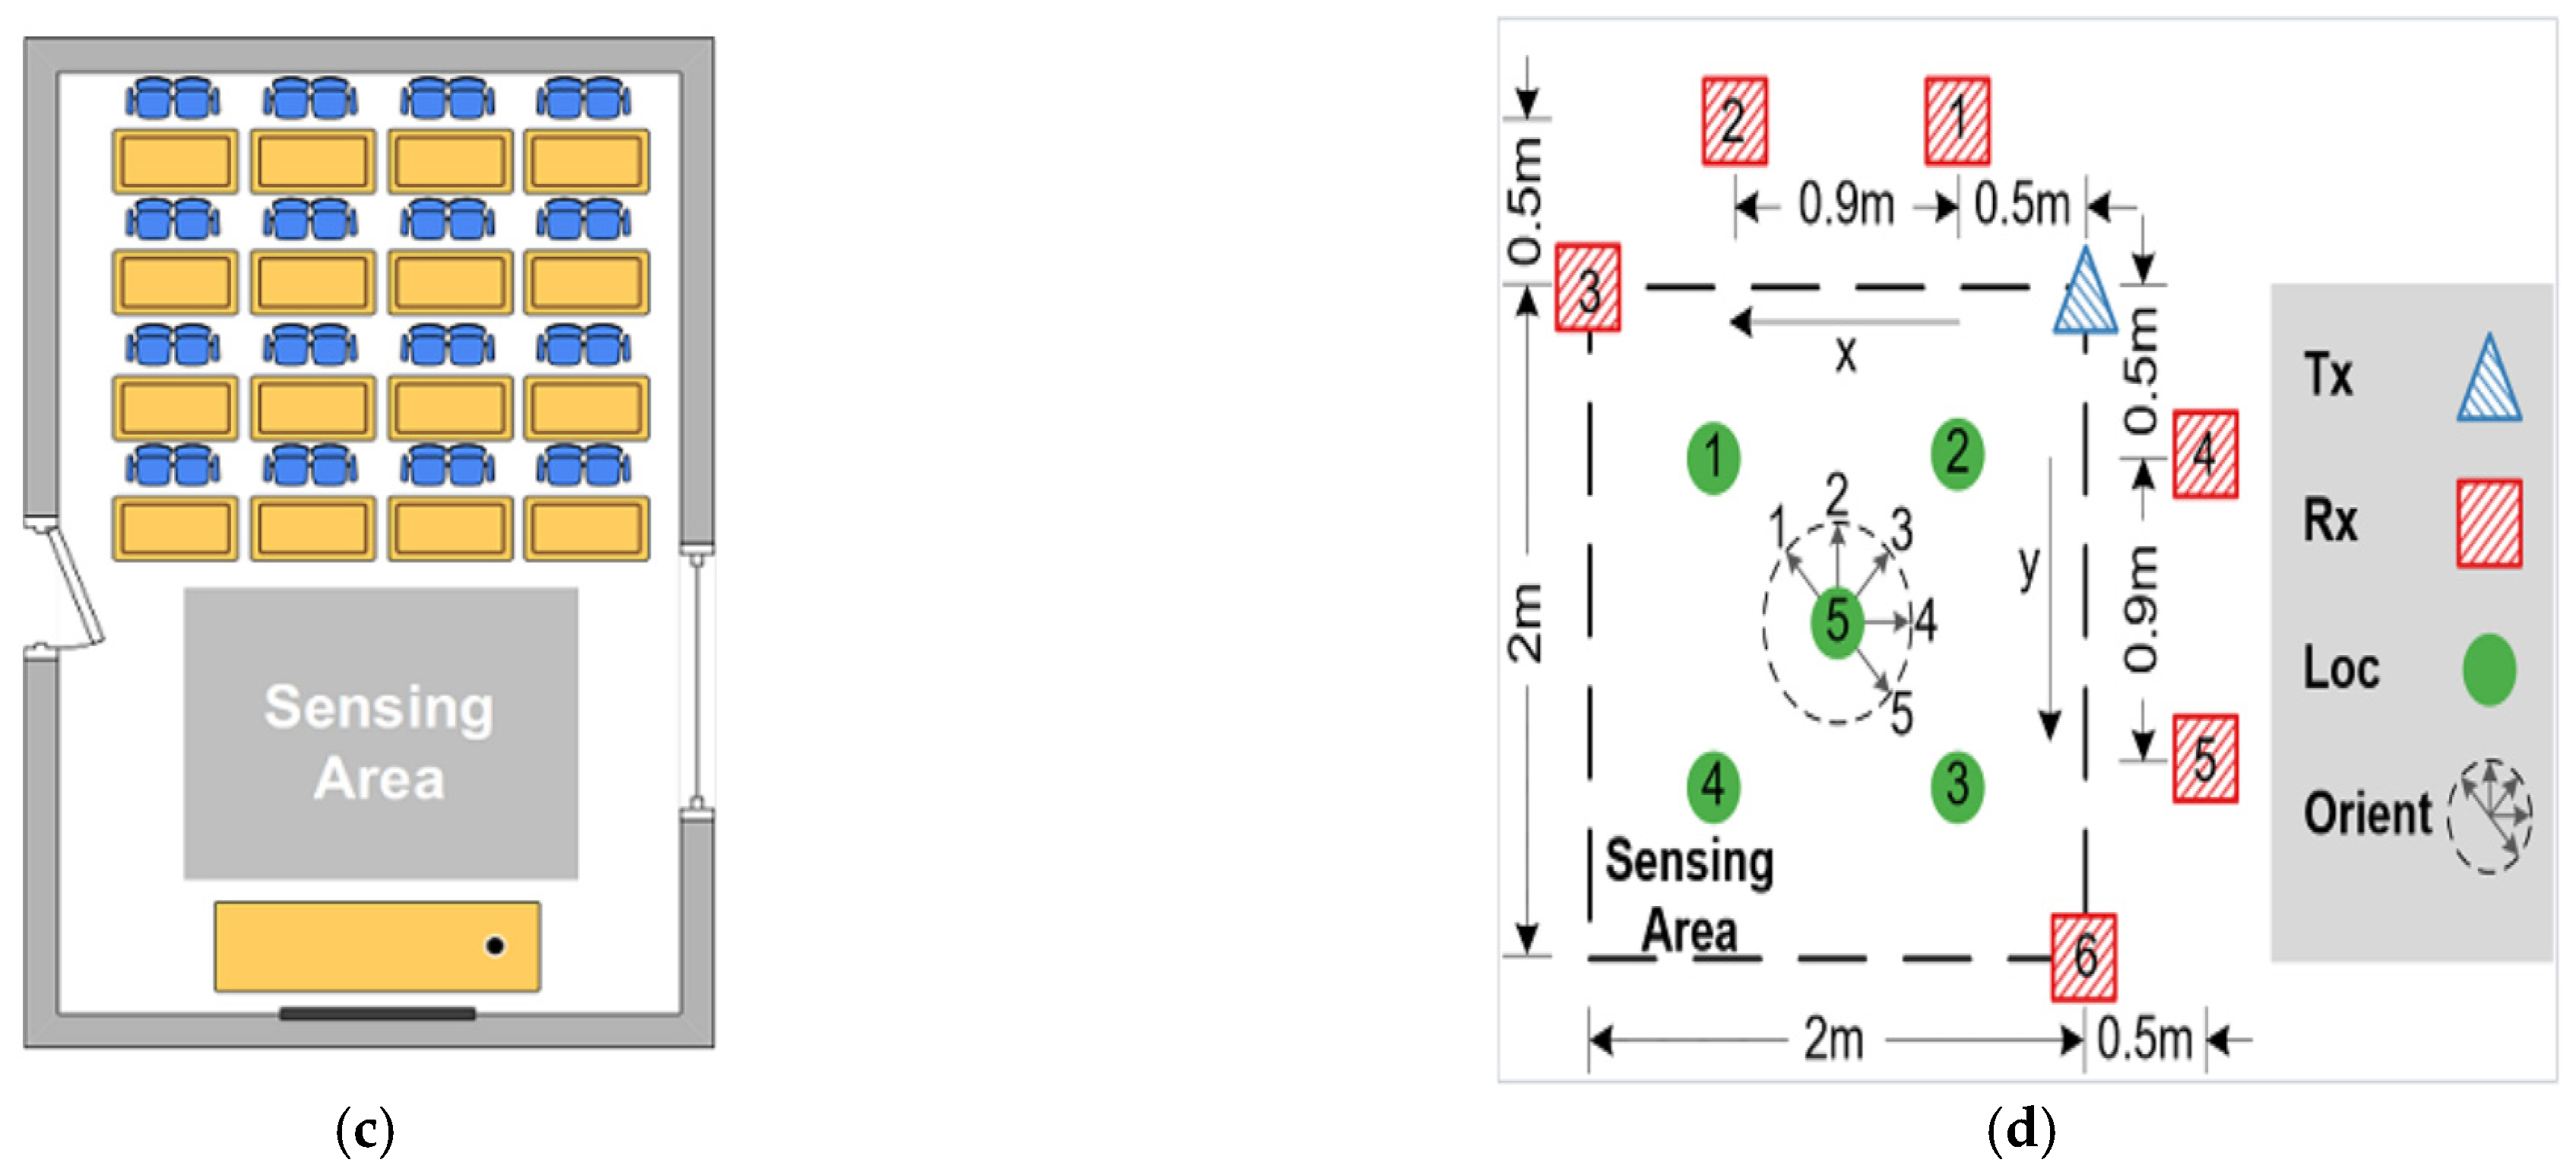
6.1. Experimental Environment

In this study, the Tsinghua University gesture public dataset [12] was applied, which was sent and received by two laptops, each equipped with an Intel 5300 wireless network card and a Linux CSI tool installed at the receiver side. Before sending and receiving the data, they were tuned to 5.825 GHz band because there is less channel interference in this band. The transmitter was broadcasted at a rate of 1000 packets per second. Three experimental locations were selected: classroom, hall, and office. The size of the classroom was 4.5 m × 5.5 m, the office was 2.5 m × 4.0 m, and the hall was 4.5 m × 2.5 m. Based on the specific environment portrayed in Figure 9 (below), data were collected in five directions. However, no distinction was made between the directions to improve the robustness of this experiment. When the data were collected, the equipment was set 110 cm from the ground, and 16 experimenters (12 males and 4 females) had participated in the experiment (height: 155–185 cm; weight: 44–89 kg; and age: 22–28 years old). Data obtained from six users were selected for the experiment. Data pre-processing, feature recognition, and action classification were performed by using MATLAB.
In this experiment, the representative gestures in the dataset were selected for classification and recognition, which are push, draw triangle, draw N, draw O, clap, sweep, etc. The specific actions are illustrated in Figure 10. The data of five people in three different experimental environments were selected for recognition verification.

6.2. Experimental Equipment

The transmitting and receiving devices were a laptop computer with an Intel 5300 wireless network card and a commercial Wi-Fi device. The commercial Wi-Fi device was used as the transmitter, and the laptop computer functioned as the receiver.
MATLAB was used to pre-process the dataset, feature extraction, and classification recognition of actions.
To demonstrate that the method proposed in this study can effectively achieve gesture recognition, the obtained feature sets were randomly arranged. Next, a 10-fold crossover was taken for validation; i.e., a subset was selected as the test set each time, and the average crossover validation recognition correct rate of 10 times was taken as the result. In this method, all samples were used as training and test sets. Each sample was verified once. The experimental results are presented in Figure 11 (below).
The average recognition rate for push, swipe, draw triangle, draw N, draw O, and clap was 93.1% (each gesture scored 94.7%, 95.5%, 93.1%, 94.1%, 88.4%, and 92.3%, respectively).

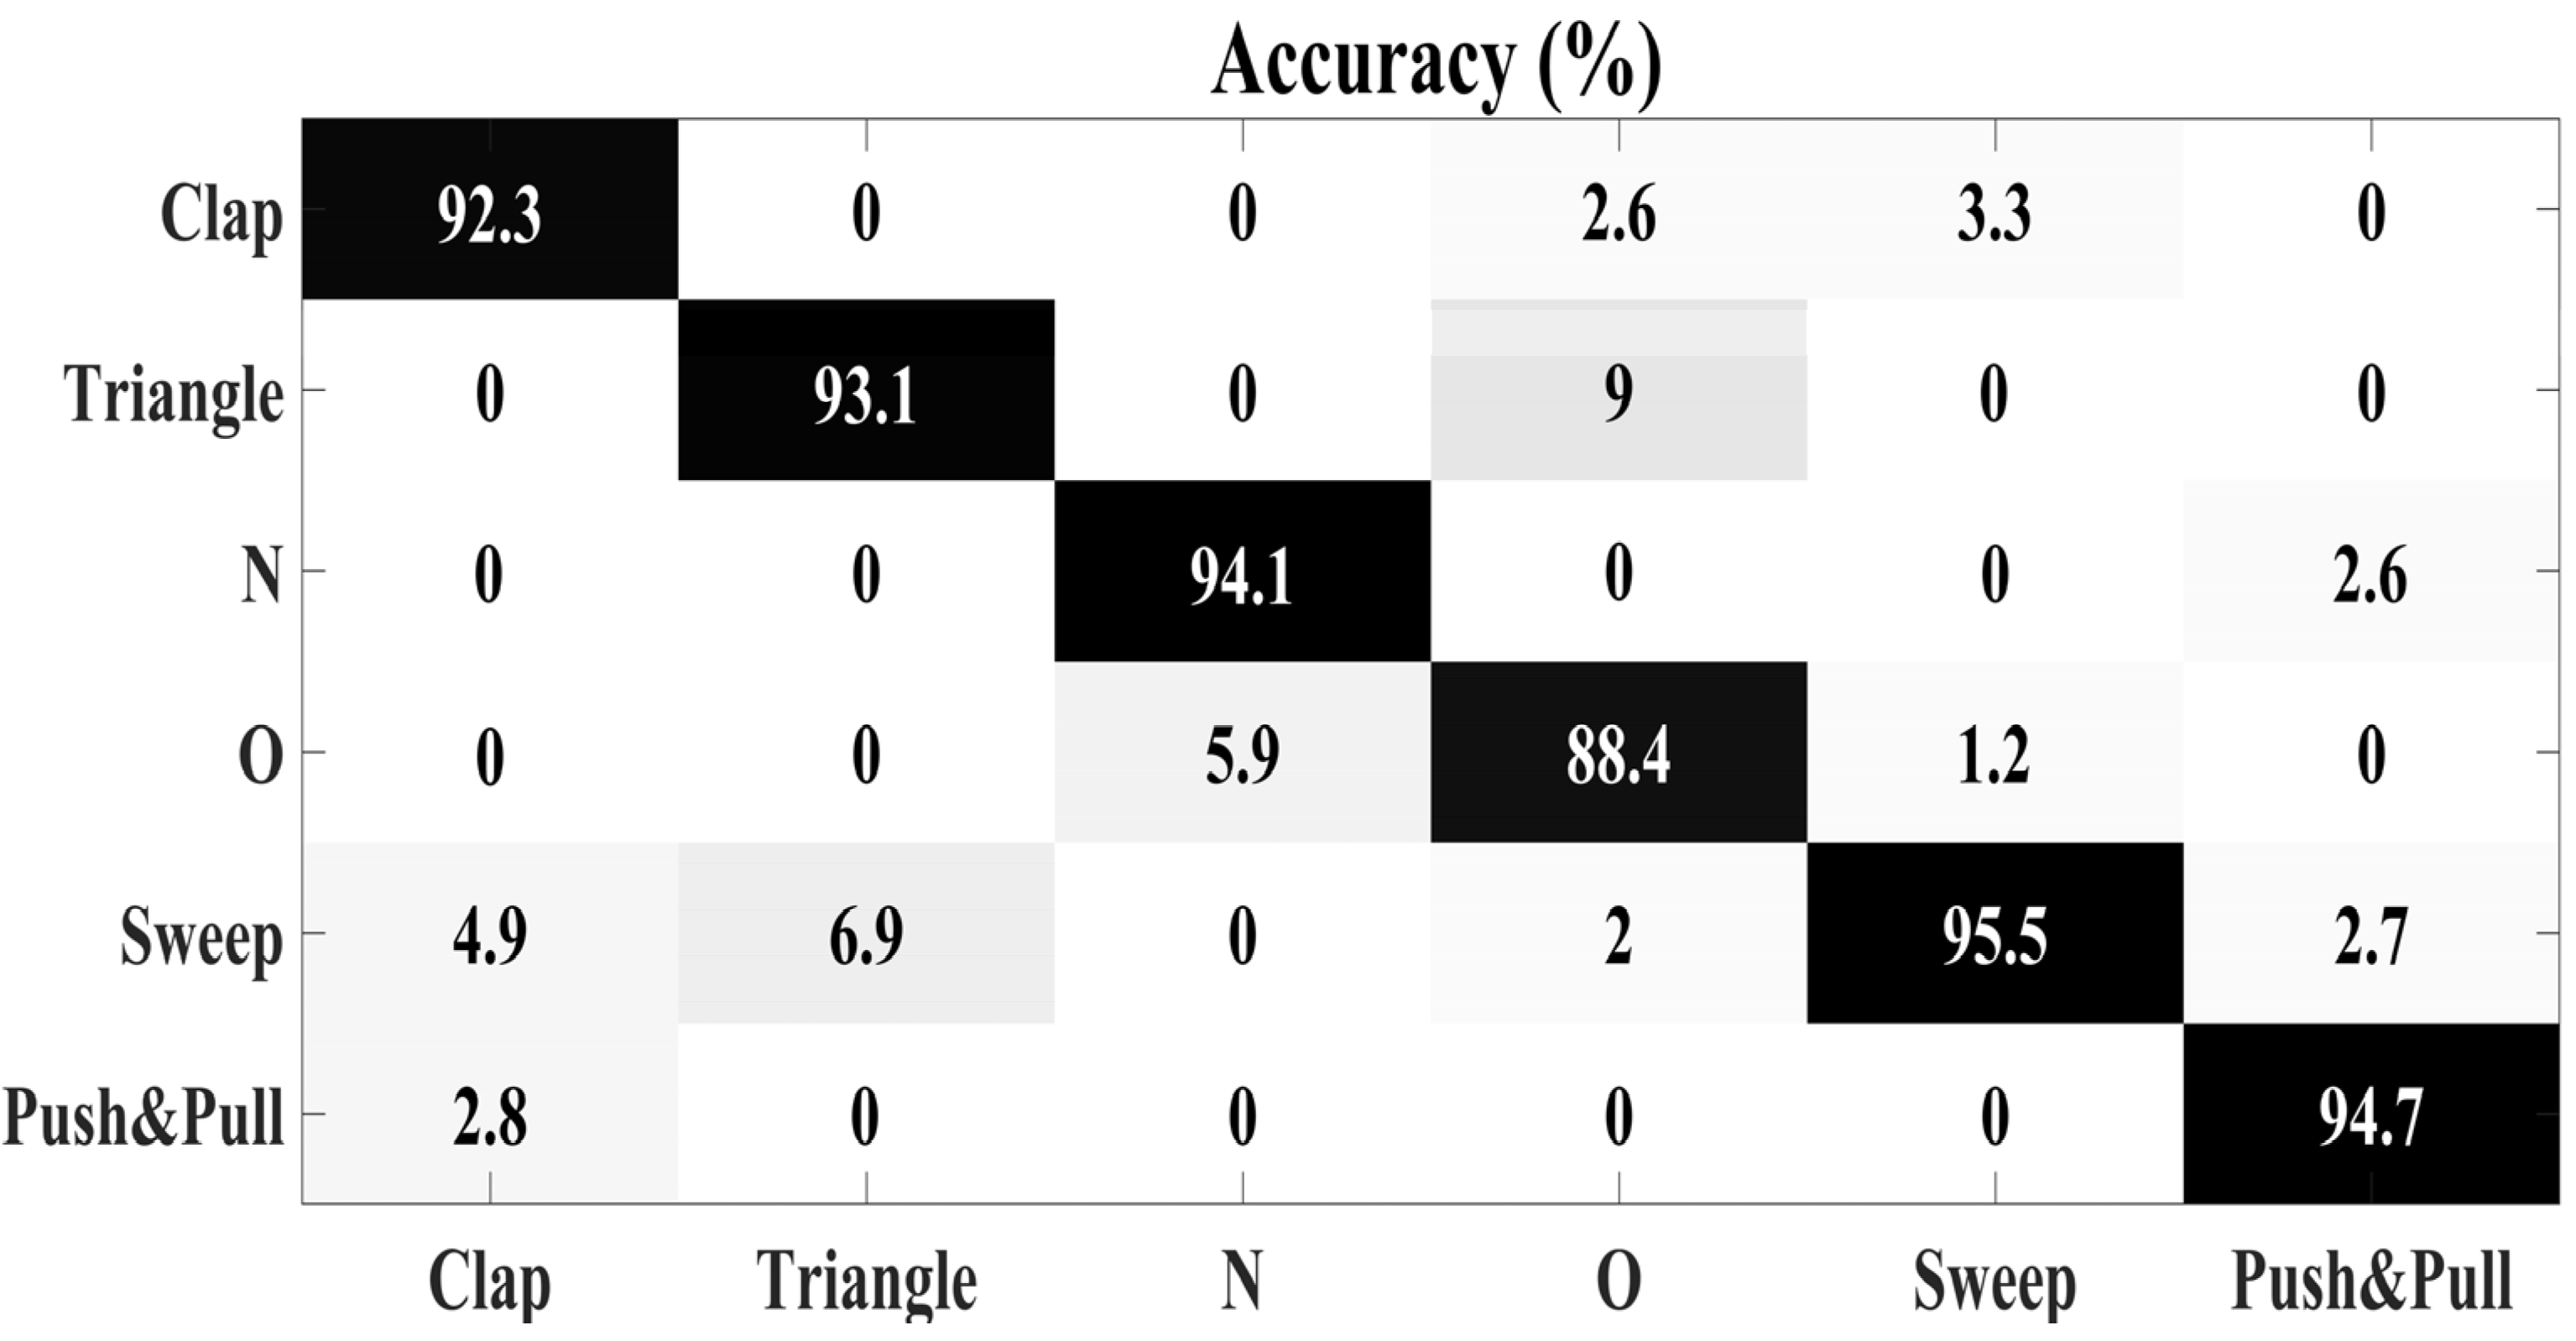
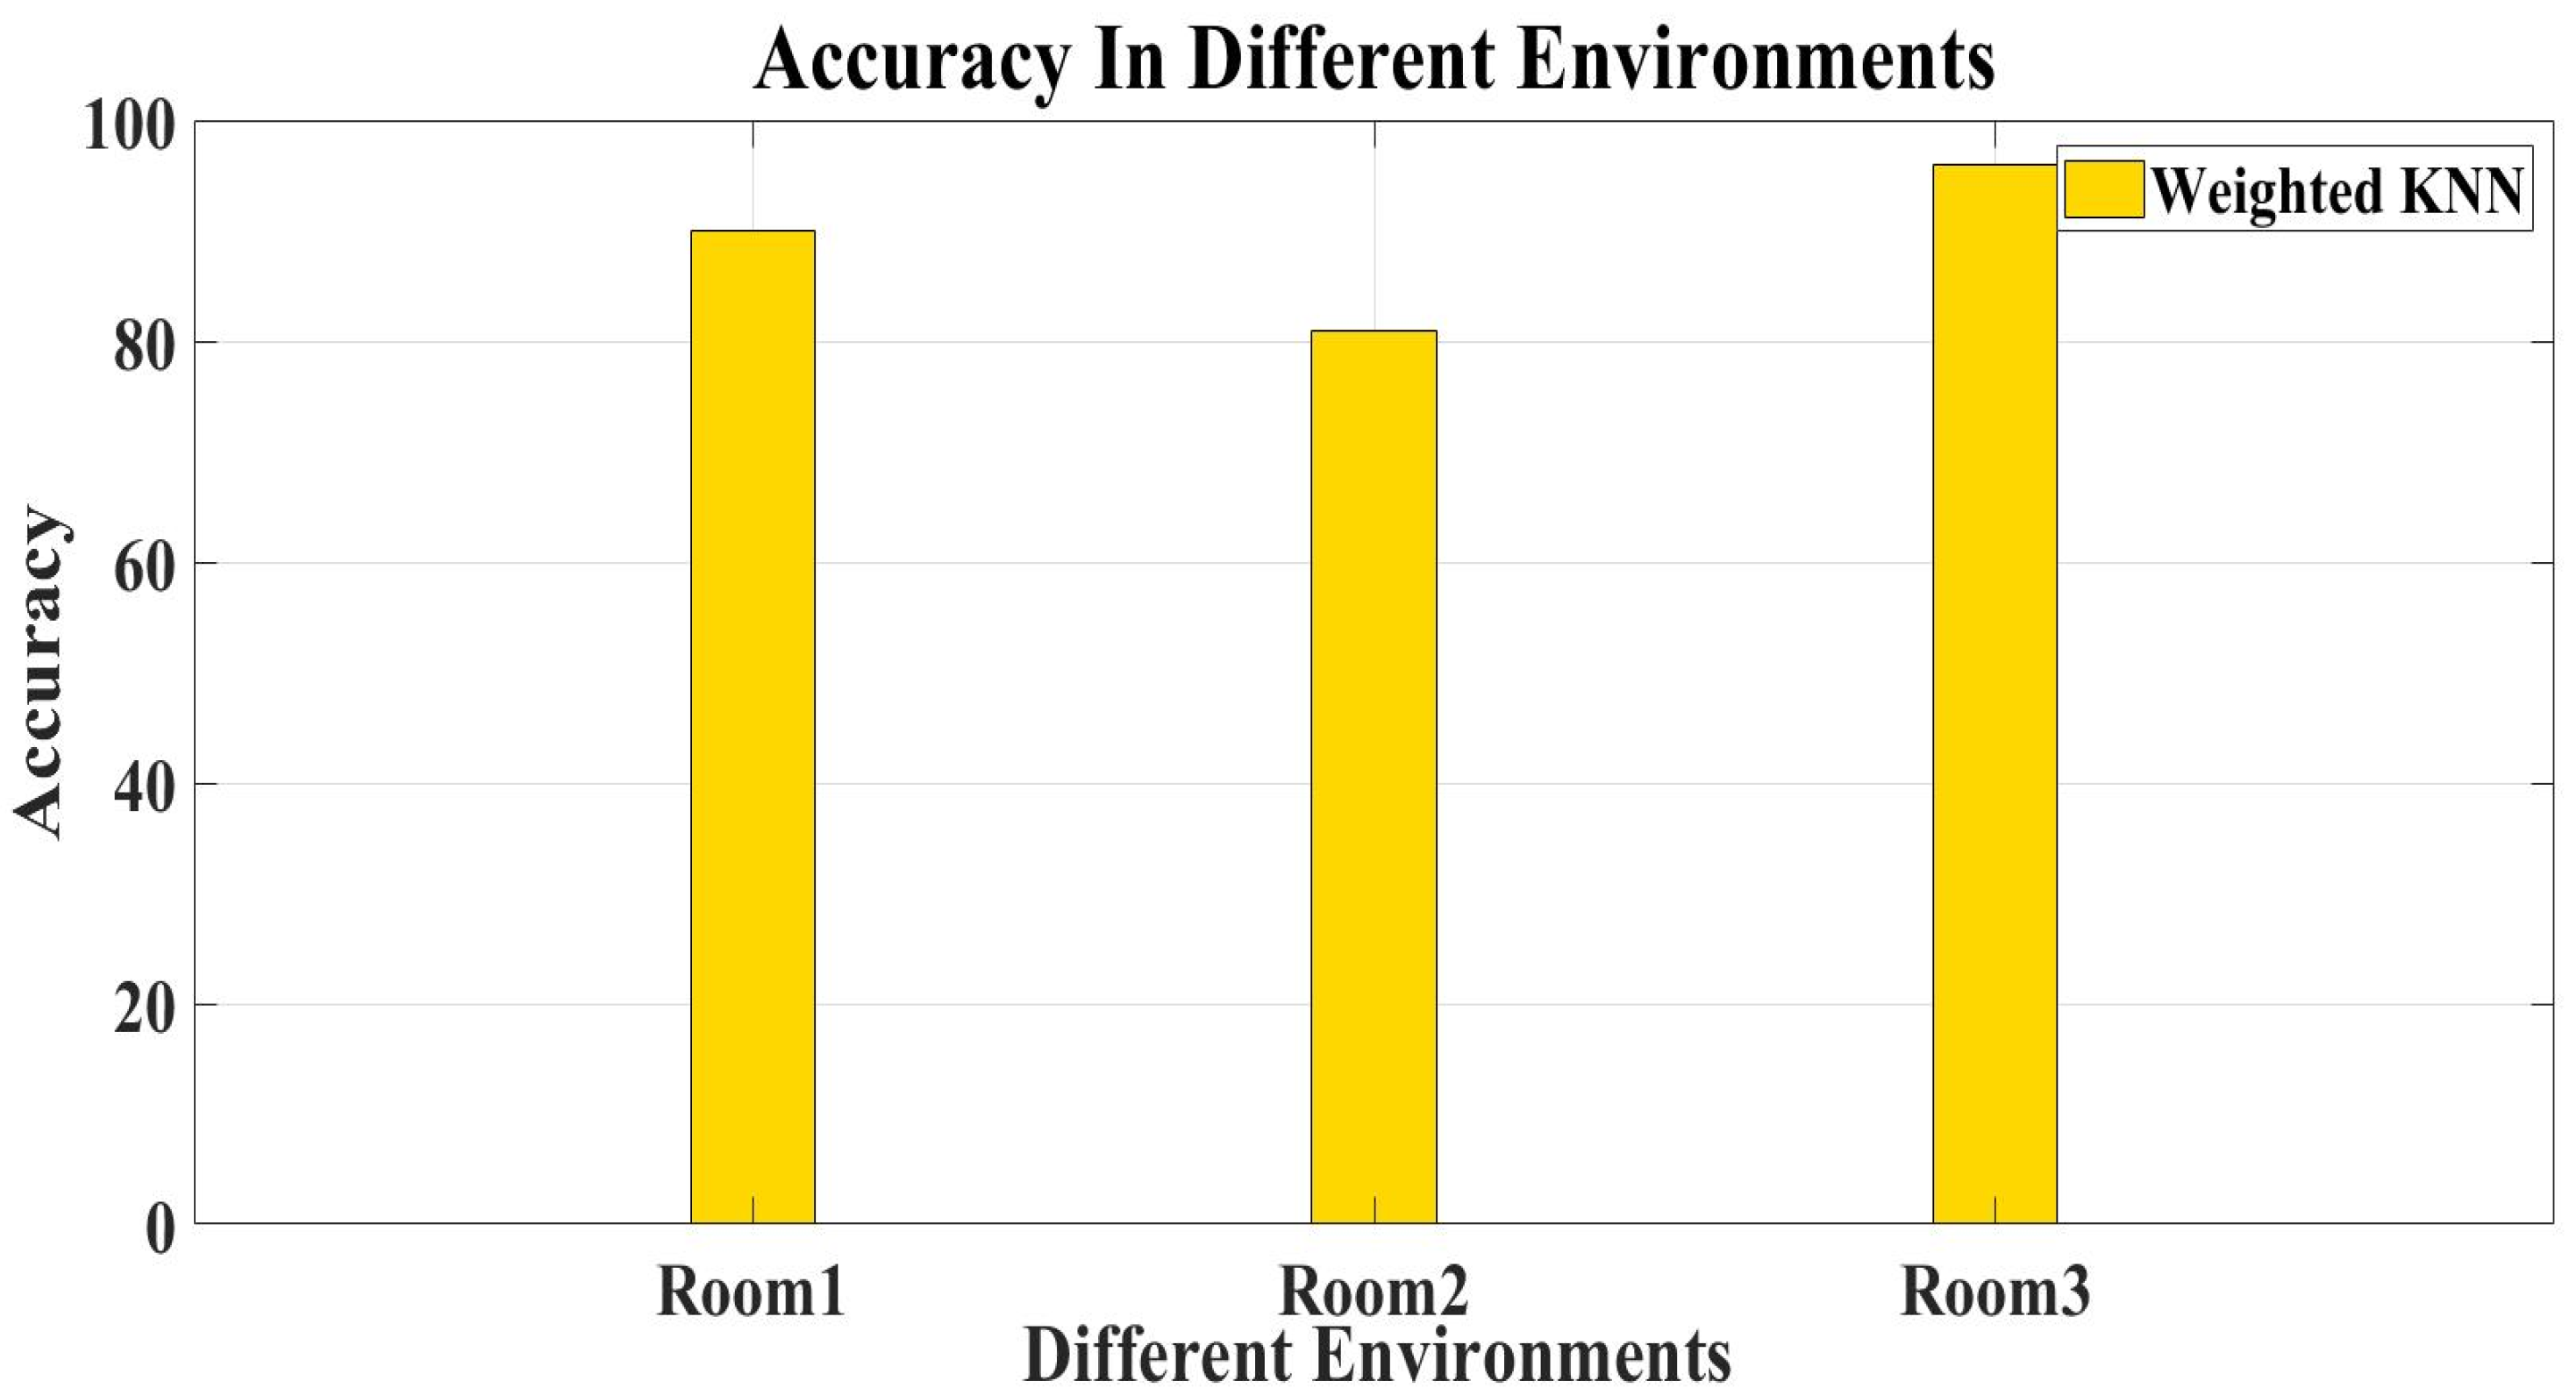
6.3. Experimental Results in Different Environments

To verify that if the proposed method had migration issue, the gesture classification recognition process was performed at three different areas: classroom, hall, and office (denoted as Room1, Room2, and Room3, respectively, see Figure 12). The results revealed high migration and the accuracy of Room2 was lower than the other two rooms mainly because Room2 was equipped with more indoor furnishing, appeared to be more complex, and had varied multipath.

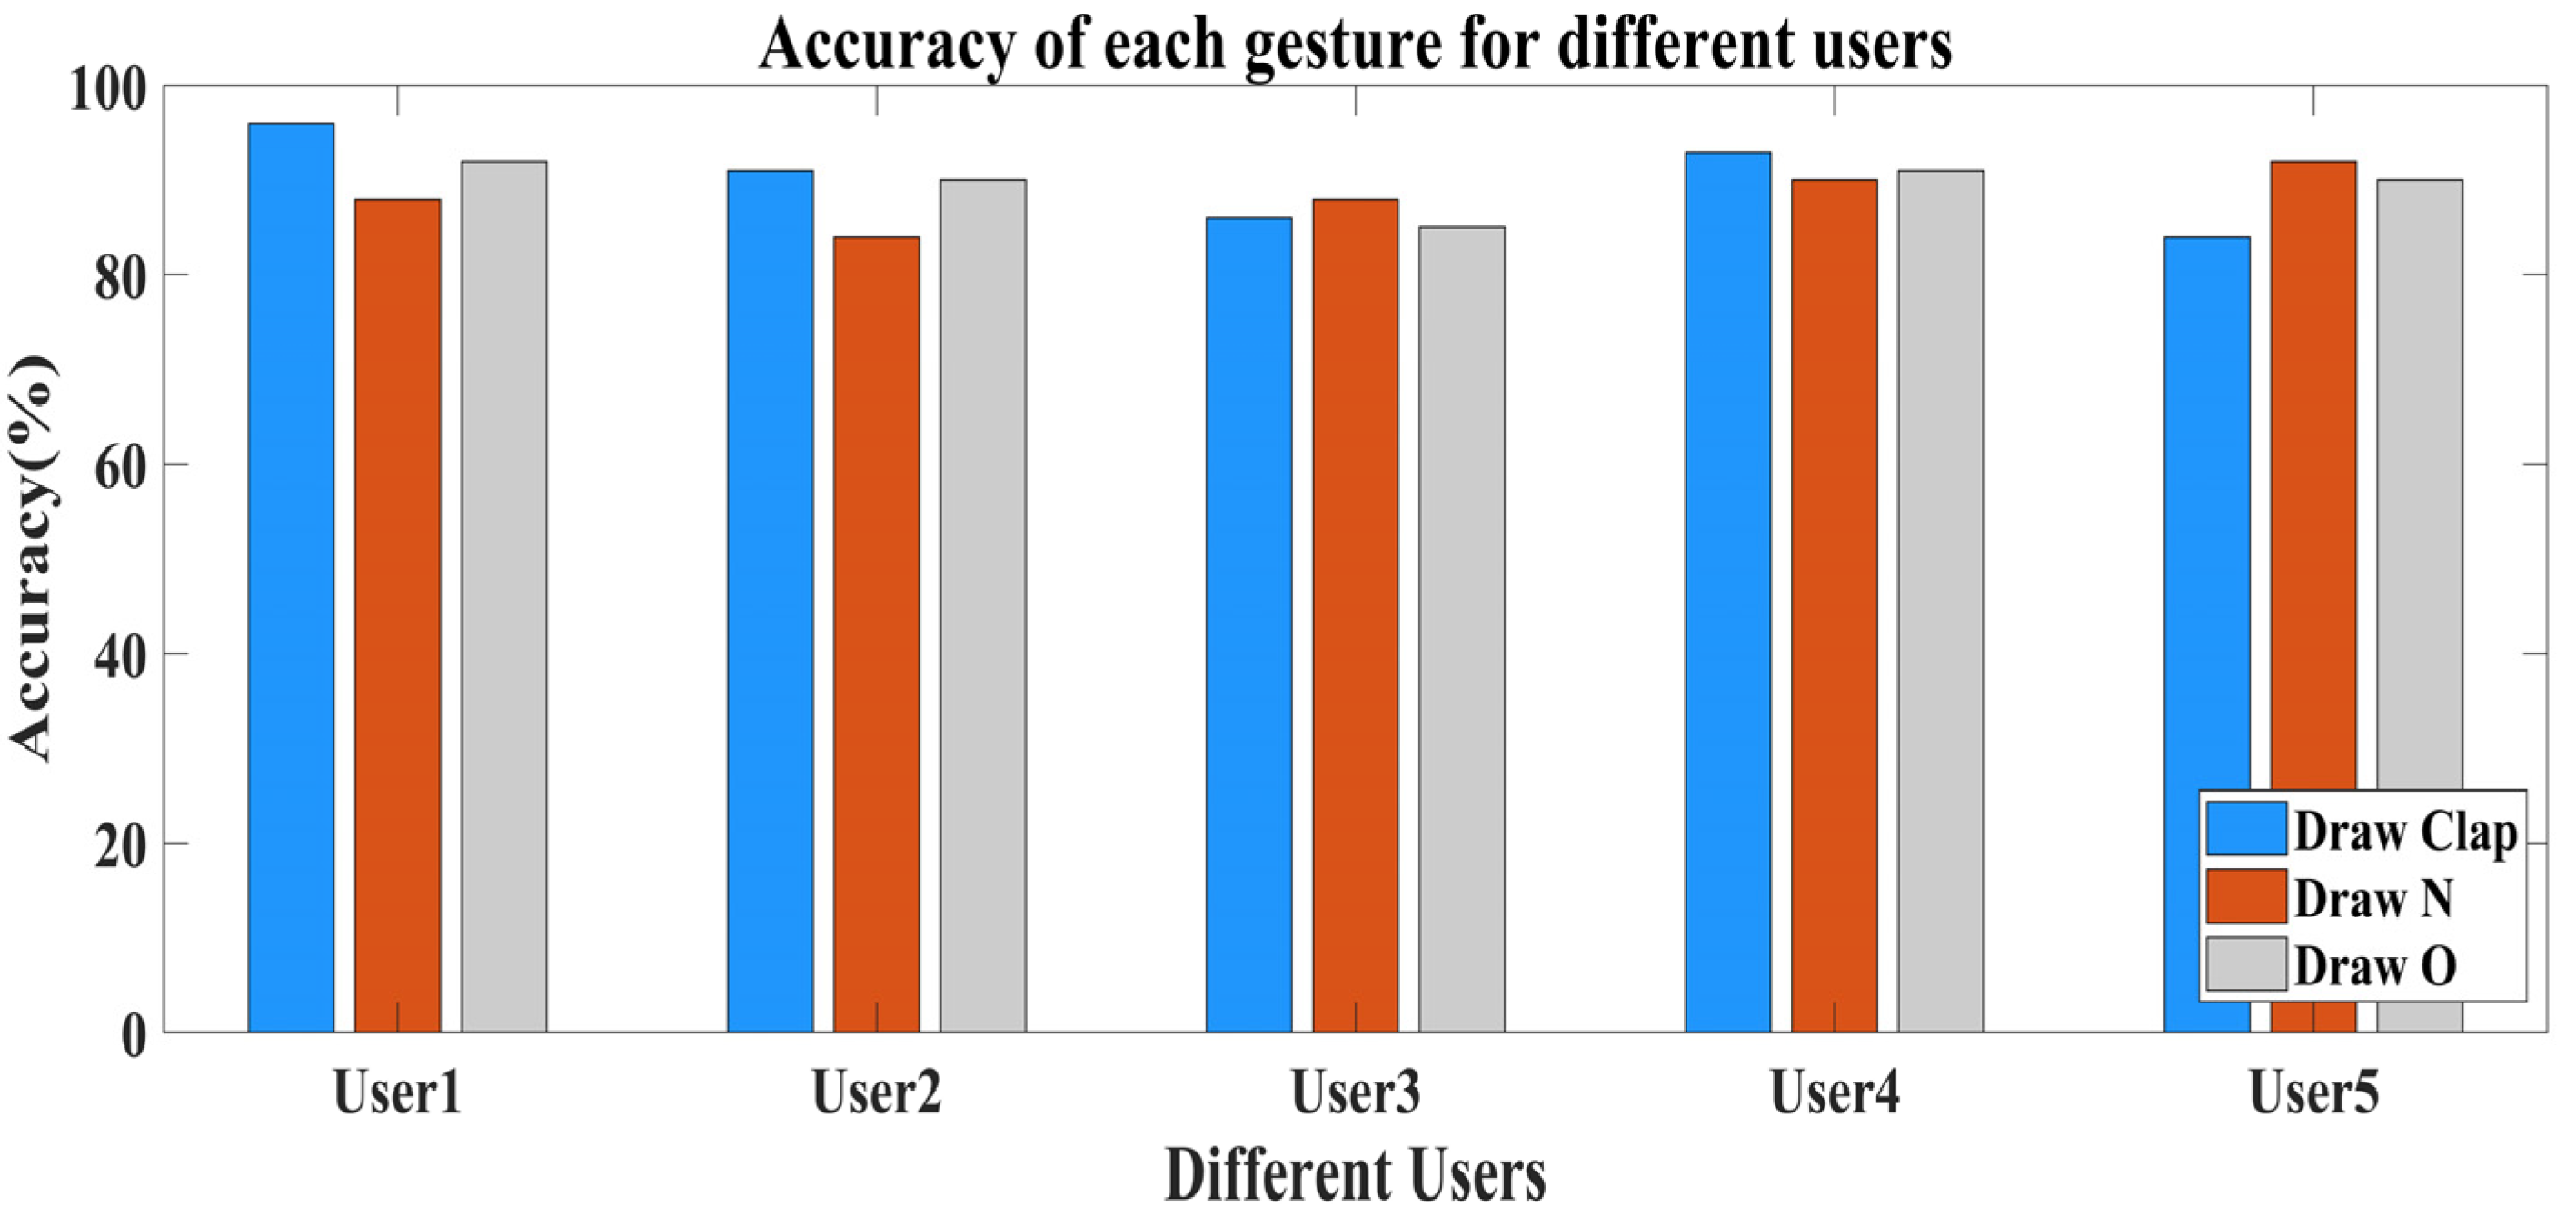
6.4. Experimental Results of Different Users

Upon assessing the effect of different environments on recognition classification accuracy, the recognition results displayed good accuracy. Since gesture size, gesture speed, and gesture specification differ for different people, this section examined the influence of the listed three factors. Thus, a series of experiments was conducted on different experimenters. Referring to the results (see Figure 13 below), the recognition accuracy of user 3 was slightly lower than the rest due to different gesture size and specification. This signified that gesture posture, size, etc, drawn by different users, exerted a relatively small effect on the accuracy recognition outcomes.

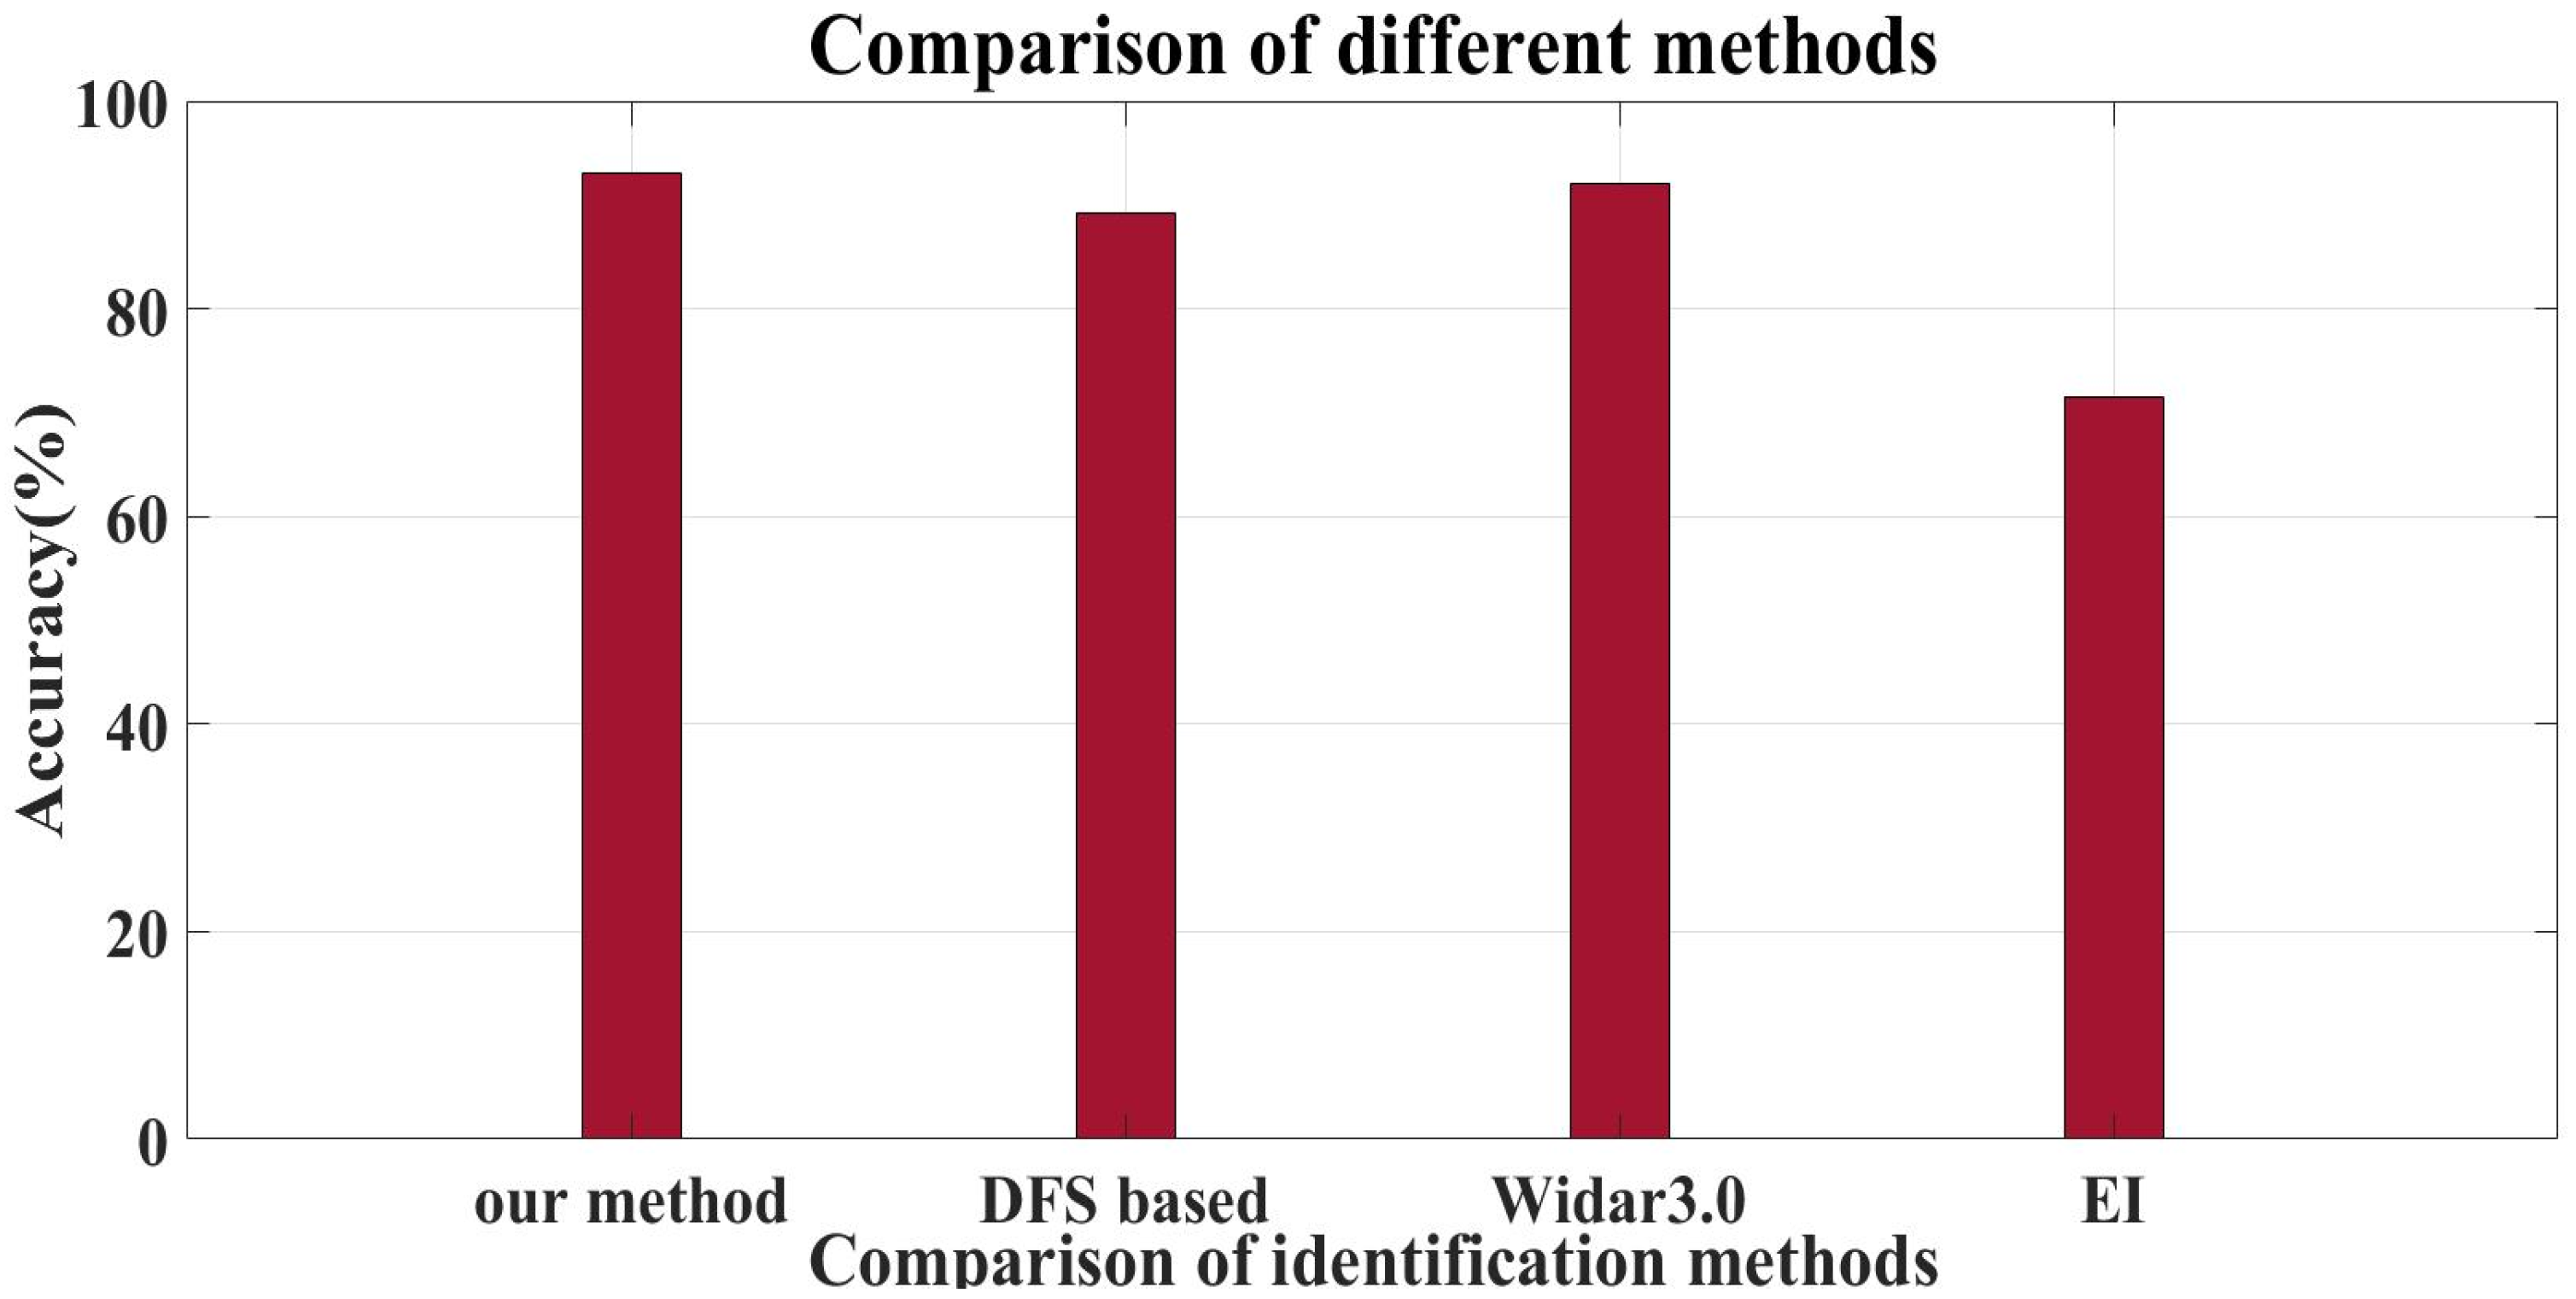
6.5. Comparative Analysis of Different Methods

In order to verify the performance of the recognition, we selected three papers for comparison; both [10] and study [30] uses similar datasets to those used in this paper, while [31] in the literature use the same publicly available dataset. The outcomes were compared with those of cross-domain Wi-Fi activity recognition reported in [10,30,31]. Ten-fold cross-validation was executed for multiple experiments. Finally, the average recognition accuracy of the multiple experimental results was determined (see Figure 14 below).
The above Figure 14 shows that the average recognition rates were 0.4%, 18.6%, and 3.93% higher than those reported in [10,30,31], respectively. As for the cross-domain approach, the recognition method proposed in this study outperformed the other methods.

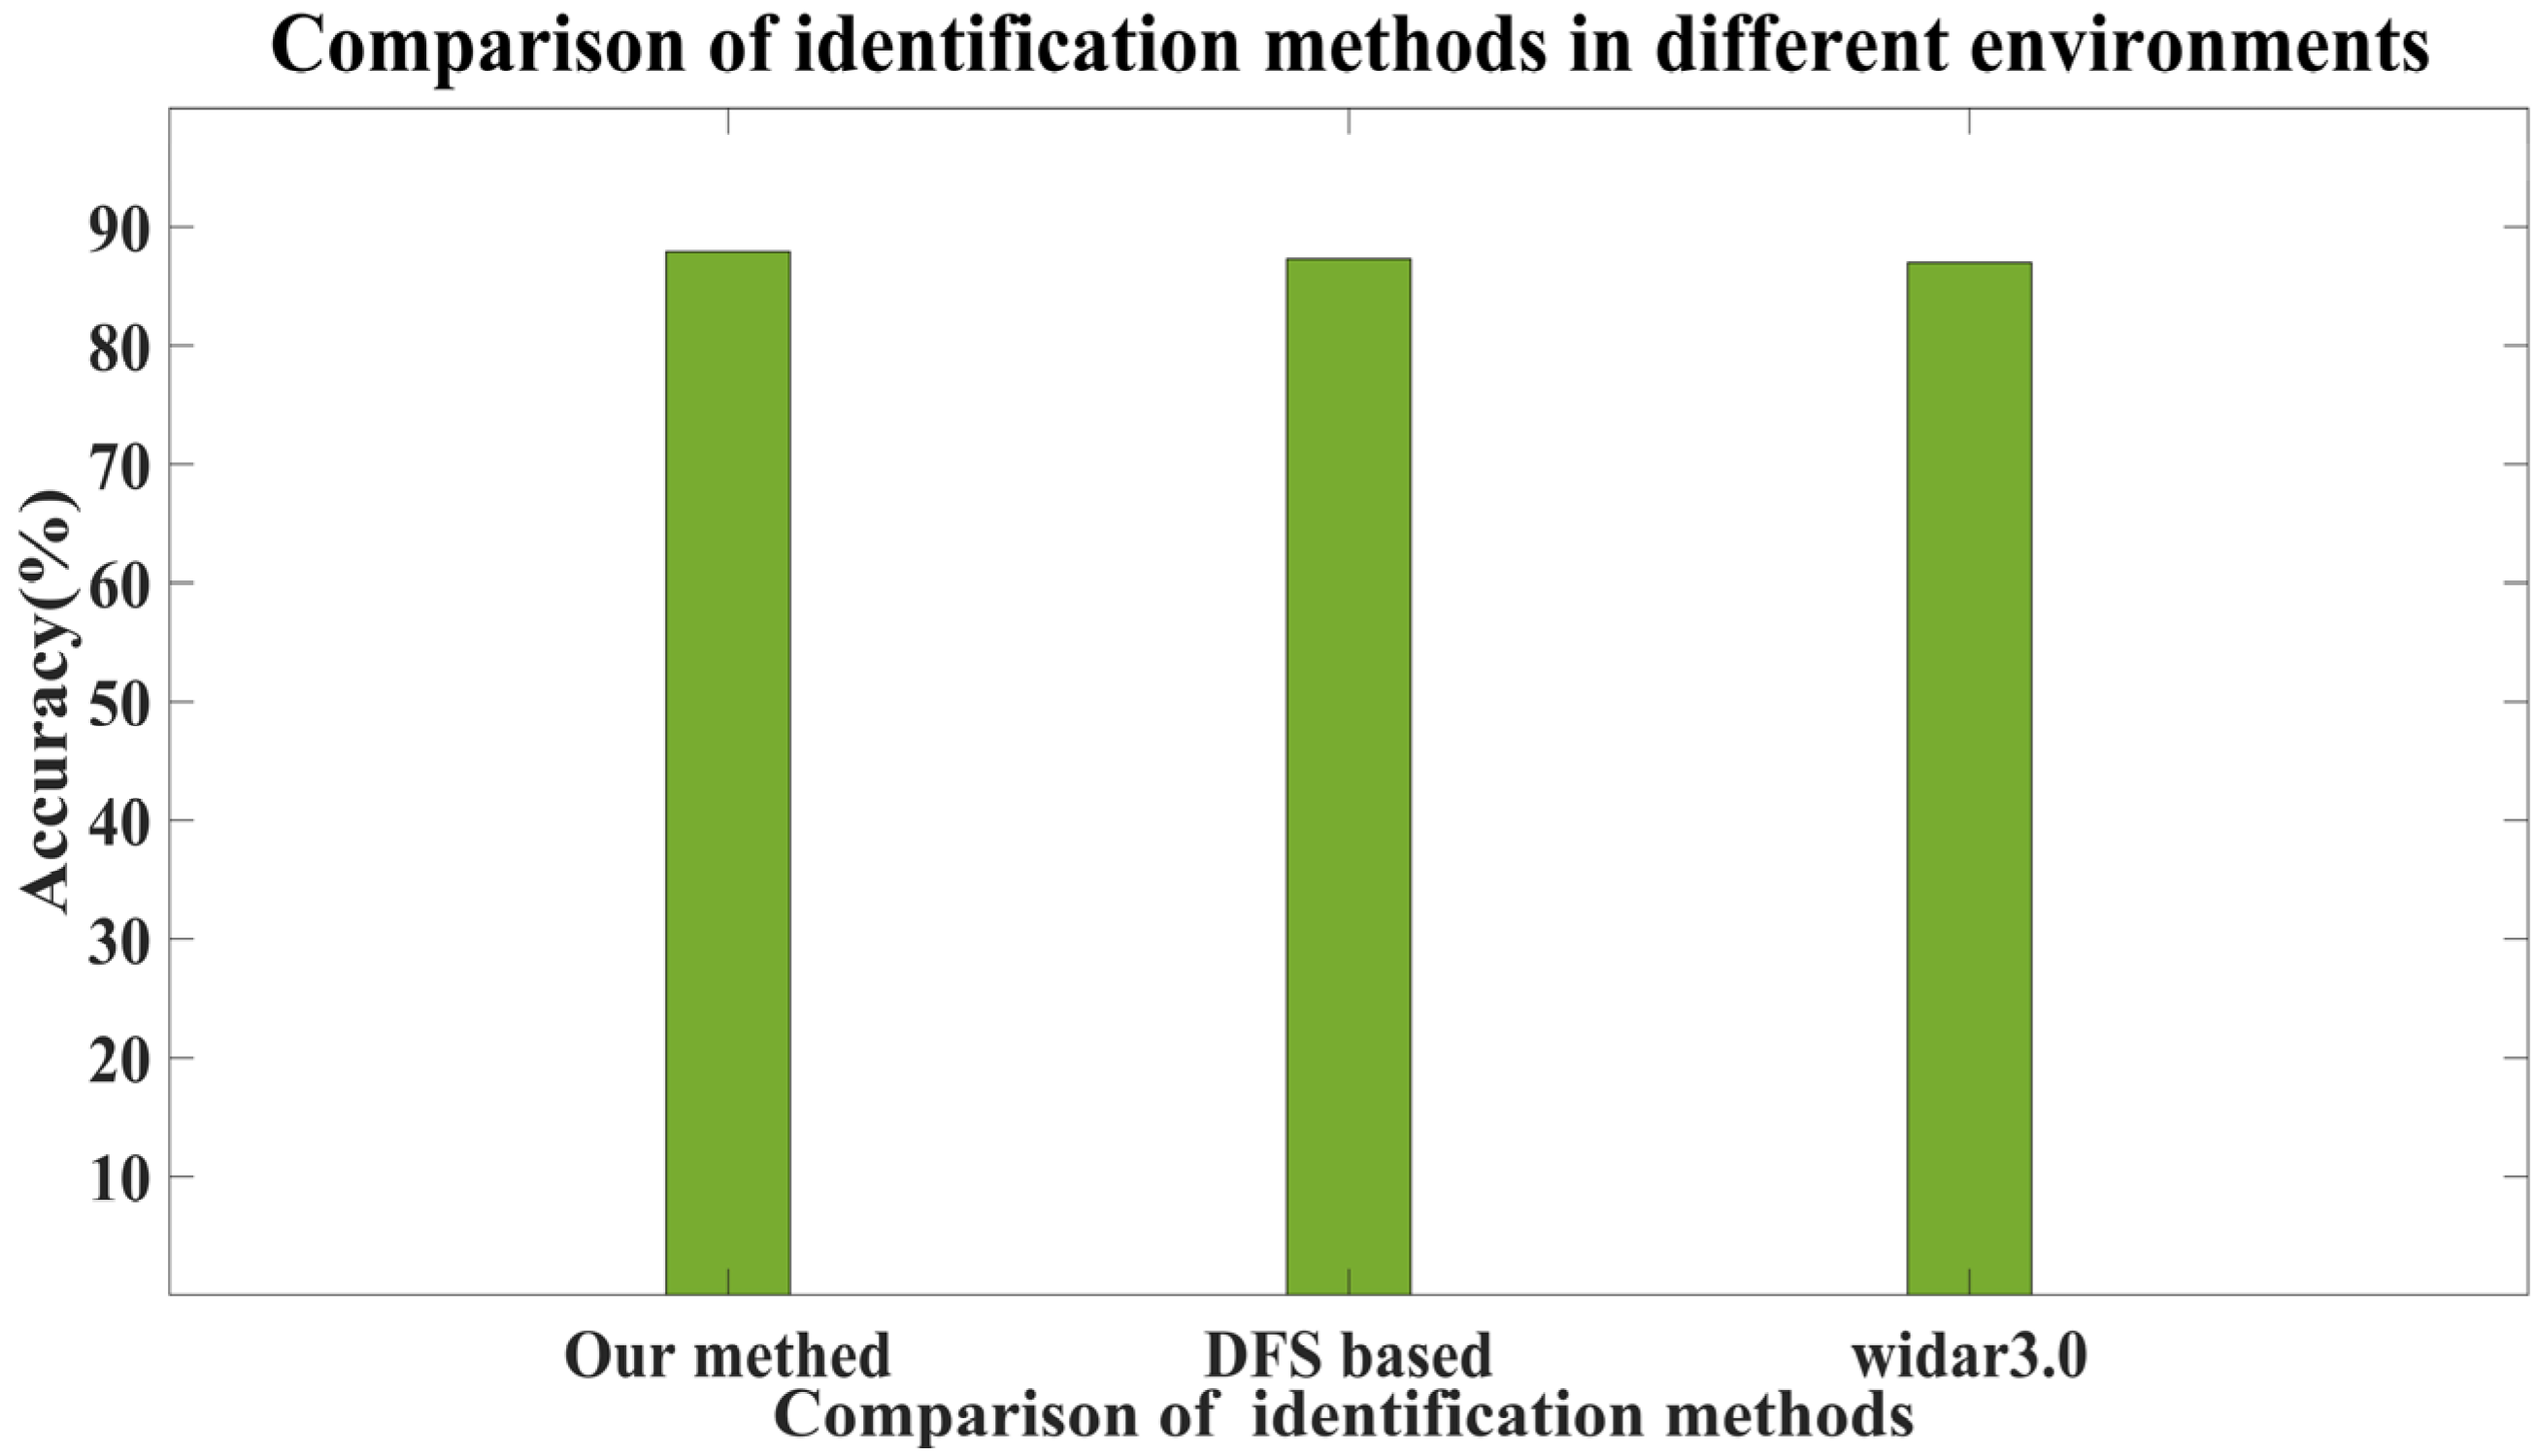
6.6. Comparison of Different Methods in Different Environments

In order to better verify the recognition accuracy under different experimental environments, we compared the average recognition accuracy by comparing with other methods as shown in the following Figure 15:
From Figure 15 (above), we can see that our average recognition accuracy is 87.9% in the three different environments, and the average recognition accuracy of [10] and [30] are 87% and 87.3%, respectively, and our method is 0.7% and 0.9% higher than the average recognition accuracy of other studies, respectively. By comparison, our method still achieved better recognition results under different environments.

7. Summary

A Wi-Fi-based, device-free, domain-independent gesture recognition system is proposed in this study. The Wi-NN extracted CSI data from the original data, and after pre-processing the subcarrier antenna selection, interpolation, outlier removal, high-frequency noise removal, data dimensionality reduction, and data smoothing, the effect of gesture changes on the signal was intuitively observed. Next, feature extraction was performed in the time domain by using the pre-processed data. After obtaining the feature data of each gesture, the weighted KNN identified and classified the feature data. By comparing experiments with different users, different environments and results with other research methods, the method used in this paper has proven to be effective. The good recognition accuracy achieved by Wi-NN can significantly contribute to HCI in the near future.

8. Future Outlook

Future study may explore a better gesture pre-processing and feature extraction method for gesture recognition in multi-person scenarios. The practicality of the Wi-Fi gesture recognition method can be improved by reducing the training time and achieving better recognition accuracy. Additionally, in future research, we will try to introduce novel deep learning frameworks for gesture behavior recognition and human gait recognition.

Author Contributions

Conceptualization, B.Y. and Y.Z.; methodology, B.Y. and Z.Y.; software, Y.Z.; validation, B.Y., Y.Z. and Z.L.; formal analysis, Y.Z.; investigation, B.Y.; resources, Z.Y. and X.L; data curation, B.Y.; writing—original draft preparation, B.Y.; writing—review and editing, Y.Z.; visualization, B.Y. and X.L.; supervision, Y.Z.; project administration, X.L.; funding acquisition, Y.Z. All authors have read and agreed to the published version of the manuscript.

Funding

This research was supported by the natural science foundation of Xinjiang Uygur Autonomous Region, under Grant: 2022D01C54.

Institutional Review Board Statement

Not applicable.

Informed Consent Statement

Informed consent was obtained from all subjects involved in the study.

Data Availability Statement

Not applicable.

Conflicts of Interest

The authors declare no conflict of interest.

References

  1. Cao, F. Human-computer interaction in IoT smart home. Home Technol. 2020, 1, 13–15. [Google Scholar]
  2. Lien, J.; Gillian, N.; Karagozler, M.E.; Amihood, P.; Schwesig, C.; Olson, E.; Raja, H.; Poupyrev, I. Soli: Ubiquitous gesture sensing with millimeter wave radar. ACM Trans. Graph. (TOG) 2016, 35, 1–19. [Google Scholar] [CrossRef] [Green Version]
  3. Nymoen, K.; Haugen, M.R.; Jensenius, A.R. MuMYO-Evaluating and Exploring the MYO Armband for Musical Interaction. In Proceedings of the International Conference on New Interfaces for Musical Expression, Baton Rouge, LA, USA, 31 May–3 June 2015; pp. 215–218. [Google Scholar]
  4. Wu, H.Y.; Zhang, F.J.; Liu, Y.J.; Dai, G.Z. Research on key issues of vision-based gesture interfaces. Chin. J. Comput. 2009, 32, 2030–2041. [Google Scholar]
  5. Bu, Y.; Xie, L.; Gong, Y.; Wang, C.; Yang, L.; Liu, J.; Lu, S. RF-Dial: Rigid Motion Tracking and Touch Gesture Detection for Interaction via RFID Tags. IEEE Trans. Mob. Comput. 2022, 21, 1061–1080. [Google Scholar] [CrossRef]
  6. Ma, R.; Zhang, Z.; Chen, E. Human Motion Gesture Recognition Based on Computer Vision. Complexity 2021, 2021, 6679746. [Google Scholar] [CrossRef]
  7. Ma, Y.; Zhou, G.; Wang, S. WiFi sensing with channel state information: A survey. ACM Comput. Surv. (CSUR) 2019, 52, 1–36. [Google Scholar] [CrossRef] [Green Version]
  8. Shangguan, L.; Zhou, Z.; Jamieson, K. Enabling gesture-based interactions with objects. In Proceedings of the 15th Annual International Conference on Mobile Systems, Applications, and Services, Niagara Falls, NY, USA, 19–23 June 2017; pp. 239–251. [Google Scholar]
  9. Wang, J.; Vasisht, D.; Katabi, D. RF-IDraw: Virtual touch screen in the air using RF signals. ACM SIGCOMM Comput. Commun. Rev. 2014, 44, 235–246. [Google Scholar] [CrossRef]
  10. Zheng, Y.; Zhang, Y.; Qian, K.; Zhang, G.; Liu, Y.; Wu, C.; Yang, Z. Zero effort cross domain gesture recognition with WiFi. In Proceedings of the 17th Annual International Conference on Mobile Systems, Applications, and Services, Seoul, Republic of Korea, 17–21 June 2019; ACM: New York, NY, USA, 2019; pp. 313–325. [Google Scholar]
  11. Li, C.; Liu, M.; Cao, Z. WiHF: Gesture and User Recognition with WiFi. IEEE Trans. Mob. Comput. 2022, 21, 757–768. [Google Scholar] [CrossRef]
  12. IEEE Dataport. Available online: https://ieee-dataport.org/open-access/widar30-wifi-based-activity-recognition-dataset (accessed on 10 October 2022).
  13. Gkioxari, G.; Girshick, R.; Dollár, P.; He, K. Detecting and recognizing human-object interactions. In Proceedings of the IEEE Conference on Computer Vision and Pattern Recognition, Salt Lake City, UT, USA, 18–23 June 2018; pp. 8359–8367. [Google Scholar]
  14. Xu, C.; Pathak, P.H.; Mohapatra, P. Finger-writing with smartwatch: A case for finger and hand gesture recognition using smartwatch. In Proceedings of the 16th International Workshop on Mobile Computing Systems and Applications, Santa Fe, NM, USA, 12–13 February 2015; pp. 9–14. [Google Scholar]
  15. Wen, H.; Ramos Rojas, J.; Dey, A.K. Serendipity: Finger gesture recognition using an off-the-shelf smartwatch. In Proceedings of the 2016 CHI Conference on Human Factors in Computing Systems, San Jose, CA, USA, 7–12 May 2016; pp. 3847–3851. [Google Scholar]
  16. Liu, H.; Wang, Y.; Zhou, A.; He, H.; Wang, W.; Wang, K.; Pan, P.; Lu, Y.; Liu, L.; Ma, H. Real-time arm gesture recognition in smart home scenarios via millimeter wave sensing. Proc. ACM Interact. Mob. Wearable Ubiquitous Technol. 2020, 4, 1–28. [Google Scholar] [CrossRef]
  17. Wang, W.; Liu, A.X.; Sun, K. Device-free gesture tracking using acoustic signals. In Proceedings of the 22nd Annual International Conference on Mobile Computing and Networking, New York, NY, USA, 3–7 October 2016; pp. 82–94. [Google Scholar]
  18. Xiao, J.; Zhou, Z.; Yi, Y.; Ni, L.M. A survey on wireless indoor localization from the device perspective. ACM Comput. Surv. (CSUR) 2016, 49, 1–31. [Google Scholar] [CrossRef] [Green Version]
  19. Gu, Y.; Zhu, Y.; Li, J.; Ji, Y. WiMate: Location-independent Material Identification Based on Commercial WiFi Devices. In Proceedings of the 2021 IEEE Global Communications Conference (GLOBECOM), Madrid, Spain, 7–11 December 2021; IEEE: Piscataway, NJ, USA, 2021; pp. 01–06. [Google Scholar]
  20. Mattela, G.; Tripathi, M.; Pal, C. A Novel Approach in WiFi CSI-Based Fall Detection. SN Comput. Sci. 2022, 3, 214. [Google Scholar] [CrossRef]
  21. Palipana, S.; Rojas, D.; Agrawal, P.; Pesch, D. FallDeFi: Ubiquitous fall detection using commodity Wi-Fi devices. Proc. ACM Interact. Mob. Wearable Ubiquitous Technol. 2018, 1, 1–25. [Google Scholar] [CrossRef]
  22. Guo, L.; Wang, L.; Liu, J.; Zhou, W. A survey on motion detection using WiFi signals. In Proceedings of the 2016 12th International Conference on Mobile Ad-Hoc and Sensor Networks (MSN), Hefei, China, 16–18 December 2016; IEEE: Piscataway, NJ, USA, 2016; pp. 202–206. [Google Scholar]
  23. Chen, Y.; Dong, W.; Gao, Y.; Liu, X.; Gu, T. Rapid: A multimodal and device-free approach using noise estimation for robust person identification. Proc. ACM Interact. Mob. Wearable Ubiquitous Technol. 2017, 1, 1–27. [Google Scholar] [CrossRef]
  24. Abdelnasser, H.; Youssef, M.; Harras, K.A. Wigest: A ubiquitous wifi-based gesture recognition system. In Proceedings of the 2015 IEEE Conference on Computer Communications (INFOCOM), Kowloon, Hong Kong, 26 April–1 May 2015; IEEE: Piscataway, NJ, USA, 2015; pp. 1472–1480. [Google Scholar]
  25. Bu, Q.; Yang, G.; Ming, X.; Zhang, T.; Feng, J.; Zhang, J. Deep transfer learning for gesture recognition with WiFi signals. Pers. Ubiquitous Comput. 2022, 26, 543–554. [Google Scholar] [CrossRef]
  26. Wu, W.; Yang, B.; Yu, H.; Wang, H. High-Accuracy WiFi-Based 3D Indoor Positioning Using Non-Uniform Planar Array. In Proceedings of the 2021 IEEE MTT-S International Wireless Symposium (IWS), Nanjing, China, 23–26 May 2021; IEEE: Piscataway, NJ, USA, 2021; pp. 1–3. [Google Scholar]
  27. Gu, Y.; Zhan, J.; Ji, Y.; Li, J.; Ren, F.; Gao, S. MoSense: An RF-based motion detection system via off-the-shelf WiFi devices. IEEE Internet Things J. 2017, 4, 2326–2341. [Google Scholar] [CrossRef]
  28. Cheng, L.; Wang, J. How can I guard my AP? Non-intrusive user identification for mobile devices using WiFi signals. In Proceedings of the 17th ACM International Symposium on Mobile Ad Hoc Networking and Computing, Chennai, India, 10–14 July 2016; pp. 91–100. [Google Scholar]
  29. Tan, S.; Yang, J.; Chen, Y. Enabling fine-grained finger gesture recognition on commodity WiFi devices. IEEE Trans. Mob. Comput. 2020, 21, 2789–2802. [Google Scholar] [CrossRef]
  30. Jiang, W.; Miao, C.; Ma, F.; Yao, S.; Wang, Y.; Yuan, Y.; Xue, H.; Song, C.; Ma, X.; Koutsonikolas, D.; et al. Towards environment independent device free human activity recognition. In Proceedings of the 24th Annual International Conference on Mobile Computing and Networking, New Delhi, India, 29 October–2 November 2018; pp. 289–304. [Google Scholar]
  31. Chang, J.; Wang, K.; Wu, H. WiFi cross-scene gesture recognition under multi-view adversarial network. Mod. Electron. Technol. 2022, 45, 149–154. [Google Scholar]
Figure 1. Overview of the Wi-NN system.
Applsci 13 03743 g001
Figure 2. Signal-to-noise ratio of different antennas.
Applsci 13 03743 g002
Figure 3. Changes before and after interpolation of 30 subcarriers (a) Before interpolation algorithm processing; (b) After interpolation algorithm processing.
Applsci 13 03743 g003
Figure 4. Data packet after outlier algorithm processing.
Applsci 13 03743 g004
Figure 5. Wavelet denoising process.
Applsci 13 03743 g005
Figure 6. The above figure shows the before and after comparison of wavelet processing algorithm: (a) Before filtering and denoising; (b) After filtering and denoising.
Applsci 13 03743 g006
Figure 7. PCA processing results.
Applsci 13 03743 g007
Figure 8. After smoothing treatment.
Applsci 13 03743 g008
Figure 9. The picture above shows the experimental environment and Gesture drawing direction: (a) Hall; (b) Office; (c) Classroom; (d) Gesture drawing direction.
Applsci 13 03743 g009aApplsci 13 03743 g009b
Figure 10. Types of gestures used for experiments.
Applsci 13 03743 g010
Figure 11. Recognition accuracy of each gesture.
Applsci 13 03743 g011
Figure 12. Recognition accuracy in different environments.
Applsci 13 03743 g012
Figure 13. Comparison of gesture recognition accuracy for different users.
Applsci 13 03743 g013
Figure 14. Comparison of recognition accuracy of different methods.
Applsci 13 03743 g014
Figure 15. Comparison of methods in different environments.
Applsci 13 03743 g015
Table 1. Feature extraction formula.
Time Domain FeaturesCalculation Method
Average s ¯ = 1 N i = 1 N s i
Standard deviation ρ t = 1 N i = 1 N s i s ¯ 2 1 2
Skewness 1 N i = 1 N ( s i s ¯ ) 3 ρ t 3
Steepness 1 N i = 1 N ( s i s ¯ ) 4 ρ t 4
Maximum s max
Minimum value s min
Peak s max s min
Root mean square R M S = ( 1 N i = 1 N s i 2 ) 1 2
Amplitude factor s max / R M S
Waveform Factor R M S / 1 N i = 1 N s i
Impact Factor s max / 1 N i = 1 N s i
Yield Factor s max / 1 N i = 1 N s i 2
Energy i = 1 N s i 2
Disclaimer/Publisher’s Note: The statements, opinions and data contained in all publications are solely those of the individual author(s) and contributor(s) and not of MDPI and/or the editor(s). MDPI and/or the editor(s) disclaim responsibility for any injury to people or property resulting from any ideas, methods, instructions or products referred to in the content.

