Article

Recognition of the Perceived Benefits of Smartphones and Tablets and Their Influence on the Quality of Learning Outcomes by Students in Lower Secondary Biology Classes

1
Faculty of Natural Sciences and Mathematics, University of Maribor, 2000 Maribor, Slovenia
2
Faculty of Electrical Engineering and Computer Science, University of Maribor, 2000 Maribor, Slovenia
*
Author to whom correspondence should be addressed.
Appl. Sci. 2023, 13(6), 3379; https://doi.org/10.3390/app13063379
Submission received: 8 February 2023 / Revised: 1 March 2023 / Accepted: 5 March 2023 / Published: 7 March 2023
(This article belongs to the Special Issue Information and Communication Technology (ICT) in Education)

Abstract

:
After the appearance of the first smartphones in 2007 and shortly thereafter, tablets became not only useful communication tools, but also objects that function as life organisation units. However, although they are ubiquitous, their actual and potential role in biology education has not been sufficiently explored. The objectives of the survey were to investigate the recent use of smartphones in the last two grades of Slovenian comprehensive school by 14- to 15-year-old students, their satisfaction with them for educational purposes, and the perceived impact on the quality of schoolwork in biology classes. Based on the responses of 313 lower secondary school students, we can conclude that by the end of compulsory education, almost all of them have used smartphones and tablets for educational purposes to some extent, even if the reported use in different school subjects is low. Based on structural equation modelling, which examines the influence of the constructs of support, perceived usability, perceived ease of use, attitudes, and perceived pedagogical impact on the quality of smartphone-based schoolwork, it can be concluded that only perceived pedagogical impacts and perceived usability impacted quality, leading to the conclusion that additional efforts should be made to explore their full potential and the gaps that should be addressed through formal education. Leaving students to their own devices is the worst solution, resulting in a permanent lack of skills, such as the ability to select and interpret information provided through the media.

1. Introduction

After the appearance of the first smartphones in 2007 and shortly thereafter, tablets became not only useful communication tools, but also objects that function as life organization units [1] and occupy a large part of many young people’s time. As Reid [2] writes, “ten years ago, the smartphone arrived at a perfect confluence of our societal wants and needs: to be able to communicate freely, to be networked, to be informed, to be entertained, to be mobile”. Missing from Reid’s [2] list, however, is the term “being educated”. In addition to all the positive aspects that make smartphones and their larger cousins, tablets (hereafter the term smartphone will be used to refer to both devices), a number of devastating side effects have also been reported. Spitzer [3] lists that smartphones cause “addiction, attention deficits, sleep deficits, empathy deficits, impaired learning and hence decreased educational achievement, hypertension, obesity, anxiety, depression, personality disorders, increased aggression, dissatisfaction with life, and loneliness”. These claims raise an important question about their possible place in education. The dilemma can be located between two edges. At one end is the position that schools should be isolated islands where they are completely banned in order to protect children from the evils of smartphones and, in this way, reduce the negative effects of their screen use [4]. At the other end of the scale may be the position that smartphones should be allowed without any restrictions. Moreover, somewhere in between may be the position that their use in schools should be allowed and regulated so that they are not used by students as an escape from classroom activities that distract and alienate them. If their use is allowed under well-defined conditions in the classroom, they can be considered as a useful “Swiss army knife” of technology [5,6,7], enabling not only communication, audio, video, and virtual interactions, but also allowing for real-time data collection and experiments through the use of integrated sensors or field research. The same cannot be said about their role and potential negative impact on educational outcomes if they are completely banned in schools and their use outside of schools is not restricted.
Around the world, there are different practices regulating the use of smartphones in the classroom. In Slovenia, despite the fact that smartphones have been on the market since 2007 and cell phones have been on the market for several decades longer, there is no general and specific regulation of smartphone use in schools. The current practice follows the Elementary Schools Act [8], which requires Slovenian elementary schools to create school regulations that specify the rules of conduct, duties, and responsibilities of students. In summary, it is up to each school to regulate the use of these devices through internal rules. Within the framework of the principles of pedagogical autonomy, the use of smartphones in class is determined by the teacher who leads the learning process.
Within a possible spectrum of outright prohibition and unrestricted use of smartphones within a school setting, we believe that schools alone do not have the power to restrict the extensive use of smartphones outside of school, but they do have the opportunity to cultivate their use in terms of achieving what are fashionably referred to as “21st century skills” [9] and to make them digital tools that support the development of those skills [10]. However, in order to teach children and adolescents about the potential benefits of smartphones for developing lifelong information, media, and digital literacy skills, as well as their potential as tools with built-in sensors and applications, they should not be left on their own, but should be introduced to them during their school years. For example, it has been shown that students are not able to acquire information literacy skills on their own and that those who use mobile devices more frequently are more prone to information illiteracy than their peers who use them less [11,12]. This process of taming smartphones cannot be achieved through didactic lessons preaching about their potential and actual negative effects, but through carefully designed experiences that are integrated into curricula. With such an approach, the knowledge acquired in school can become a lifelong skill that enriches students’ lives in their free time or in extracurricular contexts as well.
The role of smartphones in education cannot be considered just a special branch of the use of information and communication technologies (ICTs), which have been used in education for decades and are integral parts of education as tutors, tools, tutees [13,14], and toys [15]. Their characteristics and ubiquitous presence in the daily activities of students and teachers distinguish them from stationary and mobile computers for personal and educational purposes, so the results of previous ICT-related studies need to be reviewed in light of the new tools in mind. The problems of adoption and meaningful use, as well as the learning outcomes of using smartphones and tablets, may differ based on the accessibility and capabilities of the technology, the knowledge and ability of users to use the technology, and the content and goals of instruction [16]. The importance and impact of smartphones on the methods, forms, and outcomes of education can be recognized in at least three aspects: (a) mobility of technology; (b) mobility of learning; and (c) mobility of students [17]. Due to their pocket size and relative independence from “wires” compared to mobile and stationary computers, they are at least potential candidates to enable anytime, anywhere learning [18,19]. Moreover, all the benefits and limitations of each of the above aspects can be considered in at least three educational aspects [20,21]: (a) universal in the context of informal education; (b) universal and valid for all formal education; and (c) subject specific and methodological within a single subject or group of related subjects (e.g., the role of smartphones in laboratory work or fieldwork in science education). The last aspect, related to biology, is the main interest of our study.
To determine the added value of smartphone use in schools and the problems associated with it, at least three levels should be considered. The first level is the level of ownership and familiarity with the technology. According to studies in developed countries, even young children can use touchscreen devices, and the majority of students own such devices [7,22,23,24]. The second level is the structural level where regulation of the use of such devices must be negotiated among all stakeholders (teachers, parents, students, and the public). For example, if smartphones are unselectively banned from schools, their added value or the problems associated with their use in schools cannot be addressed. On the third level, it is about cognitive and affective aspects that promote or hinder classroom use and schoolwork. It can be readily said that there are many examples of practice, but there is still a lack of results based on relevant and large-scale studies [25]. Therefore, the aim of the current study is to fill a research gap between technology and cognitive domains in order to provide an introduction of regulation that offers the best to students in the field of biology education where there are scarce references.
The use of ICT in biology (science) education in Slovenia is not a novelty and follows global educational trends [26,27]. As far as the introduction of mobile and stationary computers in the classroom is concerned, we can justifiably claim that Slovenia is a mature state where there is no serious resistance to the use of such technologies in the classroom; all schools have access to broadband Internet and are equipped with computers and an unknown number of them with tablets. Proof of this was during the closures caused by the COVID-19 pandemic, when virtually the entire school system and classes went online, and problems with hardware were mostly identified on the part of the students and not the teachers. The same cannot be said about the adoption of smartphones in education, where, following Rogers’ bell curve [28], we can say that we are in a phase between innovators and early adopters in some areas (e.g., lab work), and we can be considered an early majority in the use of some other more general applications [29] in schools where they are not prohibited [30].
According to recent Slovenian studies [11,12], the majority of lower secondary, upper secondary, and tertiary students own personal smartphones, and tablet use has already been reported [31], so the availability of technology cannot be considered a limiting factor for its adoption in everyday classroom practices. Therefore, the purpose of this study was to determine students’ views and opinions that may promote the adoption of smartphones in field and laboratory work as well as the enrichment of traditional teaching practices in which stationary and mobile computers are already used in biology classes.

2. Materials and Methods

Theoretically, our work relied on several theories that combine different latent variables in models. Among the theories that served as the basis for the constructs (latent variables), we would like to highlight the Technology Acceptance Model [32], the Unified Theory of Acceptance and Use of Technology (UTAUT) [33], the Expectation Confirmation Theory [34,35], and their derivatives. The constructs (latent variables) support (SUP), perceived usability (PU), perceived ease of use (PEOU), attitudes (ATT), and perceived pedagogical impact (PPI) on the quality (QUAL) of smartphone-based schoolwork (SUP, PU, PEOU, ATT, PPI) were used in our models.
For an overview of the constructs, see [36,37,38]. To achieve our research goal, we used an online survey as a means of collecting data from lower secondary school students.
The survey was designed to answer the following questions:
  • How well equipped are the students with their own smartphones and other ICT devices?
  • When did they first use smartphones for schoolwork?
  • How often have students participated in activities using smartphones in different subjects?
  • How satisfied are students with the use of smartphones in class?
  • What are their opinions about the impact of smartphones and tablets on the quality of schoolwork?
  • What are their opinions and reflections on the use of smartphones in biology class?
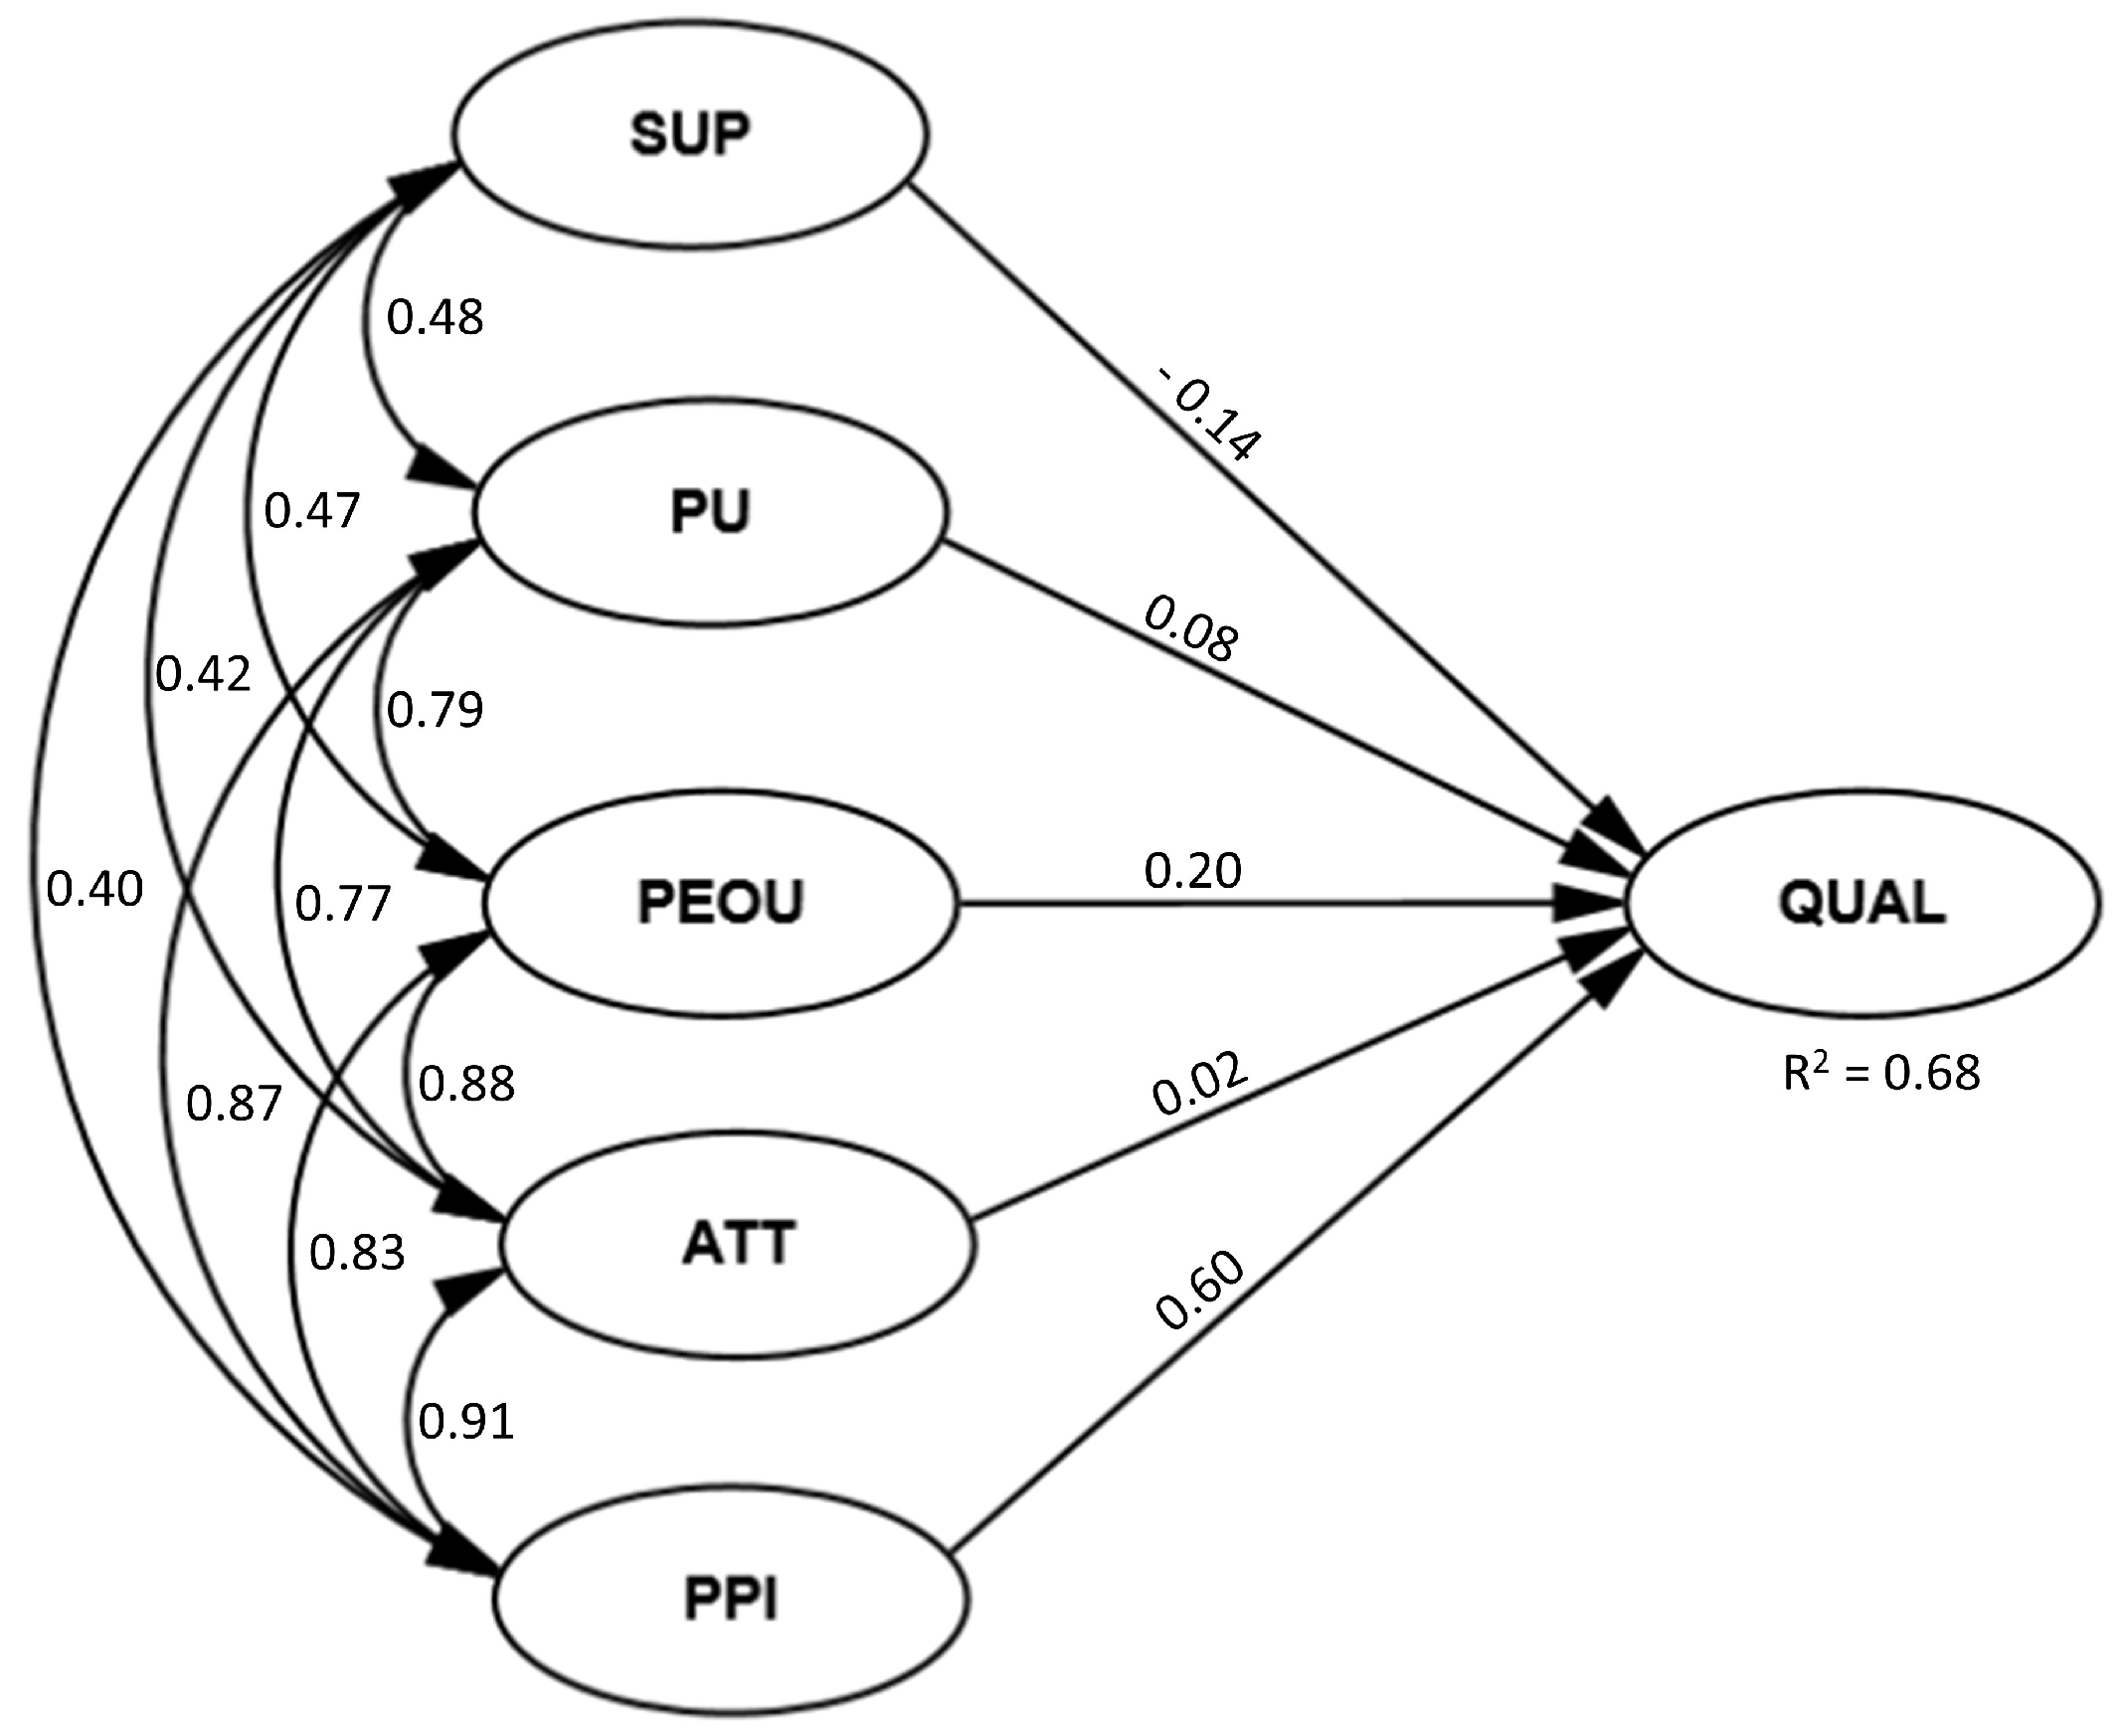
  • Do the opinions represented by latent variables (SUP, PU, PEOU, ATT, PPI) influence their opinions about the quality of smartphone-based schoolwork (QUAL)?

2.1. Sample and Sampling

The population of interest was elementary school students in the last grades (8th and 9th) of Slovenian 9-year compulsory school. According to the last census, the number of pupils in one generation is about 20,000. In the last two years of elementary school, which can be considered as lower secondary education (8th and 9th grade), biology is a compulsory subject after two years of biological topics as part of the compulsory subject of natural sciences (6th and 7th grade). Hands-on activities and teacher demonstrations are an integral part of the biology curriculum in all grades [39]. They may be accompanied by fieldwork or school fieldtrips and visits to institutions such as zoos, botanical gardens, museums, and nature reserves. While the content of the subject is prescribed by the curriculum approved by the authorities, the teaching methods, forms, and strategies used in the classroom, including the use of digital technologies, are part of the autonomy of the teachers.
The survey instrument, in the form of an online questionnaire based on the 1ka platform (www.1ka.si accessed on 1 March 2023), was promoted to students through various channels, using online social media, contacts with schools, and individual teachers. The campaign targeted “nameless” students at the end of the 2022 school year, which allowed for the inclusion of responses from students who had gained experience during the year. Data collection began in May 2022 and ended in July 2022. We conducted this survey in accordance with Slovenian educational research guidelines and regulations, provided that no personal or sensitive data were collected. When we approached schools, we obtained consent to participate in this study from elementary school principals who were familiar with the purpose and description of this study. We then obtained consent from teachers who were willing to participate in this study after the requirements of the survey were explained to them. Before the survey began, parents of all participating students provided written consent to the schools. Because the survey was completely anonymous and voluntary, we had no control over the respondents who answered the call via social media or from their peers.

2.2. Participants and Respondents

The response rates were as follows: 1133 visited the survey, 537 (48%) continued, 490 (44%) gave partial, and 356 (32%) gave all responses with irregularly positioned missing data. Because we wanted to analyse only the records of 8th and 9th grade elementary school students, we deleted the records of anyone who did not declare themselves as a student in these two grades, leaving the records of 313 respondents. The listwise deletion was confirmed by the results of Little’s MCAR test (chi-square = 1126.985, df = 1235, p = 0.987). The sample of 313 respondents included 196 (62.6%) eighth graders and 117 (37.4%) ninth graders, including 136 (43.6%) boys and 176 (56.4%) girls. Records remaining later with random missing data were excluded from statistical analyses on a case-by-case basis. Therefore, the final number of records that could be included in a structural equation model (SEM) was 312.

2.3. Description of the Instruments

The survey was complex, and several scales were used as instruments. The items that made up each scale and the results of the statistical analyses are presented in the form of tables in the Results section. The instruments were as follows:
1. Frequency analysis of responses to the question about ownership of ICT devices.
We asked students about ownership of smartphones, tablets, and personal computers. The response format was yes or no. The results are shown in Table 1.
2. Frequency analysis of the use of a smartphone and/or tablet computer (tablets) during the last school year in the lessons of the following compulsory subjects in 8th and 9th grade.
We asked students, “During the last school year, how often did you use a smartphone and/or tablet computer (tablets) in class in the following 8th and 9th grade school subjects?” A list of ten compulsory subjects was offered. The response format was a 6-point scale with the options (1) never; (2) very rarely; (3) rarely; (4) often; (5) frequently; and (6) very frequently. The results of the statistical analysis are presented in Table 2.
3. Frequency analysis of responses to the question about first-time use of smartphones for educational purposes.
Students were presented with a set of four numbers related to the grade levels of 9-year Slovenian compulsory school with instructions to circle the appropriate number. Slovenian elementary school is divided into three thirds (cycles). The first two three-year cycles can be recognized as primary grades (ISCED 1) and, with the exception of the sixth grade, are mostly taught by primary teachers who teach all subjects. The last three-year cycle is taught by subject teachers and can be classified as lower secondary (ISCED 2). The fourth number was labeled “never.” The items and results are presented in Table 3.
4. Satisfaction (SAT) with smartphone use in education.
Satisfaction with smartphone use in education was assessed using the modified 5-item instrument based on flow theory [40] and was applied in slightly different versions and contexts than in the studies by [41,42,43,44]. Satisfaction with a device or service can be considered a key factor in continued or discontinued use of a technology or service [45]. It is based on personal experience, and both positive and negative events can influence satisfaction. Satisfaction is a construct from the expectancy–confirmation theory [35] and is used in models such as Bhattacherjee’s [34] as a predictor of the continuance intention to use information systems. We adapted the construct used in [43] to the use of smartphones in education. The text of the items and the mean values of the central tendencies are presented in Table 4 in the Results section.
5. Opinions about the influence of smartphones and tablets on the quality of schoolwork (QUAL).
Students were asked to tick their agreement that this was reflected in the eight items listed in Table 5 (provided in the Results section) due to smartphone use. The response format ranged from 1 (greatly reduced) to 5 (greatly increased). The instrument was compiled based on the authors’ reflective practice and, to the best of their knowledge, has not been used in this form in other published work. This construct was used as an outcome (endogenous) latent variable QUAL in our models (Figure 1 and Figure 2).
6. Opinions and reflections on the use of smartphones in biology education?
The purpose of this section was to determine opinions about the use of smartphones and tablets in the biology classroom. The text of the items and the mean values of the central tendencies are presented in Table 6 provided in the Results section.
The instrument took the form of a table with a 7-point response format ranging from 1 (completely disagree) to 7 (completely agree) and 4 (neutral opinion). The constructs sought with the instrument were adopted from the numerous published works exploring the adoption and intentions as well as barriers to the adoption of various educational technologies in the classroom [36,37,38,43]. The formation of the constructs is rooted in a number of technology acceptance theories. Among the theories, we would like to highlight the Technology Acceptance Model [32], the Unified Theory of Acceptance and Use of Technology (UTAUT) [33], and the Continuance Intentions Theory [34] as well as their derivatives or extensions. Later, the constructs were used as latent (exogenous) predictor variables in a proposed model (Figure 1 and Figure 2). The instrument has several subscales (constructs) as follows:
Support (SUP)
The construct “support” (6 items) (Table 6) was an adaptation of the construct “organisational support” used in a study by Ploj Virtič [43], which at least potentially influences all stages of the technology adoption cycle as a promoter or repressor of technology use. The importance of pedagogical support was already recognised by [46] who stated that information and communication technology (ICT) in education is useless without “well-trained and motivated teachers”. Given the educational context and the age of the participants, we did not ask about support from the school administration or the school as an institution, but about support from teachers and parents.
Perceived usefulness (PU), perceived ease of use (PEOU), and attitudes (ATT)
All three constructs were borrowed and adapted from TAM [32,47]. Based on a meta-review, ref. [36] reported that the perceived ease of use tends to be a factor that can influence users’ attitudes toward using e-learning technology to the same extent for different types of users and types of e-learning technologies. The formulations used in [36,37] served as a basis for adaptation, taking into account that, in the case of our study, the difference between the original TAM and UTAUT is that the students in our sample had actual (for some of them unintentional during the pandemic COVID-19) experience with online distance learning [43]. Following the work of [37,43], we understood it as follows: (a) the perceived ease of use can be defined as the extent to which a person believes that using smartphones does not require effort; (b) the attitude toward smartphones was considered as the extent to which a person views smartphones positively or negatively; and (c) the perceived usefulness was considered as the extent to which a person recognizes smartphones as useful for solving educational tasks.
Perceived pedagogical impact (PPI)
Perceived pedagogical impact (PPI) was originally described as a teacher’s perception of how technology can support them in translating their pedagogical–didactic principles into classroom practices and contribute to students’ knowledge and skills [36,38,48,49]. To our knowledge, no studies were found that examined the perceived impact of PPI on students’ use of smartphones in the classroom or for school-related tasks. Therefore, PPI is defined in this study as students’ beliefs about how smartphone use in the classroom can improve the quality of learning outcomes.

2.4. Hypothesized Model

The construction of the model follows the principles of structural equation modeling (SEM) described in [50,51]. The model is shown graphically in Figure 1. Constructs (latent variables) are shown in the model nodes with an arrow at the top representing the hypothesized influence of one or another latent exogenous variable (constructs SUP; PU; PEOU; ATT; and PPI) on the endogenous latent variable QUAL. We predicted that all exogenous variables would correlate with each other. The correlations are shown as two-headed arrows and are not the subject of discussion. For the variable SAT, because not all items were answered by a student, responses were deleted listwise, so the model is based on 312 respondents. Each of the hypotheses presented in Figure 1 can be understood as follows: “The exogenous construct of interest (SUP, PU, PEOU, ATT, PPI) will statistically significantly influence the endogenous construct of interest (QUAL)”.

2.5. Statistical Analyses

The statistical analyses of each construct follow the same pattern. Using descriptive statistics tools, all items (variables) were tested for assumptions of normality by applying the Shapiro–Wilks test, skewness, and kurtosis. The results of the tests (which are not presented in the paper) led us to the use of nonparametric statistical tests and robust structural equation models (SEM). To establish the reliability of the constructs, McDonald’s omega was chosen, and principal component analysis (PCA) was used to examine deviations from unidimensionality of the constructs, which were later used as latent variables in the construction of structural models. The subsequent analysis was confirmatory factor analysis (CFA) for each of the constructs. Although analysis of the individual latent constructs is not the primary goal of SEM [50], the inclusion of these analyses allows for their potential use in follow-up studies as separate constructs.
Due to the ordinal nature of the items and the violation of the normality assumption (although inspection of skewness and kurtosis shows that the deviations are not so large as to prevent inclusion in SEM analyses using the maximum likelihood method [50,51], robust methods were used to estimate the models [52]. The method used was digital weighted least squares based on the polychoric correlation matrix. Indices TLI, SRMR, and RMSEA were reported. The cut of values showing appropriate fits are TLI > 0.90; SRMR < 0.08; and RMSEA < 0.08.

3. Results

3.1. Frequency Analysis of the Ownership of ICT

312 students reported owning ICT devices. From the data received and the summarised results in Table 1, 97.1% of them own a smartphone, and about 80% own a PC. Tablets are the least common (43.3%). From the results, we can conclude that the problems with ownership can be easily overcome even if the concept of BYOD (bring your own device) is used to introduce smartphones in schools or informal education.

3.2. Frequency Analysis of the Use of a Smartphone and/or Tablet Computer (Tablets) during the Last School Year in the Following 8th- and 9th-Grade School Subjects

Students should answer the question “How often did you use a smartphone and/or tablet computer (tablets) during the last school year in class in the following 8th and 9th grade school subjects?”
Table 2 shows that the mode of all subjects listed is the answer “never” with a range of 21.7% in biology and 63.9% in physical education. The median is in the range of “often” only in foreign languages. In all other subjects, with the exception of sports where the median is one, smartphone use is reported as rare and very rare. However, when summarising the results (results not shown), only 13 students (4.9%) indicated that they never use a smartphone at school. The median total number of uses across all subjects is 25, indicating that the majority of students rarely or very rarely use smartphones.

3.3. Frequency Analysis of Responses to the Question about First-Time Use of Smartphones for Educational Purposes

Table 3 shows that basically all students (99.4%) already use smartphones for schoolwork. Some of them (9.6%) reported using smartphones as early as the first elementary grades, i.e., between the ages of 6 (7) and 8 (9). The peak value is between the 4th and 6th grade (age range from 9 to 12 years), which means that almost 70% of the students have had such experiences and basically all of them have been exposed to its use before the end of elementary school, which happens at the age of 15.

3.4. Satisfaction with Smartphone Use in the Classroom

From Table 4, we can see that students rated all items of the construct very highly. At the top is the recognition of smartphone use in the classroom as fun and at the bottom as educational. However, the differences are small. When tested for unidimensionality, only one component was extracted, explaining 68.5% of the variance (McDonald’s omega = 0.886; eigenvalue = 3.43). When tested for normality of distribution, all items were skewed and did not meet assumptions of normality (Shapiro–Wilks p < 0.001). Based on DWLS analysis, the fit indices of the construct are as follows: SRMR = 0.030; RMSEA = 0.065 (CI95% = 0.012–0.115, p = 0.225), TLI = 0.997; and AVE = 0.694).

3.5. Opinions on the Impact of Smartphones and Tablets on the Quality of Schoolwork

This construct (QUAL) was used as a latent (endogenous) outcome variable in our model (Figure 1). Students were asked to mark their agreement that this was reflected in the eight items listed in Table 5 because of smartphone use. The response format ranged from 1 (greatly reduced) to 5 (greatly increased).
Table 5 shows that, according to the students, only Internet skills have increased a lot, while the results of the other items are mostly between 3 and 4 on a scale, which means that, in their opinion, the use of smartphones has a small impact. The differences between all the given options are small, and at the end of the scale, there are items that can be considered important for science education. The neutral position (3) is assigned to laboratory skills.
When the items are considered as latent variables, according to PCA, a component explaining 50.2% of the variance was extracted (eigenvalue = 4.02; McDonald’s delta = 0.858). The fit indices are not perfect, but decent, and it was possible to increase them by deleting some items, which we did not do to preserve diversity. They are as follows: SRMR = 0.059; RMSEA = 0.098 (CI95% = 0.074–0.123; p < 0.001), TLI = 0.984; and AVE = 0.483).

3.6. Students’ Views on the Use of Smartphones and Tablets in Biology Classes

Students’ views on the use of smartphones and tablets in biology classes (N = 312) were examined using the theoretical constructs SUP, PU, PEOU, ATT, and PPI.
From the results in Table 6, it appears that all constructs are appropriate enough to be used as a combination or individually in follow-up studies in similar contexts. In addition, it is felt that students recognize the positive effects of smartphones in biology classes; however, the averaged results show that these are not extremely positive. However, use in class is generally not well supported.

3.7. Hypothetical Model Representing the Effects of the Constructs of Interest (SUP, PU, PEOU, ATT, and PPI) on the Construct QUAL

Using SEM analysis, we sought to answer the research question, “Do the opinions represented by the latent variables (SUP, PU, PEOU, ATT, PPI) influence students’ opinions about the quality of smartphone-based schoolwork (QUAL)?” (Figure 2).
The proposed model (Figure 2) shows a reasonable fit, and the reliability of the included constructs, calculated as AVE, is above the proposed threshold of 0.5 for all constructs except SUP (AVE = 0.448). This problem could be solved by deleting some items, but we did not want to use this option because of information reduction. The values of the fit indices are as follows: SRMR = 0.0052; RMSEA = 0.049 (95% CI = 0.0044–0.054; p = 0.667); and TLI = 0.997. With the model presented in Figure 2, it was possible to explain around 70% of the variance QUAL (R2 QUAL= 0.68).

4. Discussion

According to our results, the majority of students are already familiar with smartphones before the end of compulsory education and own them or at least share them with siblings (Table 1). This result is not surprising, because it only confirms what can be considered general knowledge and already reported findings. According to the report of the Slovenian Statistical Office [53] for the year 2020, 97% of the population aged 16–74 use cell phones, and 81% of them use smartphones. We do not have sufficient surveys on smartphone (tablet) ownership among Slovenian preschool and primary school children, but from the different studies [54,55,56], we can infer that even primary school children are already heavy users of screen media. We can only speculate that Slovenians are in line with findings from other developed countries. For example, in a 2020 Pew Center study (www.pew-center.com accessed on 1 March 2023), 49% of children were exposed to smartphones and 35% to tablets before age 2. By age 11, these numbers increase to 78% for tablets and 67% for smartphones. Problematic smartphone use has been reported in preschool children [57], and there is evidence that higher exposure to screens is negatively correlated with school achievement [54] and information literacy [11]. Although preschoolers are not a study group in our study, findings related to them can be considered predictors of habits later in life. Most children in our study reported already using smartphones for schoolwork or in class (Table 3), some of them even (about 10%) in the first three grades before the age of 9, and almost all of them by the end of compulsory education. It is not possible to infer from these results whether they did it on their own initiative or upon instruction from teachers. However, if we combine the results with the use of smartphones in different subjects (Table 2), where large differences can be seen, we can safely assume that smartphones have found their way into education. At this point, we cannot say whether the small number of students who did not report using smartphones in any subject was due to a ban on use in their schools or a coincidence. The median of the total number of uses in all subjects is 25, suggesting that the majority of students rarely or very rarely use smartphones. We cannot speculate on whether this is due to school policy or other factors that might lead teachers to use them or not.
Therefore, answering dilemma if smartphones should be banned from schools may start from the findings that many children use them even before entering compulsory education. It can be concluded that at these levels of school do not influence the use of smartphones and other screen media in preschool children, or at least those who do not visit kindergartens.
The answer to the dilemma of whether smartphones should be banned in schools can therefore start from the observation that many children use them even before they enter compulsory education. It can be concluded that schools have no influence on the use of smartphones and other screen media among preschool children, or at least among children who do not attend kindergarten. As children get older, smartphone use only increases, so the position of schools may be to regulate exposure to smartphones. In our opinion, students in compulsory schools should be taught about the smart use of smartphones so that they can be used at home to solve problems and in a safe manner. We recognise that the extra time spent on smartphones can contribute to all the reported problems associated with their use alone or cumulatively with other screen devices [3,6], but we believe that the harm of not educating them about inappropriate smartphone use in informal settings is much greater.
As biology educators, we were primarily interested in the possibilities of smartphone use in biology classes that not only promote academic outcomes but can also be extended to lifelong skills. From the results in Table 2, about 23% of students reported using smartphones frequently and very frequently in biology classes, which is almost equal to the number of those who never use them (about 22%). With respect to the experience and practice of testing smartphones, in training prospective teachers, and working with students [58], we found that smartphones can, in principle, be used in a variety of ways in biology classrooms, but they cannot replace professionally developed devices such as data loggers or microscopes. However, they can be useful, practical, multipurpose tools that can be found by hand when needed. Here are some published examples of such potentially useful uses of smartphones that can be introduced in schools for the benefit of students and the public. Basically all smartphones have an integrated camera that can be used as a documentation and communication tool in large-scale citizen science projects, such as monitoring roadkill [59] or trends important to farmers [60] and invasive plant monitoring [61], to name a fraction. The second line can be used in the field of health, traditionally a part of human biology courses. Many smartphones can be used alone or augmented by external devices to collect data such as heart rate, oxygen saturation, blood glucose, and the like [62,63]. The school’s role in health education can be not only to inform students of the pitfalls in data collection, but also to interpret the data, which have their roots in biology and physiology. The final, but no less important, point may be their use in relation to outdoor activities, where skills such as using a GPS or identifying [64] venomous and poisonous organisms may be of vital interest [65,66]. However, in order to empower teachers to use smartphones wisely, they should be provided with information about such opportunities as well as workshops and teaching materials, which are probably the most important barriers [56] to the adoption of any technology in education. The question of how to practically solve this problem is beyond the scope of this paper.
For classroom work or related to instruction (homework), students may or may not use technology or services, even if they are available with various limitations and barriers [30]. Studies of barriers to smartphone adoption in education are fewer [6,67], but from empirical practice, we can readily say that ownership of the technology and familiarity with its general use as well as negative attitudes are no longer factors to consider. However, there are some emerging barriers to smartphone use in the classroom or for homework. The first barrier may be a general restriction on teachers’ use of technology in the classroom, which is beyond the control of students and teachers alike. The second level is teachers, who have autonomy to decide whether or not to use devices, and the third level may be parents restricting use at home. Parents and teachers are not considered in this study.
In this study, students are the target audience because, without knowing their opinion, we can easily fall into a trap and make two mistakes. The first is to introduce technology with little or no benefit or even with severe side effects. The second can be the opposite: not introducing technology that has the potential to improve educational outcomes. After all, debates about smartphone adoption range from prophesying disaster to praising it, or at least using it cautiously.
The use of mobile devices among secondary school students is increasingly more common; however, mobile learning and mobile technology acceptance research in secondary education is still limited. Different studies [7,55] revealed that mobile phones are the predominant devices which are used daily by almost all students. Satisfaction with smartphone use in education may be an important predictor of intention to continue using a technology or to abandon it [34]. The construct (latent variable) we used to measure satisfaction was found to be appropriate. However, the problem with applying the underlying theories to inferences and predictions is that these theories are based on voluntary use of a technology or service, which is usually not the case in education. Therefore, caveats and deeper elaboration are needed to find out the consequences that students rank usage as entertaining in the first place and educational only in the last place.
From our results, it appears that lower secondary students show a high level of satisfaction with the use of smartphones in educational contexts, so satisfaction with use cannot be considered a barrier. The open-ended question asks whether this statement applies to all educational applications and whether there will be changes in the future. Nonetheless, at this point in time, the results of this study may be of importance for future directions and conversations about the smart adoption of smartphones in education.
The majority of studies investigated processes associated with teaching and learning, for example, collaboration, constructivist learning, or investigating the design and features of apps used to enhance learning [7].
In looking at the student-perceived quality of smartphone-enhanced education, we found ourselves in indeterminate territory. The quality components measured (Table 5) can be viewed as the attainment of lifelong skills, loosely aligned with lists of 21st century skills combined with digital skills [68], motivation [69], and scientific literacy [70]. According to the students, only Internet skills have increased greatly, while the results of the other items are mostly slightly above the neutral position, which means that the use of smartphones has only a small impact according to the students. At the beginning of the series is motivation, and at the end are two items (developing practical and laboratory skills) that can be considered important for science education. When the items are considered as latent variables and according to PCA, a component explaining 50.2% of the variance was extracted (eigenvalue = 4.02; McDonald’s delta = 0.858). The fit indices are not perfect but acceptable, and it was possible to increase them by deleting some items, which we did not do to preserve diversity. They are as follows: SRMR = 0.059; RMSEA = 0.098 (CI95% = 0.074–0.123; p > 0.001), TLI = 0.984; and AVE = 0.483). The conclusion may be that smartphones are not something that can significantly improve educational outcomes, but there are niches where their usability should be explored.
To answer the research question, “What are their opinions and thoughts about using smartphones in biology class?”, the latent variables SUP, PU, PEOU, ATT, and PPI were examined. Several insights can be derived from the results presented in Table 6 that may be relevant to future considerations of smartphone use in biology classrooms and most likely in other subjects as well. If we consider the responses independently of the theoretical construct, we can see that the first three responses (PEOU1; ATT4; and ATT4) (Table 6) show that the majority of students are familiar with the use of smartphones, and they like the idea of using them in class. It should be mentioned that all other responses, except four, are on average above the mean four in our scale, which provides a lot of room for improvement. At the bottom of the range are the responses reflecting the lack of support from teachers and parents as well as an item showing that smartphone use does not require mental effort. When analyzing the construct SUP, where scores were lowest, ambiguity and mixed messages from parents and teachers can be seen. On the one hand, students find support for technical issues and are encouraged to use them for homework. On the other hand, parents do not seem to have much interest in how they are used. In addition to SUP, the lowest scores were given to items in the construct PU. The results suggest that the problem does not lie in the introduction of technology, but the question of how to integrate smartphones sensibly and effectively into (biology) lessons should be addressed (intelligent use of smartphones).
When asked whether the opinions represented by the latent variables (SUP, PU, PEOU, ATT, and PPI) influence students’ opinions about the quality of smartphone-assisted schoolwork (QUAL), the proposed model shows a reasonable fit. However, since the correlations between the constructs were found to be high, which cannot be said for the individual items (correlation matrix not shown), the next step in the research should be to develop alternative models, possibly based on constructs other than ours. Due to the insufficient number of participants in the current study, we did not proceed in this manner.
From the values presented in Figure 2, it can be seen that only the perceived educational influence (PPI) has a slightly larger influence on the dependent variable (QUAL), followed by PEOU, where the influence is small, and ATT and PU, where the influence is insignificant. It is surprising that teacher and parent support have a small and even negative influence.

5. Conclusions

The first conclusion that emerges from the results of the recent study is that virtually all students own smartphones and have used them for school-related tasks before the age of fifteen. A smaller number of them used smartphones for such purposes before the age of nine. The practical consequence of this finding may be that schools should not be seen as isolated islands where smartphones are banned. Schools need to become a place where students learn to use them as multi-purpose tools to solve life problems by solving school-designed tasks that support learning outcomes by turning them into lifelong skills.
The second conclusion is that the use of smartphones in schools is still in its early stages, which can be seen as a result of the early initiatives of some teachers. Overall, we can conclude that the actual impact of smartphone use in biology classes recently is small. Neither the students and their digital skills nor the availability of the technology can be blamed for this low impact. A bottleneck can be identified in the recognition of the perceived dangers of the side effects from the general overuse of smartphones by gatekeepers at the general and individual levels, which may discourage use even if it can be justified. However, to justify the usability and potential impact of smartphones, they should be tested under authentic conditions. Additional efforts should be made to explore their full potential and the gaps that should be filled by formal education because leaving students to their own devices is the worst solution, resulting in a permanent lack of skills, such as the ability to select and interpret information provided through the media.
The third conclusion that emerged from the review of the SEM model is that only perceived pedagogical impact (PPI) has a somewhat greater influence on the perceived quality of learning outcomes. Teacher and parent support is even a negative predictor. Therefore, inventing, developing, and testing tasks in which smartphones can have a greater impact on PPI compared to alternative methods of schoolwork must be a priority, first on a small scale and later in large-scale studies. The results of such studies can be used to support and translate into regulations’ smart and meaningful use of smartphones, both in and out of school. However, before any decision to ban them from schools is made, all smartphone options and their potential side effects should be carefully considered, and evidence-based decisions must become the norm.

6. Limitations of this Study

Limitations arise from the research methodology because respondents were self-selected and because the unidentified majority of students did not respond. We can only speculate that they had the same experiences and opinions and acted in accordance with those who did respond. However, it is impossible to compensate for this possible weakness in the study design. We can only speculate about the generalizability of the results to the entire student population and to students with special needs and about the transferability of the findings from biology to other subjects. The same applies to the transferability of the results to the international arena and to upper levels of education.
Problems with the content validity of the model and the constructs included could be an issue; however, we tried to avoid these by using tested instruments and carefully reviewing the constructs. The same applies to the questions on smartphone use; however, self-selection based on knowledge of smartphone use and digital literacy cannot be considered a limitation due to respondents’ daily use of smartphones.

Author Contributions

V.L. and A.Š. conceived this study and contributed to the design of this study and the final version of the questionnaire. V.L. maintained the online data collection. V.L. performed and A.Š. oversaw the data preparation for the statistical analysis. V.L. prepared a draft and A.Š. led and supervised the writing of the paper. A.Š. and V.L. contributed to the study design, data analyses, and final paper editing. Both authors had full access to all the data in the study and had final responsibility for the decision to submit for publication. All authors have read and agreed to the published version of the manuscript.

Funding

The research as the source of data for the publication was supported by the Slovenian Research Agency, funds SN0115 (Programme for young researchers (V.L.) and P2-0057, SI, Information systems (A.Š.). The content of this article represents the views of the authors only and is their sole responsibility; it cannot be considered to reflect the views of the funding organization.

Institutional Review Board Statement

Participants were informed about various aspects of this study, including their rights to voluntarily participate and withdraw from this study. Approval to conduct this study as a part of a doctoral thesis of the first author under supervision of the second author was obtained from the Senate of the University of Maribor.

Informed Consent Statement

Not applicable.

Data Availability Statement

Supporting data and results not included in the paper can be obtained upon reasonable request from the authors of this study.

Conflicts of Interest

The authors state that no conflict of interest exist. We declare no competing interest.

References

  1. Boyd, D. It’s Complicated: The Social Lives of Networked Teens; Yale University Press: London, UK, 2014. [Google Scholar]
  2. Reid, A.J.; Reid, A.J.; Vigil. Smartphone Paradox; Springer: London, UK, 2018. [Google Scholar]
  3. Spitzer, M. Information technology in education: Risks and side effects. Trends Neurosci. Educ. 2004, 3.3–4, 81–85. [Google Scholar] [CrossRef]
  4. Macur, M. The Impact of Digitalisation on Slovenian Primary School Students in Eighth Grade. Res. Soc. Chang. 2021, 13, 174–180. [Google Scholar] [CrossRef]
  5. Kuhn, J.; Vogt, P. Smartphones and Tablet PCs: Excellent Digital Swiss Pocket Knives for Physics Education. Smartphones as Mobile Minilabs in Physics: Edited Volume Featuring More Than 70 Examples from 10 Years the Physics Teacher-Column iPhysicsLabs; Springer International Publishing: Cham, Switzerland, 2022; pp. 3–10. [Google Scholar]
  6. Livingston, A. Smartphones and other mobile devices: The Swiss army knives of the 21st century. Educ. Q. 2004, 27, 46–52. [Google Scholar]
  7. Bano, M.; Zowghi, D.; Kearney, M.; Schuck, S.; Aubusson, P. Mobile learning for science and mathematics school education: A systematic review of empirical evidence. Comput. Educ. 2018, 121, 30–58. [Google Scholar] [CrossRef]
  8. Zakon o osnovni šoli-ZOsn, Z. 2016. Available online: http://pisrs.si.pis.web/pregledPredpisa (accessed on 1 March 2023).
  9. Rotherham, A.J.; Willingham, D.T. “21st-century” skills. Am. Educator. 2010, 17, 17–20. [Google Scholar]
  10. Norris, C.; Hossain, A.; Soloway, E. Using smartphones as essential tools for learning: A call to place schools on the right side of the 21st century. Educ. Technol. 2011, 51, 18–25. [Google Scholar]
  11. Dolenc, K.; Šorgo, A. Information literacy capabilities of lower secondary school students in Slovenia. J. Educ. Res. 2020, 113, 335–342. [Google Scholar] [CrossRef]
  12. Šorgo, A.; Bartol, T.; Dolničar, D.; Boh Podgornik, B. Attributes of digital natives as predictors of information literacy in higher education. Br. J. Educ. Technol. 2017, 48, 749–767. [Google Scholar] [CrossRef]
  13. Taylor, R.P. Reflections on the computer in the school. Contemp. Issues Technol. Teach. Educ. 2003, 3, 253–274. [Google Scholar]
  14. Taylor, R.P. The Computer in the School: Tutor, Tool, Tutee; Teachers College Press: New Yor, NY, USA, 1980; pp. 1–10. [Google Scholar]
  15. Chou, C.; Yu, S.C.; Chen, C.H.; Wu, H.C. Tool, toy, telephone, territory, or treasure of information: Elementary school students’ attitudes toward the Internet. Comput. Educ. 2009, 53, 308–316. [Google Scholar] [CrossRef]
  16. Barak, M. Science teacher education in the twenty-first century: A pedagogical framework for technology-integrated social constructivism. Res. Sci. Educ. 2017, 47, 283–303. [Google Scholar] [CrossRef]
  17. Abd Karim, R.; Abu, A.G. Using mobile-assisted mind mapping technique (mammat) to improve writing skills of esl students. J. Soc. Sci. Humanit. 2018, 1, 1–6. [Google Scholar]
  18. Cross, S.; Sharples, M.; Healing, G.; Ellis, J. Distance learners’ use of handheld technologies: Mobile learning activity, changing study habits, and the ‘place’of anywhere learning. Int. Rev. Res. Open Dis. Learn. 2019, 20, 222–241. [Google Scholar]
  19. Milrad, M.; Spikol, D. Anytime, anywhere learning supported by smart phones: Experiences and results from the MUSIS project. Educ. Technol. Soc. 2007, 10, 62–70. [Google Scholar]
  20. Tiippana, N.; Korhonen, T.; Hakkarainen, K. Joining networked society: Integrating Academic Service-Learning into formal school. Pedagog. Cult. Soc. 2022, 1–24. [Google Scholar] [CrossRef]
  21. Shraim, K.; Crompton, H. Perceptions of using smart mobile devices in higher education teaching: A case study from Palestine. Contemp. Educ. Technol. 2015, 6, 301–318. [Google Scholar] [CrossRef]
  22. Gueron-Sela, N.; Shalev, I.; Gordon-Hacker, A.; Egotubov, A.; Barr, R. Screen media exposure and behavioral adjustment in early childhood during and after COVID-19 home lockdown periods. Comput. Hum. Behav. 2023, 140, 107572. [Google Scholar] [CrossRef]
  23. Radesky, J.S.; Weeks, H.M.; Ball, R.; Schaller, A.; Yeo, S.; Durnez, J.; Tamayo-Rios, M.; Epstein, M.; Kirkorian, H.; Coyne, S.; et al. Young children’s use of smartphones and tablets. Pediatrics 2020, 146, e20193518. [Google Scholar] [CrossRef]
  24. Kabali, H.K.; Irigoyen, M.M.; Nunez-Davis, R.; Budacki, J.G.; Mohanty, S.H.; Leister, K.P.; Bonner, R.L., Jr. Exposure and use of mobile media devices by young children. Pediatrics 2015, 136, 1044–1050. [Google Scholar] [CrossRef] [Green Version]
  25. Valverde-Berrocoso, J.; Acevedo-Borrega, J.; Cerezo-Pizarro, M. Educational technology and student performance: A systematic review. Front. Educ. 2022, 7, 916502. [Google Scholar] [CrossRef]
  26. Pelgrum, W.J. Obstacles to the integration of ICT in education: Results from a worldwide educational assessment. Comput. Educ. 2001, 37, 163–178. [Google Scholar] [CrossRef]
  27. Šorgo, A.; Verčkovnik, T.; Kocijančič, S. Information and communication technologies (ICT) in biology teaching in Slovenian secondary schools. Eurasia J. Math. Sci. Technol. 2010, 6, 37–46. [Google Scholar] [CrossRef]
  28. Rogers, E.M.; Singhal, A.; Quinlan, M.M. Diffusion of Innovations. In An Integrated Approach to Communication Theory and Research; Routledge: Oxfordshire, UK, 2014; pp. 432–448. [Google Scholar]
  29. Jurkovič, V. Online informal learning of English through smartphones in Slovenia. System 2019, 80, 27–37. [Google Scholar] [CrossRef]
  30. Svetec, M.; Repnik, R.; Arcet, R.; Klemenčič, E. Educational technology at the study program of educational physics at the University of Maribor in Slovenia. Role Technol. Educ. 2020, 1–16. [Google Scholar] [CrossRef] [Green Version]
  31. Volk, M.; Cotič, M.; Zajc, M.; Starcic, A.I. Tablet-based cross-curricular maths vs. traditional maths classroom practice for higher-order learning outcomes. Comput. Educ. 2017, 114, 1–23. [Google Scholar] [CrossRef]
  32. Davis, F.D. Perceived usefulness, perceived ease od use, and user acceptance od inromation technology. Mis. Quart. 1989, 13, 319–340. [Google Scholar] [CrossRef] [Green Version]
  33. Venkatesh, V.; Morris, M.G.; Davis, G.B.; Davis, F.D. User acceptance of information technology: Toward a unified view. MIS Q. 2003, 27, 425–478. [Google Scholar] [CrossRef] [Green Version]
  34. Bhattacherjee, A. Understanding information systems continuance: An expectation-confirmation model. MIS Q. 2001, 25, 351–370. [Google Scholar] [CrossRef]
  35. Oliver, R.L. A cognitive model of the antecedents and consequences of satisfaction decisions. J. Mark. Res. 1980, 17, 460–469. [Google Scholar] [CrossRef]
  36. Šumak, B.; Heričko, M.; Pušnik, M. A meta-analysis of e-learning technology acceptance: The role of user types and e-learning technology types. Comput. Hum. Behav. 2011, 27, 2067–2077. [Google Scholar] [CrossRef]
  37. Šumak, B.; Šorgo, A. The acceptance and use of interactive whiteboards among teachers: Differences in UTAUT determinants between pre-and post-adopters. Comput. Hum. Behav. 2016, 64, 602–620. [Google Scholar] [CrossRef]
  38. Chroustova, K.; Bilek, M.; Šorgo, A. Validation of theoretical constructs toward suitability of educational software for Chemistry education: Differences between users and nonusers. J. Balt. Sci. Educ. 2017, 16, 873. [Google Scholar] [CrossRef]
  39. Šorgo, A.; Špernjak, A. Practical work in biology, chemistry and physics at lower secondary and general upper secondary schools in Slovenia. Eurasia J. Math. Sci. Technol. 2012, 8, 11–19. [Google Scholar] [CrossRef]
  40. Csikszentmihalyi, M. Flow: The Psychology of Optimal Experience. J. Leis. Res. 1990, 24, 93–94. [Google Scholar]
  41. Debevc, M.; Weiss, J.; Šorgo, A.; Kožuh, I. Solfeggio learning and the influence of a mobile application based on visual, auditory and tactile modalities. Br. J. Educ. Technol. 2020, 51, 177–193. [Google Scholar] [CrossRef]
  42. Nijs, L.; Leman, M. Interactive technologies in the instrumental music classroom: A longitudinal study with the Music Paint Mach. Comput. Educ. 2014, 73, 40–59. [Google Scholar] [CrossRef]
  43. Ploj Virtic, M.; Dolenc, K.; Šorgo, A. Changes in Online Distance Learning Behaviour of University Students during the Coronavirus Disease 2019 Outbreak, and Development of the Model of Forced Distance Online Learning Preferences. Eur. J. Educ. 2021, 10, 393–411. [Google Scholar] [CrossRef]
  44. Šorgo, A.; Crnkovič, N.; Gabrovec, B.; Cesar, K.; Selak, Š. Influence of forced online distance education during the covid-19 pandemic on the perceived stress of postsecondary students: Cross-sectional study. J. Med. Internet Res. 2022, 24, e30778. [Google Scholar] [CrossRef]
  45. Thong, J.Y.; Hong, S.J.; Tam, K.Y. The effects of post-adoption beliefs on the expectation-confirmation model for information technology continuance. Int. J. Hum. Comput. 2006, 64, 799–810. [Google Scholar] [CrossRef]
  46. Hepp, P.; Hinostroza, J.E.; Laval, E.; Rehbein, L. Technology in Schools: Education, ICT and the Knowledge Society; World Bank, Distance & Open Learning and ICT in Education Thematic Group, Human Development Network, Education: Washington, DC, USA, 2004; pp. 30–47. [Google Scholar]
  47. Bagozzi, R.P.; Davis, F.D.; Warshaw, P.R. Development and test of a theory of technological learning and usage. Hum. Relat. 1992, 45, 659–686. [Google Scholar] [CrossRef] [Green Version]
  48. Anđić, B.; Šorgo, A.; Stešević, D.; Lavicza, Z. The factors which influence the continuance intention of teachers in using the interactive digital identification key for trees in elementary school science education. Eurasia J. Math. Sci. Technol. Educ. 2022, 18, em2140. [Google Scholar] [CrossRef]
  49. Ertmer, P.A. Teacher pedagogical beliefs: The final frontier in our quest for technology integration? Educ. Technol. Res. 2005, 53, 25–39. [Google Scholar] [CrossRef]
  50. Kline, R.B. Principles and Practice of Structural Equation Modeling; Guilford Publications: New York, NY, USA, 2015. [Google Scholar]
  51. Byrne, B.M. Structural Equation Modeling with AMOS: Basic Concepts, Applications, and Programming; Routledge: Oxfordshire, UK, 2016. [Google Scholar]
  52. Li, C.H. The performance of ML, DWLS, and ULS estimation with robust corrections in structural equation models with ordinal variables. Psychol. Methods 2016, 21, 369. [Google Scholar] [CrossRef]
  53. SURS. 2020. Available online: https://www.stat.si/statweb (accessed on 1 March 2023).
  54. Macuh, B.; Raspor, A.; Sraka, M.; Kovačič, A. Media exposure and education of first to six grade children from Slovenia-parent opinions. Int. J. Cogn. Res. Sci. Eng. 2018, 6, 49. [Google Scholar] [CrossRef] [Green Version]
  55. Nikolopoulou, K. Mobile learning usage and acceptance: Perceptions of secondary school students. J. Comput. Educ. 2018, 5, 499–519. [Google Scholar] [CrossRef]
  56. Nikolopoulou, K.; Gialamas, V.; Lavidas, K. Mobile learning-technology barriers in school education: Teachers’ views. Technol. Pedagog. Educ. 2022, 1–16. [Google Scholar] [CrossRef]
  57. Park, J.H.; Park, M. Smartphone use patterns and problematic smartphone use among preschool children. PLoS ONE 2021, 16, e0244276. [Google Scholar] [CrossRef]
  58. Lang, V.; Senekovič, J.; Majcen, Š.; Šorgo, A. Smartphone as a coagulation sensor. Dianoia 2022, 6, 37–50. [Google Scholar]
  59. Vercayie, D.; Herremans, M. Citizen science and smartphones take roadkill monitoring to the next level. Nat. Conserv. 2015, 11, 29–40. [Google Scholar] [CrossRef] [Green Version]
  60. Dehnen-Schmutz, K.; Foster, G.L.; Owen, L.; Persello, S. Exploring the role of smartphone technology for citizen science in agriculture. Agron. Sustain. Dev. 2016, 36, 1–8. [Google Scholar] [CrossRef] [Green Version]
  61. Starr, J.; Schweik, C.M.; Bush, N.; Fletcher, L.; Finn, J.; Fish, J.; Bargeron, C.T. Lights, camera… citizen science: Assessing the effectiveness of smartphone-based video training in invasive plant identification. PLoS ONE 2014, 9, e111433. [Google Scholar] [CrossRef] [PubMed]
  62. Lee, J.H. Future of the smartphone for patients and healthcare providers. Healthc. Inform. Res. 2016, 22, 1–2. [Google Scholar] [CrossRef] [PubMed] [Green Version]
  63. Mosa, A.S.M.; Yoo, I.; Sheets, L. A systematic review of healthcare applications for smartphones. BMC Med. Inform. Decis. Mak. 2012, 12, 67. [Google Scholar] [CrossRef] [Green Version]
  64. Jeno, L.M.; Grytnes, J.A.; Vandvik, V. The effect of a mobile-application tool on biology students’ motivation and achievement in species identification: A Self-Determination Theory perspective. Comput. Educ. 2017, 107, 1–12. [Google Scholar] [CrossRef]
  65. Rogers, A.G.; Leung, Y.F. Smarter long-distance hike: How smartphones shape information use and spatial decisions on the Appalachian Trail. Int. J. Wilderness 2020, 26, 88–103. [Google Scholar]
  66. Sabitha, P.; Bammigatti, C.; Deepanjali, S.; Suryanarayana, B.S.; Kadhiravan, T. Point-of-care infrared thermal imaging for differentiating venomous snakebites from non-venomous and dry bites. PLoS Negl. Trop. Dis. 2021, 15, e0008580. [Google Scholar] [CrossRef]
  67. Webster, T.E.; Paquette, J. “My other hand”: The central role of smartphones and SNSs in Korean students’ lives and studies. Comput. Hum. Behav. 2023, 138, 107447. [Google Scholar] [CrossRef]
  68. Van Laar, E.; Van Deursen, A.J.; Van Dijk, J.A.; De Haan, J. The relation between 21st-century skills and digital skills: A systematic literature review. Comput. Hum. Behav. 2017, 72, 577–588. [Google Scholar] [CrossRef]
  69. Bureau, J.S.; Howard, J.L.; Chong, J.X.; Guay, F. Pathways to student motivation: A meta-analysis of antecedents of autonomous and controlled motivations. Rev. Educ. Res. 2022, 92, 46–72. [Google Scholar] [CrossRef]
  70. Roberts, D.A.; Bybee, R.W. Scientific literacy, science literacy, and science education. In Handbook of Research on Science Education; Routledge: Oxfordshire, UK, 2014; Volume II, pp. 559–572. [Google Scholar]
Figure 1. Hypothesized model presenting the statement understood as follows: “The exogenous construct of interest (SUP, PU, PEOU, ATT, PPI) will statistically significantly influence the endogenous construct of interest (QUAL)”.
Applsci 13 03379 g001
Figure 2. SEM model of the influence of the latent constructs on the perceived quality of learning outcomes.
Applsci 13 03379 g002
Table 1. Frequency analysis of the ownership of ICT (N = 312).
ItemYESNO
I own a smartphone303 (97.1%)9 (2.9%)
I own a tablet135 (43.3%)177 (56.7%)
I own a computer247 (79.2%)65 (20.8%)
I have to share my smartphone with siblings.24 (7.7%)288 (92.3%)
I have to share my tablet with siblings.87 (27.9%)225 (72.1%)
I have to share my computer with siblings.114 (36.5%)198 (63.5%)
Table 2. Frequency analysis of using a smartphone and/or tablet computer (tablets) during the last school year in class for the following 8th- and 9th-grade school subjects (N = 313, McDonald’s omega = 0.902). Results are presented as percentages and sorted by decreasing medians.
Subject123456MedianMode
Foreign language26.8 8.0 14.7 19.8 15.3 15.3 41
Biology21.717.616.620.814.78.631
Chemistry27.5 17.9 15.7 21.4 11.5 6.1 31
Geography31.9 11.5 14.4 19.8 12.1 10.2 31
Physics38.8 13.1 15.7 16.3 9.6 6.4 21
Slovenian41.9 11.5 9.6 16.9 10.2 9.9 21
Mathematics42.1 12.9 10.6 15.1 7.7 11.6 21
History44.1 13.4 10.2 13.7 7.7 10.9 21
Arts49.5 13.1 9.3 13.1 8.3 6.7 21
Sport63.9 13.4 6.7 6.7 4.5 4.8 11
Note: 1 = never; 2 = very rarely; 3 = rarely; 4 = often; 5 = frequently; 6 = very frequently.
Table 3. Frequency analysis of using a smartphone and/or tablet computer (tablets) during the last school year in class for the following 8th- and 9th-grade school subjects (N = 313, McDonald’s omega = 0.902). Results are presented as percentages and sorted by decreasing medians.
GradeFrequencyPercentCumulative Percent
1st–3rd309.69.6
4th–6th18759.769.3
7th–9th9430.099.4
never20.6100.0
Total313100.0
Table 4. Satisfaction with smartphone use in education. (N = 312). Results are ordered by decreasing means.
CodeSatisfactionMeanSDMedianModePCA
SAT1When we used a smartphone or tablet in class, it was fun.5.731.51670.824
SAT3When we used a smartphone or tablet in class, the use was understandable.5.611.53670.872
SAT4When we used a smartphone or tablet in class, it was easy to use.5.541.69670.743
SAT5When we used a smartphone or tablet in class, the use was successful.5.521.60670.870
SAT2When we used a smartphone or tablet in class, the use was educational.5.281.705.570.824
Table 5. Opinions about the influence of smartphones and tablets on quality of schoolwork (N = 313). Results are sorted by decreasing means.
CodeClaimMean SDMedian Mode PCA
QUAL6Internet skills4.290.91550.583
QUAL7Motivation for schoolwork3.551.2044.0.726
QUAL1Quality of content knowledge3.501.05440.797
Q5gSocial skills3.461.22330.660
QUAL4 Scientific skills3.401.04330.739
QUAL5Insight and experience in the scientific method of work3.341.09330.753
QUAL8Practical skills3.261.17330.652
QUAL3Laboratory skills3.081.09330.734
Table 6. Measures of central tendencies, reliability, and principal component loadings of constructs used later in SEM (response format 1 = completely disagree; 7 = completely agree) (N = 312).
CodeConstructsMeanMedModeSDPCA
SUPSupport:
McDonald’s omega = 0.794 (.802 if OS4 deleted); EV = 49.3%; Eigenvalue = 2.96; SRMR = 0.034: RMSEA = 0.031; TLI = 0.997
SUP1Teachers and parents support me using a smartphone or tablet for schoolwork.4.63541.870.697
SUP5Parents and teachers provide appropriate technical support for me to use a smartphone or tablet.4.39472.010.710
SUP2Teachers and parents are aware of the benefits of using a smartphone or tablet in the class.4.26441.780.778
SUP4My parents are very interested in how I use my smartphone for learning.3.91442.000.499
SUP3Teachers and parents appreciate my efforts to use a smartphone or tablet for schoolwork.3.95441.870.794
SUP6The teachers support me in using a smartphone or tablet.3.26311.880.693
PUPerceived usefulness:
McDonald’s omega = 0.904; EV = 77.3%; Eigenvalue = 3.09; SRMR = 0.034; RMSEA = 0.025; TLI = 1
PU4Using a smartphone or tablet is useful for learning biology.4.78571.850.806
PU1Using a smartphone or tablet improves my learning outcomes.4.50571.930.901
PU3Using a smartphone or tablet increases the efficiency of my learning.4.31442.020.913
PU2Using a smartphone or tablet improves my learning productivity.4.26472.080.893
PEOUPerceived ease of use:
McDonald’s omega = 0.814; EV = 47.7%; Eigenvalue = 2.86; SRMR = 0.048; RMSEA = 0.095; TLI = 0.987
PEOU1Using a smartphone or tablet is clear and understandable to me.6.22771.360.661
PEOU3I can easily find a solution to any problem that arises when using a smartphone or tablet.5.35671.600.755
PEOU4Using a smartphone or tablet in the classroom is easy.5.31671.940.745
PEOU6Smartphones or tablets provide convenient access to all the learning applications we need in class.5.31671.720.824
PEOU5A smartphone or tablet provides everything we need in class or for schoolwork.5.04571.890.787
PEOU2Using a smartphone or tablet requires a lot of mental effort from me.2.90311.75Excluded
ATTAttitude:
McDonald’s omega = 0.923; EV = 76.1%; Eigenvalue = 3.81; SRMR = 0.019; RMSEA = 0.030; TLI = 1.00
ATT3I like the idea of using a smartphone or tablet in class.5.53671.840.910
ATT4I find it convenient to use a smartphone or tablet in class.5.46671.830.920
ATT2Using a smartphone or tablet in class is a good idea.5.31671.860.910
ATT1I rate the lesson in which we used a smartphone or tablet as successfully implemented.5.26671.830.816
ATT5After using a smartphone or tablet in class, I have changed my mind about using smartphones and tablets for schoolwork for the better.4.85571.810.799
PPIPerceived Pedagogical impact:
McDonald’s omega: 0.946; EV = 72.6%; Eigenvalue = 5.81; SRMR = 0.020; RMSEA = 0.000; TLI = 1
PPI2Using a smartphone or tablet in class has a positive effect on my curiosity.5.22571.770.807
PPI4Using a smartphone or tablet in class has a positive effect on my creativity.4.99571.880.836
PPI1Using a smartphone or tablet in class has a positive effect on the learning process.4.86571.940.894
PPI7The use of a smartphone or tablet in class has a positive impact on the development of higher intellectual skills (e.g., critical thinking, analysis, problem solving).4.79571.880.833
PPI5Using a smartphone or tablet in class has a positive effect on my motivation to learn.4.77571.980.880
PPI8Using a smartphone or tablet in class has a positive impact on learning and active participation in class.4.76571.940.863
PPI6The use of a smartphone or tablet in class has a positive effect on my learning success.4.694.541.880.888
PPI3Using a smartphone or tablet in class has a positive effect on my concentration.4.34472.070.813
Note: Med—median, SD—standard deviation, PCA—principal component analysis, SUP—support, PU—perceived usefulness, PEOU—perceived ease of use, ATT—attitude, PPI—perceived pedagogical impact.
Disclaimer/Publisher’s Note: The statements, opinions and data contained in all publications are solely those of the individual author(s) and contributor(s) and not of MDPI and/or the editor(s). MDPI and/or the editor(s) disclaim responsibility for any injury to people or property resulting from any ideas, methods, instructions or products referred to in the content.

