Article

Combining Statistical, Displacement and Damage Analyses to Study Slow-Moving Landslides Interacting with Roads: Two Case Studies in Southern Italy

Department of Civil Engineering, University of Salerno, 84084 Fisciano, Italy
*
Author to whom correspondence should be addressed.
Appl. Sci. 2023, 13(5), 3368; https://doi.org/10.3390/app13053368
Submission received: 10 February 2023 / Revised: 3 March 2023 / Accepted: 5 March 2023 / Published: 6 March 2023
(This article belongs to the Special Issue New Frontiers in Natural Hazards and New Techniques)

Abstract

:

Featured Application

This paper presents a procedure for assessing—at the municipal scale—the level of risk (or attention required) of stretches of roads exposed to the activity of existing or potential slow-moving landslides. This procedure can be applied to support studies of road networks over large areas aimed at the prioritization of risk-mitigation measures and the identification of road sections requiring further investigation.

Abstract

Slow-moving landslides are widespread natural hazards that can affect social and economic activities, causing damage to structures and infrastructures. This paper aims at proposing a procedure to analyze road damage induced by slow-moving landslides based on the joint use of landslide susceptibility maps, a road-damage database developed using Google Street View images and ground-displacement measurements derived from the interferometric processing of satellite SAR images. The procedure is applied to the municipalities of Vaglio Basilicata and Trivigno in the Basilicata region (southern Italy) following a matrix-based approach. First, a susceptibility analysis is carried out at the municipal scale, using data from landslide inventories and thematic information available over the entire municipalities. Then, the susceptibility index, the class of movement and the level of damage are calculated for the territorial units corresponding to the road corridors under investigation. Finally, the road networks are divided into stretches, each one characterized by a specific level of risk (or attention required) following the aggregation of the information provided by the performed analyses. The results highlight the importance of integrating all of these different approaches and data for obtaining quantitative information on the spatial and temporal behavior of slow-moving landslides affecting road networks.

1. Introduction

Linear infrastructure plays a key role in the social and economic development of every nation. Road networks are typically the primary means of Italian national transportation, so ensuring their functionality is a challenging and, at the same time, demanding task that central and local authorities are asked to address [1].
Italy is a country strongly affected by natural hazards, such as landslides, which often cause casualties and physical damage to private and public property [2]. Among these hazards, slow-moving landslides can induce considerable damage to road networks, although they are rarely associated with the loss of human life [3,4,5,6,7,8,9,10]. Road infrastructures often develop within complex geological contexts, where active slow-moving landslides may generate deformation, cracks and local failures [11,12]. Moreover, the functionality and the safety conditions of the road network may be affected by long-term negative effects, including: (i) partial or complete destruction of a road stretch; (ii) traffic disruption due to the blockage of one or more road sections, which may affect the whole network, causing traffic congestion; and (iii) isolation of certain areas that cannot be reached by alternative routes [13]. Thus, the identification of the road sections most exposed to landslide risk is critical for reducing the population potentially exposed to risk and for minimizing the repair/replacement costs [14]. Several authors [15,16,17] also stress that the exposure of road networks to slope instabilities could increase as a consequence of climate change.
Landslide risk analysis requires the following main steps: identification of the spatial distribution of the landslides of interest that exist or potentially may occur in the area (i.e., susceptibility estimation); evaluation of the probability of occurrence of the landslides and, for existing active phenomena, of their intensity in terms of kinematic behavior over time (i.e., hazard estimation); evaluation of the of the elements at risk and their vulnerability in relation to the considered phenomena (i.e., consequence estimation); and risk estimation [18]. The assessment of landslide risk along road corridors may be carried out by using several methods according to the scale of the analysis, data availability and the aims of the study [19].
Assessing and mapping landslide susceptibility along road corridors can be considered an established practice. Indeed, several studies evaluate landslide susceptibility by means of expert-driven or data-driven statistical analyses, which relate known landslide occurrences to relevant thematic layers [4,5,6,7,11,12,13,14,20,21,22,23,24,25]. Recently, the technical advances in geographic information systems (GIS), remote sensing and soft computing allow a wider use of machine learning (ML) algorithms to reveal the correlations between landslide development and predisposing factors [26,27,28]. Different models have their advantages and drawbacks, and the performance of each model varies according to the input data, model structure and accuracy. Therefore, no consensus has been reached on the most suitable and efficient technique for every single region, and the prediction capability of a model largely depends on the available input data and local geo-environmental conditions [29]. Quantifying the level of risk along road corridors exposed to slow-moving landslides can be very challenging, due to several aspects. Landslide inventories containing objective and complete information regarding the past and current state of activity for the phenomena are not always available [30]. Assessing over large areas the temporal probability of landslides characterized by a given intensity, or the probability of damaging the elements at risk, may be not straightforward [14]. The development of large datasets of road displacements and damage through traditional techniques can be time-consuming, sometimes not affordable and provided on limited time/spatial extent [5]. Consequently, the studies specifically oriented to roads affected by existing slow-moving landslides are quite rare in the scientific literature [7,31,32,33,34].
The present paper proposes a methodology aimed at assessing―at the municipal scale―the level of risk (or attention required) of stretches of roads exposed to the activity of existing or potential slow-moving landslides. Adopting a matrix-based approach, the procedure developed herein combines the following data: landslide inventories, thematic maps, displacement measurements derived from the interferometric processing of synthetic aperture radar images (DInSAR) and damage records obtained from Google Street View. The final product of the analyses is the classification into four classes ―with the descriptors “very low”, “low”, “medium” and “high”― of the level of risk (or attention required) along the road corridors. The effectiveness of the adopted procedure was tested in two study areas in the municipalities of Vaglio Basilicata and Trivigno (Basilicata region, southern Italy). The two investigated road networks represent strategic nodes for these territories, as they connect a major transportation corridor, highway SS407 Basentana, to the two urban centers.

2. Materials and Methods
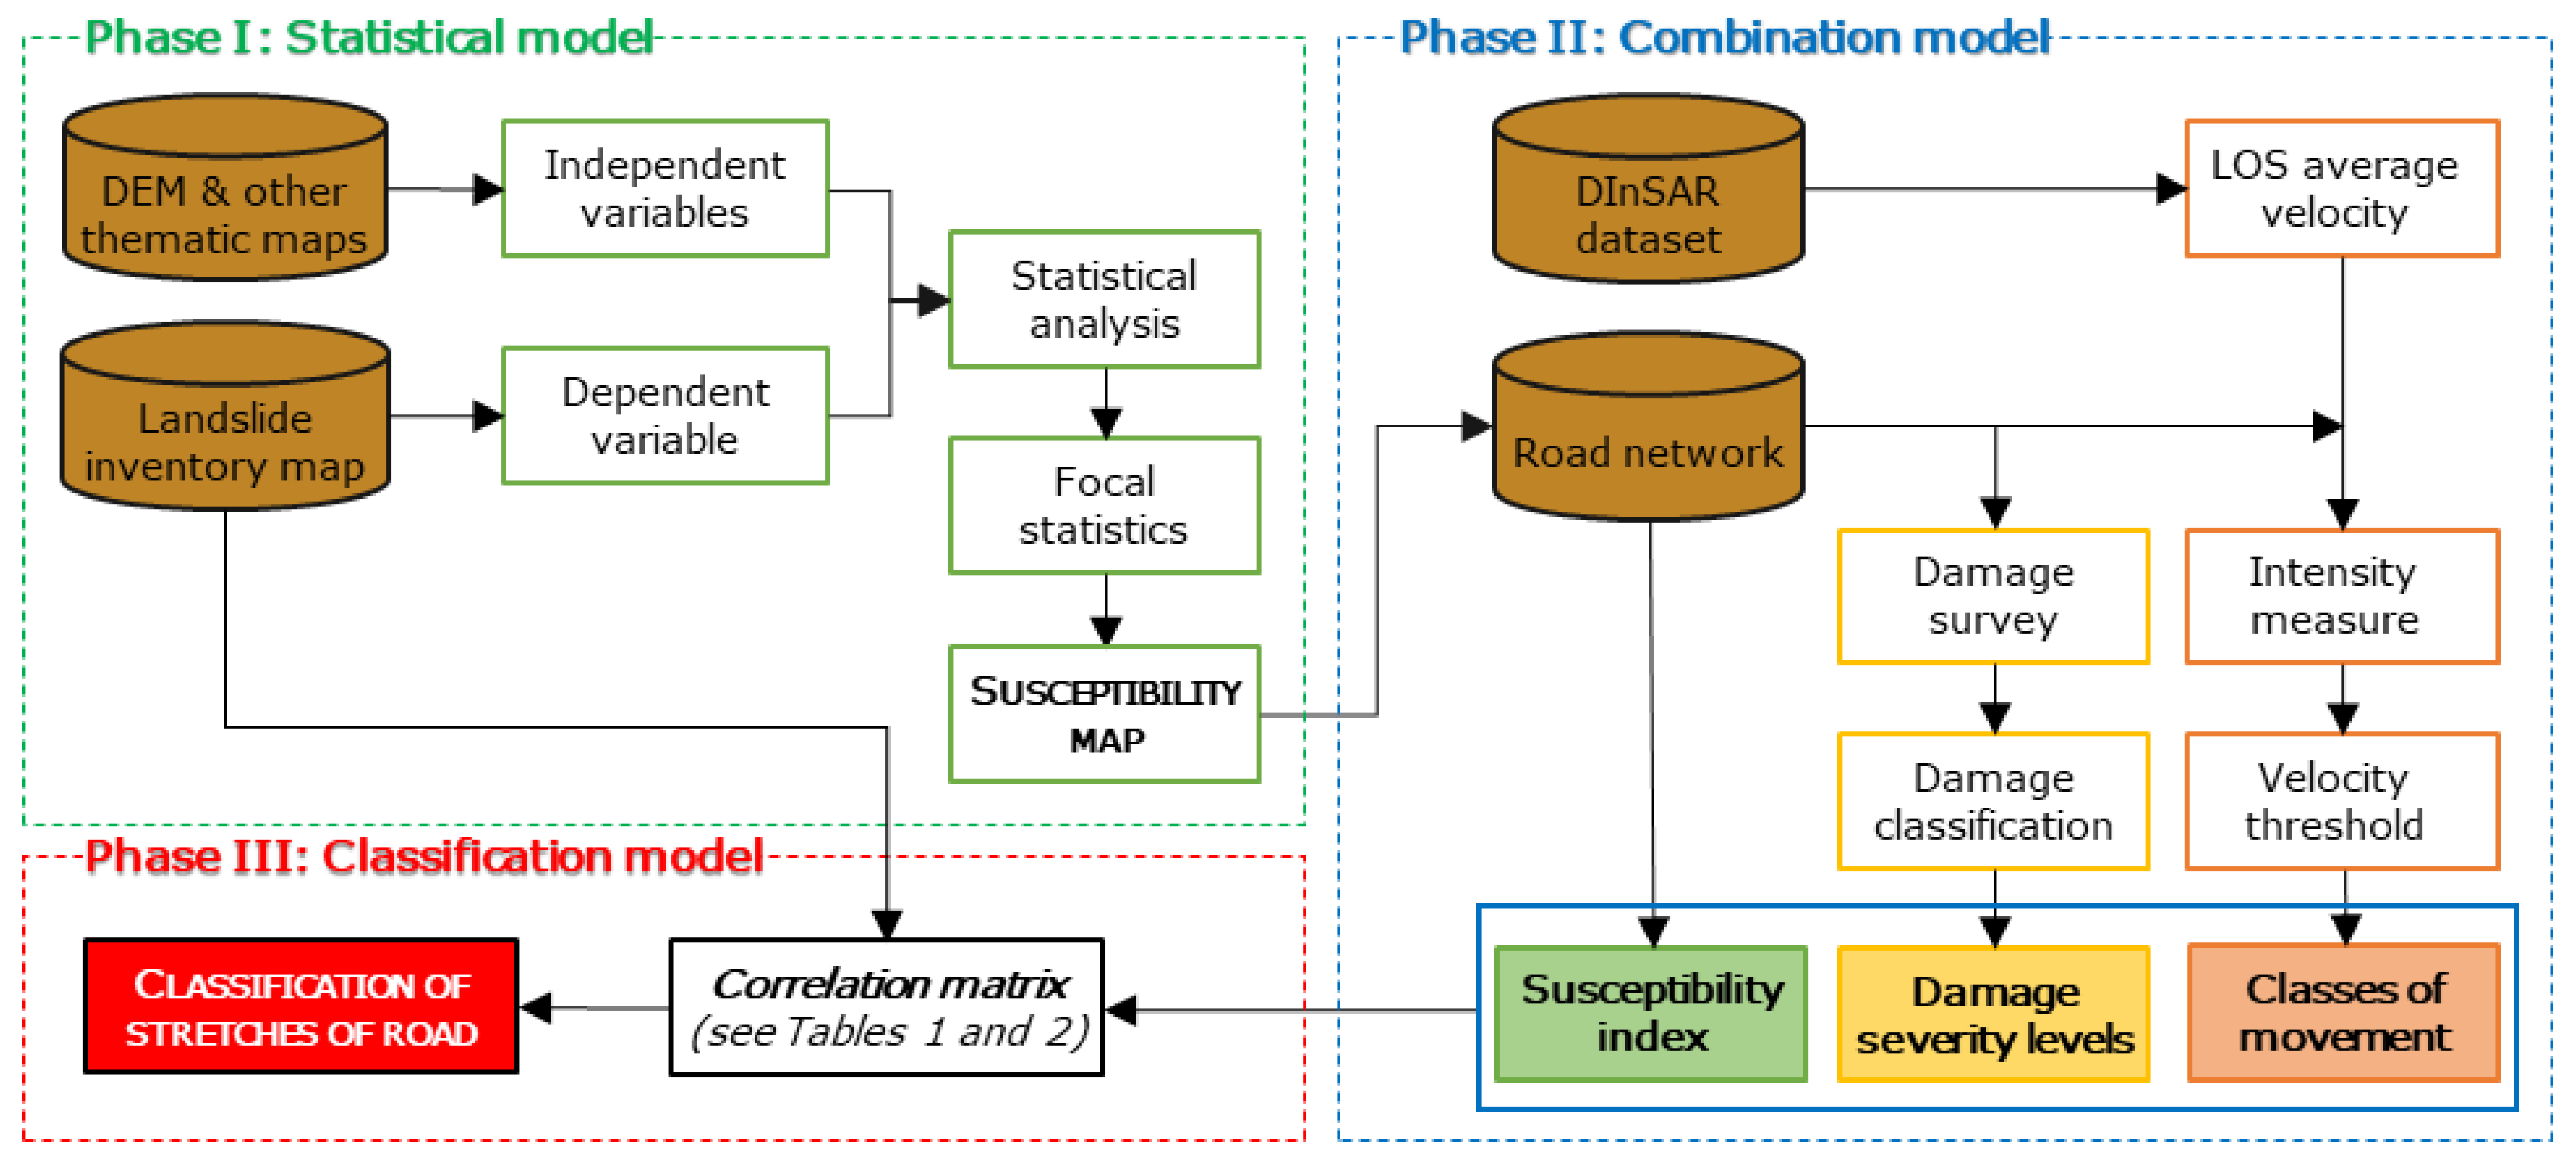
2.1. Methodology

In this study, the methodology for the classification of the road stretches exposed to slow-moving landslide risk at the municipal scale is developed considering three consecutive phases (Figure 1). In particular, the activities are essentially aimed at: (i) zoning the susceptibility to slow-moving landslides at the municipal scale, by means of a statistical model; (ii) identifying the susceptibility index, the level of damage and the class of movement based on DInSAR-derived ground-displacement measurements along the road network, by means of a combination model; and (iii) producing a correlation matrix combining all of the information in order to assign a level of risk (or attention required) to each stretch of the road network, by means of a classification model. To these aims, spatial data must be adequately managed within a GIS environment.

2.1.1. Phase I: Statistical Model

The statistical analysis adopted in this study at the municipal scale is known in the literature as the “information value method” [35], and it is based on bivariate correlations between the independent variables (i.e., each available spatial variable derived from significant thematic maps, such as slope, aspect, flow accumulation) and the dependent variable (i.e., the slow-moving landslides inventoried in an official map). The resulting landslide susceptibility computational map is used as input for producing the final landslide susceptibility zoning map of the area based on appropriately defined terrain zoning units.
The statistical methodology introduced herein is based on the distinction, proposed by Calvello et al. [30], between terrain computational units, TCUs, and terrain zoning units, TZUs. TCUs refer to the spatial domains used to define a model for landslide analyses, while TZUs are spatial domains used to produce a landslide map for zoning purposes. The level of discretization of the area is related, for both spatial domains, to the scale of analysis. In particular, the size of TCUs is associated with the spatial resolution of the map, whereas the size of TZUs is associated with the desired informative resolution of the zoning. In this study, regular square grid cells are used as TCUs. However, the information associated with such elementary pixels is inadequate to be directly used in a zoning map, because the associated level of discretization of the spatial domains would be too small. Therefore, focal statistical techniques are employed to obtain TZUs with the same dimensions of the TCUs yet containing information related to a larger area around them [36]. The value of the final zoning susceptibility index, ISTZU, is assigned to each TZU according to the following equation:
I S   T Z U = k 1 N I S T C U ( k ) N
where ISTCU(k) is the computational susceptibility index of the kth TCU belonging to the area of influence of the TZU, and N is the number of TCUs belonging to the area of influence of the TZU.
The resulting zoning maps, whose number depends on the number of characteristic dimensions of the areas of influence considered in the analyses, are comparatively evaluated by employing ROC curves. The optimal zoning map may be considered the one that maximizes the area under curve, AUC, of the ROC curves.

2.1.2. Phase II: Combination Model

The combination model represents a first step toward the joint use of the statistical, displacement and damage analyses. To this aim, the TZUs intersected by the road network under investigation, TZUroad, are identified by introducing a buffer symmetrically disposed in the orthogonal direction with respect to the road centerline.
The road susceptibility index, ISroad, is computed considering the ISTZU derived from the zoning susceptibility map created at the end of the first phase.
The DInSAR average velocity recorded along the line of sight (LOS) sensor-target direction is assumed as the intensity measure of each TZU. A mean velocity value computed as the arithmetic mean of the yearly VLOS of each coherent benchmark falling within the kth TZU (if covered) or deriving from the interacting slow-moving landslides (for which enough coherent benchmarks are available) is assigned to each TZU. Then, considering a threshold velocity value fixed according to the accuracy of the used DInSAR dataset, assumed as an indicator of movement [37,38,39], a “moving” or “not moving” condition is defined.
The damages affecting the road network are assessed based on the results of virtual surveys carried out using a Google Street view image archive. To each identified road section (for which at least one Google Street view image is available in the time interval under investigation), a damage severity level is assigned adapting the damage ranking scale proposed by Ferlisi et al. [7], based on the classification provided by Mavrouli et al. [33], considering the following classes:
  • D0 (negligible): road pavement deformation and cracks are absent or rarely visible;
  • D1(slight): deformation of the road pavement without the occurrence of cracks;
  • D2 (moderate): cracks in the road pavement;
  • D3 (severe): dislocation of the road pavement compromising its continuity.
Starting from individual damaged (or undamaged) road sections, stretches of these sections exhibiting uniform levels of damage are merged, and a unique damage severity level is assigned to each one of them.
Finally, the three retrieved types of information are associated to each TZUroad: susceptibility index, damage severity level (if the grid cell is covered) and velocity with associated state of movement (if the grid cell is covered).

2.1.3. Phase III: Classification Model

The consistency between the information collected by the statistical, displacement and damage analyses in the second phase is processed and crosschecked to classify the level of risk (in the presence of a mapped landslide) or attention required (in the absence of a mapped landslide) associated with each TZUroad (Table 1 and Table 2).
The information gathered from the landslide inventory and the three indicators calculated in the second phase (susceptibility index, damage severity level, velocity) have been treated as dichotomous variables, so that only a positive or a negative outcome is possible for each one of them: “yes” or “no” for landslide; “>0” or “<0” for susceptibility index; “damaged” or “undamaged” for damage severity level; “moving” or “not moving” for velocity. Therefore, when a TZUroad is not covered by the damage survey or DInSAR data are absent, it is conservatively considered as “damaged” or “moving”, respectively.
The sixteen possible combinations are associated with four levels of risk (in the presence of a mapped landslide) or attention required (in the absence of a mapped landslide), by adopting the following criteria:
  • “high”, when all the three indicators are positive;
  • “medium”, when two indicators are positive;
  • “low”, when one indicator is positive;
  • “very low”, when all the three indicators are negative.
Table 1. Correlation matrix defining the different levels of risk.
CombinationLandslideSusceptibility IndexVelocityDamage
Severity Level
Risk
01ryes>0movingdamagedhigh
02ryes>0not movingdamagedmedium
03ryes>0movingundamagedmedium
04ryes<0movingdamagedmedium
05ryes<0not movingdamagedlow
06ryes>0not movingundamagedlow
07ryes<0movingundamagedlow
08ryes<0not movingundamagedvery low
Table 2. Correlation matrix defining the different levels of attention required.
CombinationLandslideSusceptibility IndexVelocityDamage
Severity Level
Attention
01ano>0movingdamagedhigh
02ano>0not movingdamagedmedium
03ano>0movingundamagedmedium
04ano<0movingdamagedmedium
05ano<0not movingdamagedlow
06ano>0not movingundamagedlow
07ano<0movingundamagedlow
08ano<0not movingundamagedvery low
Based on this classification, the road network is partitioned in stretches exposed to different levels of risk (or attention) by aggregating the TZUroad. For road stretches where the information is not univocal (i.e., road sections exhibiting different levels of risk or attention), the highest level of risk or attention is considered.

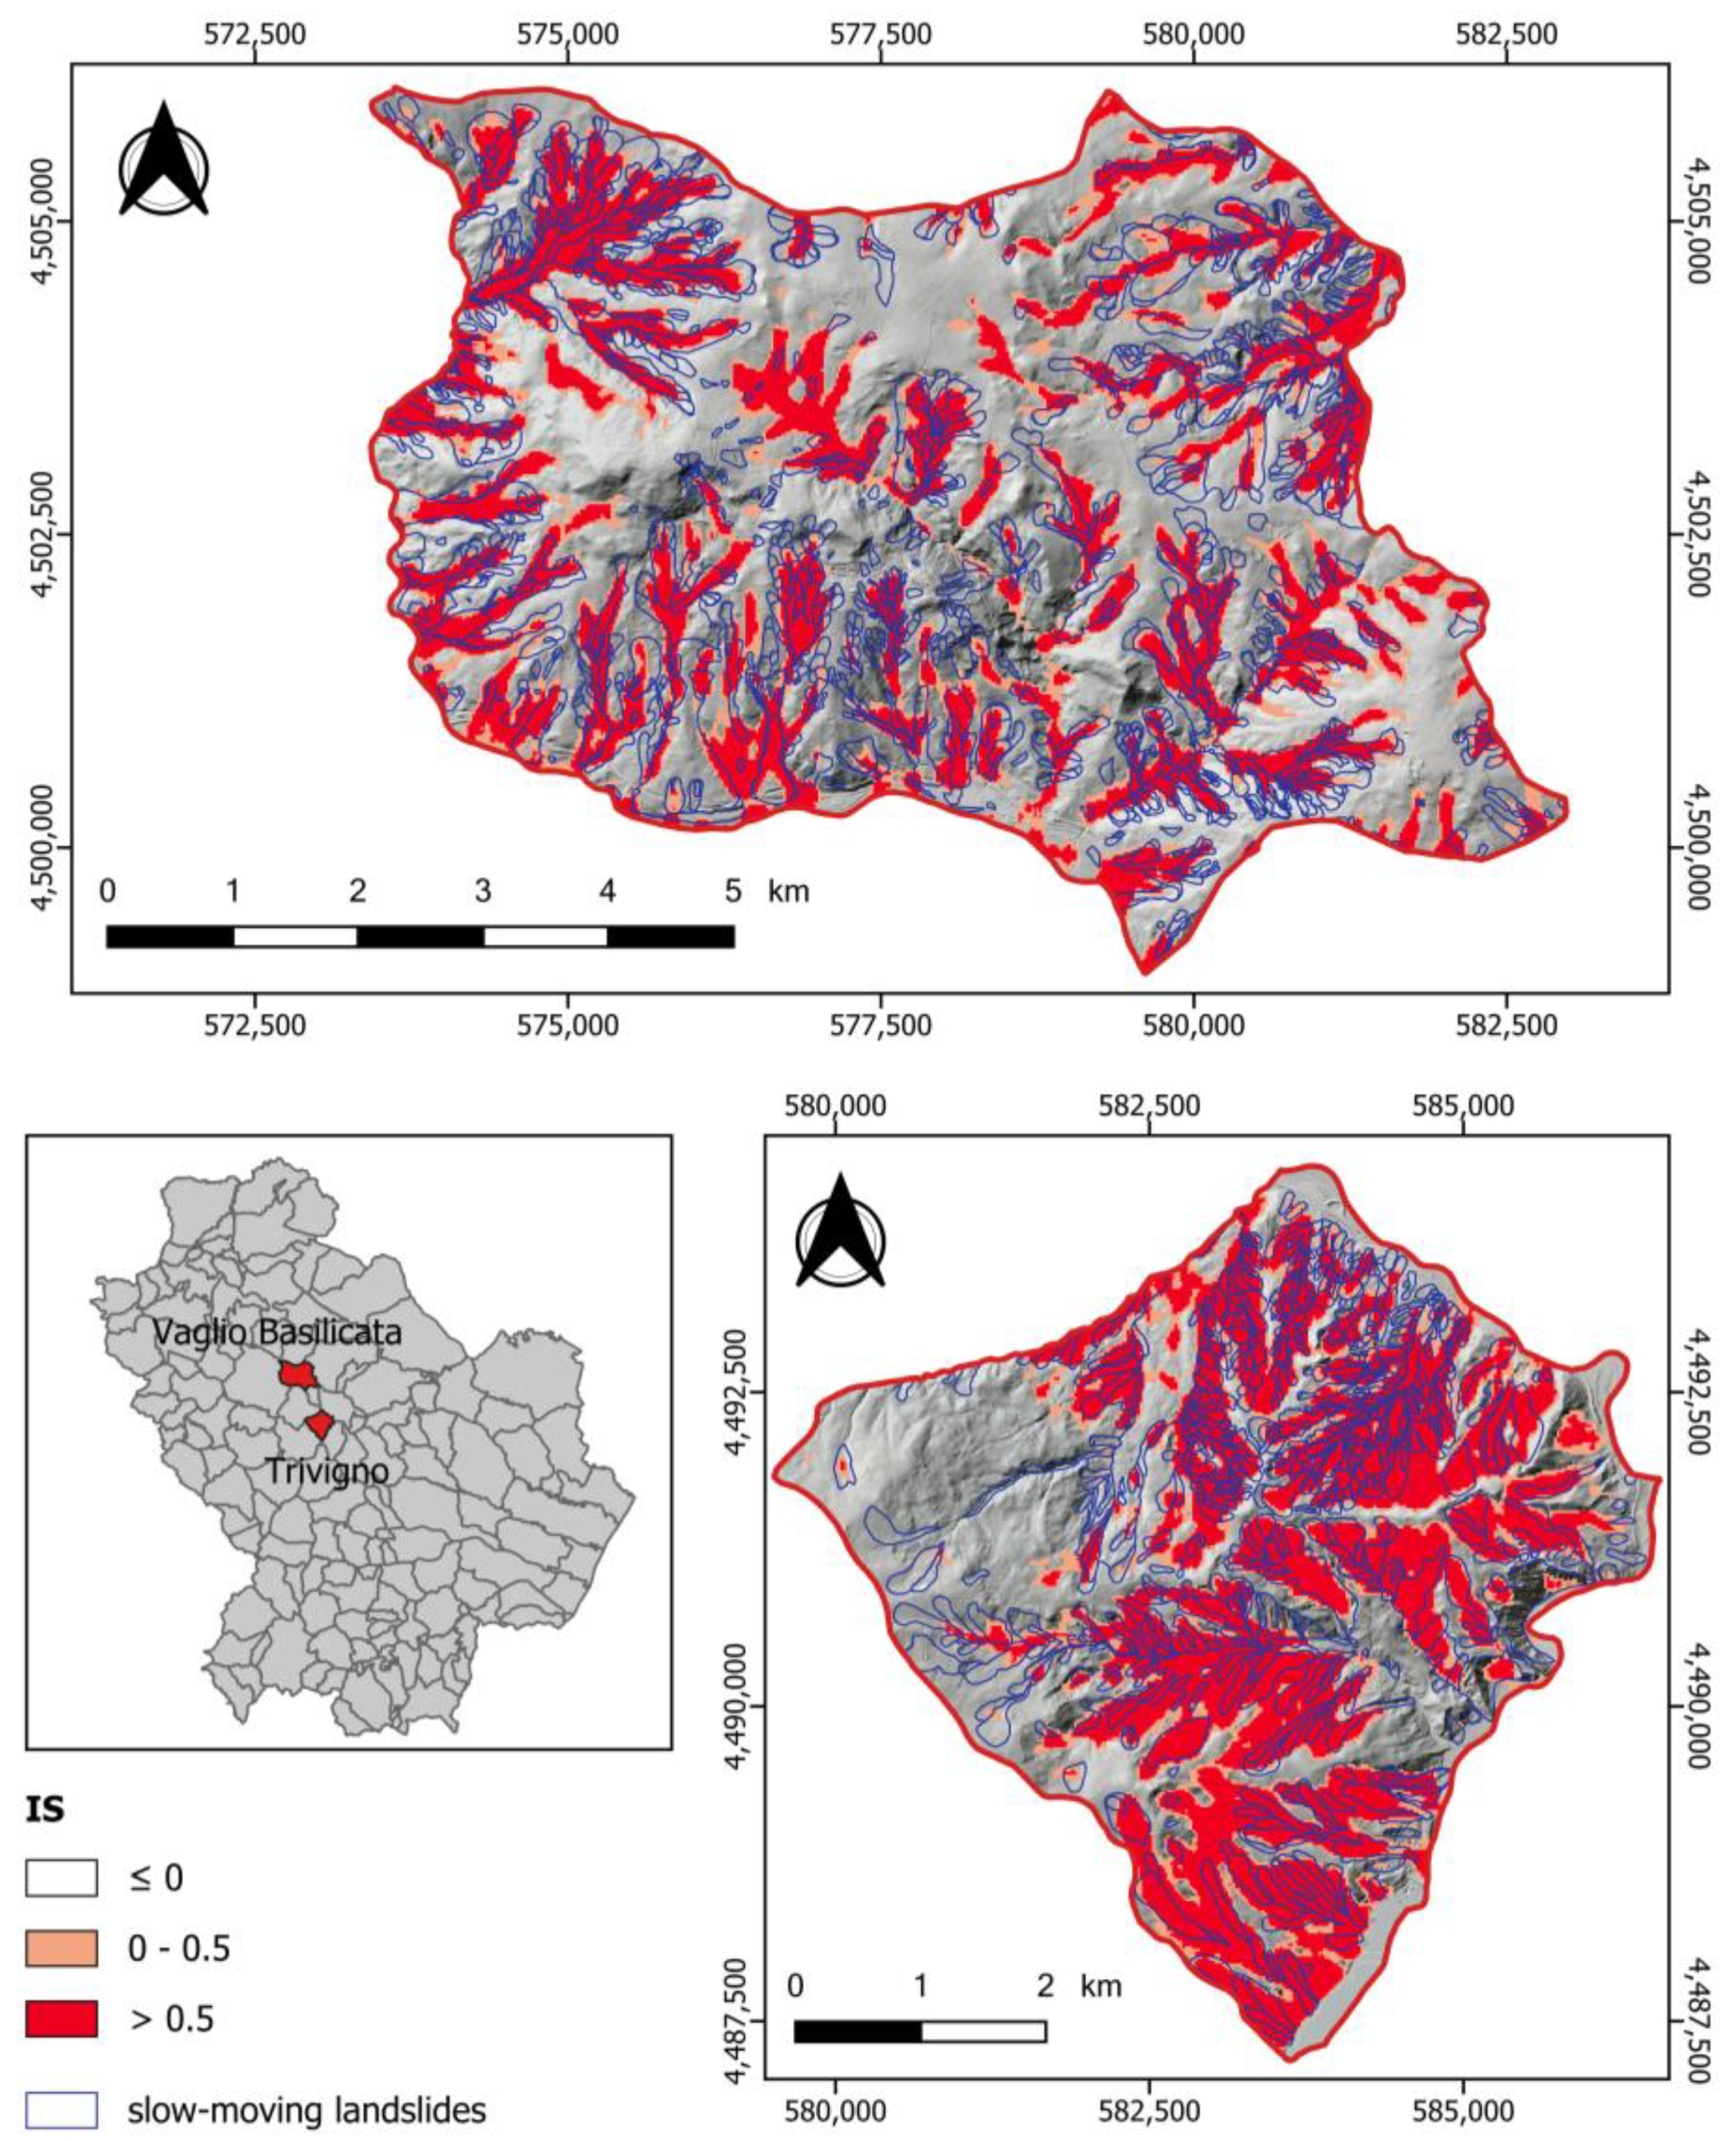
2.2. Test Areas and Datasets

The proposed procedure was applied and tested in two study areas in the municipalities of Vaglio Basilicata and Trivigno (Basilicata region, southern Italy). Both municipalities are located in the upper part of the Basento river basin. From a geological point of view, Vaglio Basilicata presents a complex tectonic unit mainly characterized by the outcropping of the Flysch Rosso formation (Upper Cretaceous–Eocene) and structurally complex clayey–marly succession referred to as the Lagonegro Unit [40]. The geological context of Trivigno is characterized by alternating layers of competent rock and clay shale deposited during the Oligocene–Miocene Age, then subjected to tectonic uplift. They present a highly disturbed structure, and the clay shale component is highly fissured [41]. Therefore, both study areas are widely affected by slow-moving landslides occurring in geological units strongly fractured and severely deformed due to their severe tectonic history [42]. Indeed, the official inventory map developed by the Interregional River Basin Authority of Basilicata region reports 157 slow-moving landslides in Vaglio Basilicata and 724 in Trivigno (Figure 2).
The mechanical processes and the displacement time evolution of the slow-moving landslides has caused, over time, widespread damage to the built-up environment interacting with them. Particularly sensitive to the landslide-induced movements are the two considered study areas, represented by the road networks connecting highway SS407 Basentana to the urban centers: 29.42 km with four main access points in Vaglio Basilicata (V01, V02, V03, and V04 in Figure 2b) and 16.93 km with two main access points in Trivigno (T01 and T02 in Figure 2d).
The input data for the statistical analysis are derived from a digital elevation model (DEM) with grid cell sizes equal to 20 × 20 m, and from categorical vector maps, all of them available in a regional GIS repository at https://rsdi.regione.basilicata.it/ (accessed on 1 February 2023).
Ground-displacement measurements were obtained by processing synthetic aperture radar data (SAR) via a differential interferometric (DInSAR) technique of very-high-resolution X-band Cosmo-SkyMed images. These radar images were processed by the e-GEOS company (partner of the MITIGO project financially supporting this research; see Funding section) using their commercial processing chain that implements the base concepts of the persistent scatterer interferometry (PSI) [43,44] algorithm. This required a strict phase calibration of the measured data aimed at compensating phase errors, mainly associated with propagation delays in the atmosphere of the electromagnetic radiation, which cause phase mismatches with the expected linear models associated with height and deformation contributions.
For the purpose of the present study, the processed datasets consist of 156 images acquired on descending orbit (from May 2012 to August 2021) in Vaglio Basilicata and 124 images acquired on descending orbit (from May 2012 to August 2021) in Trivigno. These remote sensing data provide high coverage of the observed scene with coherent reflector benchmarks also along linear elements (i.e., infrastructure networks) [45]. Figure 2c,d show the distribution of the DInSAR benchmarks and the measured average velocity values along the sensor target line of sight (LOS) for the visible area in Vaglio Basilicata and Trivigno, respectively.
The identification and assessment of the road damage severity level was carried out using photographic images from Google Street View (Figure 2c,d).
Figure 2. Aerial photos of Vaglio Basilicata (a,c) and Trivigno (b,d). (a,c) show the slow-moving landslides inventoried by the Interregional River Basin Authority of Basilicata and the spatial distribution of DInSAR velocities (road sections surveyed are marked in black) within the two municipalities. (b,d) focus on the main road stretches connecting highway SS407 Basentana to the two city centers. The insets show the location of the two municipalities within the Basilicata region.
Applsci 13 03368 g002

3. Results

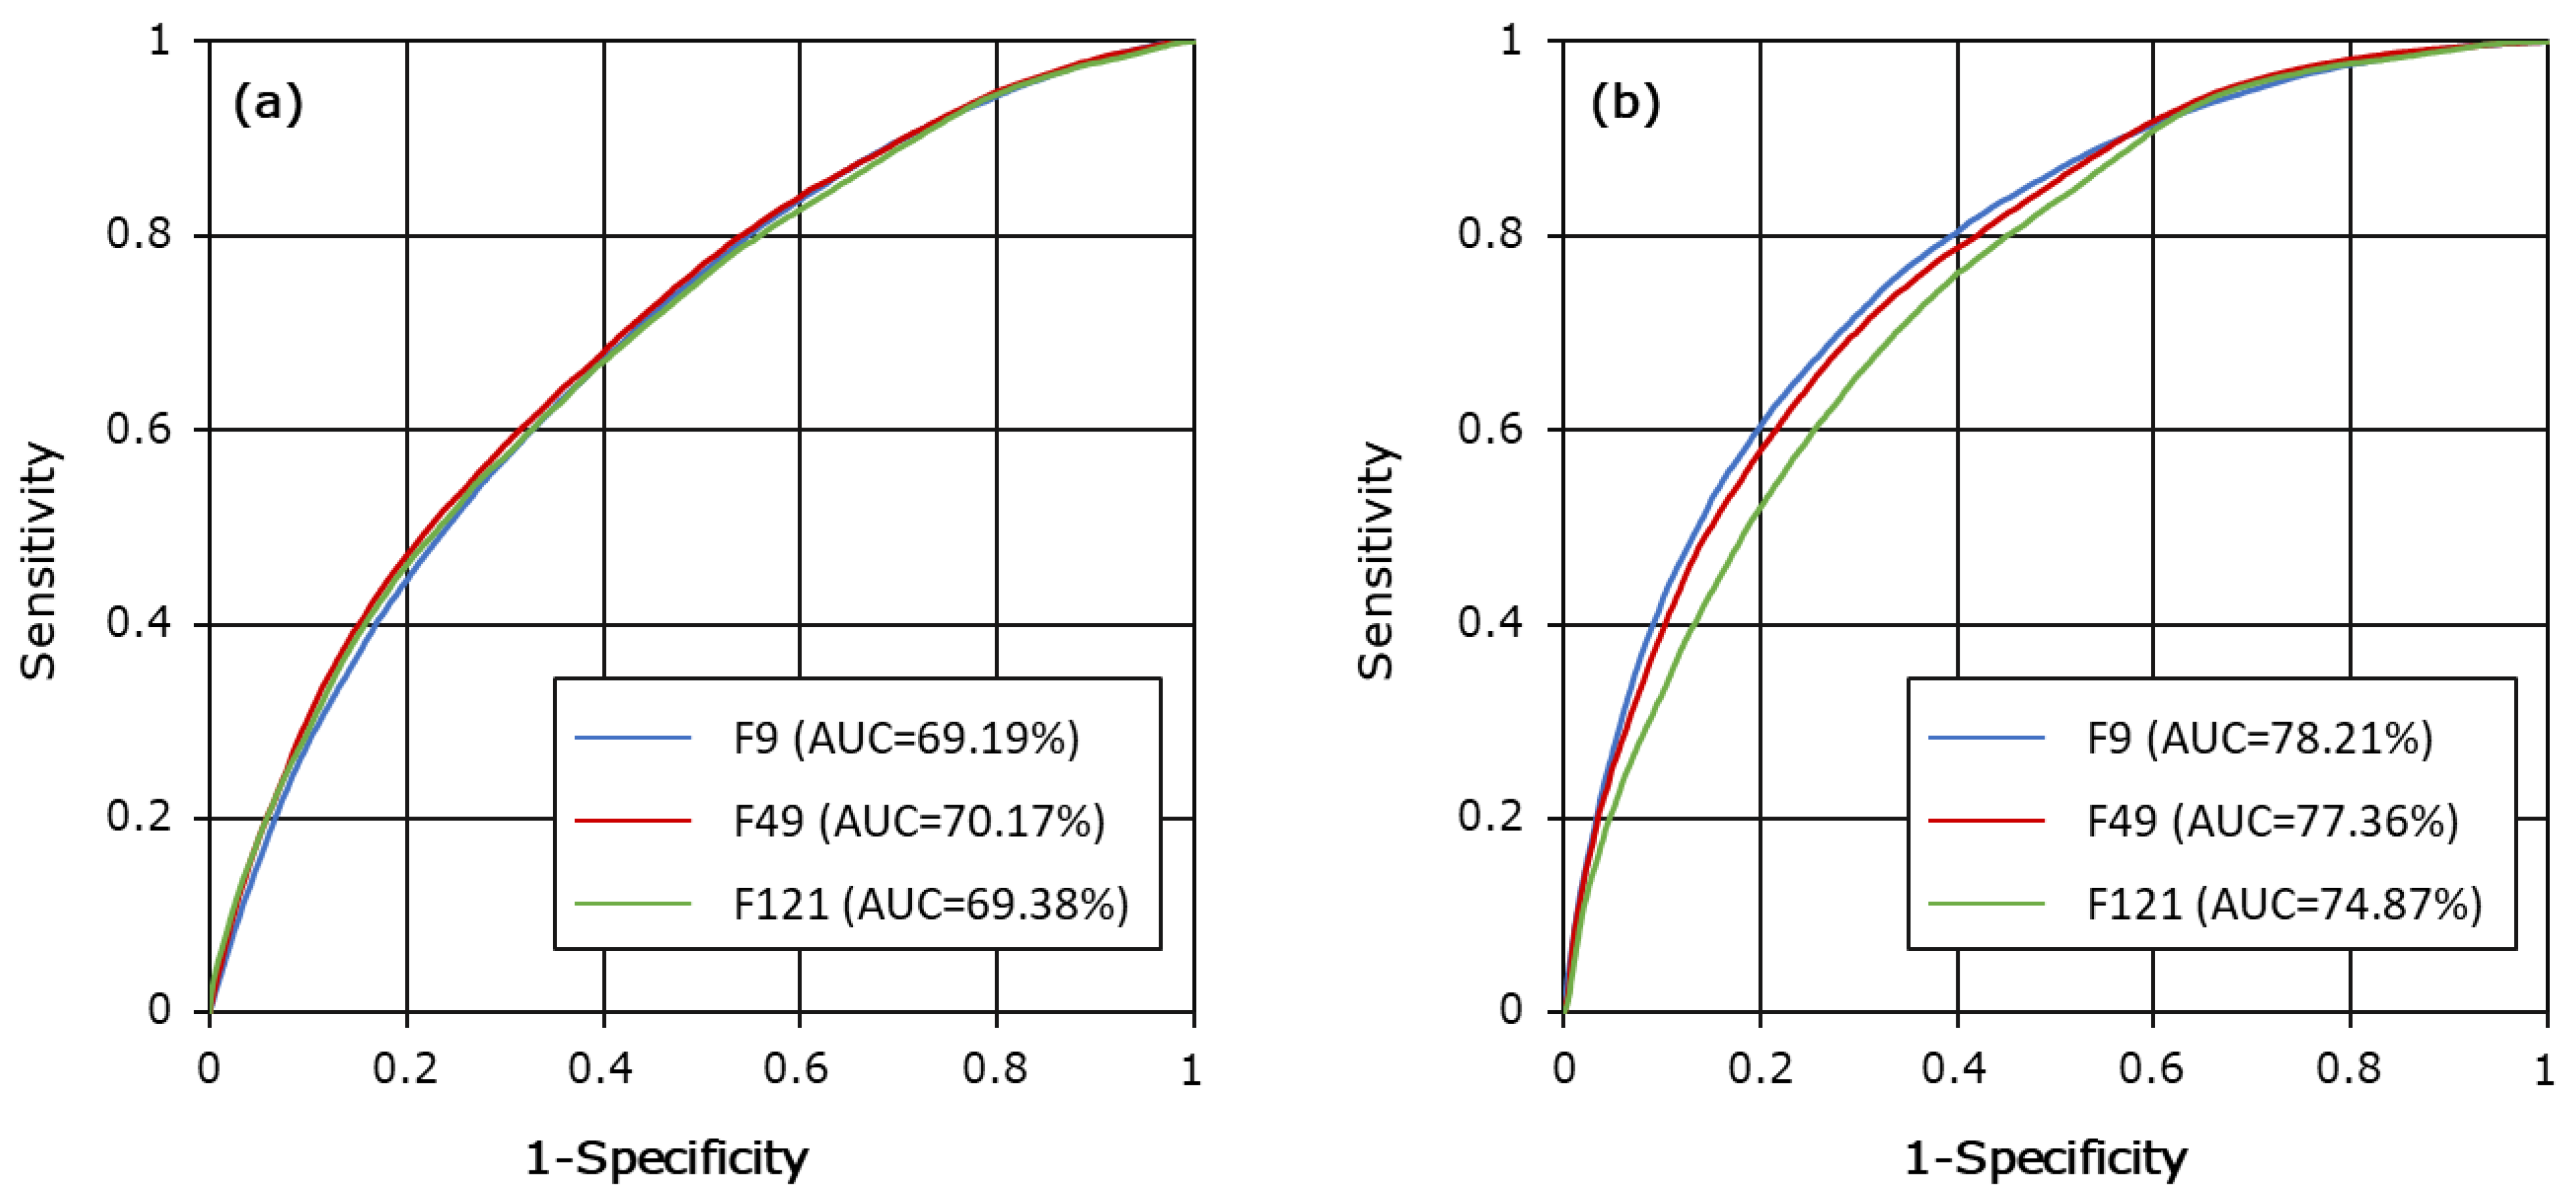
3.1. Statistical Model

As stated in Section 2.1.1, the proposed procedure is based on the distinction between terrain computational units related to the spatial resolution of the map, TCU, and terrain zoning units related to the desired informative resolution of the zoning, TZU. The variables employed within the model have been expressed in raster format using 107,513 square grid cells for Vaglio Basilicata and 64,441 square grid cells for Trivigno as TCU, whose single size is equal to 20 × 20 m. The dichotomous dependent variable is derived from the official inventory map developed by the Interregional River Basin Authority of Basilicata region, reporting 157 slow-moving landslides for Vaglio Basilicata (21,420 TCUs covered) and 724 for Trivigno (32859 TCUs covered). The following ten independent variables are used in the analysis (Table 3 and Table 4): distance from roads (V1); distance from river network (V2); slope (V3); terrain ruggedness index (V4); topographic position index (V5); aspect (V6); plan curvature (V7); flow accumulation (V8); topographic index (V9); and stream power index (V10). All independent variables are numeric variables: eight of them (slope, terrain ruggedness index, topographic position index, aspect, plan curvature, flow accumulation, topographic index, stream power index) are derived from the available digital elevation model, and the remaining two (distance from river network, distance from roads) are derived from categorical vector maps. All variables were classified using a quantile criterion with eight classes, i.e., each class includes about 12.5% of the total population (Table 3 and Table 4).
Bivariate analyses were carried out using the SZ plugin developed by Titti et al. [46]. The plugin is a collection of processing scripts in Python which run as part of the QGIS platform. Among the available statistical approaches, the weight of evidence (WoE) method was used. The WoE allows to quantify how prone an event occurrence is according to the proportion of presence/absence for each class of the independent variables. Two weights are assigned for each class: W i + and W i . The weights represent, respectively, the positive and negative influence of the independent variables on a potential landslide. They are calculated by the following equations:
W i + = l n   M 1 M 1 + M 2 M 3 M 3 + M 4
W i = l n   M 2 M 1 + M 2 M 4 M 3 + M 4
W i = W i + W i
where M1 is the number of TCUs where both the variable class and the event are present; M2 is the number of TCUs where the variable class is absent, while the event is present; M3 is the number of TCUs where the variable is present, while the event is absent; and M4 is the number of TCUs where both the variable class and the event are absent. The weight contrast, Wi, is the final weight assigned to each class of the variable. It evaluates the relation between the spatial distribution of the causes (i.e., the independent variables) and the spatial distribution of the events (i.e., the landslides).
Table 5 and Table 6 report the values of the statistical weights computed for Vaglio Basilicata and Trivigno, using Equation (4), for each class of each independent variable Vi. The following main comments arise from the values reported in the table. The overall maximum weight is attributed to class 8 of variable V8 at Vaglio Basilicata (W88V = 1.12) and to class 8 of variable V10 at Trivigno (W108T = 1.05). High values of weights are computed for a number of classes for variables V7, V9 and V10 at Vaglio Basilicata (W78V = 0.54, W98V = 0.89, W108V = 0.99) and for variables V2, V7 and V8 at Trivigno (W24T = 0.68, W78T = 0.89, W88T = 0.88). At Vaglio Basilicata, out of the eight classes of variable V1, only class 8 assumes a positive weight value (W18V = 0.49).
The sum of the weight contrasts produces the computational susceptibility index, ISTCU, for each TCU, as follows:
I S T C U = I = 1 N W i k ( i )
where Wik is the weight index of the independent variable Vi related to the TCU belonging to class k(i) of that variable.
To produce the landslide map for zoning purposes, TZU with three characteristic dimensions (Dk)―respectively equal to 9, 49 and 121 TCUs―were developed by applying Equation (1). The resulting six landslide susceptibility maps―three for Vaglio Basilicata and three for Trivigno―are comparatively evaluated by computing the AUC of the ROC curves in the sensitivity versus (1 − specificity) space (Figure 3).
A comparison between the results carried out using the three different characteristic dimensions for the two test areas highlights that the best compromise may be considered the ones characterized by a value of Dk equal to 49 TCU.
Figure 3. Receiver operating characteristic curves for the landslide susceptibility zoning maps obtained applying different focal statistic characteristic dimensions for Vaglio Basilicata (a) and Trivigno (b).
Applsci 13 03368 g003
Figure 4 reports the susceptibility zoning maps obtained for Vaglio Basilicata and Trivigno. The three susceptibility descriptors used in the maps are defined on the basis of the values assumed by the zoning susceptibility index, ISTZU, as follows: low susceptibility, ISTZU ≤ 0; medium susceptibility, 0 < ISTZU ≤ 0.5; high susceptibility, ISTZU > 0.5. The results indicate that about 40% of the municipality of Vaglio Basilicata and about 54% of the municipality of Trivigno are characterized by medium or high susceptibility (i.e., ISTZU > 0).

3.2. Combination Model

With the aim to combine statistical, displacement and damage information to study the road stretches exposed to slow-moving landslide risk at the municipal scale, first the kinematic characteristics of the slow-moving landslides are investigated using the available DInSAR dataset. According to the scale of analysis and the resolution of the monitoring data, only the slow-moving landslides covered by at least three coherent benchmarks were selected [37]. These latter are assigned an average velocity value computed as the arithmetic mean of the yearly VLOS of each benchmark falling within the considered landslide body. Figure 5a,b show the maps of covered slow-moving landslides with an indication of the velocity class obtained. In both study areas, some landslides (23.7% of the total covered in Vaglio Basilicata and 22.4% of the total covered in Trivigno) are moving (i.e., the average velocity value exceeds the threshold, fixed in this study equal to ±1.5 mm/year) in the observation period.
On the other hand, focusing on the road network under investigation and considering the coherent DInSAR benchmarks (Figure 5b,d) within the TZU (see Section 2.1.2), an average velocity value is computed as the arithmetic mean of the yearly VLOS associated with each coherent benchmark falling within the kth TZU. Then, according to the proposed procedure, the indicator of movement (i.e., “moving” or “not moving”) is assigned to the TZUroad based on the velocity value of the pertaining TZU (if covered) or deriving from the interacting slow-moving landslide (if any).
Figure 5. Maps of the slow-moving landslides for Vaglio Basilicata (a) and Trivigno (c) distinguished according to the average DInSAR-derived velocity values with close-up view of yearly VLOS of analyzed coherent DInSAR benchmarks and assumed as indicators of a state of movement for the TZUroad in Vaglio Basilicata (b) and Trivigno (d).
Applsci 13 03368 g005
As for the damages to the roads, several photos were collected and analyzed by exploiting the available Google Street View archive. Then, according to the adopted damage ranking (see Section 2.1.2), a damage severity level was assigned to the road stretch and then to the pertaining TZUroad (if covered). Figure 6 shows the results of the damage classification of the road stretches connecting highway SS407 Basentana to Vaglio Basilicata (Figure 6a) and Trivigno (Figure 6b) urban centers. The chart reported in Figure 6c highlights the presence of damage along the investigated road stretches, with higher damage severity levels in the sections interacting with the slow-moving landslides. This confirms the slow but continuous movement of the mapped slope instabilities, causing damage to the exposed built-up environment whose severity progressively increases over time.

3.3. Classification Model

The results of the three independent analyses―i.e., susceptibility algorithm, DInSAR data analyses and damage survey―were combined for the 3220 TZUroad identified in Vaglio Basilicata and for the 1373 TZUroad identified in Trivigno, following the procedure described in Section 2.1.3. Figure 7 shows two excerpts of the maps that are produced by the procedure in two small portions of the study area in Vaglio Basilicata (a) and Trivigno (b), as well as the correlation matrices obtained for the classification carried out over the entire territory of the two study areas. The matrices show that about half of the TZUroad are classified as being at risk in both study areas (1726 at Vaglio Basilicata and 689 at Trivigno), mainly as a result of the significant presence of mapped landslides interacting with the road network in these two municipalities. In particular, the analyses indicate that 966 TZUroad at Vaglio Basilicata (56% of the TZUroad classified at risk) and 504 at Trivigno (73% of the TZUroad classified at risk) are classified at high or medium risk (i.e., presence of a mapped landslide and two indicators positive).
Regarding TZUroad falling outside the mapped landslide bodies, and thus classified with attention levels, 1298 TZUroad out of 1494 in Vaglio Basilicata (87%) and 541 TZUroad out of 684 in Trivigno (79%) are classified as requiring high or medium attention. These results should be considered as associated with possible effects on the road network caused by the spreading of existing landslides, or by the potential activity of landslides not mapped in the inventory. Only 22 and 8 TZUroad are classified as being at very low risk and requiring very low attention, respectively, for the studied road network in Vaglio Basilicata, and only 4 and 8 TZUroad, respectively, in Trivigno. This can be justified by the conservative choice made in the implemented classification matrix, which considers a TZUroad not covered by the DInSAR data as “moving” and a TZUroad not covered by the damage survey as “damaged”.
Figure 7. Excerpts of maps produced by the procedure in two small portions of the study area in Vaglio Basilicata (a) and Trivigno (b). The tables below report the correlation matrices obtained for the classification carried out over the entire territory of the two study areas.
Applsci 13 03368 g007
For classification purposes, the road networks surveyed in the two municipalities are divided in stretches, each one characterized by a specific level of risk (or attention required) following the aggregation of the information provided by the related TZUroad. The aggregation is carried out by merging the TZUroad indicating the same levels of risk (or attention) along the road network. By applying this procedure, the road networks in Vaglio Basilicata and Trivigno are divided into 213 and 134 stretches, respectively (Figure 8a,b). For those sections where the indication provided by the correlation matrices is not fully univocal because the TZUroad are characterized by several different levels of risk or attention (an example is the road track in the upper left part of Figure 8b), the highest level is considered. Table 7 summarizes the results shown in Figure 8, reporting the total lengths of each class of road stretch.
Out of a total of 29.42 km of roads investigated in Vaglio Basilicata, 17.26 km interact with mapped landslides (about 59% of the total) and are thus classified with risk levels, while 12.16 km do not interact with mapped landslides (about 41% of the total) and are therefore classified with levels of attention required. The total lengths of road stretches characterized by high and medium levels of risk and attention are 9.73 km and 10.58 km, respectively. Only four road stretches are classified as being at very low risk (two stretches located in the middle part of the map) or requiring very low attention (one near the Basentana highway and the other near the city center).
Over a total of 16.93 km of roads investigated in Trivigno, 11.29 km interact with mapped landslides (about 67% of the total) and 5.64 km are located outside mapped landslides (about 33% of the total). The total lengths of road stretches characterized by high and medium levels of risk and attention are 10.14 km and 4.34 km, respectively. No road stretches are classified at very low risk, and only one stretch near the Basentana highway in the upper left part of the map is classified as requiring very low attention.
These results highlight that the road networks in Vaglio Basilicata and Trivigno are highly affected by the activity of slow-moving landslides, both inside and outside the areas already mapped with these phenomena. The classification with risk and attention levels allowed the identification, localization, and distribution of these road stretches within the two study areas.
Table 7. Total lengths of road stretches classified at high (H), medium (M), low (L) and very low (VL) risk (or attention) in Vaglio Basilicata and Trivigno. The number of road stretches are reported in parentheses.
Study
Area
Road Stretches at Risk [km] Road Stretches at Attention [km]
HMLVLHMLVL
Vaglio
Basilicata
1.99
(24)
7.74
(61)
7.34
(36)
0.19
(2)
3.47
(32)
7.11
(43)
1.48
(13)
0.10
(2)
Trivigno1.47
(14)
8.67
(32)
1.15
(17)

(−)
1.97
(24)
2.39
(33)
1.21
(13)
0.07
(1)

4. Discussion and Concluding Remarks

This paper shows the results of a study aimed at assessing―at the municipal scale―the level of risk (or attention required) of stretches of road exposed to the activity of existing or potential slow-moving landslides. The study was conducted by defining and applying a territorial conceptual model, and thus a procedure that can be implemented in GIS, in two study areas in the municipalities of Vaglio Basilicata and Trivigno (Basilicata region, southern Italy). The investigated road networks represent strategic nodes of the road system in these territories, as they connect a strategic highway located in the valley floor of the main river of the area to the two urban centers.
Adopting a matrix-based approach, the procedure developed herein combines the following data: landslide inventories, thematic information available over the entire investigated municipal territories, surface displacement remote sensing data and road damage data available for the investigated roads.
The analyses highlight that the investigated road networks are affected by widespread (real or potential) landslide risk in both study areas. In Vaglio Basilicata, about 9.73 km (33%) of roads are classified as being at high or medium risk and about 10.58 km (36%) as requiring high or medium attention. In Trivigno, about 9.73 km (60%) of roads are classified as high or medium risk and about 4.36 km (26%) as high or medium attention. Looking at the access routes from/to the Basentana highway and the city centers, i.e., four for Vaglio Basilicata, two for Trivigno (see Figure 2), each alternative route is characterized by one or more road stretches at high or medium risk or attention. These classification results of the road networks at the municipal scale allow the identification of the road stretches where mitigation measures (for road stretches classified at high and medium risk) or further investigation (for road stretches classified at high and medium attention) may be necessary. Out of a total of 213 road stretches in Vaglio Basilicata, 85 stretches at high and medium risk and 75 road stretches requiring high and medium attention are identified. Similarly, out of a total of 134 road stretches in Trivigno, 57 stretches at high and medium risk and 46 stretches at high and medium attention are identified.
It is important to highlight that the classification results obtained in the two study areas must be interpreted considering the municipal scale of the analysis―thus the procedure does not aim at defining risk or attention levels locally―and that the sources of uncertainty affecting the final accuracy of the results are many. In this regard, uncertainties can be associated with the errors inherent to: slow-moving landslide mapping at the regional scale (i.e., adopted landslide inventory), the nature of the road damage severity assessment (i.e., remote evaluation with only random field validation), the qualitative assessment of the cumulative displacements required for road sections interacting with slow-moving landslides to be assigned a specific damage severity level, the unavailability of processed DInSAR data in both ascending and descending orbits, and the impossibility to consider the mechanical characteristics of both the materials composing the road pavement and the soils on which the different road stretches are founded. Furthermore, DInSAR data were not available for every mapped landslide, and Google Street View images were not available for all of the road stretches under investigation; thus, the procedure was set up to assign, respectively, the “moving” and “damage” condition to the territorial zoning units where this information is not available. The authors are aware that this assumption may have resulted in an overestimation of the road stretches classified with a high level of risk or attention.
The most important positive aspect of the proposed method is that road stretches potentially affected by the activity of slow-moving landslides may be classified and ranked at the municipal scale, in a series of risk or attention levels, adopting a fairly simple qualitative ranking procedure, reliable in relation to the scale of analysis, which is based on a few data that are relatively easy to find and to manage. The proposed procedure allows obtaining such a classification without any information on the dimension, state of activity or volume of the landslides, and with limited hazard and vulnerability data. The outcome of this type of analysis can be used to support studies of road networks over large areas aimed at the prioritization of risk-mitigation measures, as well as at the identification of road sections requiring further geomorphological surveys and geotechnical analyses, to be conducted at a larger scale.

Author Contributions

G.P.: Conceptualization, methodology, validation, formal analysis, investigation, data curation, writing—original draft preparation, visualization; G.N.: Conceptualization, methodology, formal analysis, investigation, data curation, writing—original draft preparation; R.M.: Formal analysis, investigation, resources, data curation; D.L.: Formal analysis, investigation, resources, data curation; D.P.: Conceptualization, methodology, writing—review and editing, supervision; M.C.: Conceptualization, methodology, writing—review and editing, supervision, project administration, funding acquisition. All authors have read and agreed to the published version of the manuscript.

Funding

This research has been financially supported by MIUR PON R&I 2014-2020 Program (project MITIGO, ARS01_00964).

Institutional Review Board Statement

Not applicable.

Informed Consent Statement

Not applicable.

Data Availability Statement

Data are available upon request.

Acknowledgments

The authors wish to acknowledge the project partner e-GEOS for processing the COSMO-SkyMed data.

Conflicts of Interest

The authors declare no conflict of interest.

References

  1. Infante, D.; Di Martire, D.; Calcaterra, D.; Miele, P.; Scotto di Santolo, A.; Ramondini, M. Integrated Procedure for Monitoring and Assessment of Linear Infrastructures Safety (I-Pro MONALISA) Affected by Slope Instability. Appli. Sci. 2019, 9, 5535. [Google Scholar] [CrossRef] [Green Version]
  2. Calvello, M.; Pecoraro, G. FraneItalia: A Catalog of Recent Italian Landslides. Geoenviron. Disasters 2018, 5, 13. [Google Scholar] [CrossRef]
  3. Ferlisi, S.; Peduto, D.; Gullà, G.; Nicodemo, G.; Borrelli, L.; Fornaro, G. The Use of DInSAR Data for the Analysis of Building Damage Induced by Slow-Moving Landslides. In Engineering Geology for Society and Territory; Lollino, G., Giordan, D., Crosta, G.B., Corominas, J., Azzam, R., Wasowski, J., Sciarra, N., Eds.; Springer: Cham, Switzerland, 2015; Volume 2, pp. 1835–1839. [Google Scholar]
  4. Calvello, M.; Peduto, D.; Arena, L. Combined Use of Statistical and DInSAR Data Analyses to Define the State of Activity of Slow-Moving Landslides. Landslides 2017, 14, 473–489. [Google Scholar] [CrossRef]
  5. Nappo, N.; Peduto, D.; Mavrouli, O.; van Westen, C.J.; Gullà, G. Slow-Moving Landslides Interacting with the Road Network: Analysis of Damage Using Ancillary Data, in Situ Surveys and Multi-Source Monitoring Data. Eng. Geol. 2019, 260, 105244. [Google Scholar] [CrossRef]
  6. Peduto, D.; Santoro, M.; Aceto, L.; Borrelli, L.; Gullà, G. Full Integration of Geomorphological, Geotechnical, A-DInSAR and Damage Data for Detailed Geometric-Kinematic Features of a Slow-Moving Landslide in Urban Area. Landslides 2021, 18, 807–825. [Google Scholar] [CrossRef]
  7. Ferlisi, S.; Marchese, A.; Peduto, D. Quantitative Analysis of the Risk to Road Networks Exposed to Slow-Moving Landslides: A Case Study in the Campania Region (Southern Italy). Landslides 2021, 18, 303–319. [Google Scholar] [CrossRef]
  8. Hungr, O.; Leroueil, S.; Picarelli, L. The Varnes Classification of Landslide Types, an Update. Landslides 2014, 11, 167–194. [Google Scholar] [CrossRef]
  9. Lacroix, P.; Handwerger, A.; Bièvre, G. Life and Death of Slow-Moving Landslides. Nat. Rev. Earth Environ. 2020, 1, 404–419. [Google Scholar] [CrossRef]
  10. Fang, K.; Tang, H.; Li, C.; Su, X.; An, P.; Sun, S. Centrifuge Modelling of Landslides and Landslide Hazard Mitigation: A Review. Geosci. Front. 2023, 14, 101493. [Google Scholar] [CrossRef]
  11. Martino, S.; Bozzano, F.; Caporossi, P.; D’Angiò, D.; Della Seta, M.; Esposito, C.; Fantini, A.; Fiorucci, M.; Giannini, L.M.; Iannucci, R.; et al. Impact of Landslides on Transportation Routes during the 2016–2017 Central Italy Seismic Sequence. Landslides 2019, 16, 1221–1241. [Google Scholar] [CrossRef]
  12. Novellino, A.; Cesarano, M.; Cappelletti, P.; Di Martire, D.; Di Napoli, M.; Ramondini, M.; Sowter, A.; Calcaterra, D. Slow-Moving Landslide Risk Assessment Combining Machine Learning and InSAR Techniques. CATENA 2021, 203, 105317. [Google Scholar] [CrossRef]
  13. Bordoni, M.; Persichillo, M.G.; Meisina, C.; Crema, S.; Cavalli, M.; Bartelletti, C.; Galanti, Y.; Barsanti, M.; Giannecchini, R.; D’Amato Avanzi, G. Estimation of the Susceptibility of a Road Network to Shallow Landslides with the Integration of the Sediment Connectivity. Nat. Hazards Earth Syst. Sci. 2018, 18, 1735–1758. [Google Scholar] [CrossRef] [Green Version]
  14. Pellicani, R.; Argentiero, I.; Spilotro, G. GIS-Based Predictive Models for Regional-Scale Landslide Susceptibility Assessment and Risk Mapping along Road Corridors. Geomat. Nat. Haz. Risk 2017, 8, 1012–1033. [Google Scholar] [CrossRef] [Green Version]
  15. Strauch, R.L.; Raymond, C.L.; Rochefort, R.M.; Hamlet, A.F.; Lauver, C. Adapting Transportation to Climate Change on Federal Lands in Washington State, U.S.A. Clim. Chang. 2015, 130, 185–199. [Google Scholar] [CrossRef]
  16. Klose, M.; Damm, B.; Terhorst, B. Landslide Cost Modeling for Transportation Infrastructures: A Methodological Approach. Landslides 2015, 12, 321–334. [Google Scholar] [CrossRef]
  17. Matulla, C.; Hollósi, B.; Andre, K.; Gringinger, J.; Chimani, B.; Namyslo, J.; Fuchs, T.; Auerbach, M.; Herrmann, C.; Sladek, B.; et al. Climate Change Driven Evolution of Hazards to Europe’s Transport Infrastructure throughout the Twenty-First Century. Theory Appl. Climatol. 2018, 133, 227–242. [Google Scholar] [CrossRef]
  18. Fell, R.; Ho, K.K.S.; Lacasse, S.; Leroi, E. A Framework for Landslide Risk Assessment and Management. In Landslide Risk Management; CRC Press: Boca Raton, FL, USA, 2005; pp. 13–36. [Google Scholar]
  19. Fell, R.; Corominas, J.; Bonnard, C.; Cascini, L.; Leroi, E.; Savage, W.Z. Guidelines for Landslide Susceptibility, Hazard and Risk Zoning for Land-Use Planning. Eng. Geol. 2008, 102, 99–111. [Google Scholar] [CrossRef] [Green Version]
  20. Das, I.; Stein, A.; Kerle, N.; Dadhwal, V.K. Landslide Susceptibility Mapping along Road Corridors in the Indian Himalayas Using Bayesian Logistic Regression Models. Geomorphology 2012, 179, 116–125. [Google Scholar] [CrossRef]
  21. Devkota, K.C.; Regmi, A.D.; Pourghasemi, H.R.; Yoshida, K.; Pradhan, B.; Ryu, I.C.; Dhital, M.R.; Althuwaynee, O.F. Landslide Susceptibility Mapping Using Certainty Factor, Index of Entropy and Logistic Regression Models in GIS and Their Comparison at Mugling–Narayanghat Road Section in Nepal Himalaya. Nat. Hazards 2013, 65, 135–165. [Google Scholar] [CrossRef]
  22. Winter, M.G.; Shearer, B.; Palmer, D.; Peeling, D.; Harmer, C.; Sharpe, J. The Economic Impact of Landslides and Floods on the Road Network. Procedia Eng. 2016, 143, 1425–1434. [Google Scholar] [CrossRef] [Green Version]
  23. Postance, B.; Hillier, J.; Dijkstra, T.; Dixon, N. Extending Natural Hazard Impacts: An Assessment of Landslide Disruptions on a National Road Transportation Network. Environ. Res. Lett. 2017, 12, 014010. [Google Scholar] [CrossRef]
  24. Pasang, S.; Kubíček, P. Landslide Susceptibility Mapping Using Statistical Methods along the Asian Highway, Bhutan. Geosciences 2020, 10, 430. [Google Scholar] [CrossRef]
  25. Zhang, Y.; Wen, H.; Xie, P.; Hu, D.; Zhang, J.; Zhang, W. Hybrid-Optimized Logistic Regression Model of Landslide Susceptibility along Mountain Highway. Bull. Eng. Geol. Environ. 2021, 80, 7385–7401. [Google Scholar] [CrossRef]
  26. Lima, P.; Steger, S.; Glade, T.; Murillo-García, F.G. Literature Review and Bibliometric Analysis on Data-Driven Assessment of Landslide Susceptibility. J. Mt. Sci. 2022, 19, 1670–1698. [Google Scholar] [CrossRef]
  27. Tehrani, F.S.; Calvello, M.; Liu, Z.; Zhang, L.; Lacasse, S. Machine Learning and Landslide Studies: Recent Advances and Applications. Nat. Hazards 2022, 114, 1197–1245. [Google Scholar] [CrossRef]
  28. Xia, D.; Tang, H.; Sun, S.; Tang, C.; Zhang, B. Landslide Susceptibility Mapping Based on the Germinal Center Optimization Algorithm and Support Vector Classification. Remote Sens. 2022, 14, 2707. [Google Scholar] [CrossRef]
  29. Ling, S.; Zhao, S.; Huang, J.; Zhang, X. Landslide Susceptibility Assessment Using Statistical and Machine Learning Techniques: A Case Study in the Upper Reaches of the Minjiang River, Southwestern China. Front. Earth Sci. 2022, 10, 986172. [Google Scholar] [CrossRef]
  30. Calvello, M.; Cascini, L.; Mastroianni, S. Landslide Zoning over Large Areas from a Sample Inventory by Means of Scale-Dependent Terrain Units. Geomorphology 2013, 182, 33–48. [Google Scholar] [CrossRef]
  31. Catani, F.; Casagli, N.; Ermini, L.; Righini, G.; Menduni, G. Landslide Hazard and Risk Mapping at Catchment Scale in the Arno River Basin. Landslides 2005, 2, 329–342. [Google Scholar] [CrossRef]
  32. Peng, L.; Xu, S.; Hou, J.; Peng, J. Quantitative Risk Analysis for Landslides: The Case of the Three Gorges Area, China. Landslides 2015, 12, 943–960. [Google Scholar] [CrossRef]
  33. Mavrouli, O.; Corominas, J.; Ibarbia, I.; Alonso, N.; Jugo, I.; Ruiz, J.; Luzuriaga, S.; Navarro, J.A. Integrated Risk Assessment Due to Slope Instabilities in the Roadway Network of Gipuzkoa, Basque Country. Nat. Hazards Earth Syst. Sci. 2019, 19, 399–419. [Google Scholar] [CrossRef] [Green Version]
  34. Gullà, G.; Nicodemo, G.; Ferlisi, S.; Borrelli, L.; Peduto, D. Small-Scale Analysis to Rank Municipalities Requiring Slow-Moving Landslide Risk Mitigation Measures: The Case Study of the Calabria Region (Southern Italy). Geoenviron. Disasters 2021, 8, 31. [Google Scholar] [CrossRef]
  35. Yin, K.L.; Yan, T.Z. Statistical Prediction Models for Slope Instability of Metamorphosed Rocks. In Proceedings of the 5th International Symposium on Landslides, Lausanne, Switzerland, 13 September 1988; Volume 2, pp. 1269–1272. [Google Scholar]
  36. Ciurleo, M.; Calvello, M.; Cascini, L. Susceptibility Zoning of Shallow Landslides in Fine Grained Soils by Statistical Methods. CATENA 2016, 139, 250–264. [Google Scholar] [CrossRef]
  37. Cascini, L.; Peduto, D.; Pisciotta, G.; Arena, L.; Ferlisi, S.; Fornaro, G. The Combination of DInSAR and Facility Damage Data for the Updating of Slow-Moving Landslide Inventory Maps at Medium Scale. Nat. Hazards Earth Syst. Sci. 2013, 13, 1527–1549. [Google Scholar] [CrossRef]
  38. Peduto, D.; Elia, F.; Montuori, R. Probabilistic Analysis of Settlement-Induced Damage to Bridges in the City of Amsterdam (The Netherlands). Transp. Geotech. 2018, 14, 169–182. [Google Scholar] [CrossRef]
  39. Nicodemo, G.; Peduto, D.; Ferlisi, S.; Gullà, G.; Reale, D.; Fornaro, G. Dinsar Data Integration in Vulnerability Analyses of Buildings Exposed to Slow-Moving Landslides. In Proceedings of the IGARSS 2018—2018 IEEE International Geoscience and Remote Sensing Symposium, Valencia, Spain, 22–27 July 2018; pp. 6107–6110. [Google Scholar]
  40. Del Prete, R.; Cammarota, A.; Del Prete, M. La frana del tempio della dea Mefitis nel territorio di Vaglio della Basilicata. G. Geol. Appl. 2006, 3, 152–158. [Google Scholar]
  41. Urciuoli, G.; Pirone, M.; Comegna, L.; Picarelli, L. Long-Term Investigations on the Pore Pressure Regime in Saturated and Unsaturated Sloping Soils. Eng. Geol. 2016, 212, 98–119. [Google Scholar] [CrossRef]
  42. Sdao, F.; Simeone, V. Mass Movements Affecting Goddess Mefitis Sanctuary in Rossano Di Vaglio (Basilicata, Southern Italy). J. Cult. Herit. 2007, 8, 77–80. [Google Scholar] [CrossRef]
  43. Ferretti, A.; Prati, C.; Rocca, F. Permanent Scatterers in SAR Interferometry. IEEE Trans. Geosci. Remote Sens. 2001, 39, 8–20. [Google Scholar] [CrossRef]
  44. Costantini, M.; Falco, S.; Malvarosa, F.; Minati, F. A New Method for Identification and Analysis of Persistent Scatterers in Series of SAR Images. In Proceedings of the IGARSS 2008—2008 IEEE International Geoscience and Remote Sensing Symposium, Boston, MA, USA, 6–11 July 2008; pp. 449–452. [Google Scholar]
  45. Peduto, D.; Giangreco, C.; Venmans, A.A.M. Differential Settlements Affecting Transition Zones between Bridges and Road Embankments on Soft Soils: Numerical Analysis of Maintenance Scenarios by Multi-Source Monitoring Data Assimilation. Transp. Geotech. 2020, 24, 100369. [Google Scholar] [CrossRef]
  46. Titti, G.; Sarretta, A.; Lombardo, L.; Crema, S.; Pasuto, A.; Borgatti, L. Mapping Susceptibility With Open-Source Tools: A New Plugin for QGIS. Front. Earth Sci. 2022, 10, 229. [Google Scholar] [CrossRef]
Figure 1. Procedure to study the interaction between slow-moving landslides and the road network at the municipal level by combining information from susceptibility maps, DInSAR data analyses and damage surveys.
Applsci 13 03368 g001
Figure 4. Landslide susceptibility maps at the municipal scale defined employing focal statistics techniques with characteristic dimension equal to 7. Slow-moving landslides recorded in the two test areas are also reported. The inset shows the location of the two municipalities within the Basilicata region.
Applsci 13 03368 g004
Figure 6. Maps of damaged road stretches with severity levels resulting from the damage classification using Google Street View imagery dated August 2021 for Vaglio Basilicata (a) and March 2021 for Trivigno (b). Percentages of damaged road distinguished according to the four (D0–D3) damage severity levels are also reported (c).
Applsci 13 03368 g006
Figure 8. Classification of the investigated stretches of roads in different levels of risk and attention resulting from the application of the proposed methodology in two study areas of the municipalities of Vaglio Basilicata (a) and Trivigno (b).
Applsci 13 03368 g008
Table 3. Classification of the independent variables employed in the statistical analyses carried out at Vaglio Basilicata.
ClassV1
[m]
V2
[m]
V3
[°]
V4
[−]
V5
[−]
V6
[−]
V7
[−]
V8
[−]
V9
[−]
V10
[−]
1v0 to 00 to 00.05 to 50.05 to 1.52−10 to −1.040 to 61.9−13 to −0.0221 to 2.811.8 to 4.40.002 to 3
2v20 to 4020 to 445.2 to 71.53 to 2−1.03 to −0.5362 to 114.98−0.02 to −0.0122.82 to 4.444.5 to 53.002 to 5.36
3v44 to 6356 to 847.1 to 82.03 to 2.42−0.52 to −0.23114.99 to 159−0.01 to −0.00534.45 to 6.615.1 to 5.65.37 to 8.29
4v72 to 10789 to 1288.5 to 9.82.43–2.79−0.22 to −0.003159.1 to 186−0.005 to −4.6 × 10−56.62 to 9.735.61 to 68.3 to 12.63
5v113 to 156134 to 1819.85 to 112.8–3.210.004 to 0.23186.9 to 213−4.5 × 10⁻⁵ to 0.00529.74 to 156.1 to 6.612.64 to 19.85
6v160 to 223184 to 24411.3 to 133.22–3.760.24 to 0.54213.3 to 2420.0053 to 0.0115.1 to 26.626.7 to 7.319.86 to 35.24
7v226 to 341247 to 35413.2 to 163.77–4.750.55 to 1.06242.7 to 2820.011 to 0.02126.63 to 667.4 to 8.535.25 to 89.8
8v342 to 1394356 to 92916.5 to 444.76–151.07 to 14.7282.3 to 3600.022 to 366.5 to 1686368.6 to 2689.9 to 485968
Table 4. Classification of the independent variables employed in the statistical analyses carried out at Trivigno.
ClassV1
[m]
V2
[m]
V3
[°]
V4
[−]
V5
[−]
V6
[−]
V7
[−]
V8
[−]
V9
[−]
V10
[−]
1t0 to 00 to 3040 to 6.90 to 2.04−14 to −1.410 to 26.86−14 to −0.0240 to 02 to 40 to 3
2t20 to 40305 to 6796.9 to 9.32.05 to 2.66−1.4 to −0.7426.87 to 48−0.023 to −0.0131 to 14.1 to 4.63.6 to 6
3t44 to 80679.4 to 10759.3 to 112.67 to 3.15−0.73 to −0.3348.2 to 68.5−0.01 to −0.0062 to 24.7 to 56.5 to 10
4t82 to 1281076 to 148811 to 12.63.16 to 3.6−0.32 to −6.1 × 10−568.6 to 89−0.005 to −1 × 10−63 to 35.2 to 5.710.1 to 15
5t134 to 1961488 to 191312.7 to 14.53.63 to 4.10 to 0.389.1 to 1150 to 0.0054 to 55.8 to 615.2 to 23
6t197 to 2801914 to 246914.5 to 16.84.2 to 4.920.32 to 0.73115.1 to 1500.006 to 0.016 to 86.4 to 723.8 to 42
7t282 to 4232469 to 325716.9 to 20.84.93 to 6.10.74 to 1.44150.7 to 2660.012 to 0.0249 to 217.2 to 842.4 to 114
8t424 to 11643257 to 470220.9 to 516.2 to 191.45 to 13266.4 to 3600.03 to 2022 to 32908.5 to 26114 to 224650
Table 5. Weights assigned to the independent variables in the statistical analyses carried out at Vaglio Basilicata.
Wik(i)V1V2V3V4V5V6V7V8V9V10
Wi1V−0.140.94−0.50−0.520.41−0.11−0.37−1.08−0.51−0.73
Wi2V−0.070.450.200.170.34−0.26−0.30−0.76−0.47−0.46
Wi3V−0.05−0.040.240.260.150.10−0.28−0.51−0.44−0.36
Wi4V−0.06−0.260.260.23−0.090.29−0.18−0.35−0.28−0.24
Wi5V−0.11−0.340.120.12−0.230.19−0.07−0.09−0.10−0.10
Wi6V−0.08−0.260.030.03−0.24−0.080.060.210.070.08
Wi7V−0.06−0.260.0040.04−0.18−0.150.340.640.460.38
Wi8V0.49−0.14−0.51−0.47−0.28−0.030.611.120.890.99
Table 6. Weights assigned to the independent variables in the statistical analyses carried out at Trivigno.
Wik(i)V1V2V3V4V5V6V7V8V9V10
Wi1T−0.20−0.41−0.77−0.710.75−0.03−0.59−0.90−0.40−1.12
Wi2T0.090.170.002−0.060.430.03−0.42−0.51−0.46−0.51
Wi3T0.350.680.170.170.25−0.35−0.29−0.22−0.38−0.29
Wi4T0.350.640.240.22−0.05−0.55−0.23−0.10−0.14−0.12
Wi5T0.320.550.230.20−0.33−0.24−0.090.070.010.07
Wi6T0.410.380.150.11−0.290.250.270.180.320.30
Wi7T0.05−0.76−0.07−0.07−0.360.420.500.310.540.62
Wi8T−1.66−1.320.030.13−0.370.500.890.880.541.05
Disclaimer/Publisher’s Note: The statements, opinions and data contained in all publications are solely those of the individual author(s) and contributor(s) and not of MDPI and/or the editor(s). MDPI and/or the editor(s) disclaim responsibility for any injury to people or property resulting from any ideas, methods, instructions or products referred to in the content.

