Article

Sensitivity Study of Highway Tunnel Light Environment Parameters Based on Pupil Change Experiments and CNN Judging Method

1
School of Civil Engineering, Chongqing Jiaotong University, Chongqing 400074, China
2
State Key Laboratory of Bridge and Tunnel Engineering in Mountainous Areas, Chongqing 400074, China
*
Author to whom correspondence should be addressed.
Appl. Sci. 2023, 13(5), 3160; https://doi.org/10.3390/app13053160
Submission received: 18 November 2022 / Revised: 23 February 2023 / Accepted: 26 February 2023 / Published: 1 March 2023
(This article belongs to the Special Issue Applications of Machine Learning and Computer Vision in Industry 4.0)

Abstract

:
There is a sparsity of research regarding the nonlinear relationship between the sensitivity of the light environment parameters in the middle section of the tunnel under multi-factor conditions in multiple samples. Due to the lack of research, the present study was conducted in order to investigate said relationship. To determine the parameters of the eye-movement characteristics required for the convolutional neural network prediction evaluation, a tunnel simulation model was established using DIALux10 simulation software and a series of dynamic driving tests were conducted based on an indoor simulation experimental platform. Further, through employing the residual network ResNet to extract data features and the pyramidal pooling network module, a convolutional neural network judging model with adaptive learning capabilities was established for investigating the nonlinear relationship of sensitivity of light environment parameters. Following the test, the degree of influence on the diameter of the pupil for the different levels of each factor were: the optimal configuration of the staggered layout on either side of the lamp arrangement, the optimal 3 m height under the different sidewall painting layout height conditions, the optimal green painting color under the different sidewall painting color conditions, and the optimal 6500 k under different LED light source color temperature conditions. The results of the present study serve to expand the use of the convolutional neural network model in tunnel light environment research and provide a new path for evaluating the quality of tunnel light environment.

1. Introduction

The safety and comfort of driving, along with the vision of those driving, are all directly impacted by the tunnel lighting environment. Due to the adverse effects on drivers’ pupil constriction and visual fatigue, the tunnel luminaires, light source, power, layout pattern, and equipment spacing of luminaires are typically the primary focuses in research on tunnel lighting environments [1,2,3]. LED light sources are common luminaires in tunnel light environments. The color temperature and spectral distribution of LED light sources directly correlate to the safety of the tunnel LED lighting environment and visual recognition distance [4,5,6]. Recognition needs vary under different color temperature conditions, and reducing both luminance and color temperature is more effective than reducing only the luminance when evaluating daytime tunnel cavity section lighting [7,8]. From the results of studies on visual efficacy, it has been demonstrated that changes in visual efficacy delay or shorten driver emergency response time [9,10]. Following the analysis of prior research on tunnel light environments, it was observed that the current research mainly revolves around the color temperature and luminance of light sources as well as visual efficacy. Traditional research of tunnel light environments has usually been quantitative with the focus being the indicators of one-to-one correspondence between quantity and quantity. However, tunnel light environments are complex systems in which the relationship between factors is mutual and nonlinear, so it is necessary to adopt a nonlinear research method when studying the tunnel light environment system.
In the study of tunnel light environments, researchers often obtain a series of data relating to tunnel light environment through field tests or simulation experiments. In regard to driver visual adaptation characteristics, researchers proposed a method to determine the brightness of the tunnel entrance section [11,12,13], and established both a visual adaptation model [14,15] and a tunnel lighting brightness adaptation model. Additionally, concerning the comfort and safety characteristics of the light source, the color temperature regulation index evaluation model [16,17,18] and the color temperature and heart rate reaction analysis model [19,20] were established. The color temperature of the light source has also been linked to the pupil area size, operation reaction time, and heart rate of the driver. Further, DIALux software has often been employed in experiments on the characteristics of the different sections of tunnels. Researchers have also either simulated and constructed experimental scenarios of tunnel luminaire lighting to calculate and optimize tunnel designs [21,22,23], or simulated and modeled specific sections to perform tunnel light environment simulation tests [24,25,26]. After reviewing the literature on the analysis methods of tunnel light environment data, it was observed that the previous light environment data, due to its research objectives and the single nature of the research content, led to the data analysis and collation techniques being primarily based on the analysis of mathematical and theoretical models, with the analysis method of discriminating both data and scene images not being utilized.
Due to the development of sensor acquisition, information storage, and analysis technologies, analysis techniques based on digital image processing are being increasingly applied to the subject field of tunneling. In tunnel envelope studies, the implementation of artificial neural network image processing is extensively employed for predicting and analyzing the extrusion deformation of tunnel envelope. Said process involves combining neural network models [27,28] and utilizing the backpropagation (BP) neural network and its optimized morphology for tunnel envelope mechanics [29,30,31]. Artificial neural networks are primarily employed for the prediction of tunnel lighting power [32,33] and in tunnel lighting intelligent control system designs [34,35,36]. To summarize, although the research on the combination of artificial neural networks and tunnels is progressing, the research on the predictive analysis of tunnel light environments based on digital image processing is still in the early stages.
In order to solve the aforementioned problems, the use of a convolutional neural network (CNN) for predictive analysis of the sensitivity of light environment parameters in the middle section of highway tunnels is proposed in the present paper. The CNN was based on the convolutional neural network algorithm and utilized the residual network RseNet to extract data features. The pyramidal pooling network module was subsequently employed, which involved the global mean pooling operation and feature fusion. The tunnel light environment composition parameters and experimental data were introduced to compare and analyze a variety of adaptive learning rate optimization algorithms to reduce the gradient calculation time, maximize the feature data extraction, optimize the network structure, and shorten the training period. Finally, the images generated from the prediction data and the mathematical analysis results were synthesized and analyzed to provide a more intuitive and comprehensive judgment of the sensitivity of the light environment parameters in the middle section of the highway tunnel. The present study serves to expand the use of the CNN model in tunnel light environment research and provides a new path for evaluating the quality of tunnel light environment.

2. Acquisition of Eye-Movement Characteristics Parameters Required for the Convolutional Neural Network (CNN) Judging Method

Because the tunnel vault is easily contaminated, the reflectivity of the tunnel vault is less focused upon. The typical reflectivity of the tunnel pavement is approximately 0.2 (0.15 for asphalt pavement and 0.2 for cement pavement). Due to the influence of the light source, the reflected light intensity changes quite frequently, so, at present, the reflectivity is primarily used as the expression index. Because of the low reflectivity of the tunnel road surface and vault, the influence on the tunnel light environment is small. Therefore, in the present study, the lamp arrangement method was employed, and the sidewall reflective coating deployment height, sidewall reflective coating color, and LED light source color temperature were used as test factors.

2.1. Experimental Light Environment Composition

2.1.1. Side Wall Reflective Material Laying Height Setting

When laying height for reflective material on tunnel sidewalls in adherence to the current Chinese highway tunnel lighting specifications, “Highway Tunnel Lighting Design Rules” [21] dictates that the minimum height of the tunnel sidewalls must not be less than 2 m and should be laid with reflective material that exhibits a minimum reflectivity of 0.7. Consequently, the laying height of the reflective material on the sidewall was set at 2 m, 2.5 m, 3 m, and 3.5 m in the present study.

2.1.2. Color Selection of Sidewall Reflective Material

According to the Purkinje effect, when people change from day vision to night vision, the maximum sensitivity of the human eye to light moves in the direction of the higher frequency. So when selecting the sidewall material color, red and orange are more vivid during bright adaptation, while blue appears brighter during dark adaptation [37,38,39,40]. However, red should be used carefully in the traffic safety design as it is significantly penetrating and possesses the connotation of forbidden and dangerous, making it overwhelming for human visual stimulation [41,42].
The color of tunnel sidewalls is commonly white. Regarding other colors, blue and green are often chosen as blue looks brighter during dark adaptation, green is common in the road landscape, and they are both cool and receding colors. Additionally, yellow is also commonly used as the forward color in the road landscape, with yellow possessing eye-catching effects. Compared with red and orange, the visual stimulation of yellow is weaker. Therefore, from the perspective of comprehensive consideration, yellow, white, green, and blue were chosen for the present.

2.1.3. Luminaire Color Temperature Settings

When testing the LED light source color temperature on individuals’ color discrimination ability, Pedro J. Pardo et al. found that testers’ color discrimination increased when the LED correlation color temperature was below 6500 K [42]. By comparing the color temperature of tunnel lamps and lanterns commonly used in the market, it was found that the color temperature range of tunnel LED lamps and lanterns is 4000–6000 K, with the newly introduced LED lamps and lanterns typically possessing higher color temperature values compared with the older LED lamps. Therefore, LED lamp color temperatures of 3500 K, 4500 K, 5500 K, and 6500 K were used in the present study.

2.1.4. Lighting Layout Settings

The luminaire arrangement and luminous flux values were set in accordance with the “Highway Tunnel Lighting Design Rules” [21]. To strictly control the test variables, it was assumed that the LED lighting efficiency (the ratio of the luminous flux emitted by a light source to its power consumption) was the same in the test. The test was conducted to ensure that the total power consumption of the lighting remained unchanged and to explore the impacts of the lamp deployment method on the lighting effects in the tunnel environment. The luminaires were laid out as detailed in Table 1.

2.2. Experimental Protocol

2.2.1. Orthogonal Experimental Design

An orthogonal design is one of the most commonly employed experimental designs. An orthogonal design is an effective statistical method for solving multi-factor test problems, and involves the characteristics of balanced dispersion and neat comparability. Through balanced dispersion, the distribution of each factor level combination selected from the orthogonal table is uniform in all level combinations. The levels of each factor are comparable with each other due to the neat and comparable means produced by the orthogonal design. Because the level of each factor in the orthogonal table contains a balance of the levels of other factors, the effects of other factors cancel each other out when comparing the various levels.
Consequently, the orthogonal test design was employed in the present study and a total of four factors were established: A (luminaire deployment method), B (sidewall reflective coating deployment height), C (sidewall reflective coating color), and D (LED light source color temperature). Four levels were set for each factor and the factor level table can be observed in Table 2. During the proposed period, the optimized level combinations of each test factor in the tunnel lighting light environment under different working conditions were obtained through the orthogonal test scheme.

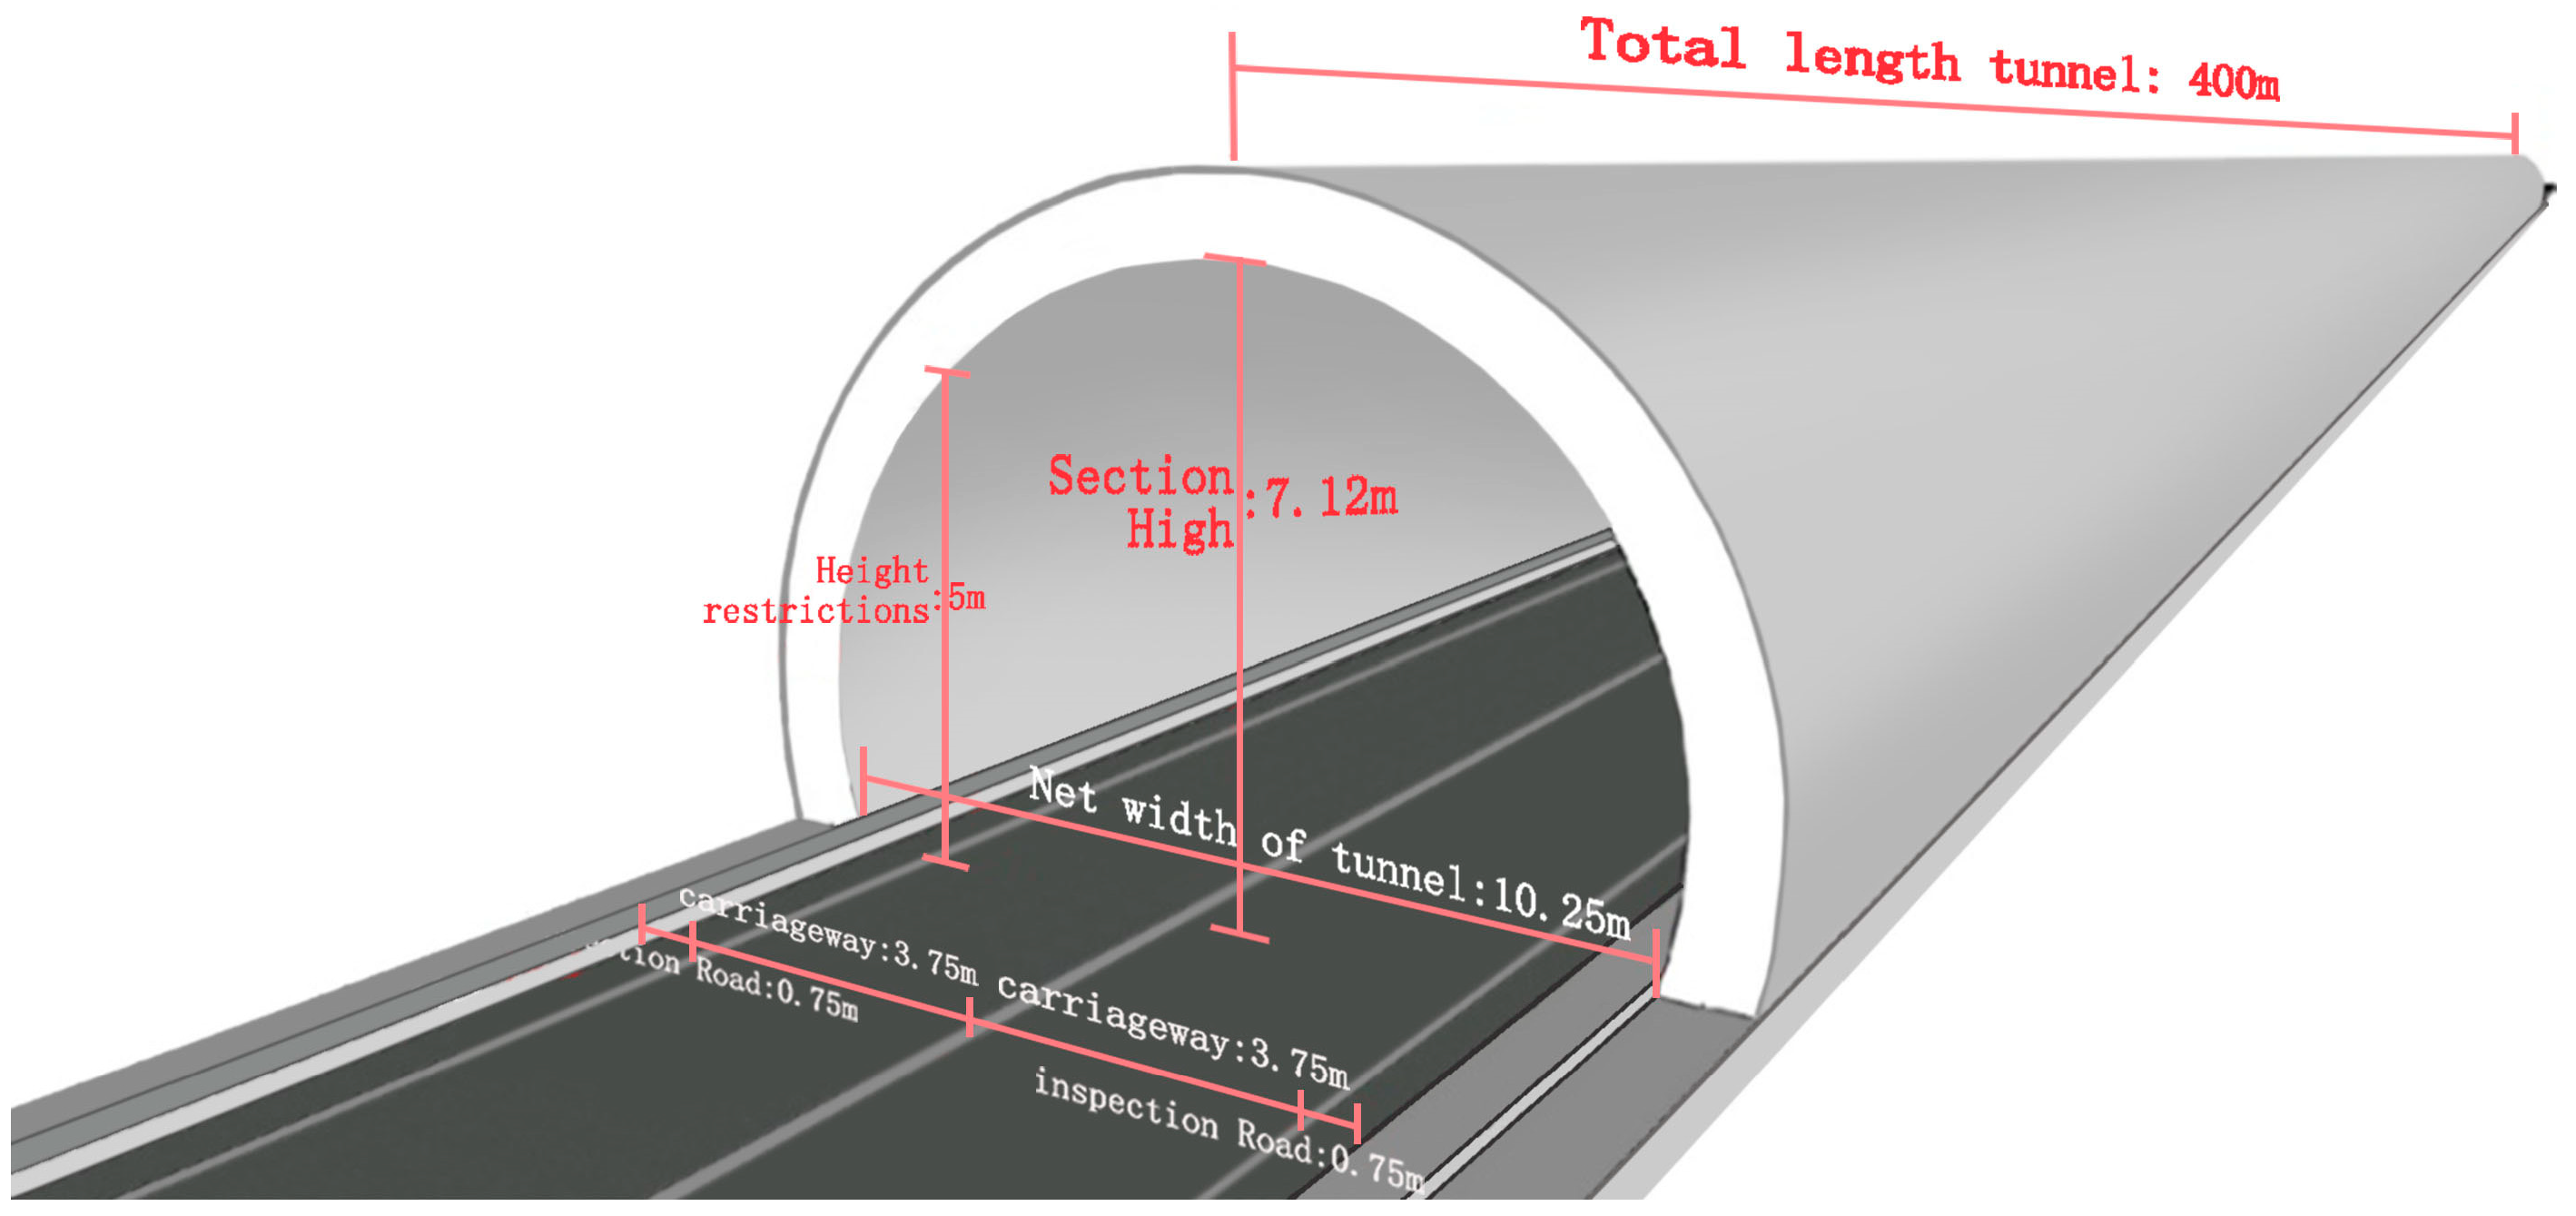
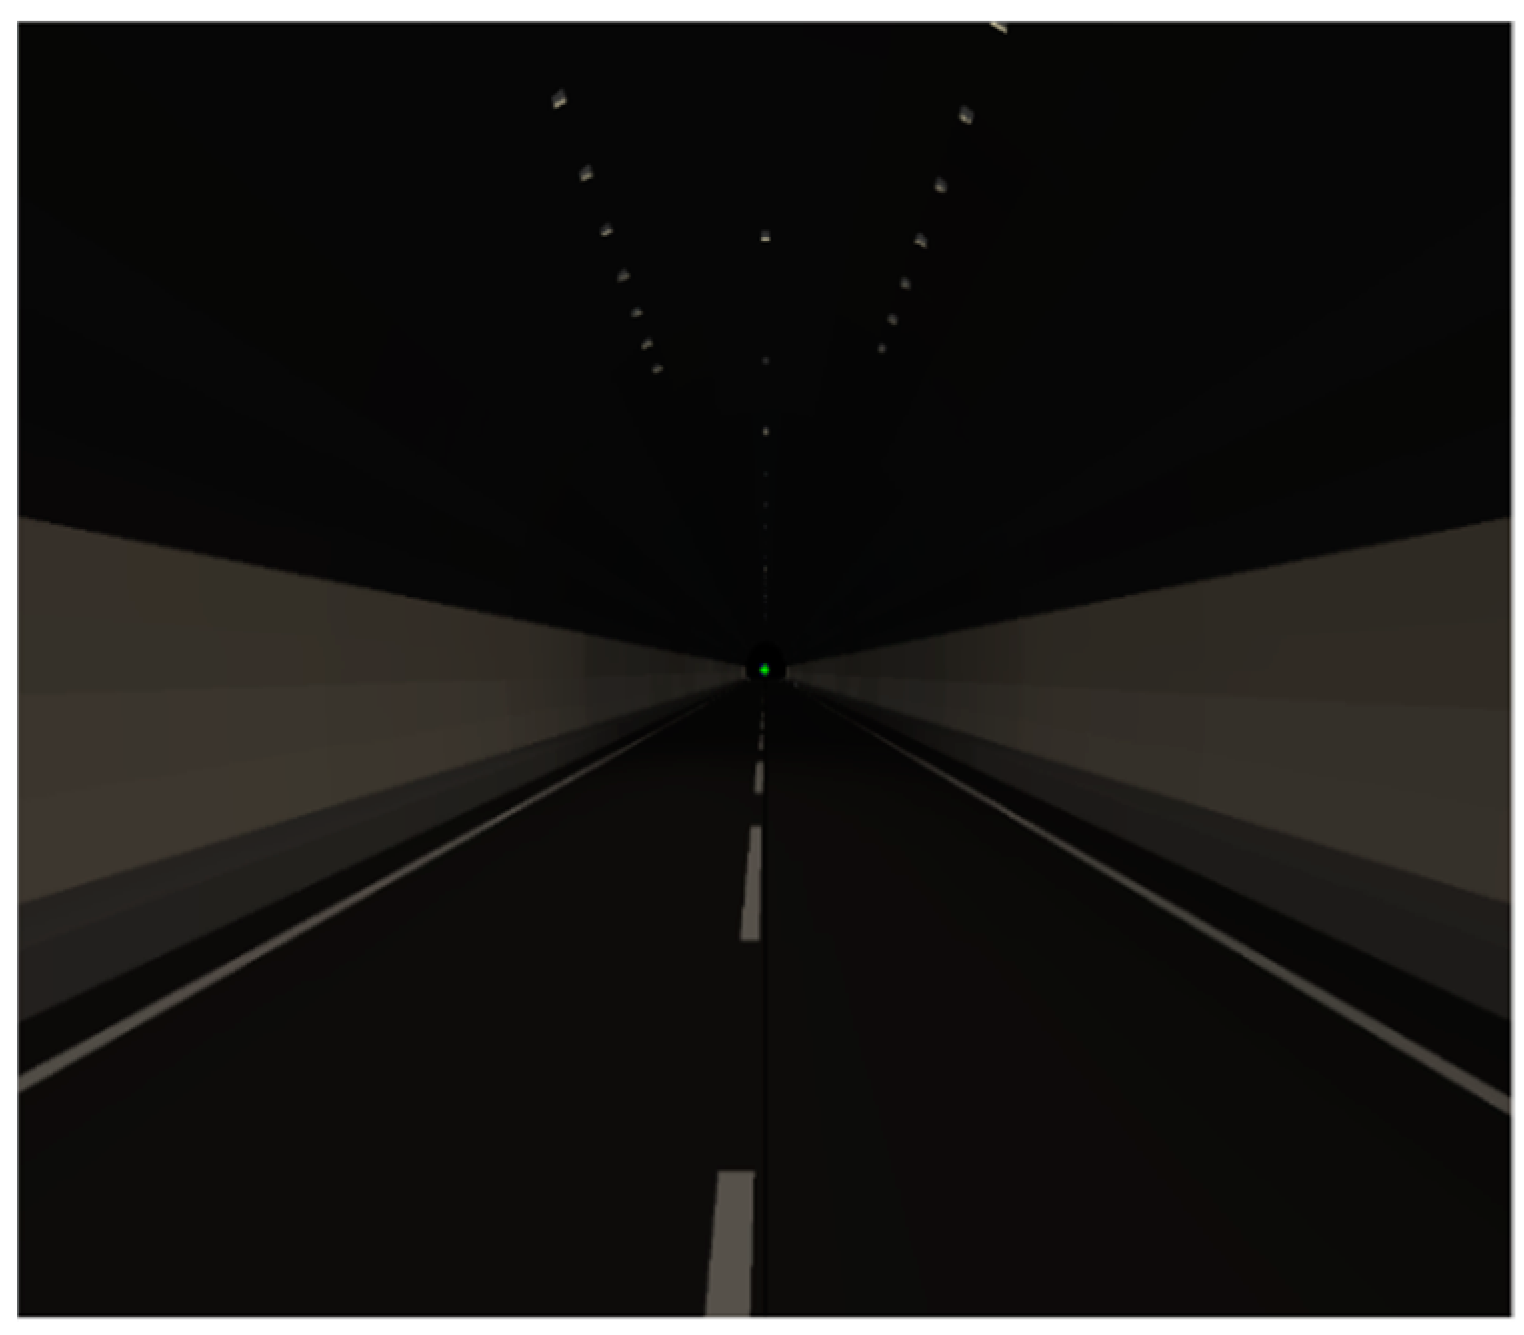
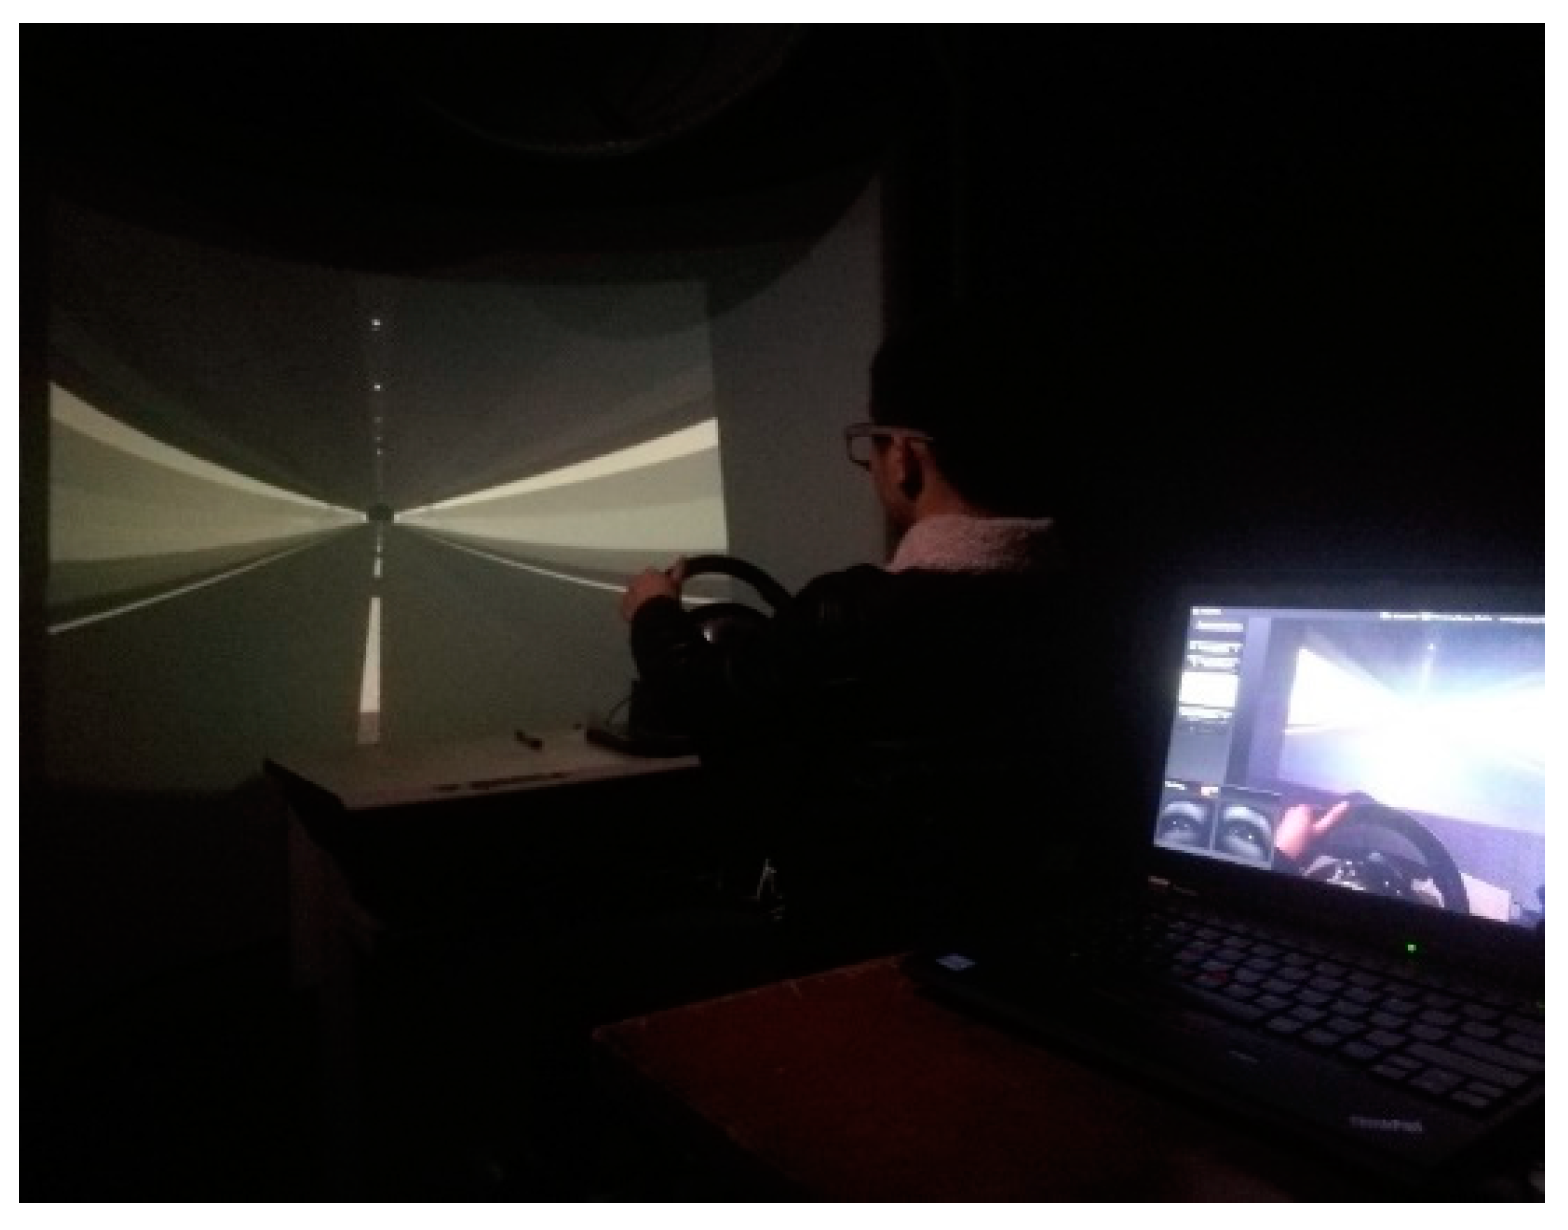
2.2.2. Dynamic Driving Simulation Test

(1)
Test Working Conditions
The present test was a 4-factor, 4-level test, in which the interactions were not considered. With an orthogonal table being most appropriate, four factors occupied a total of four columns, choose L16 (45), and there was one empty column (E) that served as a test error to measure the reliability of the test. A total of 16 groups of illumination test protocols were tested, as articulated in Table 3.
(2)
Test Model and Parameters
DIALux was utilized to build the animation model required for the present experiment. To maximize the real driving situation, the tunnel lighting entrance section, middle section, and exit section were established in accordance with China’s current “Highway Tunnel Lighting Design Rules” [21]. Concurrently, the tunnel simulation model was built corresponding to the Highway Tunnel Design Specification (JTG337.1-2018). The experimental model was a two-lane tunnel with a net width of 10.25 m, i.e., 3.75 × 2 (traffic lane) + 0.75 × 2 (maintenance lane) + 0.5 (left-hand width) + 0.75 (right-hand width), with a height limit of 5.0 m and a section height of 7.12 m. The traffic characteristics were one-way traffic and the design speed was 60 km/h. In order to guarantee the stability and dependability of the experimental outcomes, it was imperative that the length of the tunnel not be excessively short. Following the calibration of the tunnel model (Figure 1), a final length of 400 m was determined. The middle section lighting settings adhered to the “highway tunnel ventilation lighting design specifications” and were designed for the average luminance of 1.5 cd/m2, that is, the average illuminance of 5 Lx. The tunnel lighting settings for the entrance and exit sections are shown in Table 4.
Following the creation of the model, the required video was exported via the “Save 3D video” menu of the DIALux software. Before exporting the video the camera path had to be defined (Table 5). Regarding the modeling process, the X-axis was used as the centerline of the tunnel in spatial coordinates and the camera path was the X-axis. A sample screenshot of the simulation animation video (centerline light + 2 m + yellow + 3500 K) is illustrated in Figure 2.
(3)
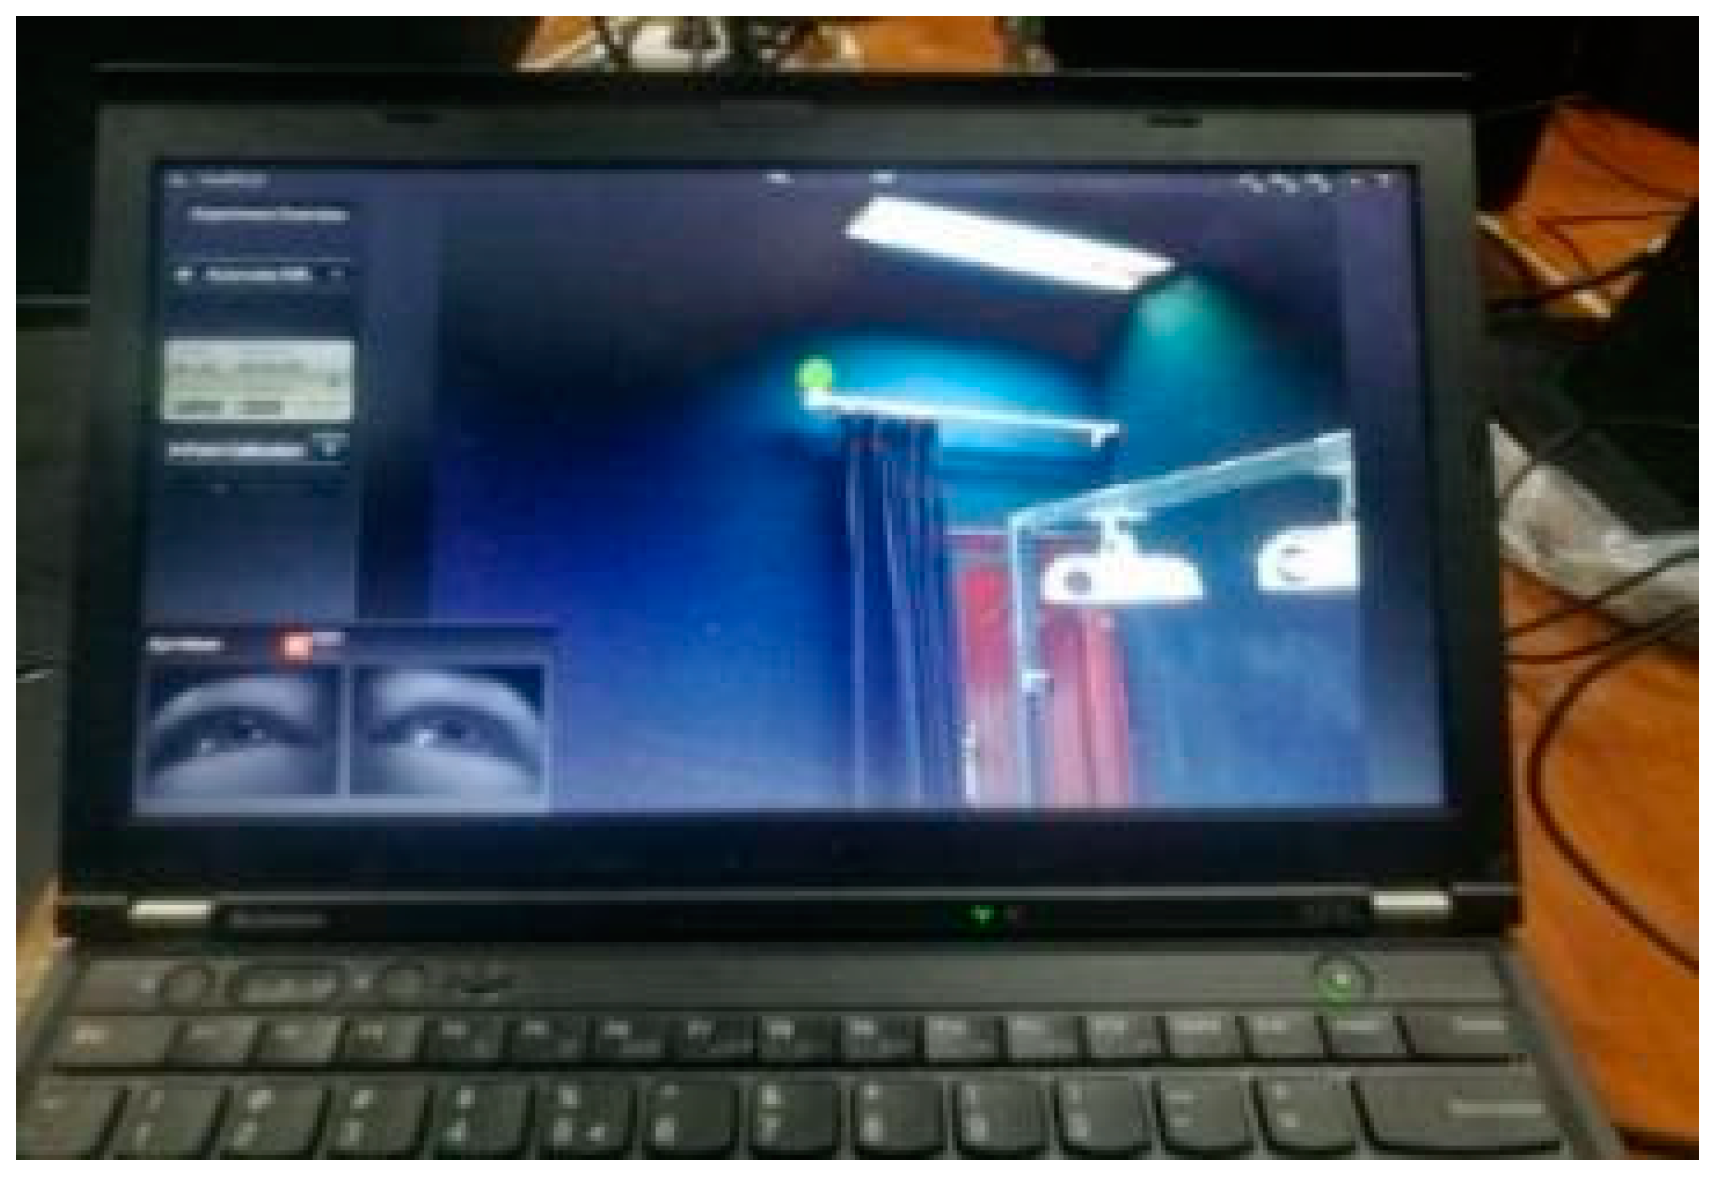
Experimental Testing
The simulation tests were conducted on an indoor simulation platform developed specifically for the present study. The test platform was comprised of a video projection system, a data acquisition system, and a driving simulation system, enabling dynamic driving simulation and the acquisition of eye-tracking parameters.
A total of 30 participants were selected and then divided into three groups (10 people in each group) numbered as I, II, and II. Each participant was tested three times to improve the accuracy of statistical analysis as well as the reliability of the data, and to reduce the data error. The information concerning the participants can be observed in Table 6.
The subjects in the present experiment were 2.5 m away from the screen (refer to the parameters of the laboratory test vehicle Volkswagen Magotan). The visual field range of the subjects utilizing the 200-inch 16:9 curved screen was between 35 to 60 degrees. The specific test steps were as follows.
(1) First, the projection equipment was debugged to ensure that the driving simulation video was not skewed, too small, or too large when projected on the curved screen.
(2) To ensure that the position of the line of sight drop point and eye-tracking instrument acquisition point position were synchronized, the SMI eye-tracking instrument was then debugged and participants wearing the SMI eye-tracking instrument had it calibrated. The eye-tracking instrument debugging process is shown in Figure 3.
(3) During the data collection experiment, the external lamps, doors, and windows were closed in order to simulate the dark environment of a tunnel, participants adjusted to their SMI eye-tracking device, the driving simulation video was played, and the participants then handed in their SMI eye-tracking device for test data collection. The spatial field of vision (FOV) of individuals differs from the effective FOV as the central FOV and peripheral FOV are also included. The driver’s effective FOV refers to the driver’s ability to rapidly process information, while the spatial FOV refers to the maximum spatial range of objects that can be perceived. The central FOV is the scope in which objects are observed, and the peripheral FOV refers to the maximum space range that the driver can perceive when looking at an object that is directly ahead. The range of the peripheral FOV is approximately 55° in the upper side, 70° in the lower side, 60° in the nasal side, and 90° in the temporal side. Another factor that affects the drivers’ sight is the surrounding vehicles. When traveling straight ahead, the range of the left viewing angle of the front car is typically 20~30, the right viewing angle is around 35~45, the left viewing angle of the flat car is approximately 35, and the right viewing angle typically ranges from 55~60. So the SMI eye tracker could satisfy the requirements of the test, the FOV’s range in which the driver could collect effective visual information during driving was referred to as the effective visual field in the present study.
(4) Regarding output test data, a ThinkPad laptop and its own data processing software was employed to record data and perform outputs for processing. The test process is shown in Figure 4.

2.3. Experimental Results

The present experiment was conducted using an indoor simulation platform. The average pupil diameter data of the three groups can be seen in Table 7.

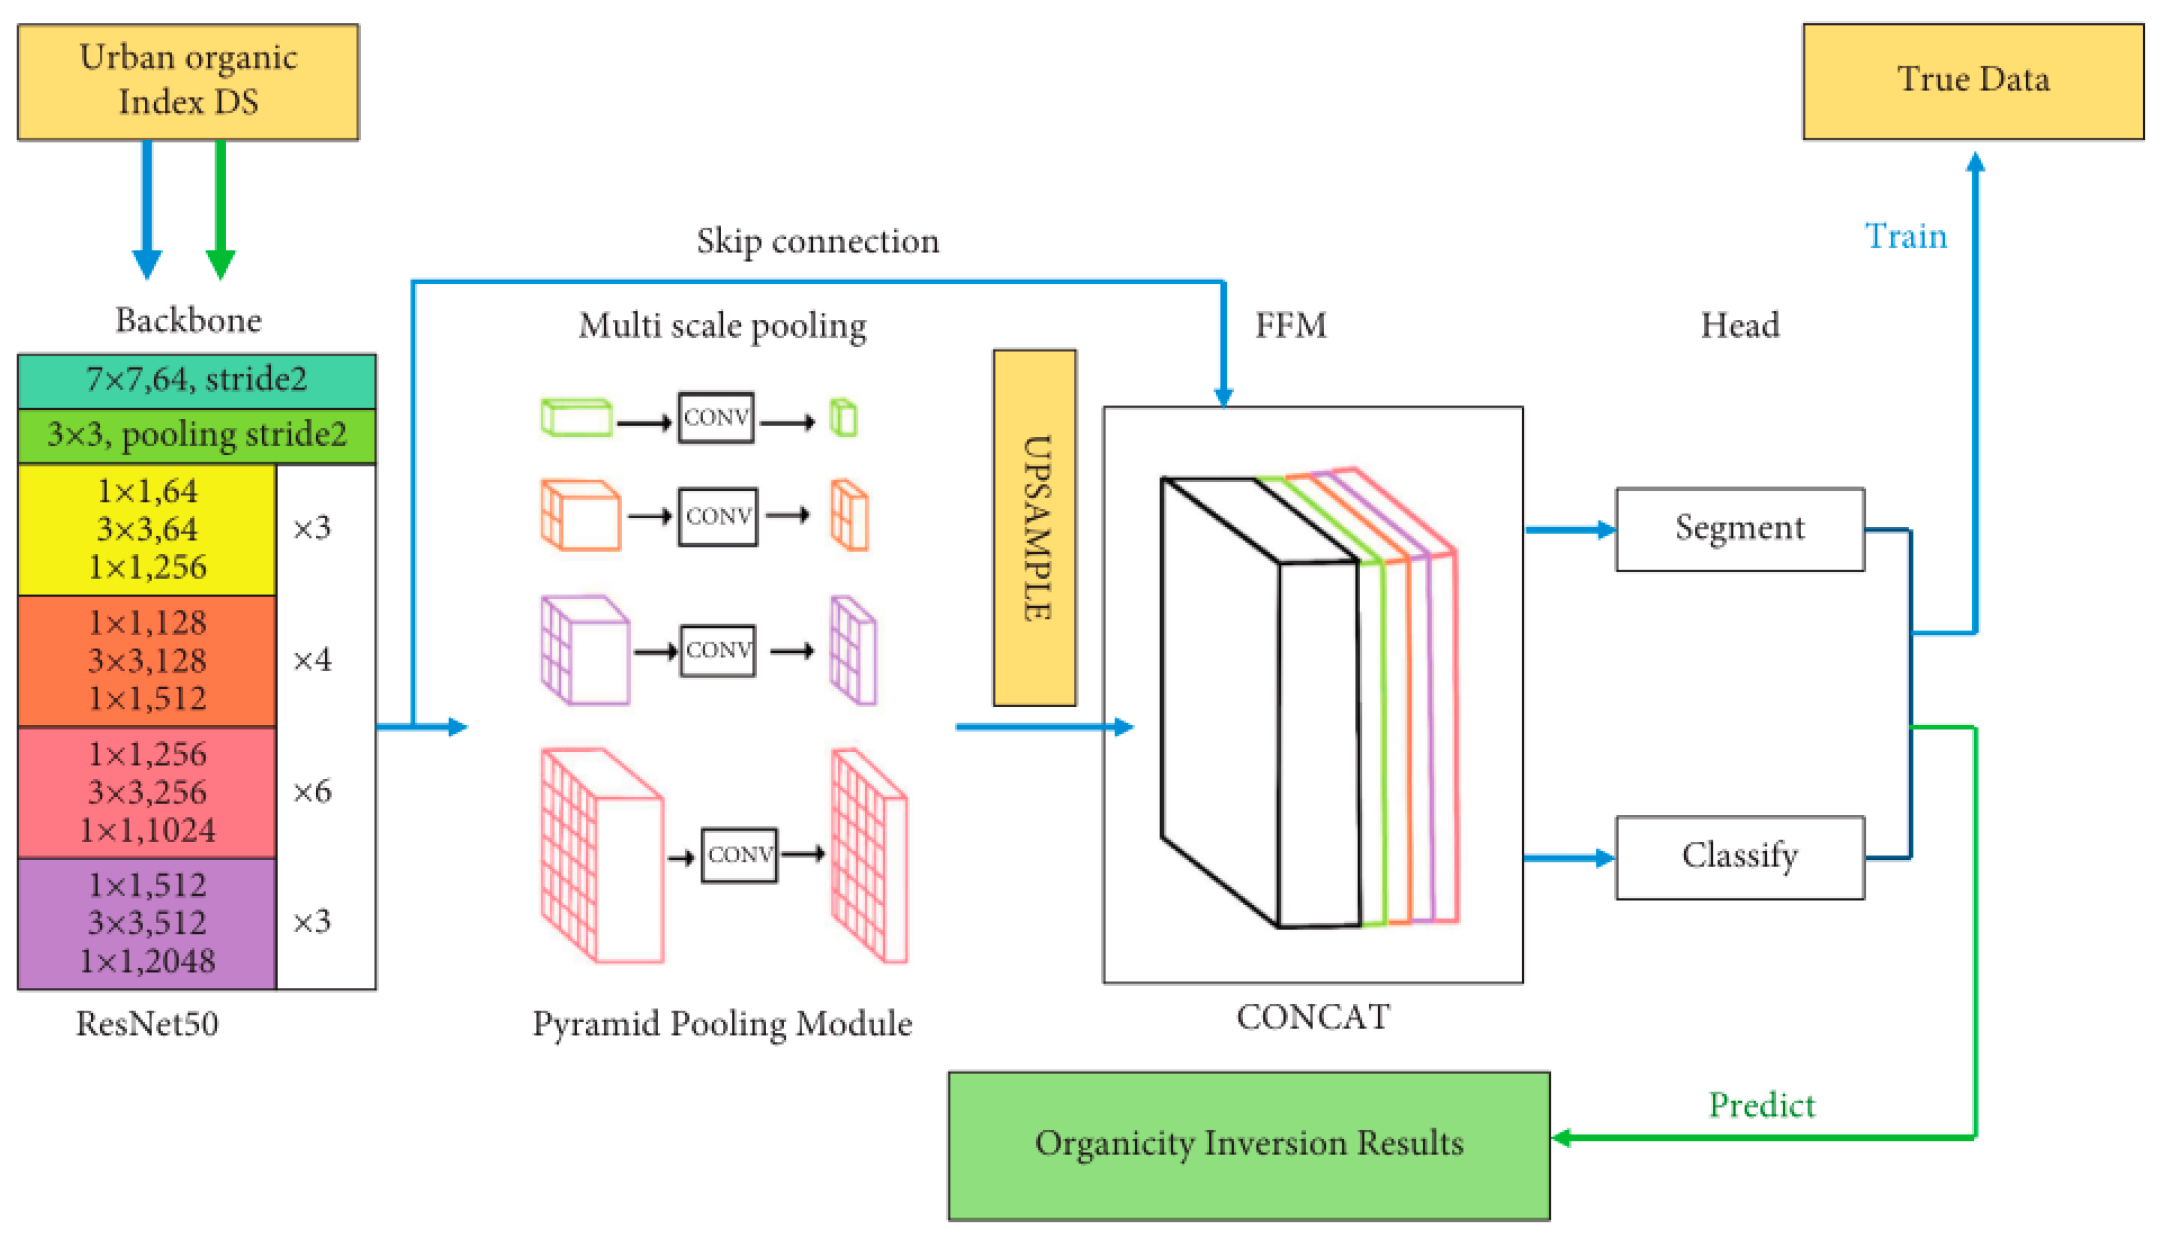
3. Convolutional Neural Network Judging Model Construction

In order to design a network framework structure applicable to the characteristics of light environment data in the middle tunnel section, sensitivity analyses of the light environment parameters in the middle tunnel section were conducted using CNNs. In the present paper, the pooling module of the Pyramid Scene Parsing Network (PSPNet) and Residual Network (ResNet) are introduced when discussing the characteristics of the light environment data for the middle section of the tunnel. The design of the network model consisted of a neural network structure with a front-end backbone network (Backbone), a feature extraction network (Neck), and a network output (Head).

3.1. Main Structure

The first step was to collate the values of the luminaire arrangement, sidewall reflective paint placement height, sidewall reflective paint color and LED light source color temperature under different setting conditions, and pupil diameter values under different combinations of light environment parameters. After inputting the collated data, the front-end backbone network extracted the data features to be used in the subsequent network, in which ResNet50 was utilized. Subsequently, the pyramid pooling model was employed to extract multi-scale information and upsampling was conducted to extract the overall and local information. By using the Feature Fusion Module (FFM), different levels of feature data were stitched together through hopping connections. Finally, two judgments of segmentation and classification through the output network were established (Figure 5).
The environmental parameter data set was entered into the front-end backbone section of the network. Based on the backpropagation formula, when the value of the input layer became extremely large, the gradient value calculated via backpropagation to the input layer increased significantly. Consequently, the learning rate was smaller, and the parameter weights and gradients of the different neural network layers varied significantly in order of magnitude, consuming a substantial amount of search computation time. Therefore, the data information contained therein was first processed by Batch Normalization (BN) and the BN process was performed during the data processing of the intermediate hidden layers. The nonlinear expression of the network was enhanced following the BN process, ensuring the optimal computation process.
The BN algorithm flow was as follows:
Batch input x (min-batch): β = { x 1 , x 2 , , x n }
Normative network output: y i = { B N y , β ( x i ) }
  • Calculate the mean value of batch data: μ ρ 1 m i = 1 m x i
  • Calculate the variance of the batch data: σ β 2 1 m i = 1 m ( x i μ β ) 2
  • Normalization: x i x i μ β σ β 2 + ε
  • Scale changes and offsets: y i γ x i + β = B N γ ,   β ( x i )
  • Return value: the learned parameters scale factor γ and translation factor β .
The three-channel data information was passed through the designed network’s front-end backbone module, Resnet50, and filtered 64 times with a 7 × 7 convolution filter to obtain 64 channels of data. The 64 channels of data were pooled with a 3 × 3 pooling window and subsequently expanded to 2048 channels after the convolution operation was conducted 48 times. The discussed steps allow the maximum extraction of the characteristics of the data information. The data forward propagation was calculated in accordance with the Pyramid pooling module and pooling was performed with 1 × 1, 2 × 2, 3 × 3 and 6 × 6 pooling windows. As a result, a multi-scale data feature map was obtained and the number of channels was reduced by the convolution operation of the 1 × 1 filter. Additionally, the output data was upsampled via bilinear interpolation and entered into the feature fusion module. The feature fusion module typically employs two methods: one method is to combine the number of channels (Concatenate/Concat) and the other is to sum up the corresponding feature maps and perform a convolution operation. If the input channels are x 1 ,   x 2 ,   ,   x n and y 1 ,   y 2 ,   ,   y n , the merged channel Concat conducts the convolution operation on the input.
Concat = i n x i k i + i n y i k i + n

3.2. Loss Function

Upon propagation of the data to the output layer, semantic segmentation is required to partition the computed data outcomes into their respective categories. In the case of binary classification, the last layer of the neural network employs the Sigmoid activation function, whereas for the multiclass classification problem addressed in the present study, the Softmax activation function was utilized. In the process of classification, such function maps the output of multiple neurons between (0, 1) to accomplish the classification task. Notably, machine learning is often used to solve three major types of problems: regression problems, classification problems, and clustering problems. In consideration of the training time and difficulty, the aim of the present study was to classify the output of the data as a discrete classification problem. At the same time, the mean square error (L2 parametric) loss function commonly used in regression problems was added to the objective function.
The Softmax function is defined as follows.
a j = e z j i e z j
where z j denotes the input of the jth neuron of the last layer of the network; a j denotes the output of the jth neuron in the last layer; the natural number e is used to increase the difference in probability; and i e z j is the sum of the inputs of all neurons in the last layer. The use of the Softmax function is significant in that it enables the output of the final layer of neurons to be represented as a probability distribution. This allows for the evaluation of the validity of a specific category corresponding to a neuron, based on the magnitude of its associated probability. As the probability of the output of a given neuron increases, so too does the truthfulness of the category corresponding to that neuron.

3.3. Training and Prediction

The training set was divided into eight types according to the morphology of the combination of light environment parameters, that is, luminaire placement method, sidewall reflective coating placement height, sidewall reflective coating color, LED light source color temperature, staggered on both sides, symmetrical on both sides, sideways on the center line and symmetrical on the center line. The eight types were combined with each other, and a total of 256 random combination models were designed in the end.
In the first step, after determining the combined content of the model, a 256-count simulation calculation was performed, which was repeated by the code written to implement the stochastic model.
In the second step, the calculated response data of the light environment parameters were organized into plots to obtain 256 pairs of response model plots, wherein the response data set was used as the input sample and the national standard specification design parameters were used as the calibration data set, thereby ensuring the mutual correspondence between the input data set and the calibration data set.
Finally, to improve the weight assignment of each node of the convolutional neural network, the training data set was input into the designed convolutional neural network (CNN) for periodic training. After a certain number of training rounds (Epoch), the data to be inverted was finally input into the neural network, which allowed for prediction of the data to be realized and inversion results to be obtained.

4. Sensitivity Evaluation Analysis of Light Environment Parameters in the Middle Section of Tunnel Based on Convolutional Neural Network

Sixteen sets of tunnel layout models were randomly selected as examples of the inverse effect of convolutional neural networks. Pseudo-color maps are frequently utilized in lighting design to assess the lighting conditions of installed fixtures, serving as a means of visualizing the status of the lighting fixtures in real-world scenarios. In the present study, a pseudo-color map was used as the data image for the convolutional neural network (CNN) evaluation method, and the sensitivity of the tunnel light environment parameters was investigated by combining the changes in human eye pupil diameter under different tunnel deployment states. The first column of the inversion results is the simulated response result profile, the second column is the deep learning inversion result, and the third column is the design parameter model required by the national standard.

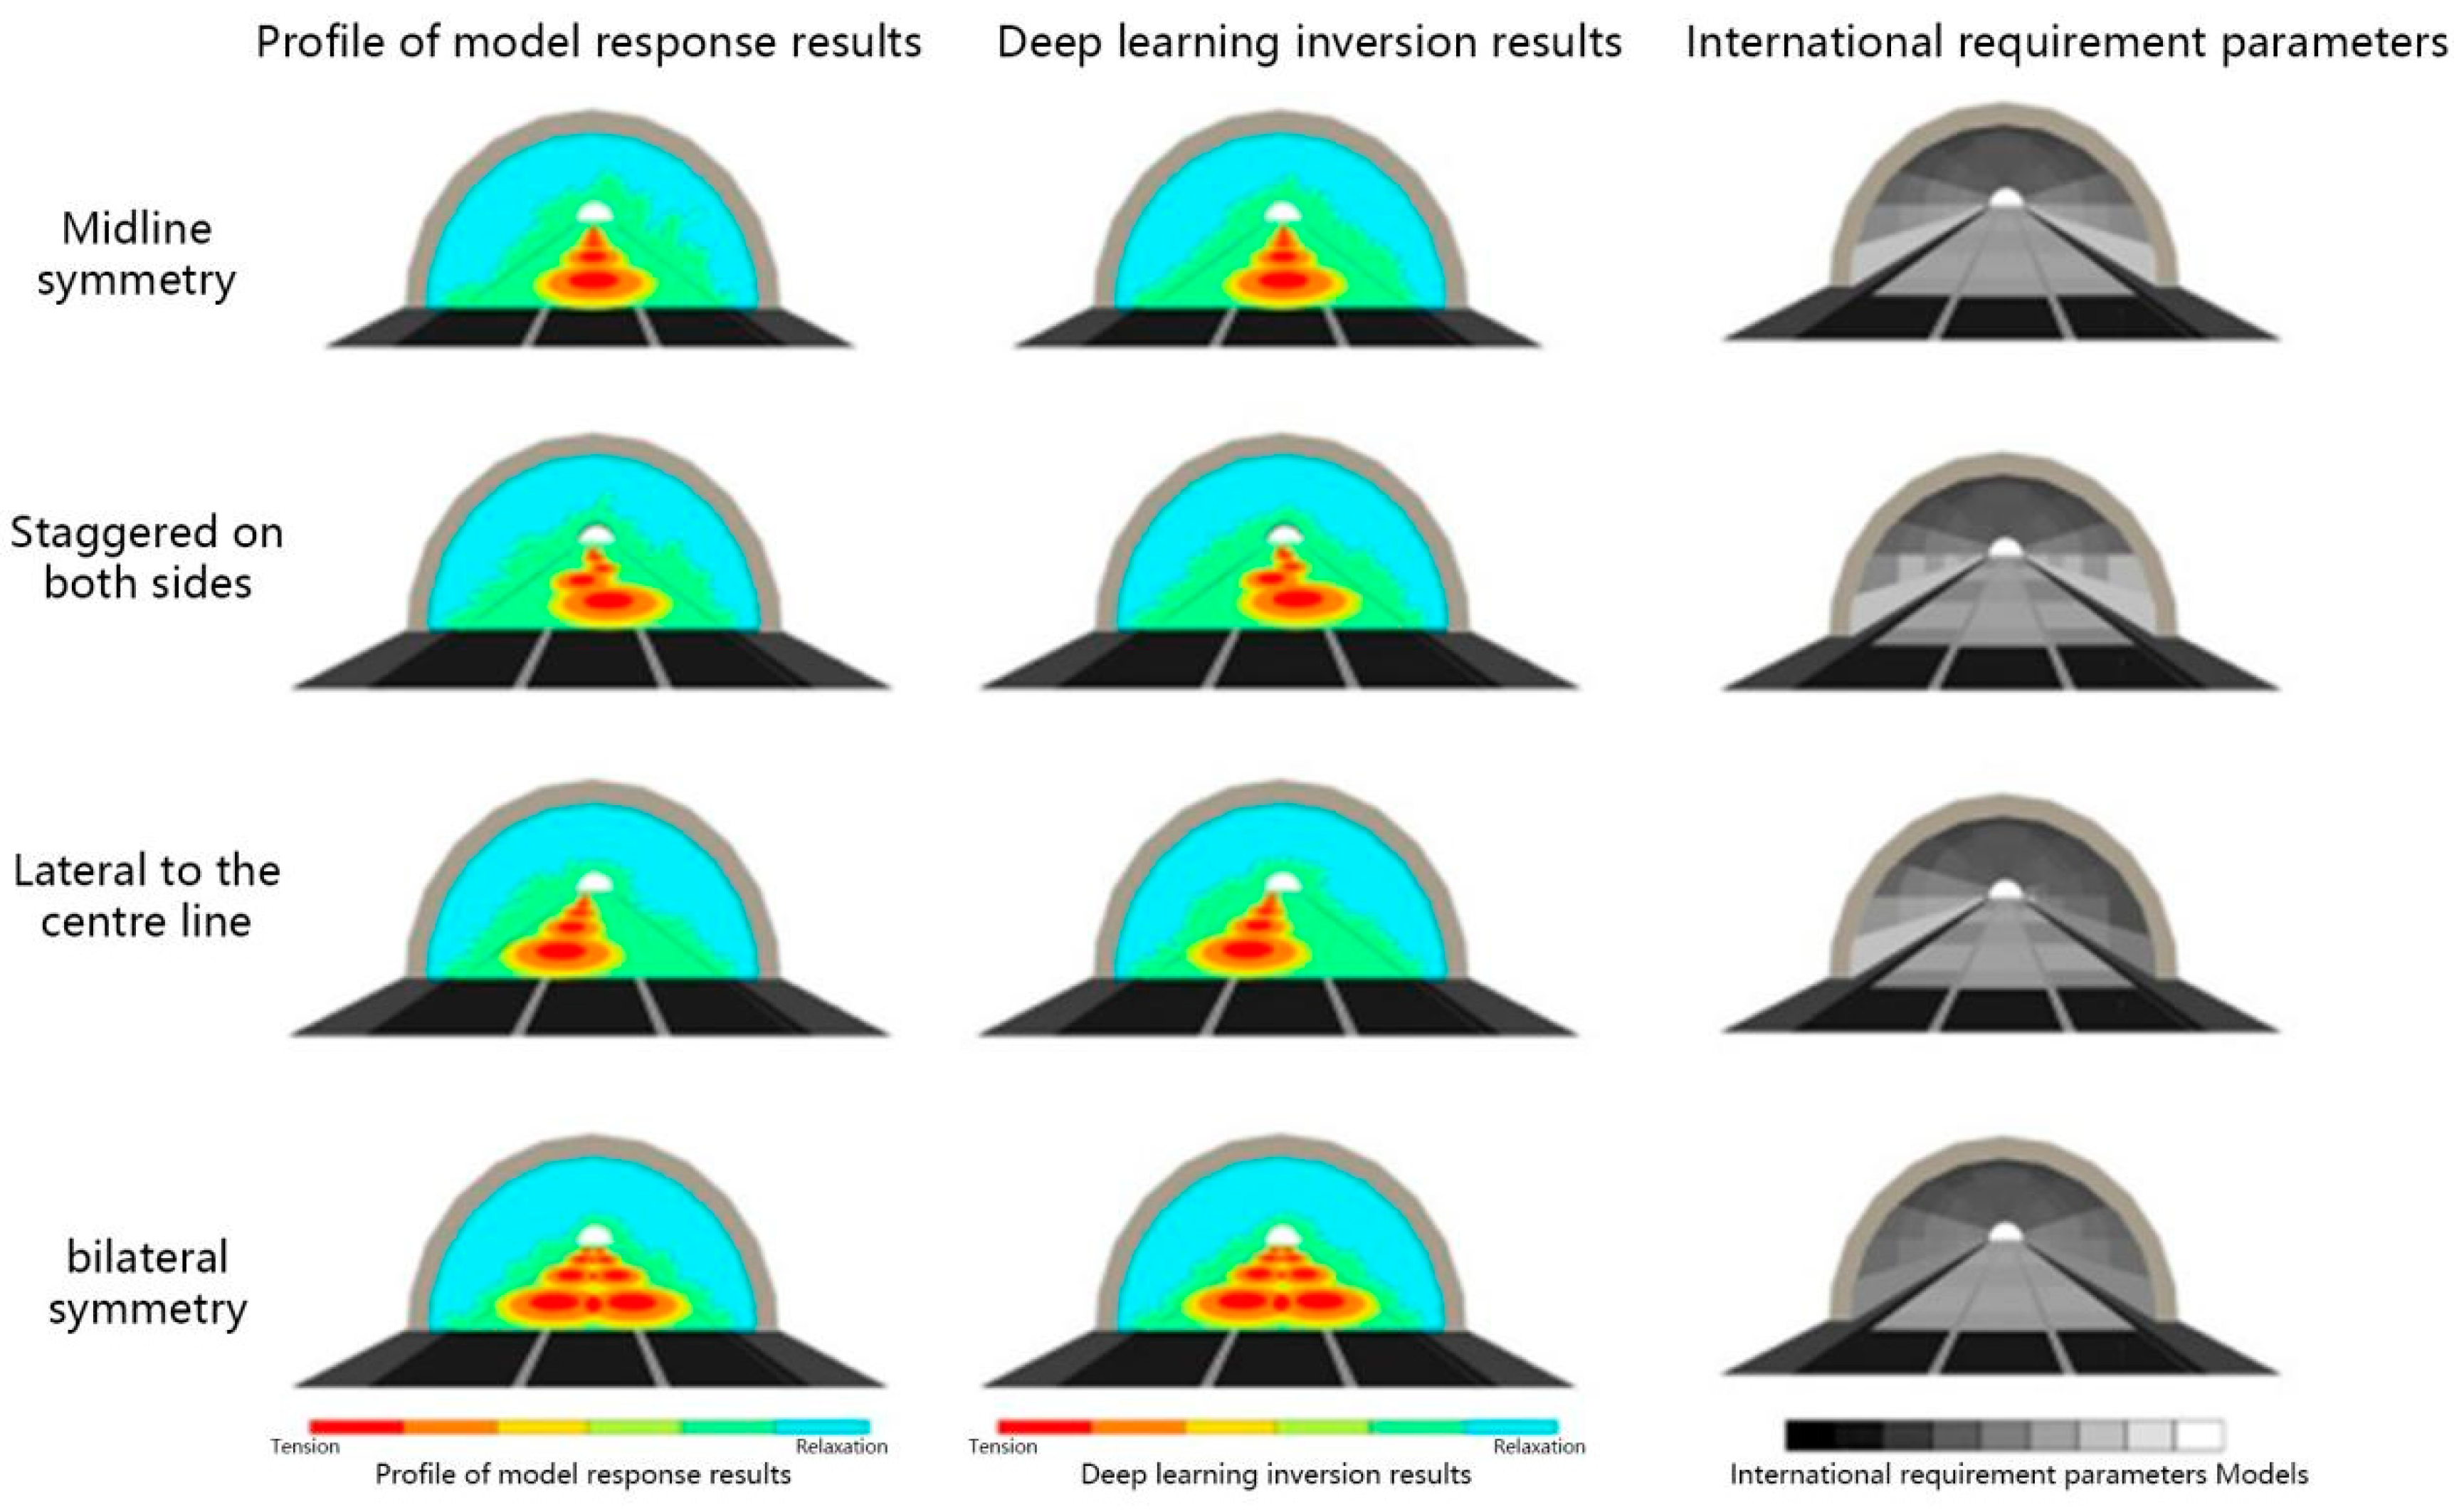
4.1. Sensitivity Analysis of Luminaire Deployment Methods

The initial phase of evaluating convolutional neural networks (CNNs) involved analyzing the sensitivity of the luminaire deployment method. To achieve this, a test working condition was established with a sidewall reflective coating deployment height of 2 m and a white reflective coating color. The LED light source’s color temperature was set at 6500 K, and the luminaire deployment methods included staggered deployment on both sides, symmetrical deployment on both sides, lateral deployment on the center line, and symmetrical deployment on the center line. By utilizing convolutional neural network inversion calculations, the variations in pupil diameter under such specific operating conditions were combined (Table 8), and sensitivity analysis of the luminaire layout was conducted, as shown in Figure 5. The first row shows the luminaire layout symmetry in the center line, the second row shows the luminaire layout staggered on both sides, the third row shows the luminaire layout off-side in the center line, and the fourth row shows the symmetry on both sides. The simulated response model of the luminaire layout can be observed in the accompanying figure. The luminaire layout had a noticeable impact on the morphology of the pupil’s field of view, as demonstrated by changes in the layout. Although there were some characteristic differences, the deep learning inverse performance results align almost exactly with the model’s design requirements stipulated by national standards. In terms of the sensitivity of the luminaire deployment method, the degree of influence on the pupil diameter could be ranked as follows: staggered on both sides > symmetrical on both sides > lateral to the midline > symmetrical to the midline.

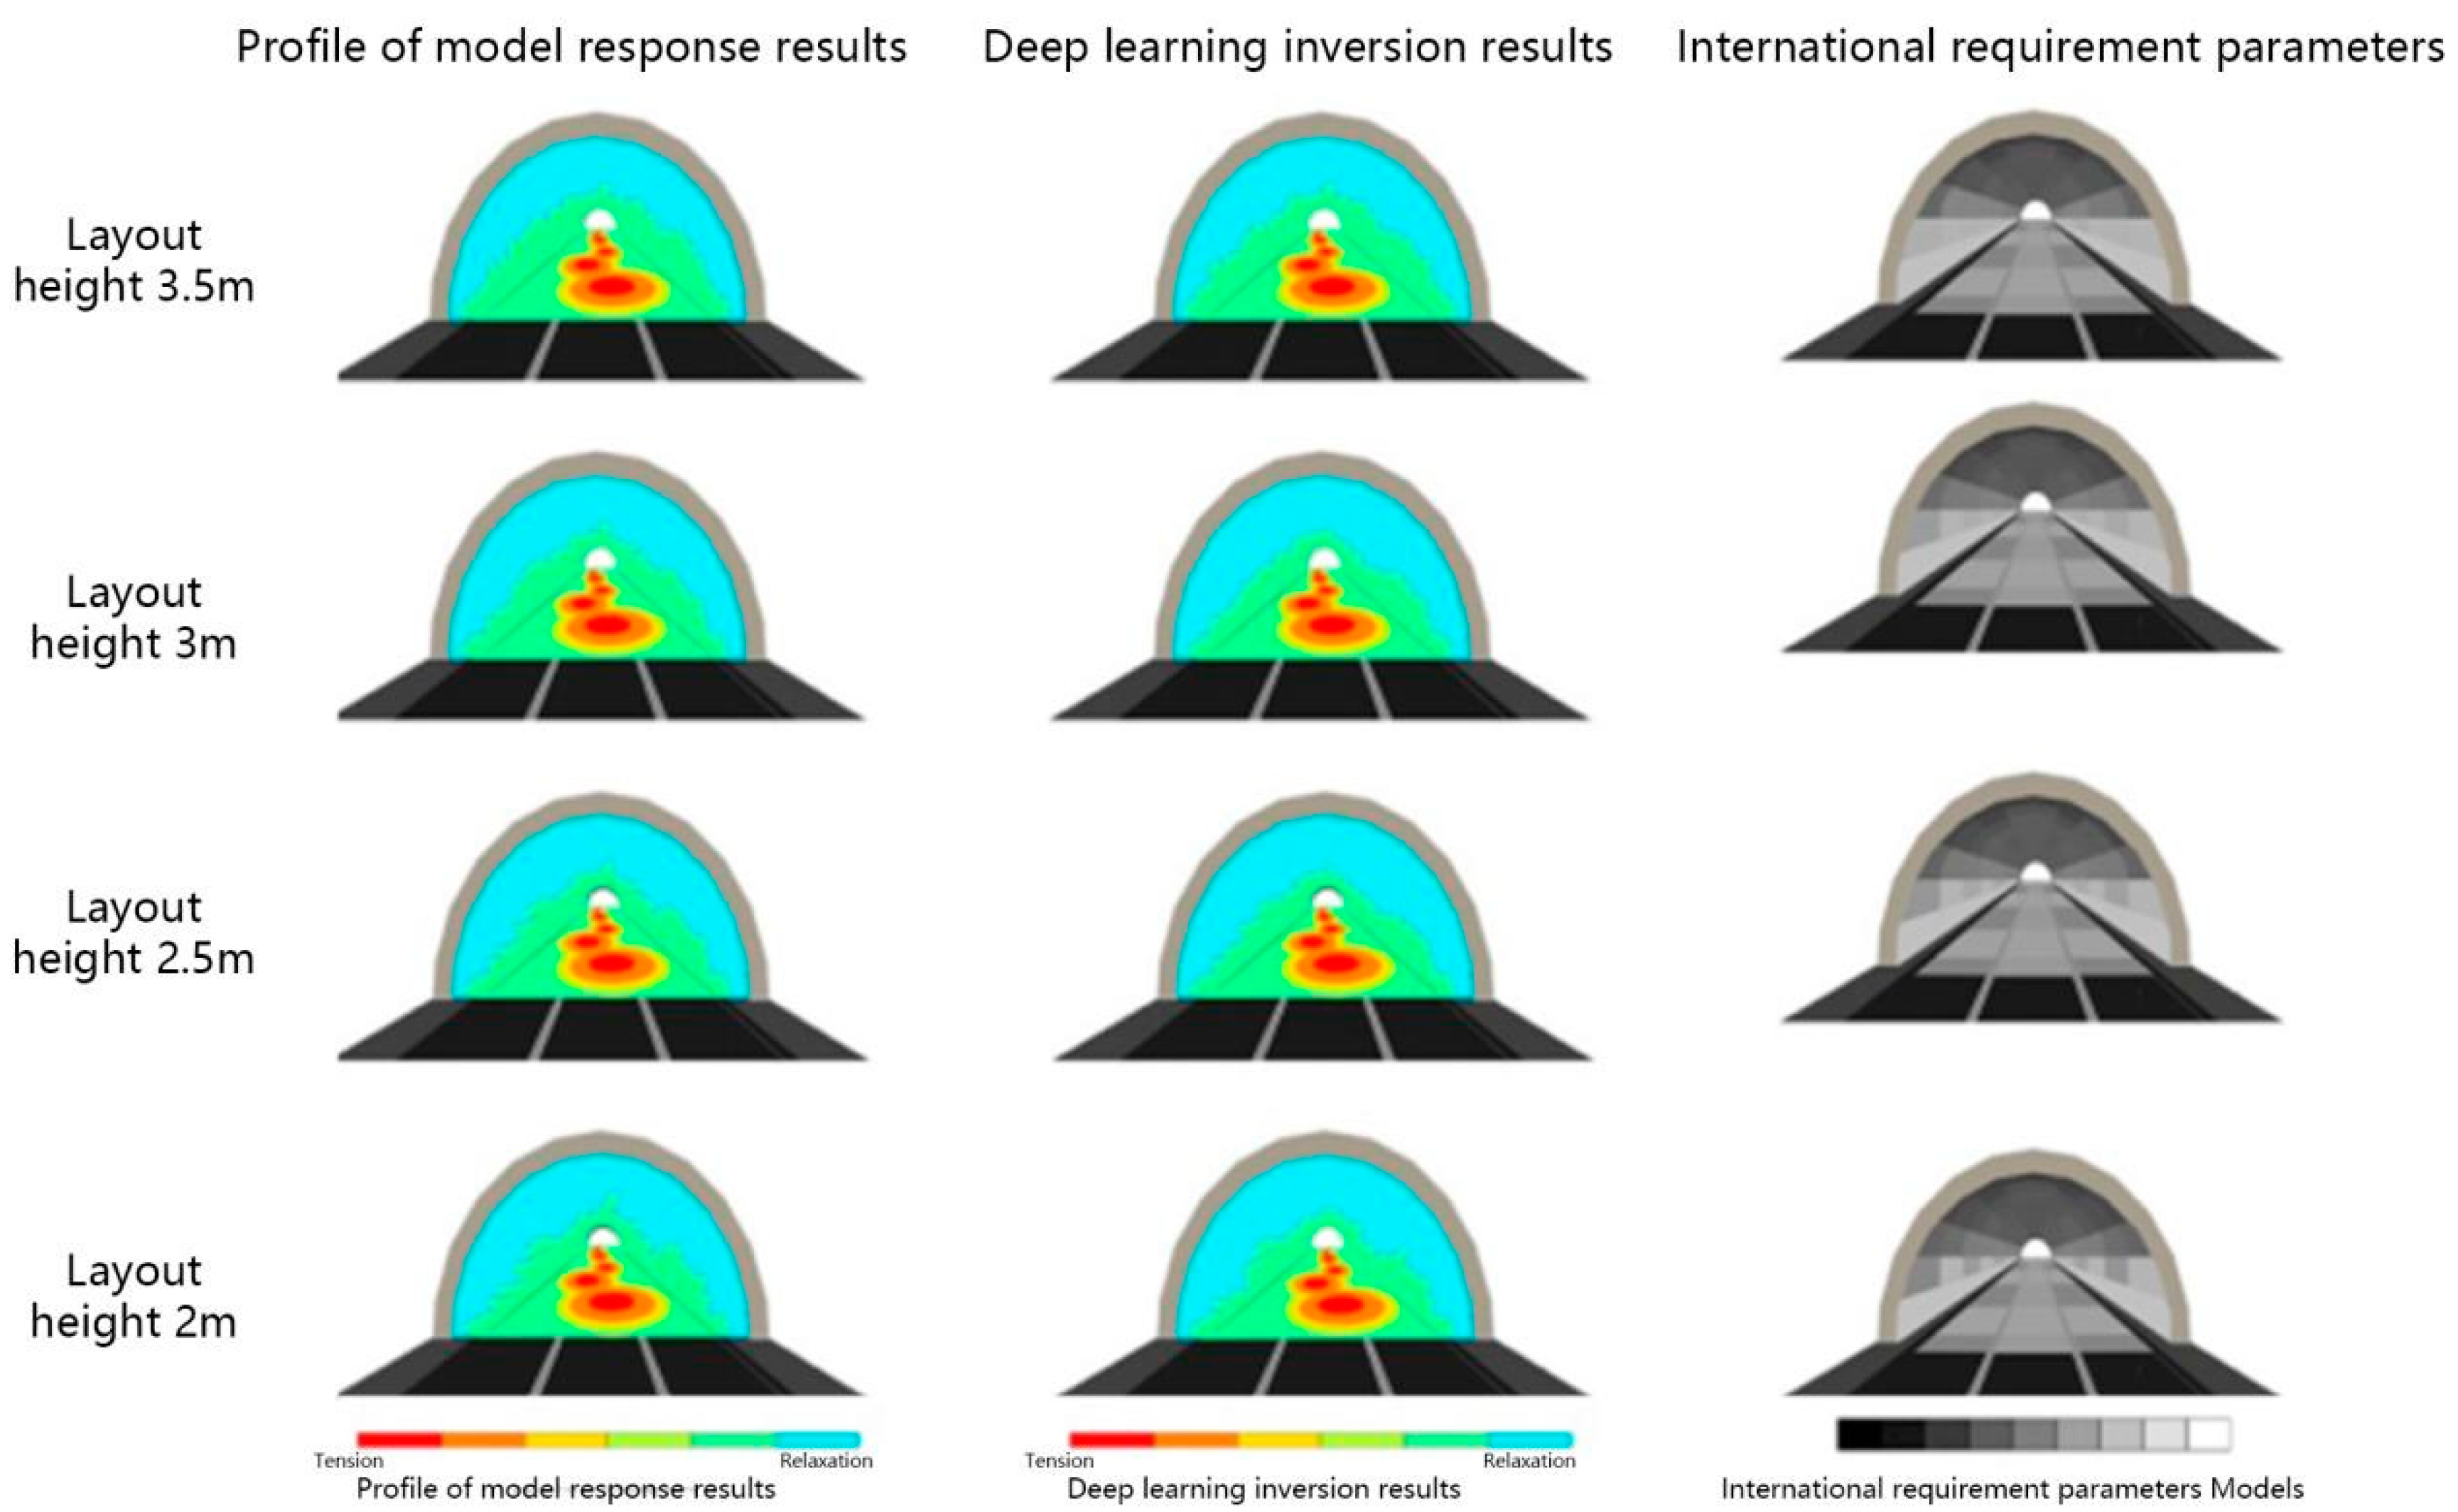
4.2. Side Wall Reflective Paint Placement Height Sensitivity Analysis

The second group of convolutional neural network (CNN) evaluation tests were conducted for the height sensitivity of the sidewall reflective coating, and the test conditions were designed with the color of the sidewall reflective coating as white, the color temperature of the LED light source as 6500 K, and the lamps being staggered on both sides. The sidewall reflective coating heights were 2 m, 2.5 m, 3 m, and 3.5 m. To conduct sensitivity analysis of the sidewall reflective paint placement height, the inverse calculation of the convolutional neural network was combined with the pupil diameter variation in the working condition (Table 9), which is shown in Figure 6. The first row of the graph shows the sidewall reflective coating placement height of 2 m, the second row shows the sidewall reflective coating placement height of 2.5 m, the third row shows the sidewall reflective coating placement height of 3 m, and the fourth row shows the sidewall reflective coating placement height of 3.5 m. From the sidewall reflective coating placement height response model in the graph, an observation can be made that as the sidewall reflective coating placement height changed, the area inside the cave that affected the pupil diameter was positively correlated with the placement height change. The height change of the sidewall reflective coating was positively correlated with the height change. The results of the deep learning inverse performance are consistent with the interval of deployment height required by the national standard, in which the deployment height of 3 m had the greatest impact on pupil diameter, followed by 3.5 m, 2.5 m, and 2 m. Thus, a conclusion could be drawn that within the interval of the national standard, the driver’s visual tension is higher when passing in the tunnel as the deployment height increases.

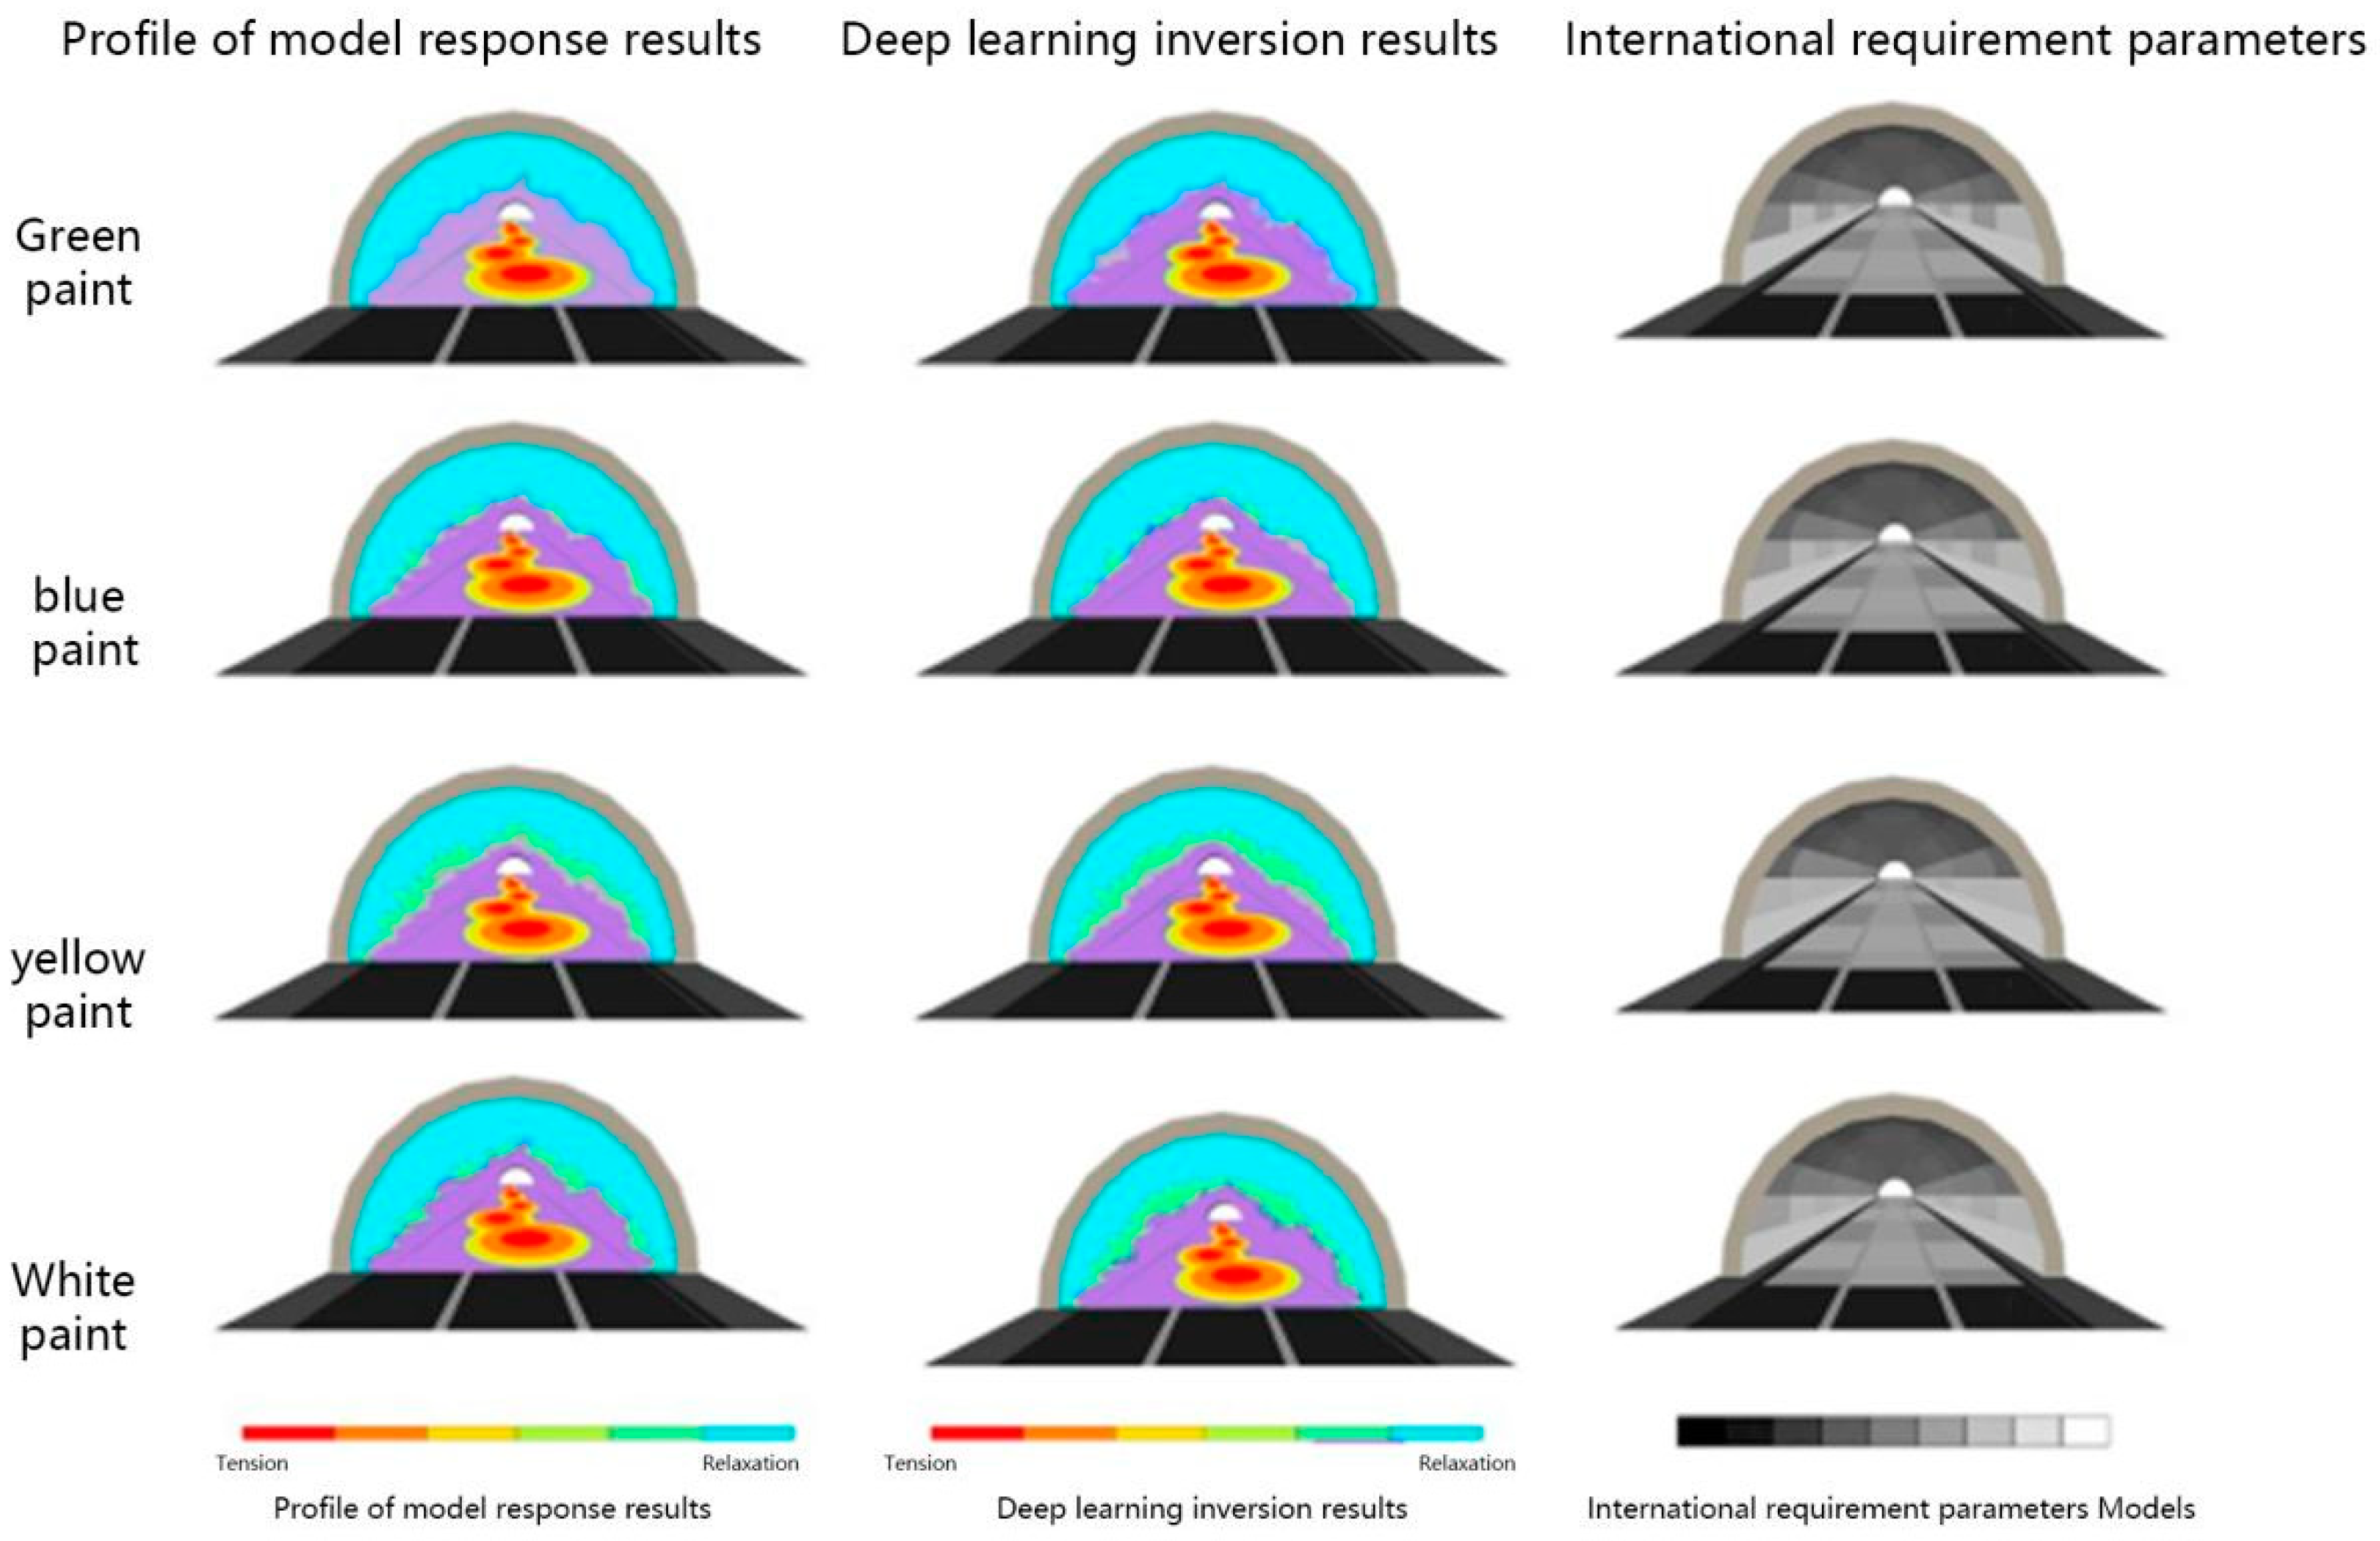
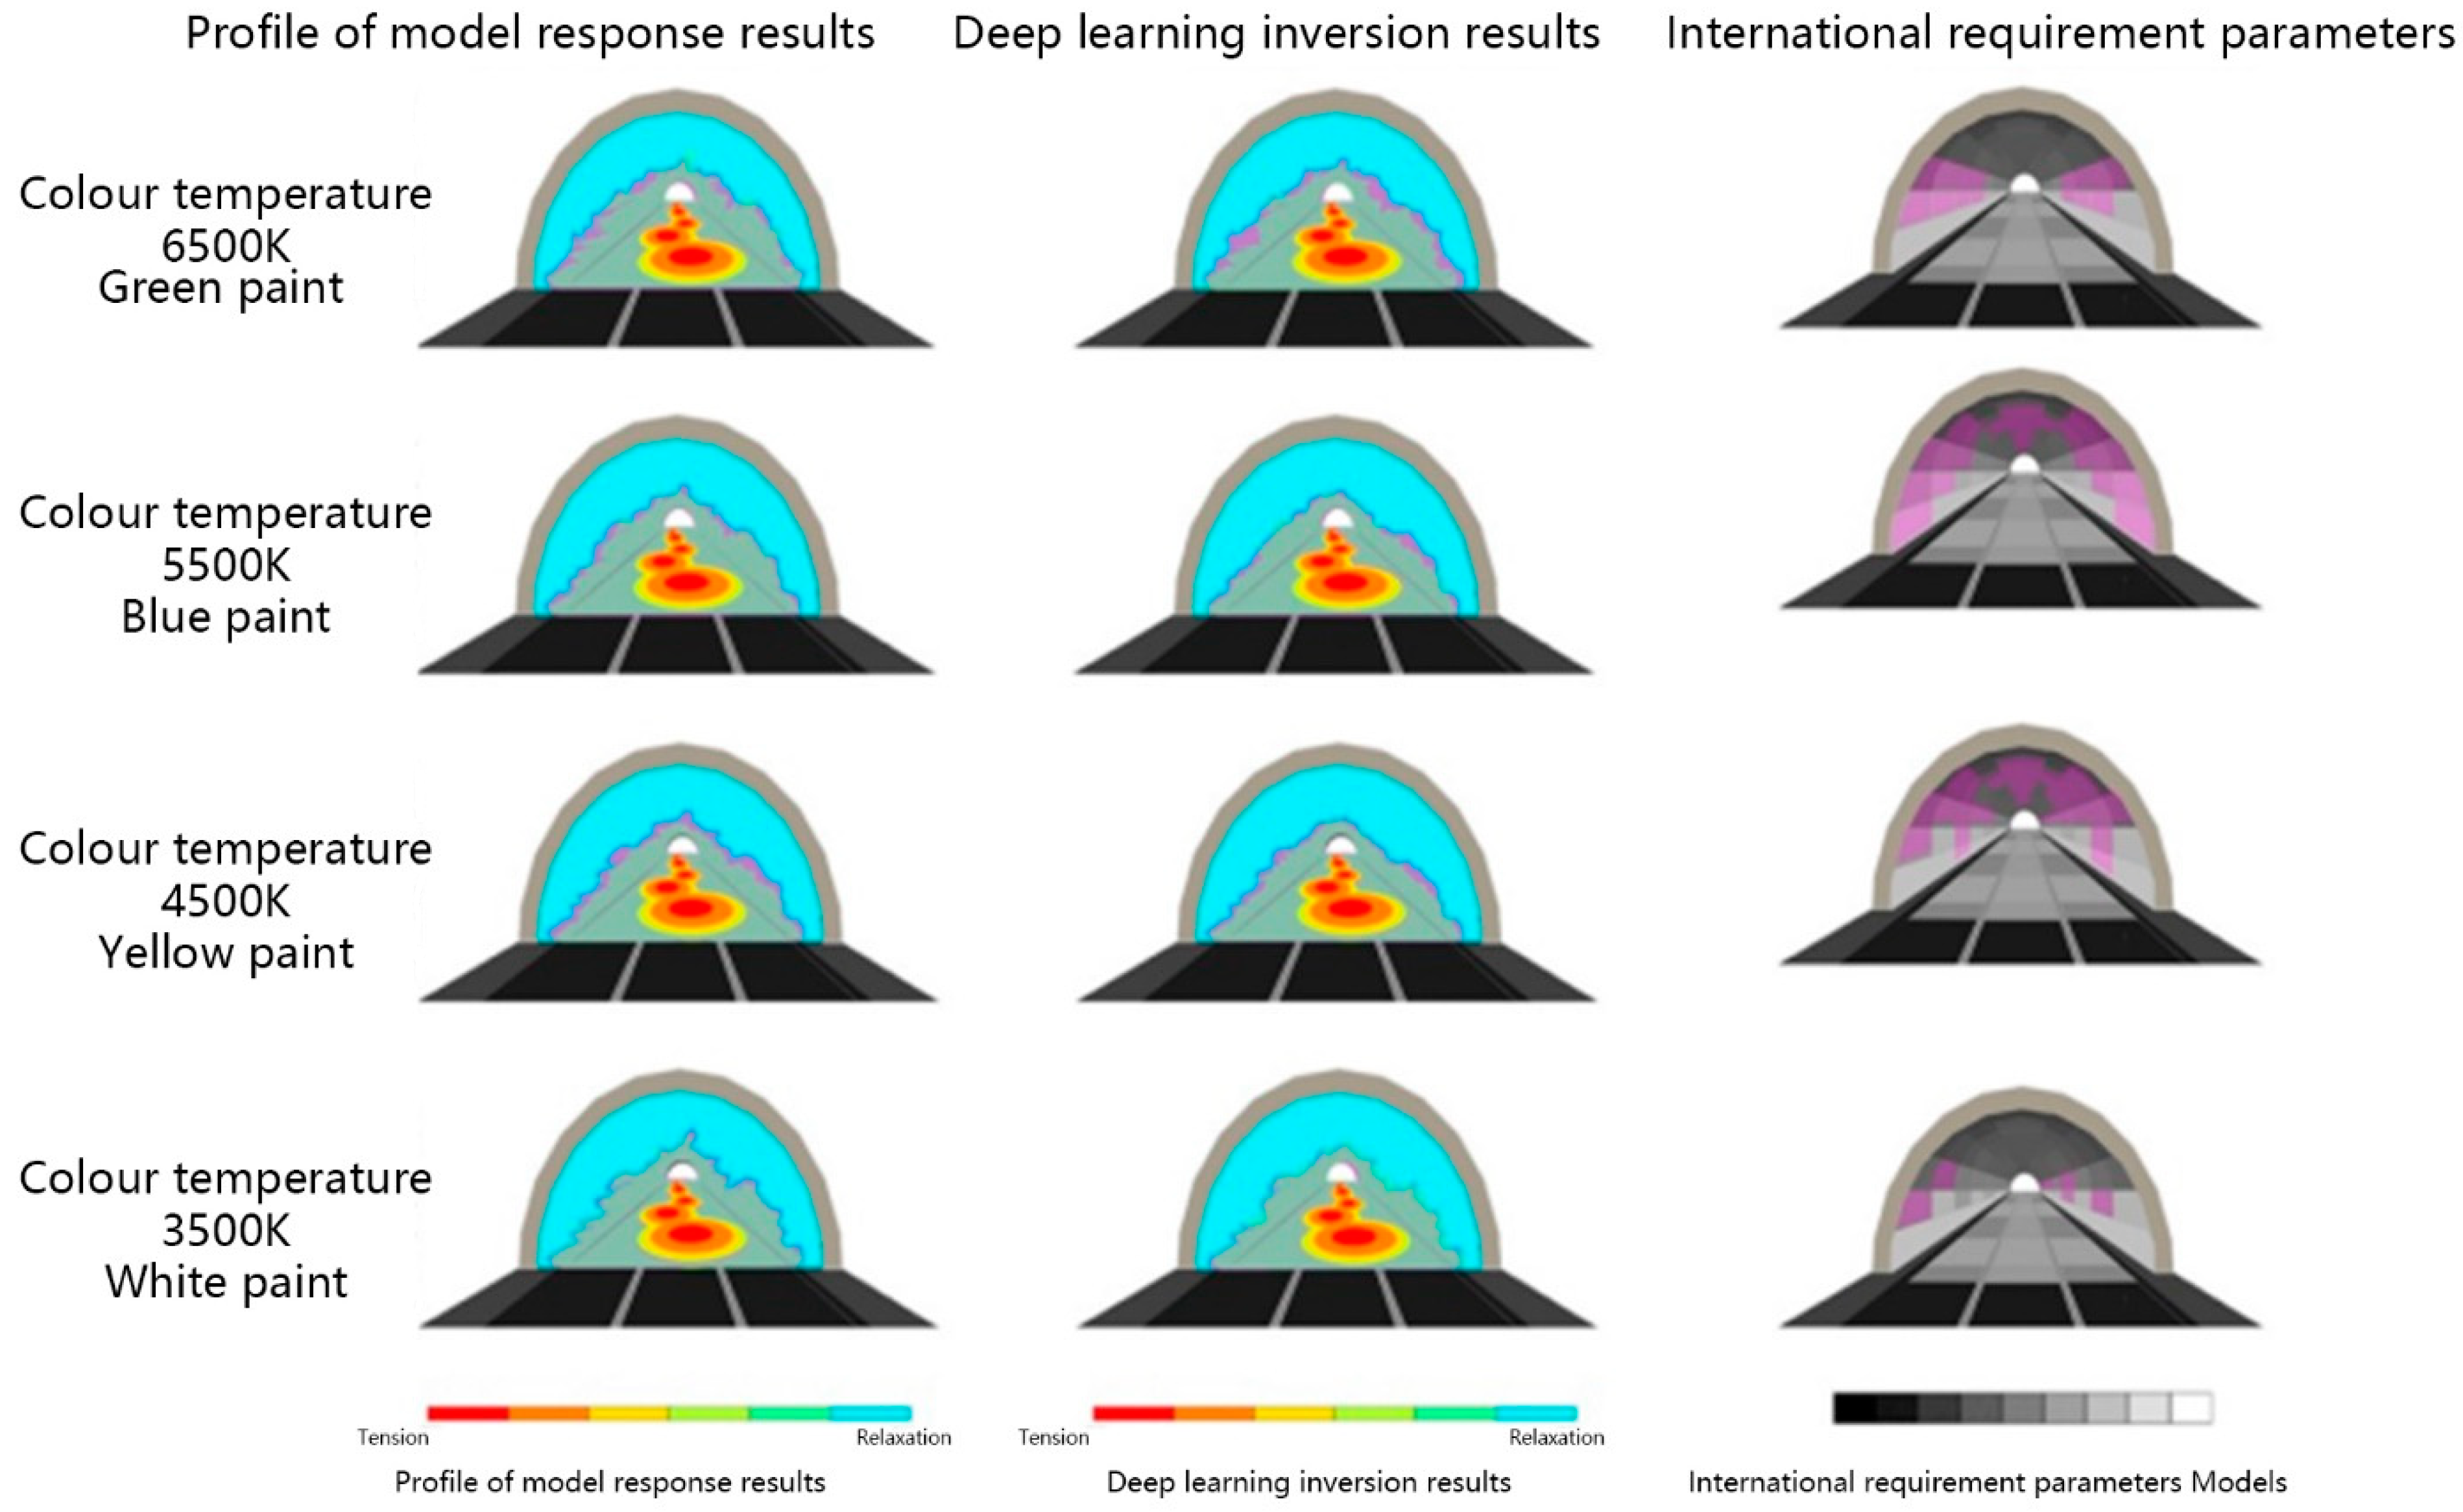
4.3. Color Sensitivity Analysis of Sidewall Reflective Coatings

The third group of convolutional neural network (CNN) evaluation tests were conducted for the color sensitivity of the sidewall reflective paint. The test conditions were designed with staggered luminaire placement, sidewall reflective paint placement height of 2 m, LED light source color temperature of 6500 K, and sidewall reflective paint colors of green, blue, yellow, and white, respectively. Through the inverse calculation of the convolutional neural network, color sensitivity analysis of sidewall reflective paint could be conducted combining the changes in pupil diameter in the working state (Table 10), as shown in Figure 7. The first row shows green paint, the second row shows blue paint, the third row shows yellow paint, and the fourth row shows white paint. Through longitudinal comparison, it the effect on the human pupil diameter could be ranked as follows: green > blue > yellow > white in descending order. Through the cross-sectional comparison, the results of the deep learning inverse performance are consistent with the content of the simulated response graph, having a certain gap compared with the national standard. Such findings could be attributed to the content within the national standard being mainly used to standardize the color of the conductor for calibration, while the use of sidewall reflective paint color is not clearly regulated. As such, the accuracy of the results of deep learning inversion need to be judged not only by adding industry standards but also by combining actual production experience values as a reference for data calibration.

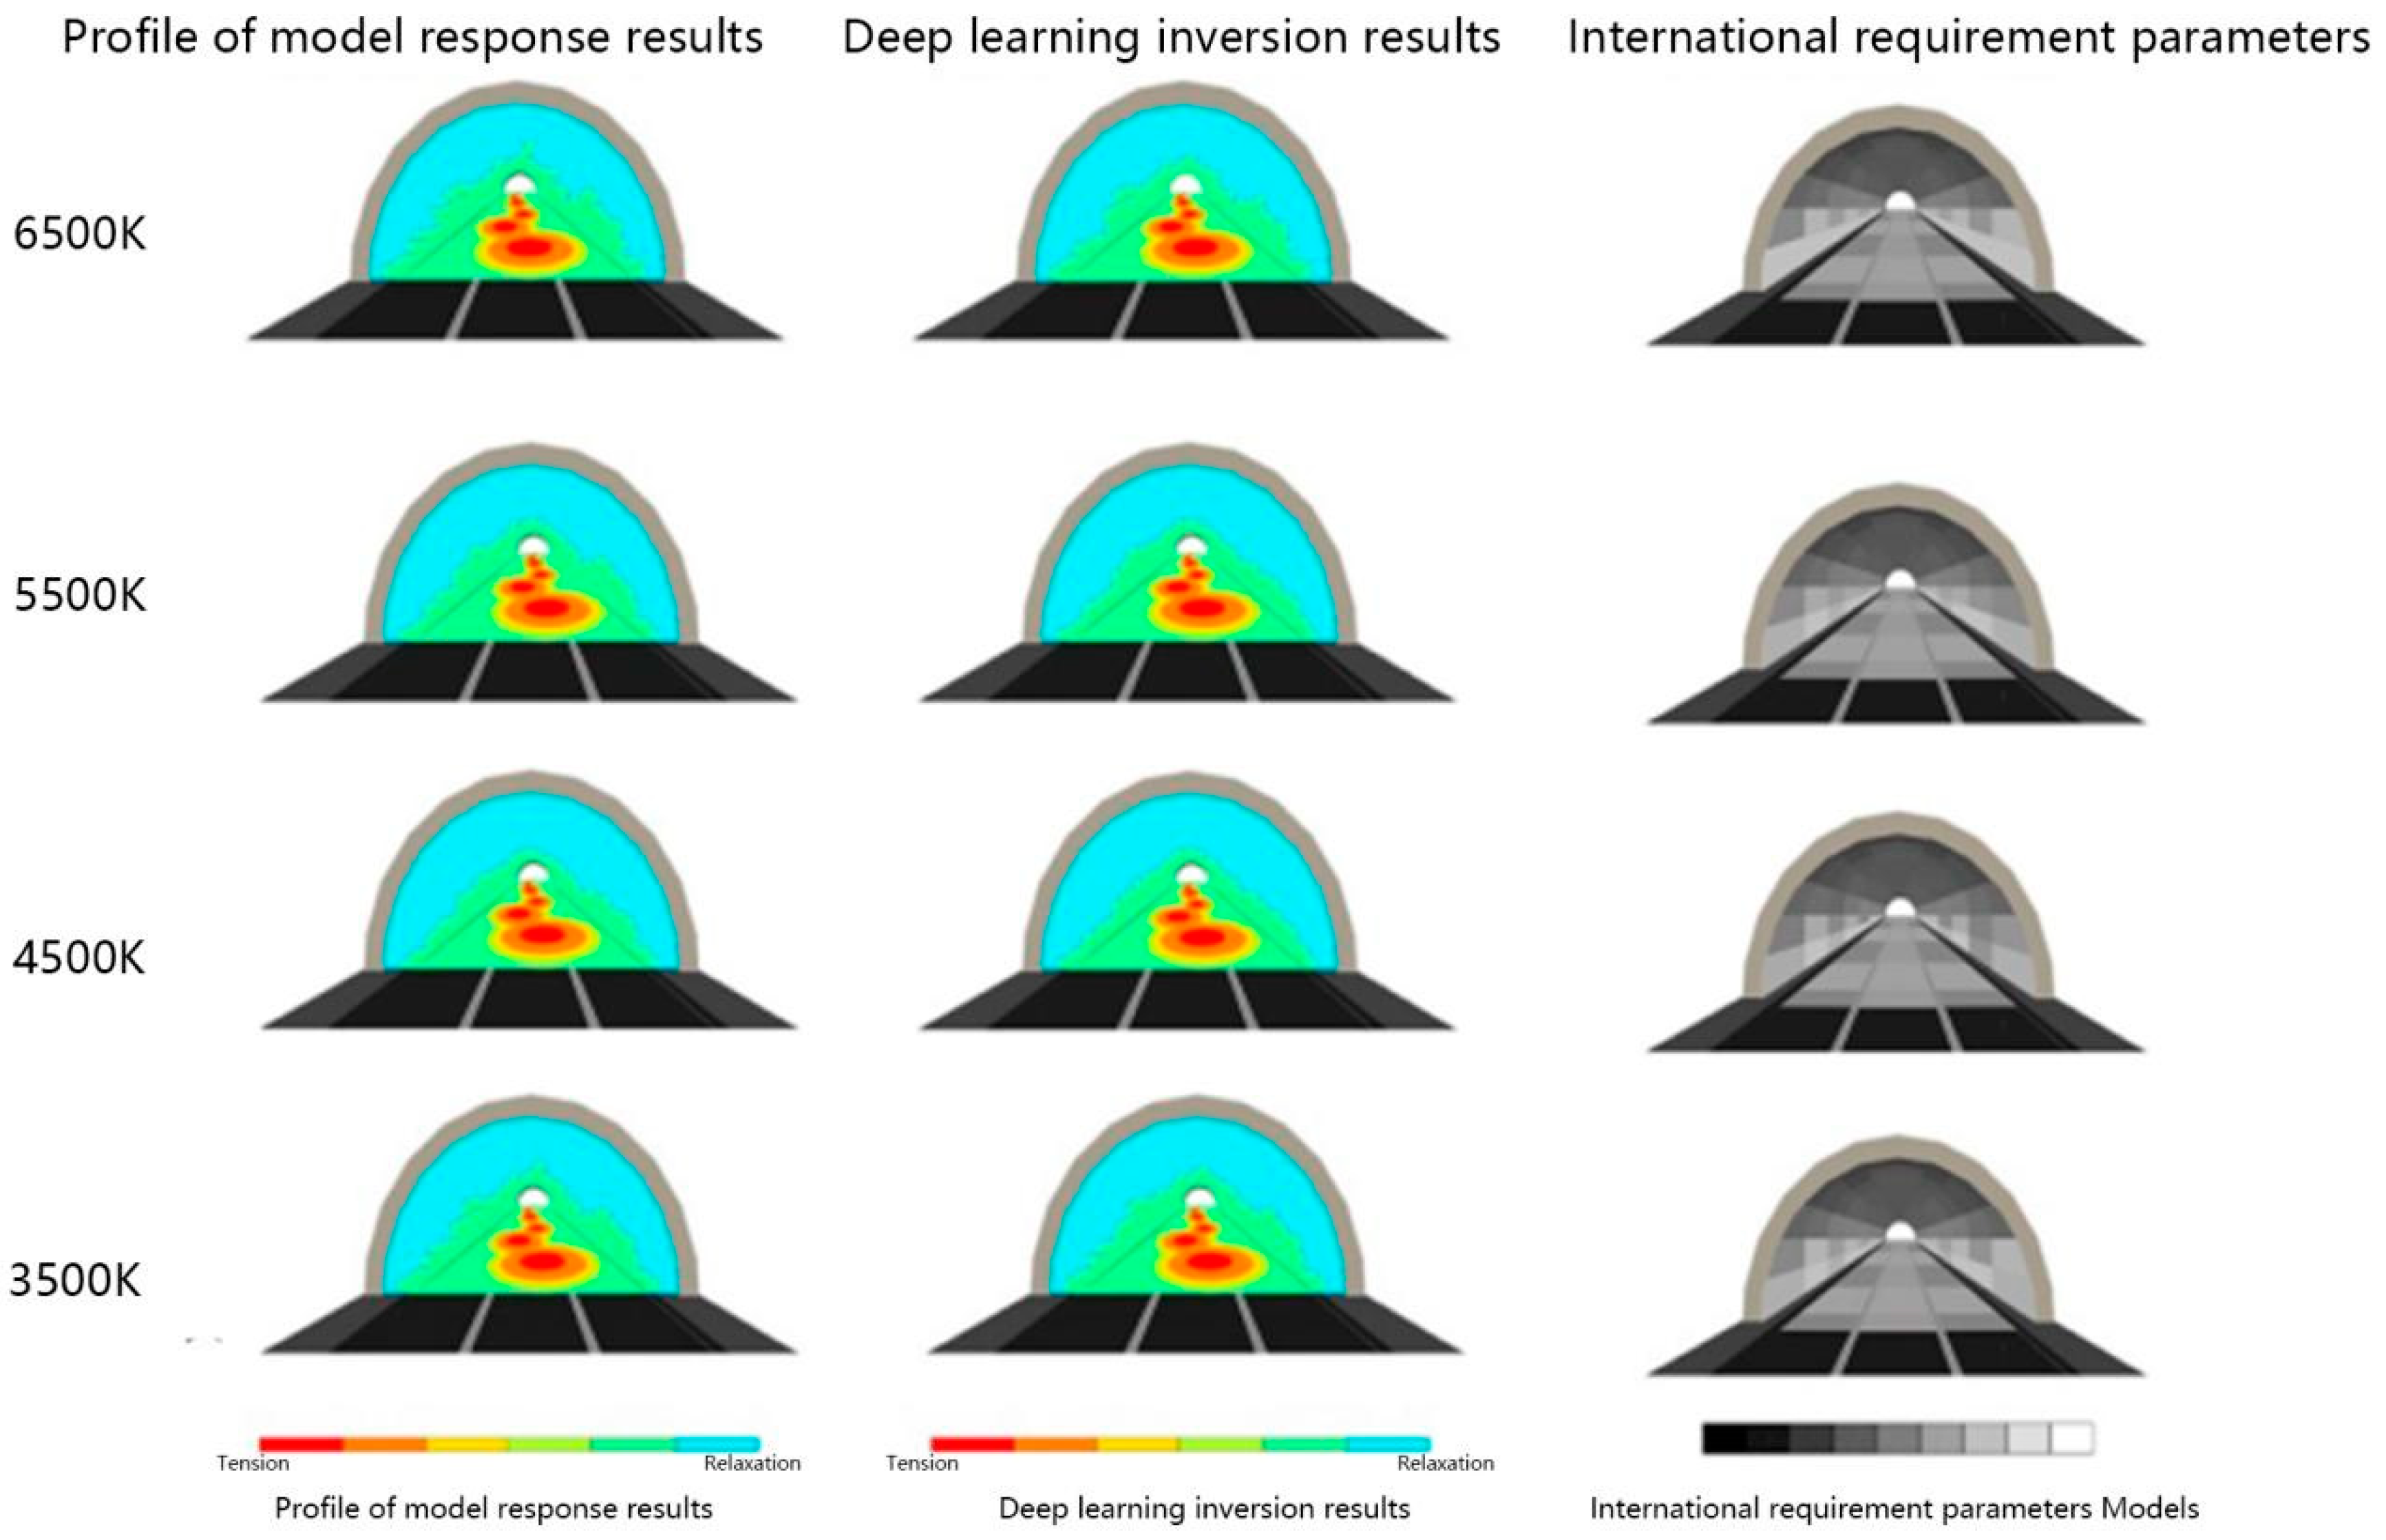
4.4. Led Light Source Color Temperature Sensitivity Analysis

The fourth group of convolutional neural network (CNN) evaluation tests were conducted for the LED light source color temperature sensitivity, and the test conditions were designed for the LED light source color temperature of 6500 K, 5500 K, 4500 K, and 3500 K, the luminaire layout staggered on both sides, side wall reflective coating layout height of 2 m, and the side wall reflective coating color being white. The inverse calculation of the convolutional neural network, combined with the variation in pupil diameter under such operating condition (Table 11), allowed for a color temperature sensitivity analysis algorithm for LED light sources to be obtained, as shown in Figure 8. The graph drawn from the experimental data shows that the color temperature of the LED light source did not have a positive correlation with the data of the pupil diameter of the human eye, and findings were made that the 6500 K color temperature had the most obvious effect on the pupil diameter of the human eye, followed by 3500 K, 5500 K, and 4500 K. Such results are consistent with the spectral response law governing the photobiological effects of lighting. Under the same level of illumination, both higher and lower color temperatures can effectively stimulate human visual sensory perception.

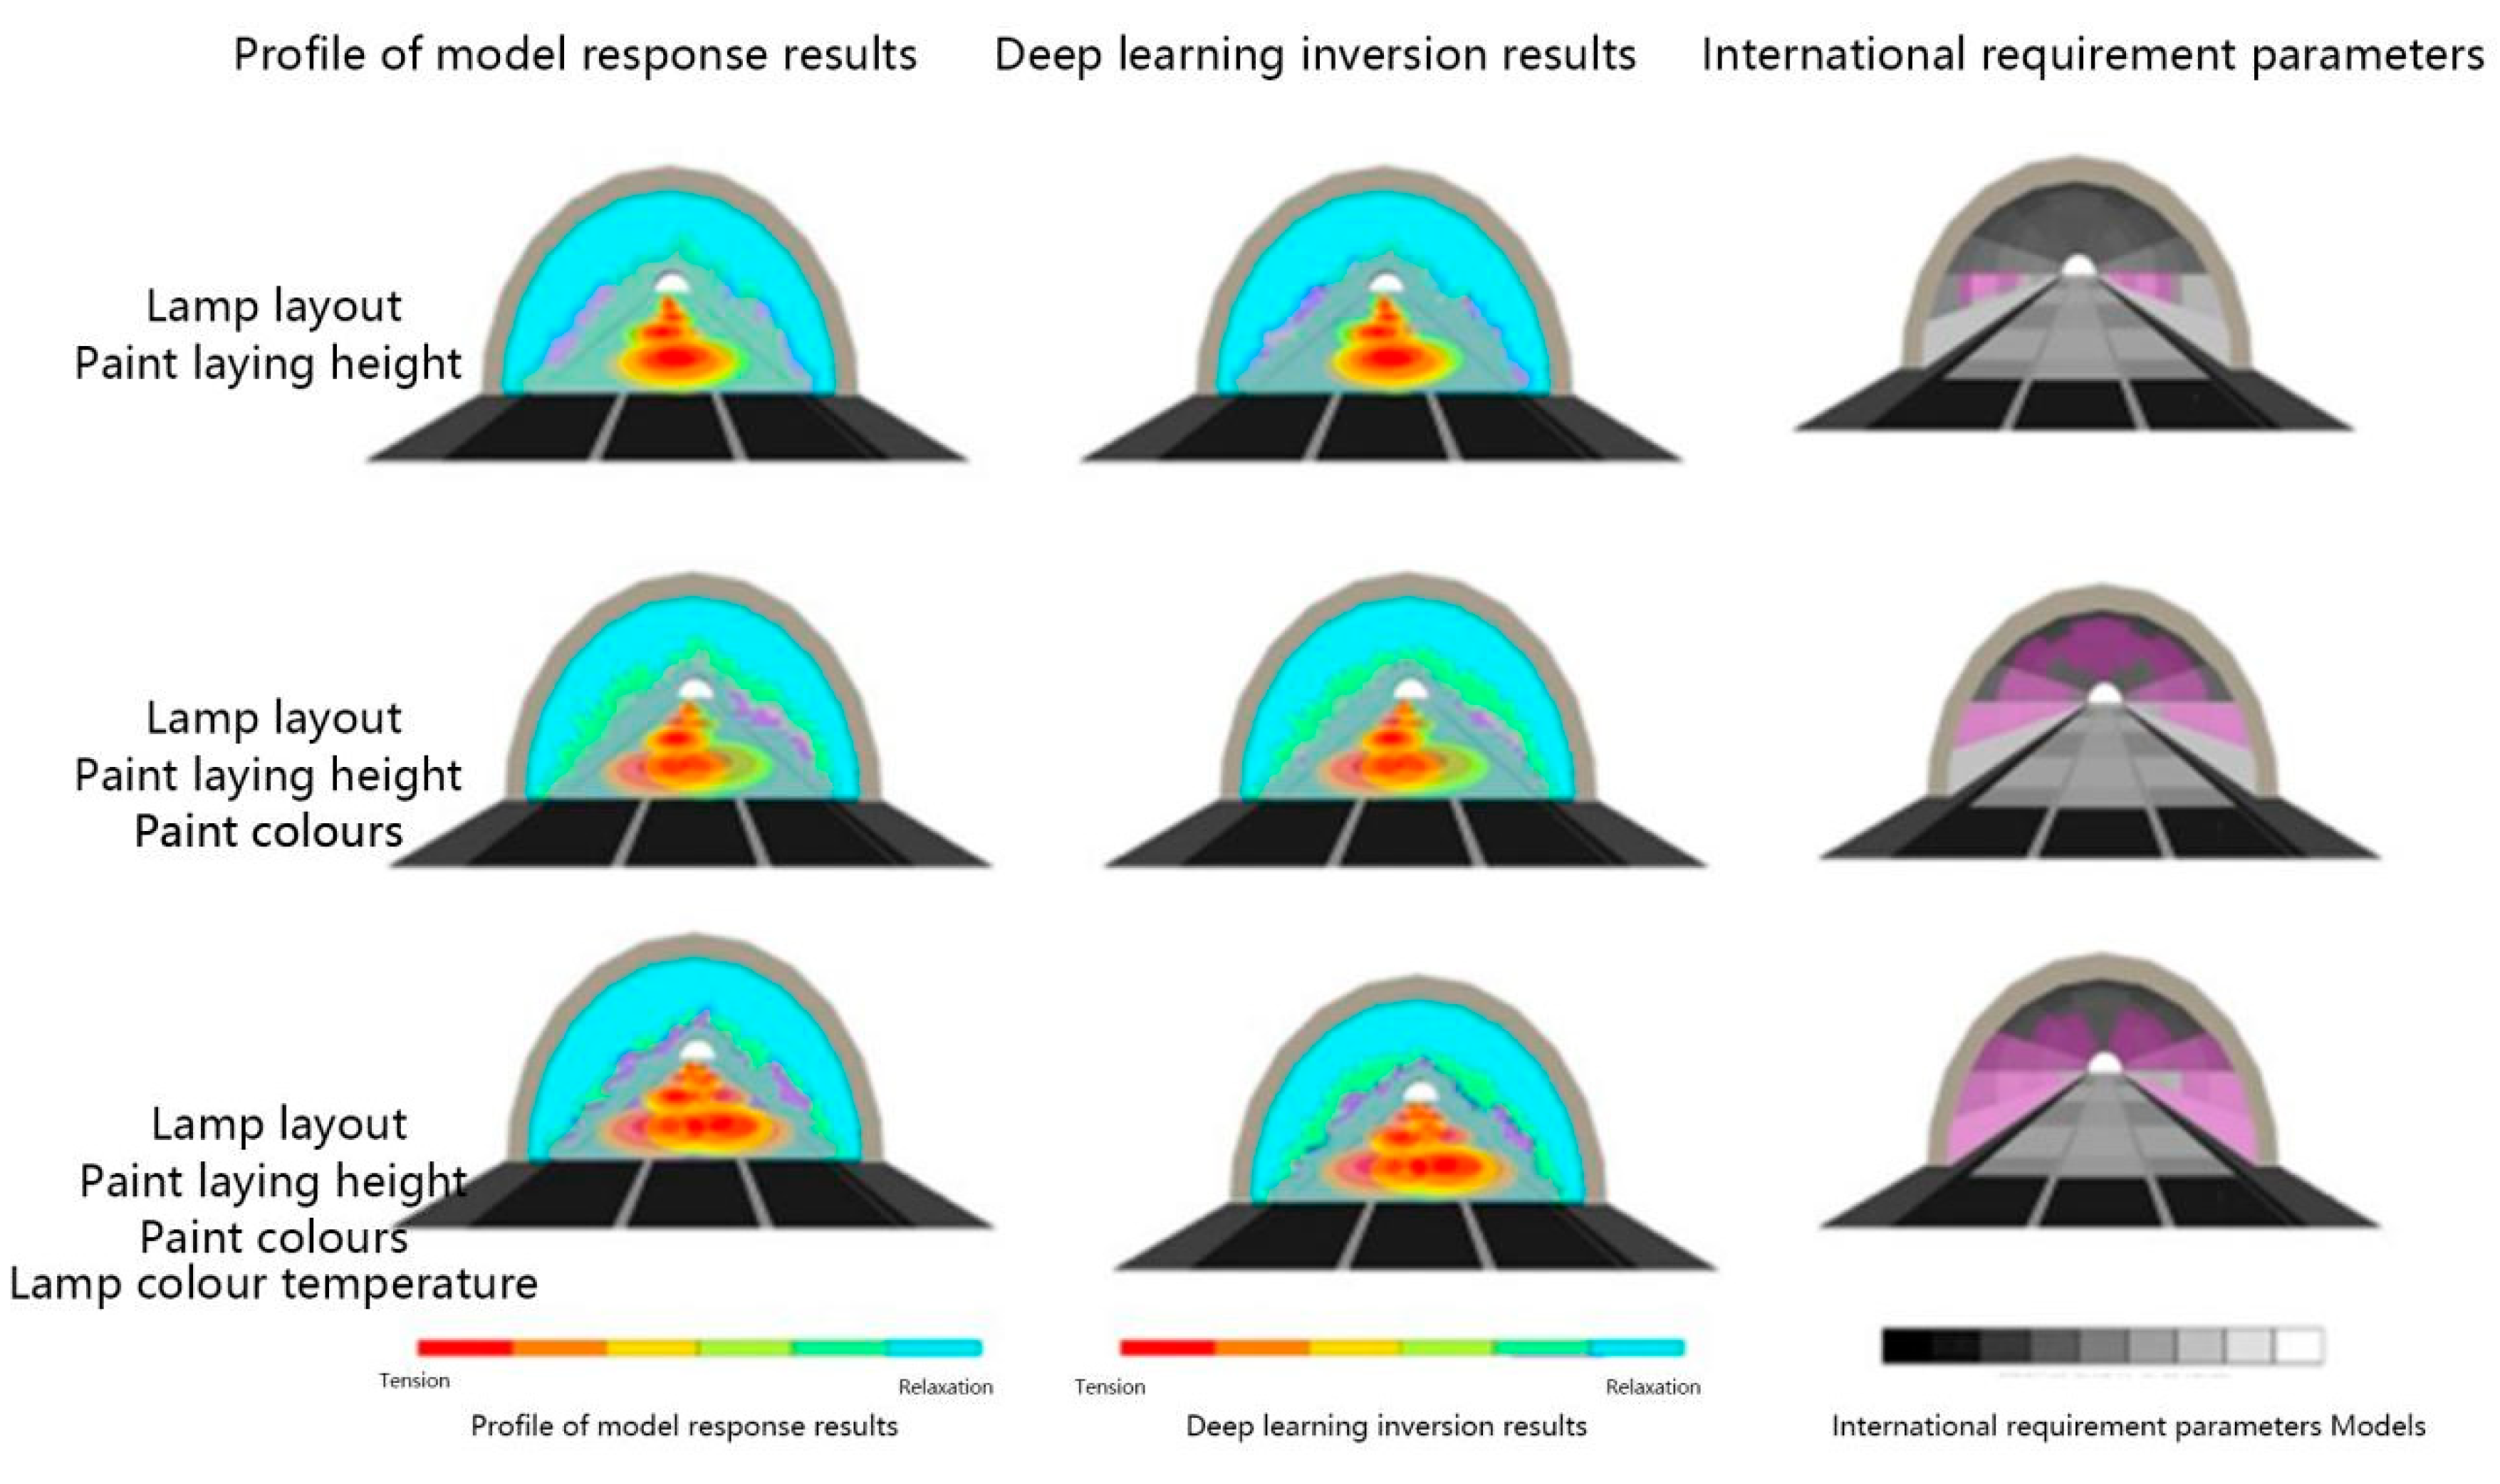
4.5. Comprehensive Sensitivity Analysis of Light Environment Parameters

As discussed in Section 4.3 and Section 4.4 above, compared with the height of the tunnel sidewall material, the color of the tunnel sidewall material and the color temperature of the light source had similar effects on the sensitivity of the tunnel light environment parameters; however, during the tunnel traffic, the driver could directly feel the change in the tunnel lighting environment brought about by the change in the color of the tunnel sidewall material and the color temperature of the light source. Thus, the color temperature of the light source and the color of the tunnel sidewall material were inputted into a computer algorithm for overlay analysis, resulting in the following outcomes.
From the previous analysis, the color of the sidewall material had the greatest effect on the diameter of the human pupil in the following order: green > blue > yellow > white. After conducting color temperature analysis, the sidewall material color was found to be yellow, which had the greatest effect on the pupil of the human eye, and the effect on the pupil of the human eye gradually decreased as the color temperature increased. When white, green, and blue were used as the color of the sidewall material, the effect on the human eye pupil gradually increased with the increase in color temperature, as shown in Figure 9.
Through comparative analysis of the luminaire layout, sidewall reflective paint color and LED light source color temperature data set, the findings show that when the luminaire layout changed, the human eye pupil diameter changed more than the sidewall material color and color temperature.
Figure 10 and Figure 11 show the results of unifying the data sets related to the luminaire placement method, sidewall reflective coating placement height, sidewall reflective coating color, and LED light source color temperature into the CNN model. The results show that the four factors had a significant influence on the experimental results, and the influences could be ranked in the following order: luminaire placement method > LED light source color temperature > sidewall reflective paint color > sidewall reflective paint placement height. From the combined pattern analysis chart, an observation can be made that the optimal level of each factor involved choosing to lay the lights along the center line, the height of sidewall reflective coating being 2 m, the color of sidewall reflective coating being white, and the color temperature of the LED light source being 4500 K.

5. Conclusions

Based on the indoor simulation platform, the present study was conducted to evaluate the light environment in the middle section of the tunnel under dynamic traffic conditions with experimental and convolutional neural network models for the nonlinear relationship of sensitivity of light environment parameters. Sensitivity analysis of the light environment parameters in the middle section of the tunnel was conducted by means of the average pupil area of the testers, and the experimental results were verified by a CNN. The main findings could be summarized as follows.
(1) Through analysis of experimental data, findings were made that there was a nonlinear relationship between the sensitivity of light environment parameters, and a CNN judging model with adaptive learning capability was constructed in the present study, which can make comprehensive judging of the data related to the sensitivity of light environment parameters. The judging results are in high compliance with the design requirements of the national standard.
(2) The pupil change test results show that the driver’s pupil diameter was most affected by the way the lamps being laid out during the driving process, followed by the color temperature of the LED light source, the height of the sidewall reflective paint laying and the color of the sidewall reflective paint.
(3) Analysis of the test results dataset using a CNN revealed a ranked order of factors influencing pupil diameter, as follows: lamp layout with staggered arrangement on both sides > symmetrical arrangement on both sides > symmetrical arrangement on the midline > symmetrical arrangement on the midline. Other factors include reflective coating laying height (3 m > 3.5 m > 2.5 m > 2 m), sidewall reflective coating color (green > blue > yellow > white), and LED light source color temperature (6500 K > 3500 K > 5500 K > 4500 K). Furthermore, blue > yellow > white was observed under different sidewall reflective coating color conditions, and 6500 K > 3500 K > 5500 K > 4500 K under different LED light source color temperature conditions.

Author Contributions

Conceptualization, B.L. and M.X.; methodology, M.X.; software, Z.L.; validation, J.N., M.X. and Z.L.; formal analysis, M.X.; investigation, B.L.; resources, M.X.; data curation, J.N.; writing—original draft preparation, B.L.; writing—review and editing, M.X.; visualization, Z.L.; supervision, M.X.; project administration, B.L.; funding acquisition, B.L. All authors have read and agreed to the published version of the manuscript.

Funding

National Natural Science Foundation of China (51878107); Project of Chongqing Talent Team (2019-9-95).

Institutional Review Board Statement

Not applicable.

Informed Consent Statement

Not applicable.

Data Availability Statement

Not applicable.

Conflicts of Interest

The authors declare no conflict of interest.

References

  1. Li, B.; Yang, T. The Design of Tunnel Lighting Intelligent Control System. In Proceedings of the 3rd International Conference on Intelligent Transportation, Big Data & Smart City (ICITBS 2018), Xiamen, China, 25–26 January 2018; pp. 610–613. [Google Scholar]
  2. Liu, Y.; Peng, L.; Lin, L.; Chen, Z.; Weng, J.; Zhang, Q. The impact of LED spectrum and correlated color temperature on driving safety in long tunnel lighting. Tunn. Undergr. Space Technol. 2021, 112, 103867. [Google Scholar] [CrossRef]
  3. Cui, L.; Chen, Z.; Yin, Y. Research on tunnel lighting safety and light color of light sources. J. Light. Eng. 2009, 20, 24–29. [Google Scholar]
  4. Liu, Y.; Weng, J.; Chen, J.; Chen, Z. The effect of light source light color on tunnel lighting effect. Civ. Archit. Environ. Eng. 2013, 35, 162–166. [Google Scholar]
  5. Liu, Z.; Li, P.; Jiang, H.; Wang, D. Application of color temperature controllability in LED lighting environment of highway tunnel. E3S Web Conf. 2021, 233, 01101–01106. [Google Scholar] [CrossRef]
  6. Hu, J.; Gao, X.; Wang, R.; Xu, P.; Miao, G. Safety evaluation index of daytime lighting at tunnel entrances. Adv. Mech. Eng. 2019, 68–73. [Google Scholar] [CrossRef]
  7. Du, F.; Mao, J.; Wang, Q.; Wu, C. The hardy type inequality on metric measure spaces. J. Korean Math. Soc. 2018, 55, 1359–1380. [Google Scholar]
  8. He, S.Y.; Liang, B.; Zhong, S.M.; Pan, G.B. Research on the evaluation method of highway tunnel lighting based on indoor simulation of light environment and visual efficacy experiment. J. Chongqing Jiaotong Univ. (Nat. Sci. Ed.) 2020, 39, 27–35. [Google Scholar]
  9. Hu, Y.; Chen, Z.; Zhang, Q.; Weng, J.; Huang, K.; Lin, Y. A brightness determination method for the entrance section of highway tunnels considering drivers’ visual adaptation. Civ. Constr. Environ. Eng. 2016, 4, 20–26. [Google Scholar]
  10. Wang, S. Study on the visual characteristics of drivers at the entrance section of highway tunnels. Automot. Pract. Technol. 2016, 9, 108–113. [Google Scholar]
  11. CIE. Tunnel Entrance Lighting: A Survey of Fundamentals for Determining the Luminance in the Threshold Zone; CIE Technical Report, 61-1984; CIE: Paris, France, 2022; Available online: https://cie.co.at/publications/visual-aspects-time-modulated-lighting-systems (accessed on 18 November 2022).
  12. Liu, Y.; Chen, J.; Zhang, Q.; Weng, J. Influence of light source color temperature on traffic safety of tunnel entrance section based on reaction time. Road Traffic Technol. 2015, 2, 114–118. [Google Scholar]
  13. Yang, Y.; Han, W.Y.; Yan, M.; Jiang, H.F.; Zhu, L.W. Performance analysis of highway lighting light sources based on visual efficacy method. Spectrosc. Spectr. Anal. 2015, 10, 2686–2690. [Google Scholar]
  14. Tang, X. Application of DIALux software in the design of tunnel lighting dimming. Highw. Traffic Technol. 2016, 32, 126–129. [Google Scholar]
  15. Liang, B.; Wei, Q.; Li, Y.; He, S. Research on the method of laying reflective materials on the sidewall of the entrance section of highway tunnel based on DIALux. J. Chongqing Jiaotong Univ. (Nat. Sci. Ed.) 2019, 38, 20–26. [Google Scholar]
  16. Cui, Y.; Sun, Y.; Gu, Y.; Zheng, G. Research on quantitative analysis technology of highway tunnel lighting based on DIALux software. China Light. Electr. Appl. 2019, 7, 10–13. [Google Scholar]
  17. Shi, K. DIALux evo-based tunnel lighting design and rational validation. China Transp. Informatiz. 2021, 224–225. Available online: https://www.cnki.com.cn/Article/CJFDTotal-JTXC2021S1064.htm (accessed on 18 November 2022).
  18. Huang, Z.; Liao, M.; Zhang, H.; Zhang, G.; Ma, S. Prediction of extrusion deformation of tunnel surrounding rock based on SVM-BP model with incomplete data. Mod. Tunn. Technol. 2020, 57, 129–138. [Google Scholar]
  19. Cai, S.; Li, E.; Chen, L.; Gao, L.; Pu, S.; Duan, J.; Tan, Y. Research on the temporal prediction of tunnel surrounding rock deformation based on FA-NAR dynamic neural network. J. Rock Mech. Eng. 2019, 38, 3346–3353. [Google Scholar]
  20. Pachamanov, A.; Pachamanova, D. Optimization of the light distribution of luminaries for tunnel and street lighting. Eng. Optim. 2018, 40, 47–65. [Google Scholar] [CrossRef]
  21. Ministry of Transport of the People’s Republic of China. Detailed Rules for Highway Tunnel Lighting; JTG/T D702-01-2014; Ministry Transport of the People’s Republic of China: Beijing, China, 2014; Volume 15.
  22. Carnì, D.L.; Grimaldi, D.; Lamonaca, F.; Martirano, L.; Parise, G. A smart control to operate the lighting system in the road tunnels. In Proceedings of the 2013 IEEE 7th International Conference on Intelligent Data Acquisition and Advanced Computing Systems, Berlin, Germany, 12–14 September 2013; pp. 786–790. [Google Scholar]
  23. Codeca, L.; Frank, R.; Engel, T. Luxembourg SUMO traffic (LuST) scenario: 24 hours of mobility for vehicular networking research. In Proceedings of the 2015 IEEE Vehicular Networking Conference (VNC), Kyoto, Japan, 16–18 December 2015; pp. 1–8. [Google Scholar]
  24. Codeca, L.; Frank, R.; Faye, S.; Engel, T. Luxembourg SUMO traffic (LuST) scenario: Traffic demand evaluation. IEEE Intell. Transp. Syst. Mag. 2017, 9, 52–63. [Google Scholar] [CrossRef]
  25. Fryc, I.; Czyżewski, D.; Fan, J.; Gălăţanu, C.D. The drive towards optimization of road lighting energy consumption based on mesopic vision—A case study of suburban street. Energies 2021, 14, 1175. [Google Scholar] [CrossRef]
  26. Miki, M.; Hiroyasu, T.; Imazato, K. Proposal for an intelligent lighting system and verification of control method effectiveness. Digit. Object Identifier 2004, 12, 520–525. [Google Scholar]
  27. Musa, M.S.; Nallagownden, P.; Chiu, K.W.; Sarwar, M.B. Design and development of intelligent adaptive tunnel lighting system. In Proceedings of the 2015 IEEE Conference on Energy Conversion (CENCON), Johor Bahru, Malaysia, 19–20 October 2015; pp. 289–292. [Google Scholar]
  28. Wagiman, K.; Abdullah, M.; Hassan, M.; Hanssan, M.Y.; Radzi, N.H.M. Lighting system control techniques in commercial buildings: Current trends and future directions. J. Build. Eng. 2020, 19, 101342. [Google Scholar] [CrossRef]
  29. Witold, P. Logic-based neurons: Extensions, uncertainty representation and development of fuzzy controllers. Fuzzy Sets Syst. 1994, 66, 251–266. [Google Scholar]
  30. Moretti, L.; Cantisani, G.; Di Mascio, P. Management of road tunnels: Construction, maintenance and lighting costs. Tunn. Undergr. Space Technol. Inc. Trenchless Technol. Res. 2016, 51, 84–89. [Google Scholar] [CrossRef]
  31. Hamdar, S.H.; Qin, L.; Talebpour, A. Weather and roadgeometry impact on longitudinal driving behavior: Exploratory analysis using an empirically supported acceleration modeling framework. Transp. Res. Part C Emerg. Technol. 2019, 67, 193–213. [Google Scholar] [CrossRef] [Green Version]
  32. Brimley, B.K.; Carlson, P.J. The Current State of Research on the Long-Term Deterioration of Traffic Signs; TRB: Washington, DC, USA, 2018. [Google Scholar]
  33. Houtebbos, M.; Winter, J.C.F.; Hale, A.R.; Wieringa, P.A.; Hagenzieker, M.P. Concurrent audio—visual feedback for supporting drivers at intersections: A study using two linked driving simulators. Appl. Ergon. 2017, 60, 30–42. [Google Scholar] [CrossRef] [Green Version]
  34. HMSO. Highway Structures Design. In Design Manual for Roads and Bridges (DMRB); Section 2, Special Structures, Part 9, Design of Road Tunnels, BD 78/99; HMSO: London, UK, 2017; Volume 2. [Google Scholar]
  35. Diamantidis, D.; Zuccarelli, F.; Westhauser, A. Safety of long railway tunnels. Reliab. Eng. Syst. Saf. 2018, 67, 135–145. [Google Scholar] [CrossRef]
  36. Stichting Wetenschappelijk Onderzoek Verkeersveiligheid (SWOV). SWOV Fact Sheet: The Road Safety of Motorway Tunnels, Leidschendam Voeltzel A, A Comparative Analysis of the Mont Blanc, Tauern and Gotthard Tunnel Fires; Routes/Roads 324; PIARC: Paris, France, 2018. [Google Scholar]
  37. Yu, Y.-H. The advanced quality & safety management experiences of tunnel construction in SWITZERLAND and advices to quality & safety management of tunnel construction. North. Traffic 2010, 160–162. Available online: http://www.cqvip.com/qk/97829a/201004/33565540.html (accessed on 18 November 2022).
  38. Amundsen, F.H.; Roald, P.O.; Engebretsen, A.; Ragnoy, A. Traffic Accidents in Norwegian Subsea Tunnels; Report TTS; Norwegian Public Roads Administration: Oslo, Norway, 2018.
  39. Piarc Technical Committee on Road Tunnels Operation. Road Tunnels: Vehicle Emissions and Air Demand for Ventilation; PIARC: Paris, France, 2004. [Google Scholar]
  40. Vashitz, D.G.; Shinar, Y.B. In-vehicle information systems to improve traffic safety in road tunnels. Transp. Res. Part F 2008, 11, 61–74. [Google Scholar] [CrossRef]
  41. Arends, B.; Jonkman, S. Evaluation of tunnel safety towards an economic safety optimum. Reliab. Eng. Syst. Saf. 2005, 90, 217–228. [Google Scholar] [CrossRef]
  42. Pardo, P.J.; Cordero, E.M. Influence of the correlated color temperature of a light source on the color discrimina-tion capacity of the observer. Opt. Soc. Am. 2012, 29, 209–215. [Google Scholar] [CrossRef]
Figure 1. Picture of the experimental model.
Applsci 13 03160 g001
Figure 2. Simulation animation video screenshot (midline cloth light + 2 m + yellow + 3500 K). Image source: screenshot of the experiment animation.
Applsci 13 03160 g002
Figure 3. Eye-tracking device commissioning.
Applsci 13 03160 g003
Figure 4. Test process.
Applsci 13 03160 g004
Figure 5. Convolution Neural Network Judgment Model.
Applsci 13 03160 g005
Figure 6. Sensitivity analysis of luminaire layout.
Applsci 13 03160 g006
Figure 7. Sidewall reflective paint placement height sensitivity analysis.
Applsci 13 03160 g007
Figure 8. Sidewall reflective paint color sensitivity analysis.
Applsci 13 03160 g008
Figure 9. LED light source color temperature sensitivity analysis calculation.
Applsci 13 03160 g009
Figure 10. Cross-contrast analysis of tunnel sidewall material color and light source color temperature.
Applsci 13 03160 g010
Figure 11. A comprehensive comparative computing analysis of four factors of tunnel light environment.
Applsci 13 03160 g011
Table 1. Layout of Lamps and Lanterns.
Lamp Arrangement MethodSingle-Side Lamp Spacing/mSingle Lamp Luminous Flux/lm
Midline109000
Lateralized midline109000
Staggered on both sides209000
bilateral symmetry104500
Table 2. Table of experimental factor levels.
FactorsLamp Placement MethodSidewall Reflective Coating Laying Height/mSidewall Reflective Paint ColorLED Light Source Color Temperature/K
Level
1Midline2Yellow3500
2Lateralized midline2.5White4500
3Staggered on both sides3Blue5500
4bilateral symmetry3.5Green6500
Table 3. Lighting test program.
FactorsABCDE
Work Conditions
1Midline2Yellow35001
2Midline2.5White45002
3Midline3Blue55003
4Midline3.5Green65004
5Lateralized midline2White55004
6Lateralized midline2.5Yellow65003
7Lateralized midline3Green35002
8Lateralized midline3.5Blue45001
9Staggered on both sides2Blue65002
10Staggered on both sides2.5Green55001
11Staggered on both sides3Yellow45004
12Staggered on both sides3.5White35003
13bilateral symmetry2Green45003
14bilateral symmetry2.5Blue35004
15bilateral symmetry3White65001
16bilateral symmetry3.5Yellow55002
Table 4. Entrance section and exit section tunnel lighting settings.
ProjectsLength/mLamp ModelLayoutSingle-Side Lamp Spacing
Entrance section40180 W LEDStaggered on both sides2.5
Export section40180 W LEDStaggered on both sides5
Table 5. Luminaire settings in the middle section.
Layout ModeSingle-Side Lamp Spacing/mSingle Lamp Luminous Flux/lmQuantity/Lamp
Midline10900040
Lateralized midline10900040
Staggered on both sides20900040
bilateral symmetry10450080
Table 6. Testing personnel information.
Grouping NumberAverage AgeTotal Number of PeopleNumber of MenNumber of WomenVision Correction
I25.210735.0
II26..110735.0
III24.810735.0
Table 7. Pupil diameter test results under different working conditions.
Average Pupil Diameter
(mm)
IIIIIIAverage of Three Groups
Condition No.
15.0895.2705.2065.188
24.9964.9064.8614.921
35.4025.3405.3785.373
45.5375.5575.7475.614
55.2855.3415.3785.335
65.6505.5955.6825.642
75.5915.5685.6575.605
85.3025.4515.4805.411
95.6245.7085.6925.675
105.5435.8955.8885.776
115.6025.8955.9045.801
125.7745.7345.7255.744
135.7335.7155.6985.715
145.6785.8405.8185.779
155.8205.8375.9005.852
165.4635.3765.5045.448
Table 8. Table of influence degree of lamp arrangement and pupil diameter.
Lamp Placement MethodMidline SymmetryStaggered on Both SidesLateralized MidlineBilateral Symmetry
Pupil diameter (mean)/mm4.8495.7295.1185.328
Table 9. Table of influence degree of side wall reflective paint placement height and pupil diameter.
Sidewall Reflective Coating Laying Height2 m2.5 m3 m3.5 m
Pupil Diameter (Mean)/mm4.8735.0115.9815.673
Table 10. Table of influence degree of the side wall reflective paint color and pupil diameter.
Sidewall Reflective Paint ColorGreenBlueYellowWhite
Pupil Diameter (mean)/mm5.6315.4895.1184.973
Table 11. LED light source color temperature and pupil diameter influence degree.
LED Light Source Color Temperature6500 K5500 K4500 K3500 K
Pupil Diameter (Mean)/mm5.8465.4265.2335.649
Disclaimer/Publisher’s Note: The statements, opinions and data contained in all publications are solely those of the individual author(s) and contributor(s) and not of MDPI and/or the editor(s). MDPI and/or the editor(s) disclaim responsibility for any injury to people or property resulting from any ideas, methods, instructions or products referred to in the content.

