Article

Process Optimization of Microwave-Assisted Extraction of Chlorophyll, Carotenoid and Phenolic Compounds from Chlorella vulgaris and Comparison with Conventional and Supercritical Fluid Extraction

Laboratory of Thermodynamics and Transport Phenomena, School of Chemical Engineering, National Technical University of Athens (NTUA), Zografou Campus, 15780 Athens, Greece
*
Authors to whom correspondence should be addressed.
Appl. Sci. 2023, 13(4), 2740; https://doi.org/10.3390/app13042740
Submission received: 9 February 2023 / Revised: 16 February 2023 / Accepted: 17 February 2023 / Published: 20 February 2023

Abstract

:
The production of bioactive products from microalgae biomass with efficient and environmentally friendly technologies is a field of great research interest. The present work focuses on the recovery of high-added value bioactive components from Chlorella vulgaris through microwave-assisted extraction (MAE) with aq. ethanol 90% v/v. The effect of extraction temperature (40–60 °C), duration (5–25 min), solvent-to-biomass ratio (20–90 mLsolv/gbiom), and microwave power (300–800 watts) was investigated regarding the extraction yield, extract’s chlorophyll, carotenoid and phenolic content, and antioxidant activity. MAE optimization at 60 °C, 300 watts, 14 min, and 22 mLsolv/gbiom led to 11.14% w/w yield, 63.36 mg/gextr total chlorophylls, 7.06 mg/gextr selected carotenoids of astaxanthin, lutein and β-carotene, 24.88 mg/gextr total carotenoids, 9.34 mgGA/gextr total phenolics, and 40.49 mgextr/mgDPPH IC50 (antioxidant activity indicator). Moreover, the conventional solid-liquid extraction (SLE) with aq. ethanol 90% v/v, the supercritical fluid extraction (SFE) with CO2, as well as SFE with cosolvent addition (10% w/w ethanol), were also performed for comparison purposes. The results revealed that SLE presented the highest yield. However, the non-conventional methods of MAE and SFE led to extracts of competitive or even better quality under significantly shorter extraction duration.

1. Introduction

The utilization of microalgae as a source of bioactive compounds has already integrated them into industrial applications. The considerable variance of the compounds synthesized from microalgae, such as fatty acids, polysaccharides, pigments, and phenolic compounds, make them suitable for use in animal feed, fertilizer, food, cosmetics, and health products [1,2].
Despite the extensive biodiversity of microalgae, the genus of Chlorella is considered the most auspicious for commercial applications, along with Dunaliella, Botryococcus, Chlamydomonas, and Arthrospira [3]. The acceptance of Chlorella in human use and consumption is responsible for its wide cultivation across Asia, the United States, and Europe [4] and its dominance in the global microalgae market along with the well-known Arthrospira (Spirulina) [5].
Among the Chlorella species, the most common Chlorella vulgaris (C. vulgaris) is considered a high-potential biomass. C. vulgaris cells encounter an abundance of bioactive molecules, including phenolic compounds, chlorophylls, and carotenoids [6]. Chlorella sp. presents higher phenolic content among other species [7]. Chlorophylls are the most plentiful pigment of C. vulgaris (up to 2% dw), while the presence of the accessory carotenoid pigments is also considered remarkable [8]. The aforementioned biocomponents are well-known for demonstrating curative and repairing effects and exhibiting antibacterial, antifungal, and antioxidant activity [9].
In recent years, microwave-assisted extraction (MAE) has been applied to extract biocomponents from microalgae biomass [10]. MAE is considered a non-conventional method [11], during which microwave radiation is rapidly absorbed by the biomass and converted into thermal energy. The biomass is heated through dipole rotation and ionic conduction [12]. The microwave energy absorption and, thus, heat generation can be measured through the dissipation factor (tan δ). This term is proportional to the dielectric loss (ε″) and inversely proportional to the dielectric constant (ε′) of the solvent, indicating that the presence of polar solvents is considered necessary [13]. In contrast to the conventional solid-liquid extraction, the non-conventional method of MAE offers reduced thermal gradients and instant heating of the biomass, as well as enhanced extraction yield during rapid extractions and decreased solvent quantities [14,15]. In the case of Chlorella, the studies of MAE are mainly focused on lipid extraction [16,17,18,19] followed by carotenoids [20,21], whereas few studies have dealt with the extraction of bioactive compounds such as proteins [22] and polysaccharides [23].
The studies of MAE concerning Chlorella biomass have been limited to the investigation of individual component categories. Nevertheless, studying a multitude of bioactive compounds derived from Chlorella’s extracts, along with their antioxidant activity, would be considered useful for the utilization of such products in demanding industrial fields.
The aim of the present work is the study of the non-conventional microwave-assisted extraction (MAE) of high value-added biocomponents from Chlorella vulgaris biomass, utilizing the green solvent aq. ethanol 90% v/v. MAE’s study included the investigation of essential process parameters, quantitative and qualitative effect study, data correlation and process optimization. The variations of extraction temperature (40–60 °C), duration (5–25 min), solvent-to-biomass ratio (20–90 mLsolv/gbiom), and microwave power (300–800 watts) were investigated regarding the effect on the extraction yield, extract’s total phenolic and pigment (chlorophylls and carotenoids) content, and antioxidant activity. The advantageous acquaintance of this work is not only the effect study of MAE’s operational conditions on extract’s several bioactive compounds and antioxidant activity but also the beneficial comparison of MAE with different extraction methods. More specifically, the results of optimized MAE were compared with the conventional solid-liquid extraction (SLE) and the novel supercritical fluid extraction (SFE).

2. Materials and Methods

2.1. Materials

Commercially available biomass of Chlorella vulgaris was purchased from Go Superfoods Ltd. (Sheffield, UK) in June 2021. The biomass was cultivated in natural water open ponds in South China, harvested with mesh screens, milled, spray-dried and received in powder form.
Anhydrous sodium carbonate, 99.5%, ethanol, ≥99.8% (analytical reagent grade), ethyl acetate, ≥99.9% (HPLC—Isocratic grade), gallic acid, 98% (ACS Reagent), orthophosphoric acid, 85.4% (analytical grade reagents), methanol, ≥99.8% (HPLC grade), methyl tert-butyl ether (MTBE), 99.5% (HPLC grade), and water (HPLC gradient grade) were purchased from Fisher Scientific International Inc. (Pittsburgh, PA, USA). Carbon dioxide, 99.5%, was purchased from Air-Liquid Hella (Athens, Greece). Astaxanthin, ≥98%, and lutein, ≥92%, were purchased from Acros Organics BVBA (Antwerp, Belgium) and Extrasynthese SAS (Lyon, France), respectively. β-carotene, 99%, and 2,2-diphenyl-1-picrylhydrazyl (DPPH) free radicals were purchased from Sigma Aldrich Co. (Saint Louis, MO, USA), while Folin–Ciocalteu reagent was purchased from Carlo Erba Reagents SAS (Milan, Italy).

2.2. Extraction Methods

2.2.1. Microwave-Assisted Extraction (MAE)

The microwave-assisted extraction was performed in a MAS-II Plus microwave synthesis/extraction reaction workstation (Sineo Microwave Chemistry Technology Co. Ltd., Shanghai, China). Approximately 1 g of C. vulgaris powder was loaded in a double-wall vessel along with an appropriate amount of aq. ethanol, 90% v/v. Τhe choice of solvents and the ethanol/water ratio resulted from a preliminary study as well as the findings of Cha et al. [24], which exhibited the solvent’s advantage over other ratios and organic solvents regarding the extraction of C. vulgaris’ biocomponents. The mixture was stirred at 500 rpm, and the extraction conditions of temperature, duration, solvent-to-biomass ratio, and microwave power were regulated according to an appropriate experimental design (see Paragraph 2.4). Solvent losses were minimized by adjusting a condenser on the top of the extraction vessel. After the MAE, the mixture was centrifuged at 1110× g for 8 min in a Hermle centrifuge Z206-A (Hermle AG, Baden-Württemberg, Germany). The supernatant of the centrifuged mixture was filtered through a ChromPure PTFE/L 0.45 μm filter and evaporated under vacuum at 100 mbar and 45 °C in a Hei-Vap Advantage ML rotary evaporator (Heidolph Instruments GmbH & Co, KG, Bayern, Germany). Finally, all the dry extracts were temporarily maintained at −18 °C until further analysis. The extraction yield was determined gravimetrically by the received extracts’ weight, and the experimental error was determined from the triple repetition of the central point of the experimental design.

2.2.2. Solid-Liquid Extraction (SLE)

During the conventional method of solid-liquid extraction, 37 mL of aq. ethanol, 90% v/v, and approximately 1 g of C. vulgaris powder (ratio 37 mLsolv/gbiom) were stirred at 500 rpm via a Carousel tech stirring hotplate (Radleys, Essex, UK) and heated at 30 °C for 24 h in a double-wall vessel placed in the dark. The extraction conditions were considered optimum according to a previous study [25]. Solvent losses were minimized by adjusting a condenser on the top of the extraction vessel. After the SLE, the steps described in paragraph 2.2.1. were followed regarding the mixture centrifugation, supernatant filtration, vacuum evaporation, and extract storage. The SLE was performed in duplicate, and extraction yield was determined gravimetrically by the extracts’ weight.

2.2.3. Supercritical Fluid Extraction (SFE)

The supercritical fluid extraction with CO2 was performed in a bench scale apparatus (SFE-500, SEPAREX CHIMIE FINE, Champigneulles, France), which is described in detail by Papamichail et al. [26]. During SFE, approximately 80 g of C. vulgaris powder was loaded along with glass beads (4.5 mm) in the extraction vessel. The extraction was performed at 60 °C and 250 bar. The solvent flow rate was adjusted at 40 g/min, and total solvent consumption was set at 100 kgCO2/kgbiom. The solvent-solute mixture was depressurized, and the extract was collected from 2 separators operating at 8 °C and 60 and 10 bar, respectively. The extraction conditions were considered optimum according to a previous study [27].
The cosolvent addition was also examined in the above experimental conditions by inserting ethanol through a piston pump. The ethanol content in CO2 was set at 10% w/w. The final mixture of ethanol solutes was vacuum evaporated at 100 mbar and 45 °C.
Finally, all the dry extracts were temporarily maintained at −18 °C until further analysis. SFE experiments, with or without cosolvent presence, were performed in duplicate and extraction yield was determined gravimetrically by the total weight loss of the extraction vessel.

2.3. Extract Analyses

Apart from the determination of the extraction yield, further analysis was performed for the MAE, SLE, and SFE extracts. All the applied methods mentioned below are adequately described in previous work [25].
In brief, the total phenolic content (TPC) was determined through the Folin-Ciocalteu assay at 765 nm and expressed as the gallic acid equivalent mass of the extract (mgGA/gextr), according to Drosou et al. [28]. The total chlorophyll (CHL) and carotenoid (CAR) contents were determined spectrophotometrically at 480, 510, 630, 647, and 664 nm, according to the equations derived from Jeffrey et al. [29,30] (equations are provided in Appendix A), and expressed in the mass ratio of the corresponding compound to extract (mg/gextr). The antioxidant activity was determined through the DPPH scavenging assay at 515 nm, according to Laina et al. [31]. The indicator of half-maximal inhibitory concentration was expressed in the mass ratio of the extract to the DPPH free radical (mgextr/mgDPPH). All the above spectrophotometric assays were performed in a Shimadzu UV-1900i UV-Vis Spectrophotometer (Shimadzu Corporation, Kyoto, Japan) using quartz cuvettes of 1 cm length.
Finally, selected carotenoids, namely astaxanthin, lutein and β-carotene, were determined through reversed-phase high-performance chromatography (RP-HPLC), according to Stramarkou et al. [32], in a corresponding system consisting of a Jasco PU-1580 HPLC pump (Jasco Inc., Easton, MD, USA), a Jasco LG-1580-04 gradient unit (Jasco Inc., Easton, MD, USA), a Rheodyne 7125 injector (Rheodyne Europe GmbH, Bensheim, Germany) with 20 L loop, a Jones 7955 column chromatography heater (Jones Chromatography Limited, Wales, UK) and a Shimadzu SDP-M20A Diode Array Detector (DAD; Shimadzu Corporation, Kyoto, Japan). The stationary phase was immobilized in a YMC C30 reversed-phase column, 5 μm, 250 × 4.6 mm I.D. (YMC Co., Ltd., Kyoto, Japan). The mobile phase consisted of methanol, MTBE and aq. Phosphoric acid, 1% v/v, the column temperature was maintained at 35 °C and the flow rate at 1 mL/min. The linear gradient was adjusted according to Table 1. All the injected external carotenoid standards and C. vulgaris extracts were dissolved in ethyl acetate. The particular content (sel. CAR) was expressed in the mass ratio of the selected carotenoids to extract (mg/gextr).

2.4. Experimental Design, Statistical Analysis & Process Optimization

In this study, a Face-Centered Central Composite Design (FC-CCD) was applied for the effective study of 4 operational parameters of MAE at 3 levels (−1, 0, +1), and response surface methodology (RSM) was performed for data correlation. The independent parameters studied were extraction temperature (T) from 40 to 60 °C, duration (t) from 5 to 25 min, solvent-to-biomass ratio (R) from 20 to 90 mLsolv/gbiom, and microwave power (P) from 300 to 800 watts. The examined responses were extraction yield and total phenolic (TPC), chlorophyll (CHL), and carotenoid (CAR) contents, selected carotenoid content (sel. CAR), and antioxidant activity (IC50). According to Table 2, the experimental design consisted of 8 axial points, 16 factorial points and 3 repetitions of the central point. The FC-CCD is considered one of the most popular designs of response surface methodology (RSM) and facilitates effect studies by avoiding a full-factorial design [33,34].
The data correlation of each response was expressed through the polynomial Equation (1). Response transformation, according to Equation (2), was also applied where considered mandatory.
Y = b 0 + i = 1 4 b i   X i + i = 1 4 b i i   X i 2 + i = 1 3 j = i + 1 4 b i j   X i   X j + i = 1 2 j = 2 3 k = 3 4 b i j k   X i   X j   X k   + i = 1 3 j = i + 1 4 b 1 i j   X i   X j 2 + i = 1 3 j = i + 1 4 b 2 i j   X i 2 X j  
Y′ = f(Y) ↔ Y = f(Y′)
where Y and Y′ stand for the corresponding response and transformation, respectively, b 0 , b i , b i i , and b i j stand for the constant, linear, quadratic and 2-factor interaction coefficients, respectively, b i j k , b 1 i j , and b 2 i j stand for the cubic coefficients, and Xi, Xj and Xk stand for the examined independent variables.
Fisher’s statistical test (F-test) was applied for the determination of the statistical significance with a 95% significance level. Finally, the experimental design, modeling, and statistical analysis of the experimental data were performed using the Design Expert® Version 13 software trial version (Stat-Ease Inc., Minneapolis, MN, USA).

3. Results & Discussion

3.1. MAE of Bioactive Compounds

The extracts obtained from MAE demonstrated a dark green color and a slight fishy odor. The experimental results of all the examined responses are presented in Table 2. The extraction yield presented a wide value range depending on the applied extraction conditions and varied from 5.42 to 20.18% w/w, which correspond to the mildest and the most intense operational conditions, respectively.
Moreover, lutein was the dominant carotenoid among the selected carotenoids that were identified and quantified through the RP-HPLC (Figure 1d, Figure 2d, Figure 3d, Figure 4d and Figure 5d). Chlorella is, in fact, considered a carotenoid-abundant biomass and especially rich in lutein [35]. Lutein has already been a dominant target compound for extraction from Chlorella biomass with the conventional SLE [24,36,37,38], the innovative MAE [21], as well as SFE [36,38,39].
Additionally, the extract’s chlorophyll content mainly consisted of chlorophyll a. Chlorophyll b was present in smaller quantities, while chlorophyll c was even more limited (Figure 1c, Figure 2c, Figure 3c, Figure 4c and Figure 5c). This observation could be justified by the dominance of chlorophyll a over b and c in Chlorella biomass [40,41].
Furthermore, the effect of the independent variables of extraction temperature, duration, solvent-to-biomass ratio and microwave power is presented in Figure 1, Figure 2, Figure 3, Figure 4 and Figure 5 and discussed in detail in the following sections.

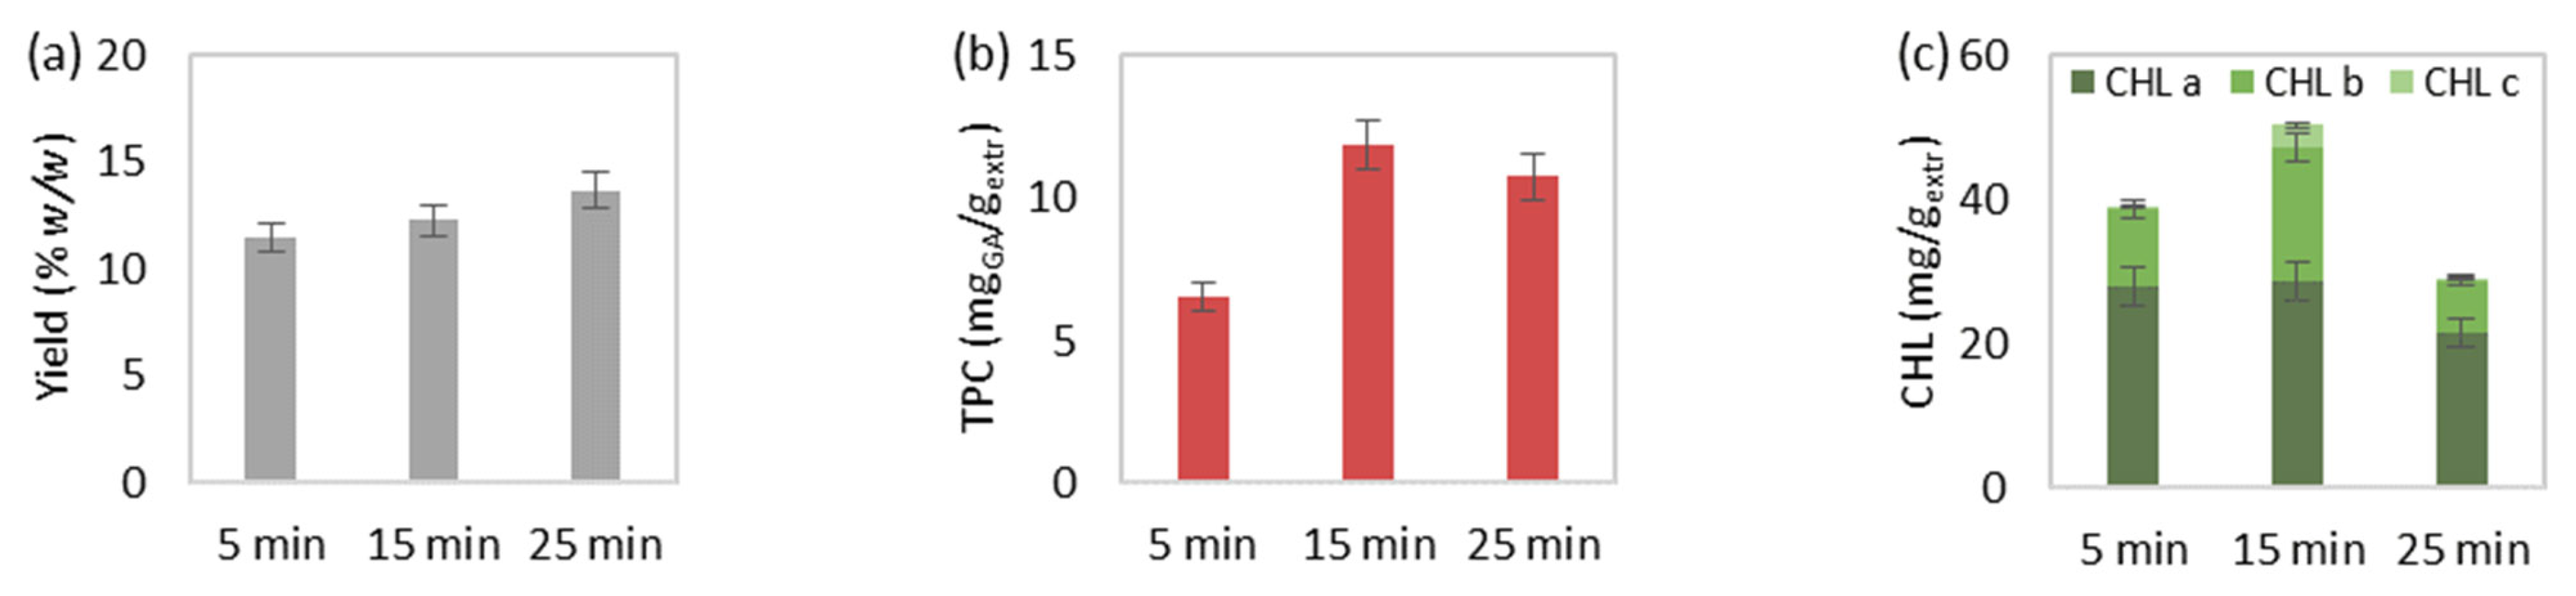
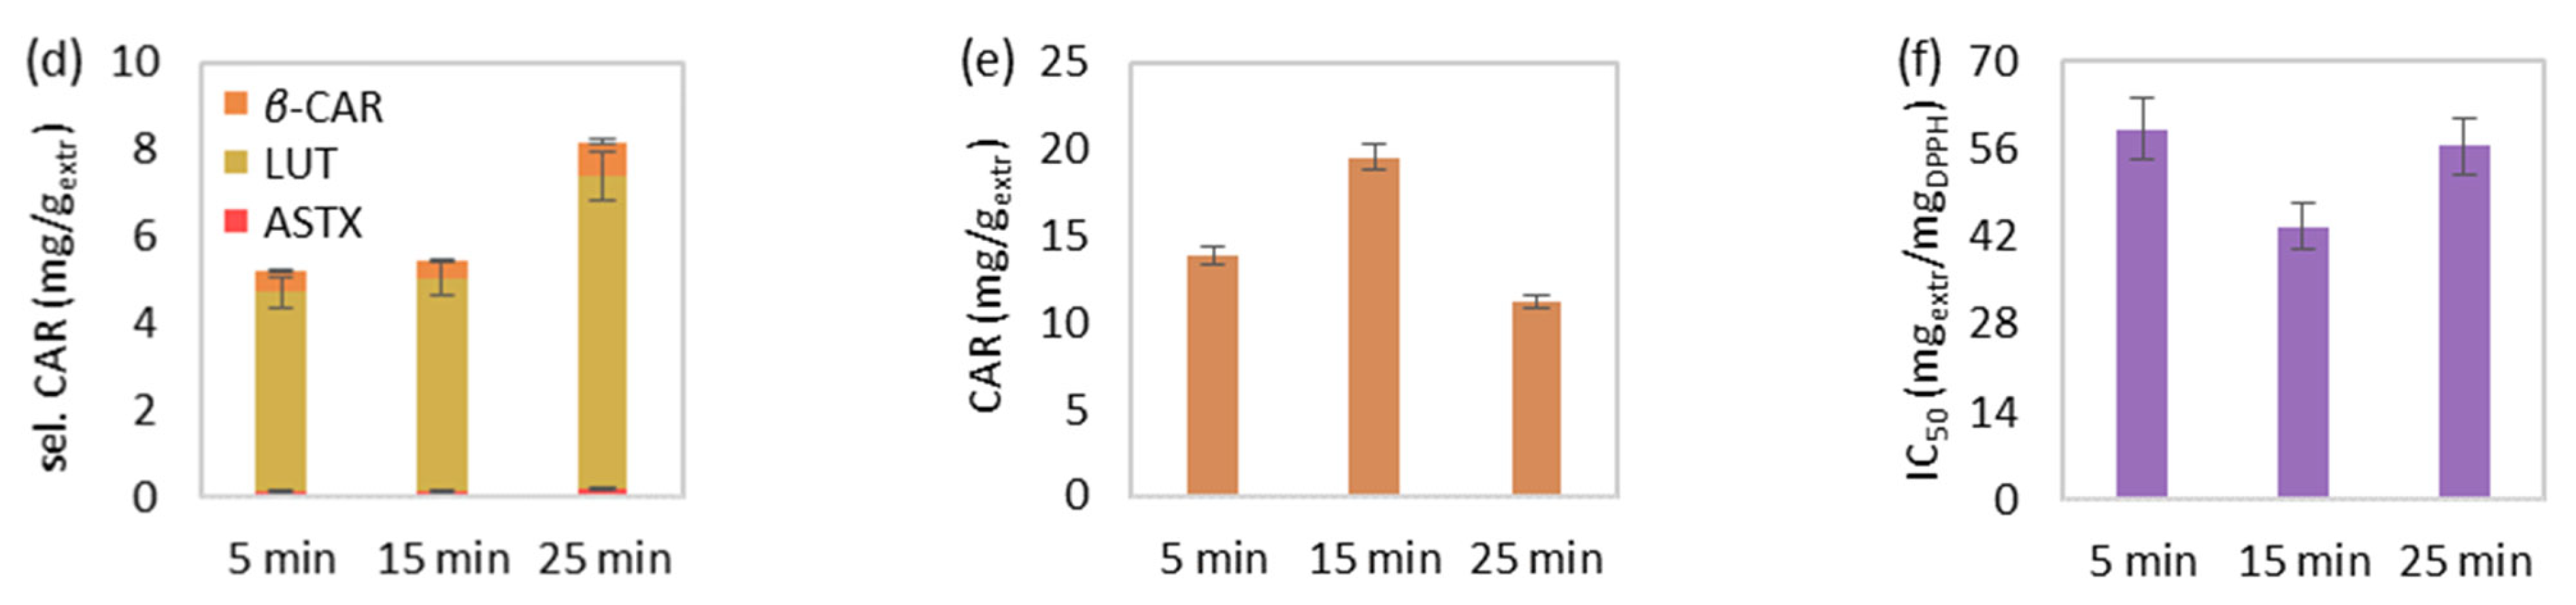
3.1.1. Effect of Time

The effect of increasing time, from 5 to 15 and eventually 25 min, on the MAE at 50 °C, 55 mLsolv/gbiom and 550 watts is illustrated in Figure 1. The extraction yield was slightly increased during the elevation of extraction duration (Figure 1a). In addition, the total phenolic (Figure 1b), chlorophyll (Figure 1c), carotenoid content (Figure 1e), and extract’s antioxidant activity (Figure 1e) were favored during time increase from 5 to 15 min, while extraction for 25 min led to a value decrease of the aforementioned responses. However, the extraction for 25 min improved the selected carotenoid content, especially lutein (Figure 1d). In general, the increase in extraction time results in the improvement of extraction yield [42]. Still, the prolonged extraction duration and extended exposure to microwave irradiation may lead to the degradation of certain thermolabile bioactive compounds [43]. Similar observations were also made in other studies regarding the deterioration of chlorophyll [44], carotenoid [21,45] and phenolic content [42,46], as well as the extract’s antioxidant activity [42,46] of algal or different types of extracts after prolonged MAE.

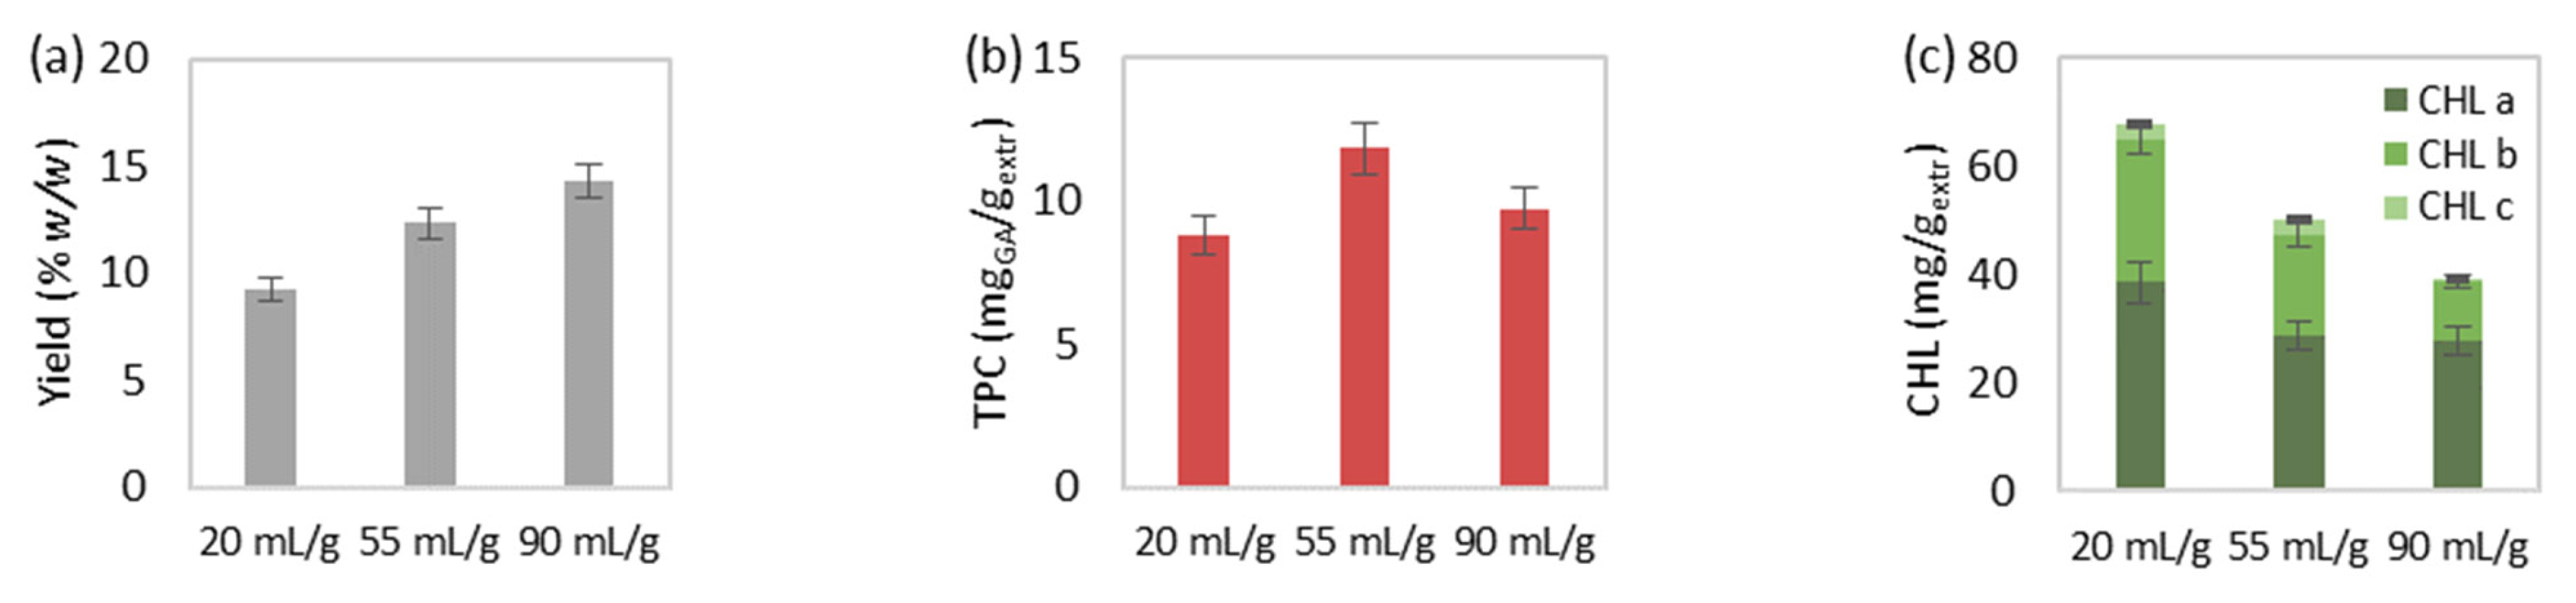
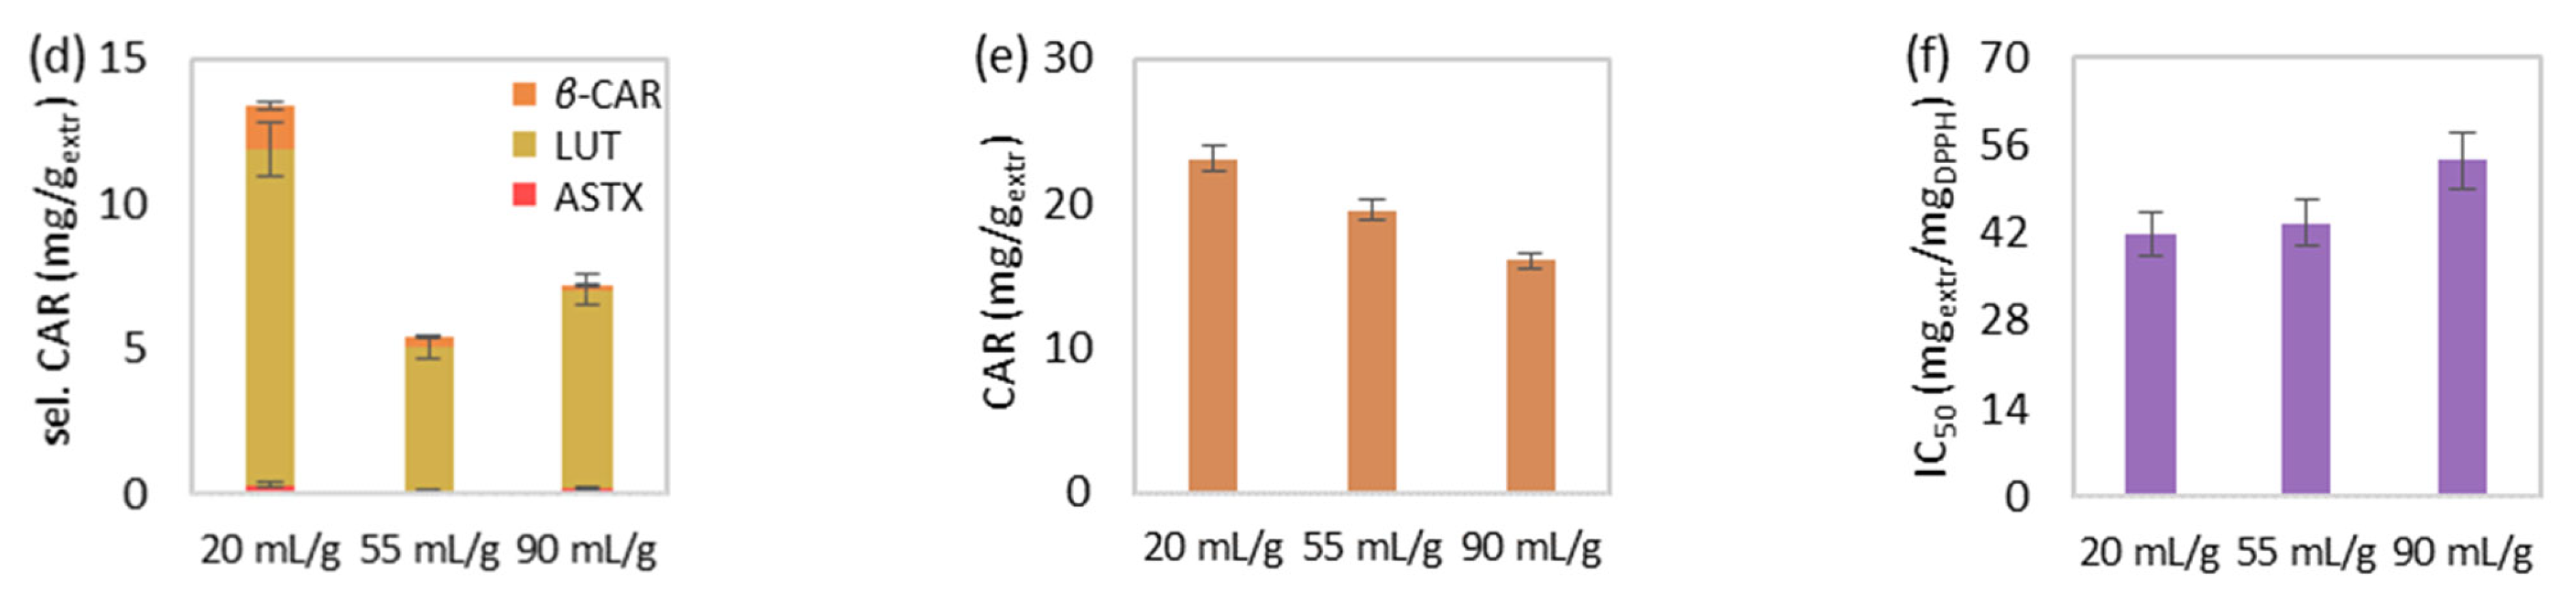
3.1.2. Effect of Solvent-to-Biomass Ratio

The increase of solvent-to-biomass ratio, from 20 to 55 and eventually 90 mLsolv/gbiom, during MAE at 50 °C, 15 min and 550 watts led to extraction yield improvement (Figure 2a). However, chlorophylls (Figure 2c), carotenoids (Figure 2e), as well as the extract’s antioxidant activity (Figure 2f) were not favored by the solvent-to-biomass ratio rise and therefore were decreased. The selected carotenoid content (Figure 2d) was negatively affected by the ratio increase, but lutein was slightly increased above 55 mLsolv/gbiom. Finally, total phenolic content (Figure 2b) initially improved from 20 to 55 mLsolv/gbiom, while further solvent-to-biomass increase led to reduced values.
According to the literature, an increase in the solvent-to-biomass ratio on MAE is considered contradictory, leading either to increased extraction yield [47,48,49] or enhanced yield, which afterward decreases [50,51,52,53]. The solvent-to-biomass ratio increase offers a greater concentration gradient to the biomass-solvent system, contributes to the solvent’s amount sufficiency and mixing adequacy and therefore offers faster and intensified diffusion phenomena [54,55]. This could justify the yield’s rise during the solvent-to-biomass ratio’s increase from 20 to 90 mLsolv/gbiom, as well as the initial enhancement of total phenolic content from 20 to 55 mLsolv/gbiom. However, solvent increment during MAE demands higher microwave power and duration in order to reach the required temperature [15]. In addition, the solvent-to-biomass ratio’s increase might lead to the dissolution and extraction of undesirable compounds and hence lower solvent selectivity toward components of interest [56]. The above reasons might be responsible for the decreasing values of the examined pigment concentration and antioxidant activity of the extracts during solvent-to-biomass ratio increase from 20 to 90 mLsolv/gbiom, as well as the reduced phenolic content for ratio above 55 mLsolv/gbiom.

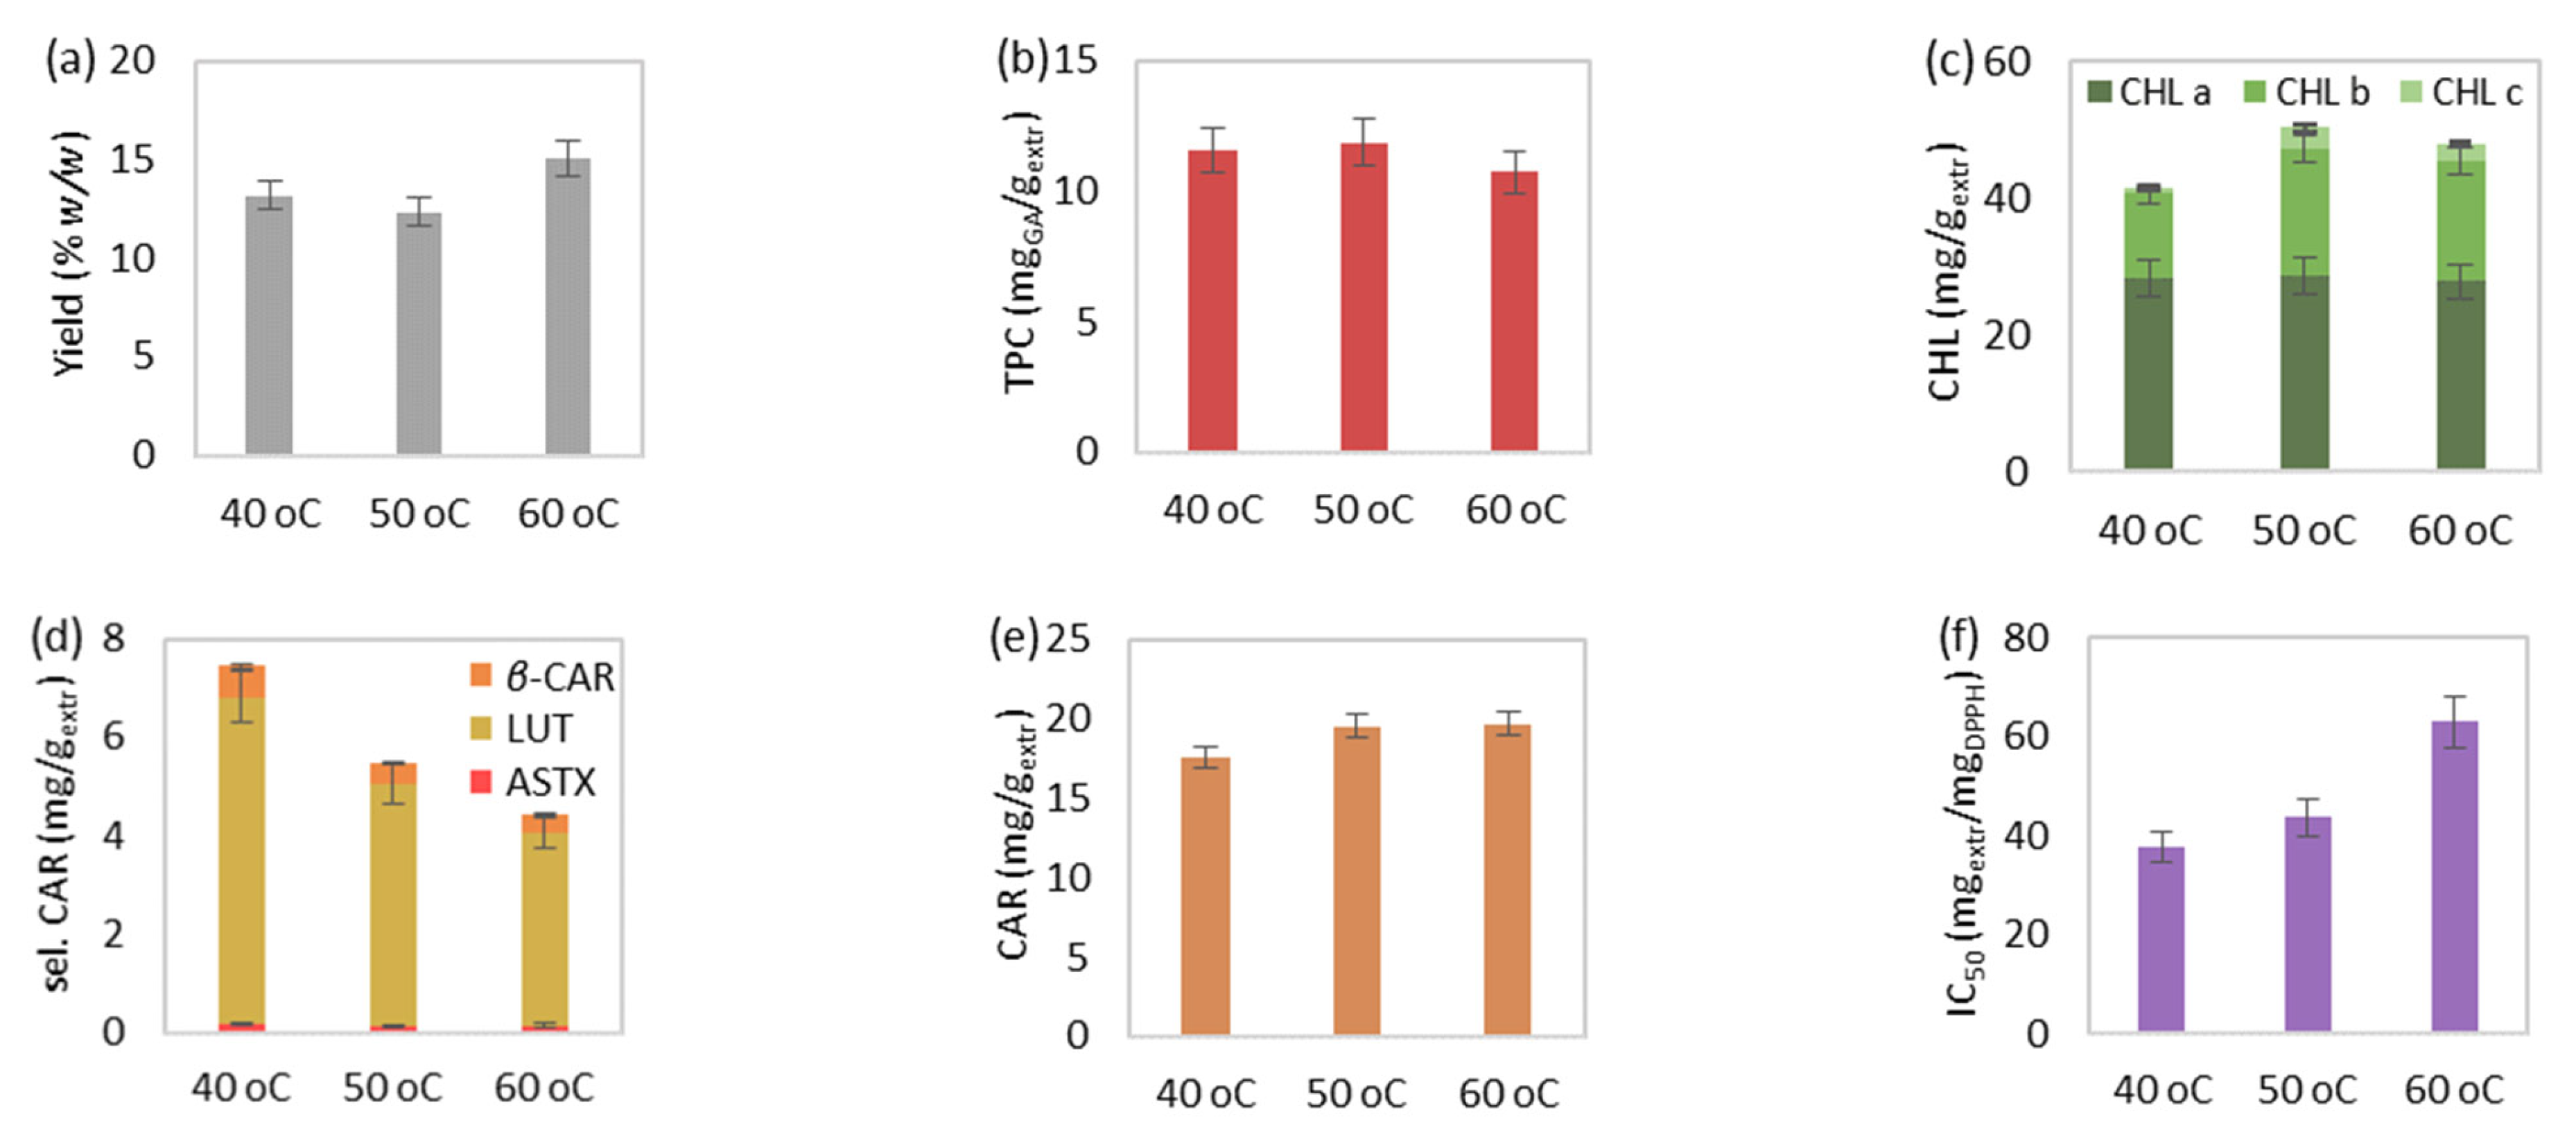
3.1.3. Effect of Temperature

The effect of increasing temperature, from 40 to 50 and eventually 60 °C, on the MAE at 15 min, 55 mLsolv/gbiom and 550 watts is illustrated in Figure 3. The initial increase from 40 to 50 °C did not favor the extraction yield, while further temperature elevation led to improved recovery of total extract at 60 °C (Figure 3a). Moreover, the extract’s total pigment content was moderately improved during temperature increase (Figure 3c,e). The above observations could be justified by the decrease of solvent’s viscosity from 40 to 60 °C, and therefore an increase of its solvation power [57,58].
On the other hand, the extract’s antioxidant activity deteriorated during the temperature increase (Figure 3f). This could be attributed to the reduced content of lutein (Figure 3d), which presents much higher antioxidant activity compared to other carotenoids, e.g., 15- and 10-time folds of lycopene and β-carotene [59]. In particular, the selected carotenoid content presented a downward trend, probably due to the domination of their degradation instead of their extraction, also noted in the literature during microwave radiation at temperatures close to 60 °C [60]. Moreover, chlorophylls present appreciable antioxidant activity at high concentrations [61], and thus the moderate increase of chlorophyll content could not significantly affect the extract’s antioxidant activity.
Finally, total phenolic content presented a slight decrease, but the temperature rise was considered imperceptible (Figure 3b). A similar weak temperature effect was also observed in the literature [53,62].

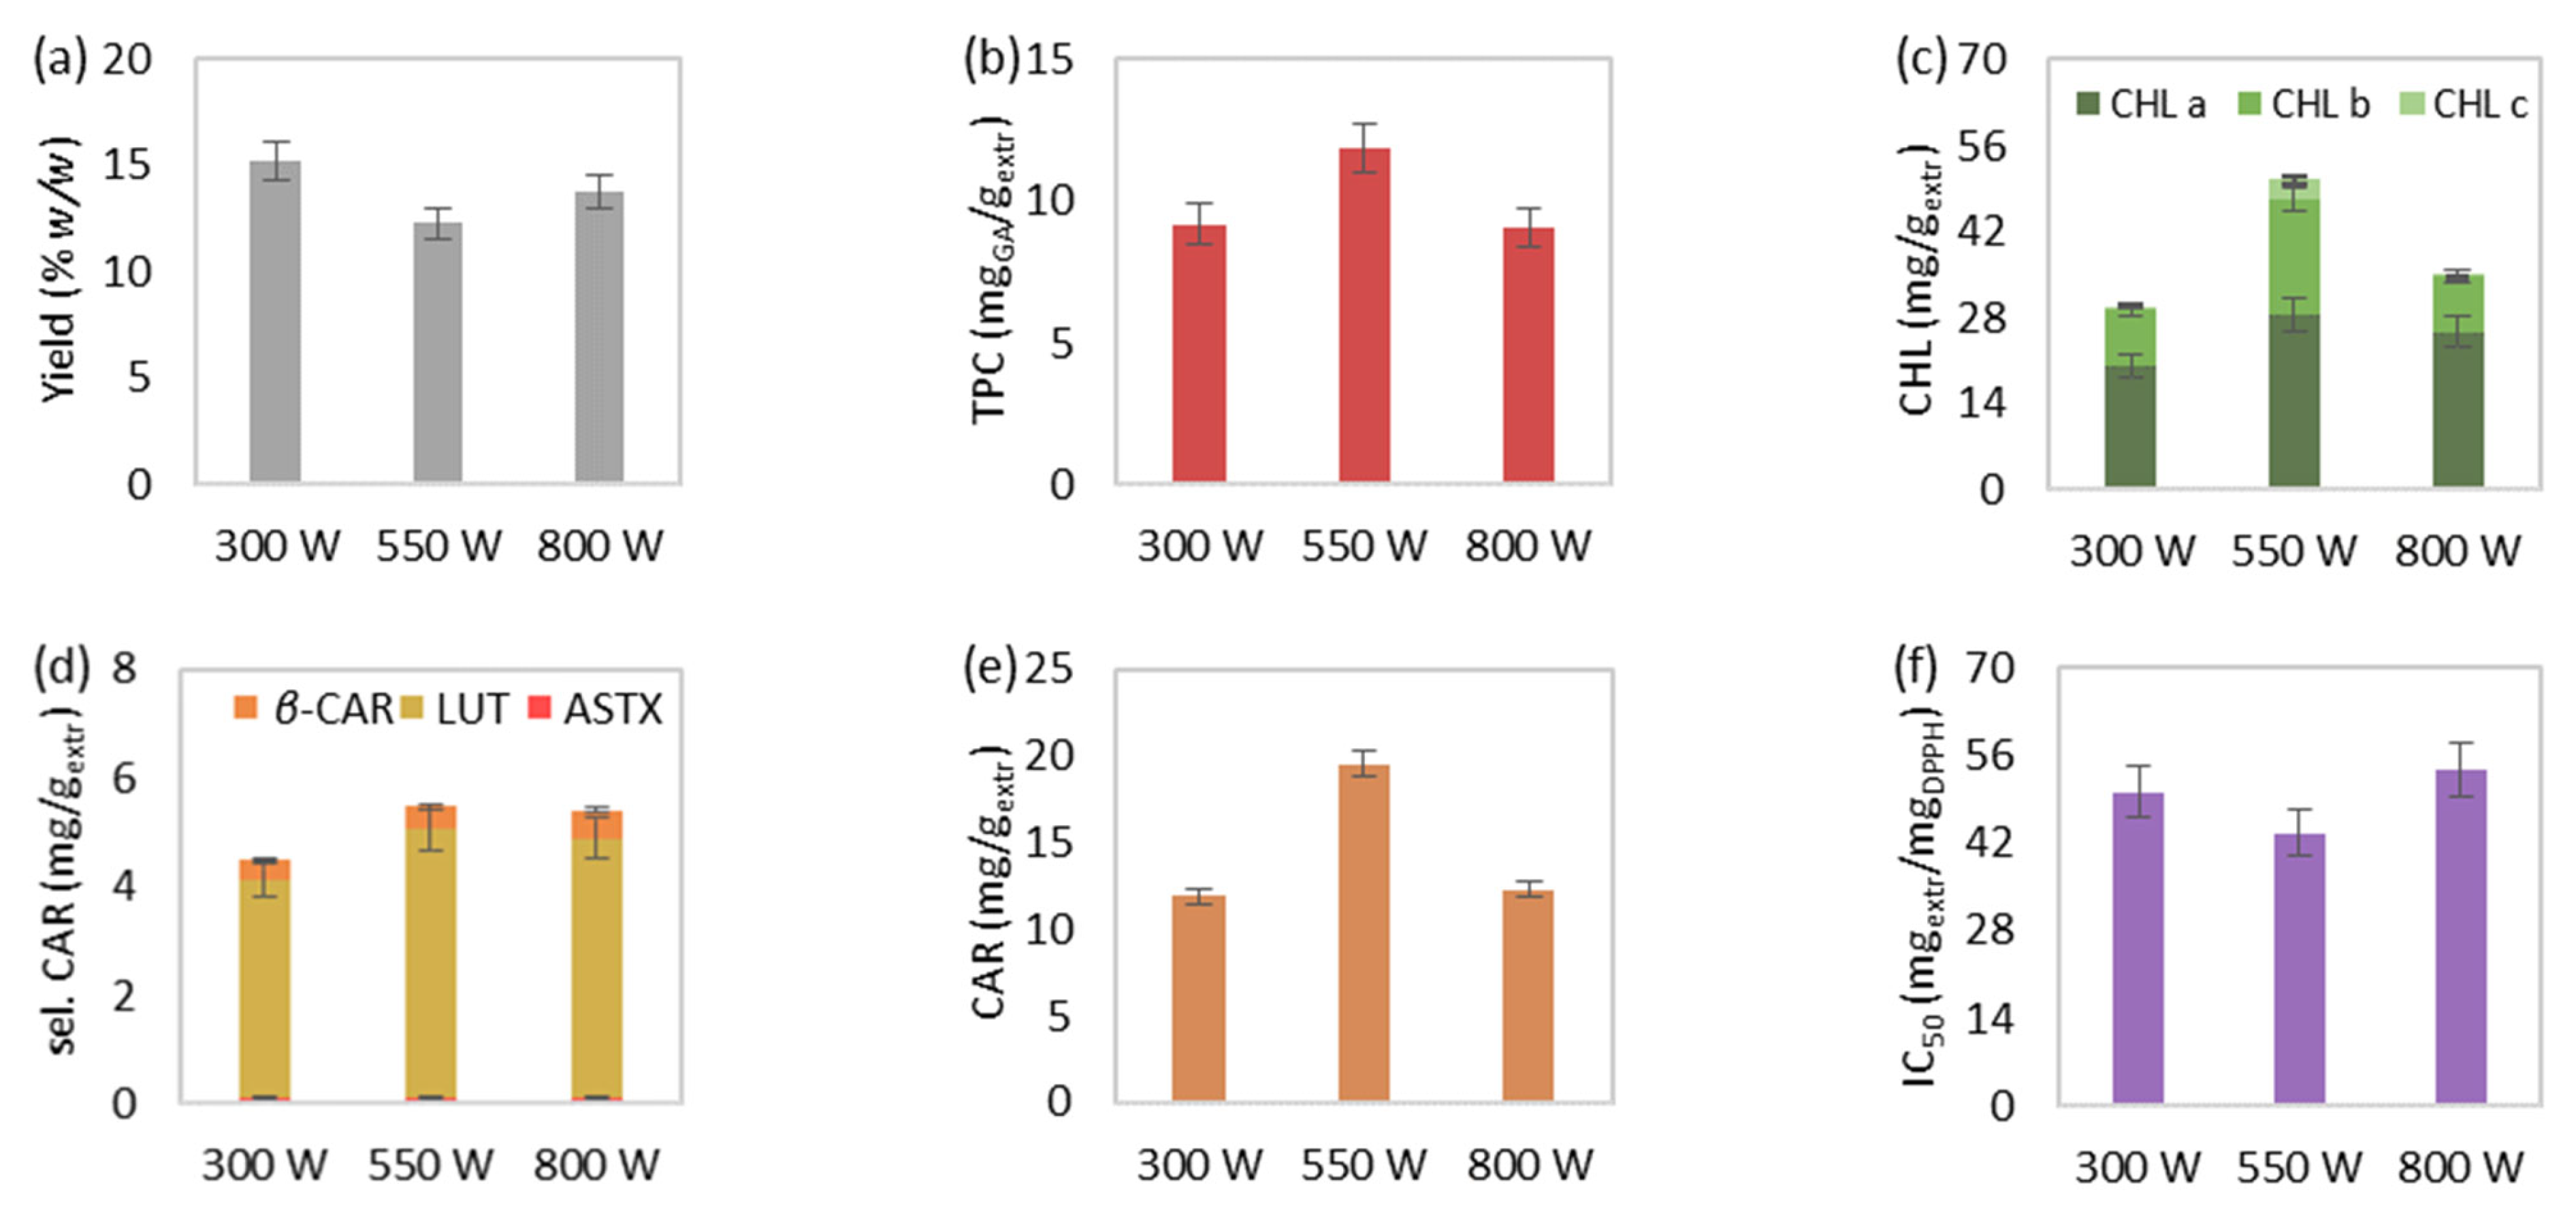
3.1.4. Effect of Microwave Power

The effect of increasing microwave power, from 300 to 550 and eventually 800 watts, on the MAE at 15 min, 55 mLsolv/gbiom and 50 °C is illustrated in Figure 4. The extraction yield was overall not favored by the microwave power elevation. A decrease at 550 watts was noted, followed by a slight increase at 800 watts, which, however, did not exceed the extraction yield at 300 watts (Figure 4a). Microwave power increase from 300 to 550 watts significantly favored total phenolic (Figure 4b), chlorophyll (Figure 4c), and carotenoid content (Figure 4e), while the extract’s antioxidant activity (Figure 4f) was affected accordingly. Nevertheless, MAE under the high microwave power value of 800 watts worsened the aforementioned responses.
During the microwave power increase from 300 to 550 watts, the augmented microwave radiation improved the content of the examined bioactive compounds as a result of the boosted molecular interaction between the biomass and the electromagnetic field. However, further increase of the microwave power above 550 watts could possibly be responsible for the deterioration and thermal degradation of the extract’s bioactive components [63,64]. Similar findings were also observed regarding the extracted phenolic compounds and pigments, as well as the extract’s bioactivity from other natural raw materials [46,53,63]. Finally, an MAE study of proteins from C. vulgaris showed that the microwave power increase significantly reduced the protein recovery yield [22]. Considering the high protein content of C. vulgaris, as emerged from a previous study (~45% dw) [25], a decreasing extraction yield could be considered a possible outcome during extraction under excessive microwave power.

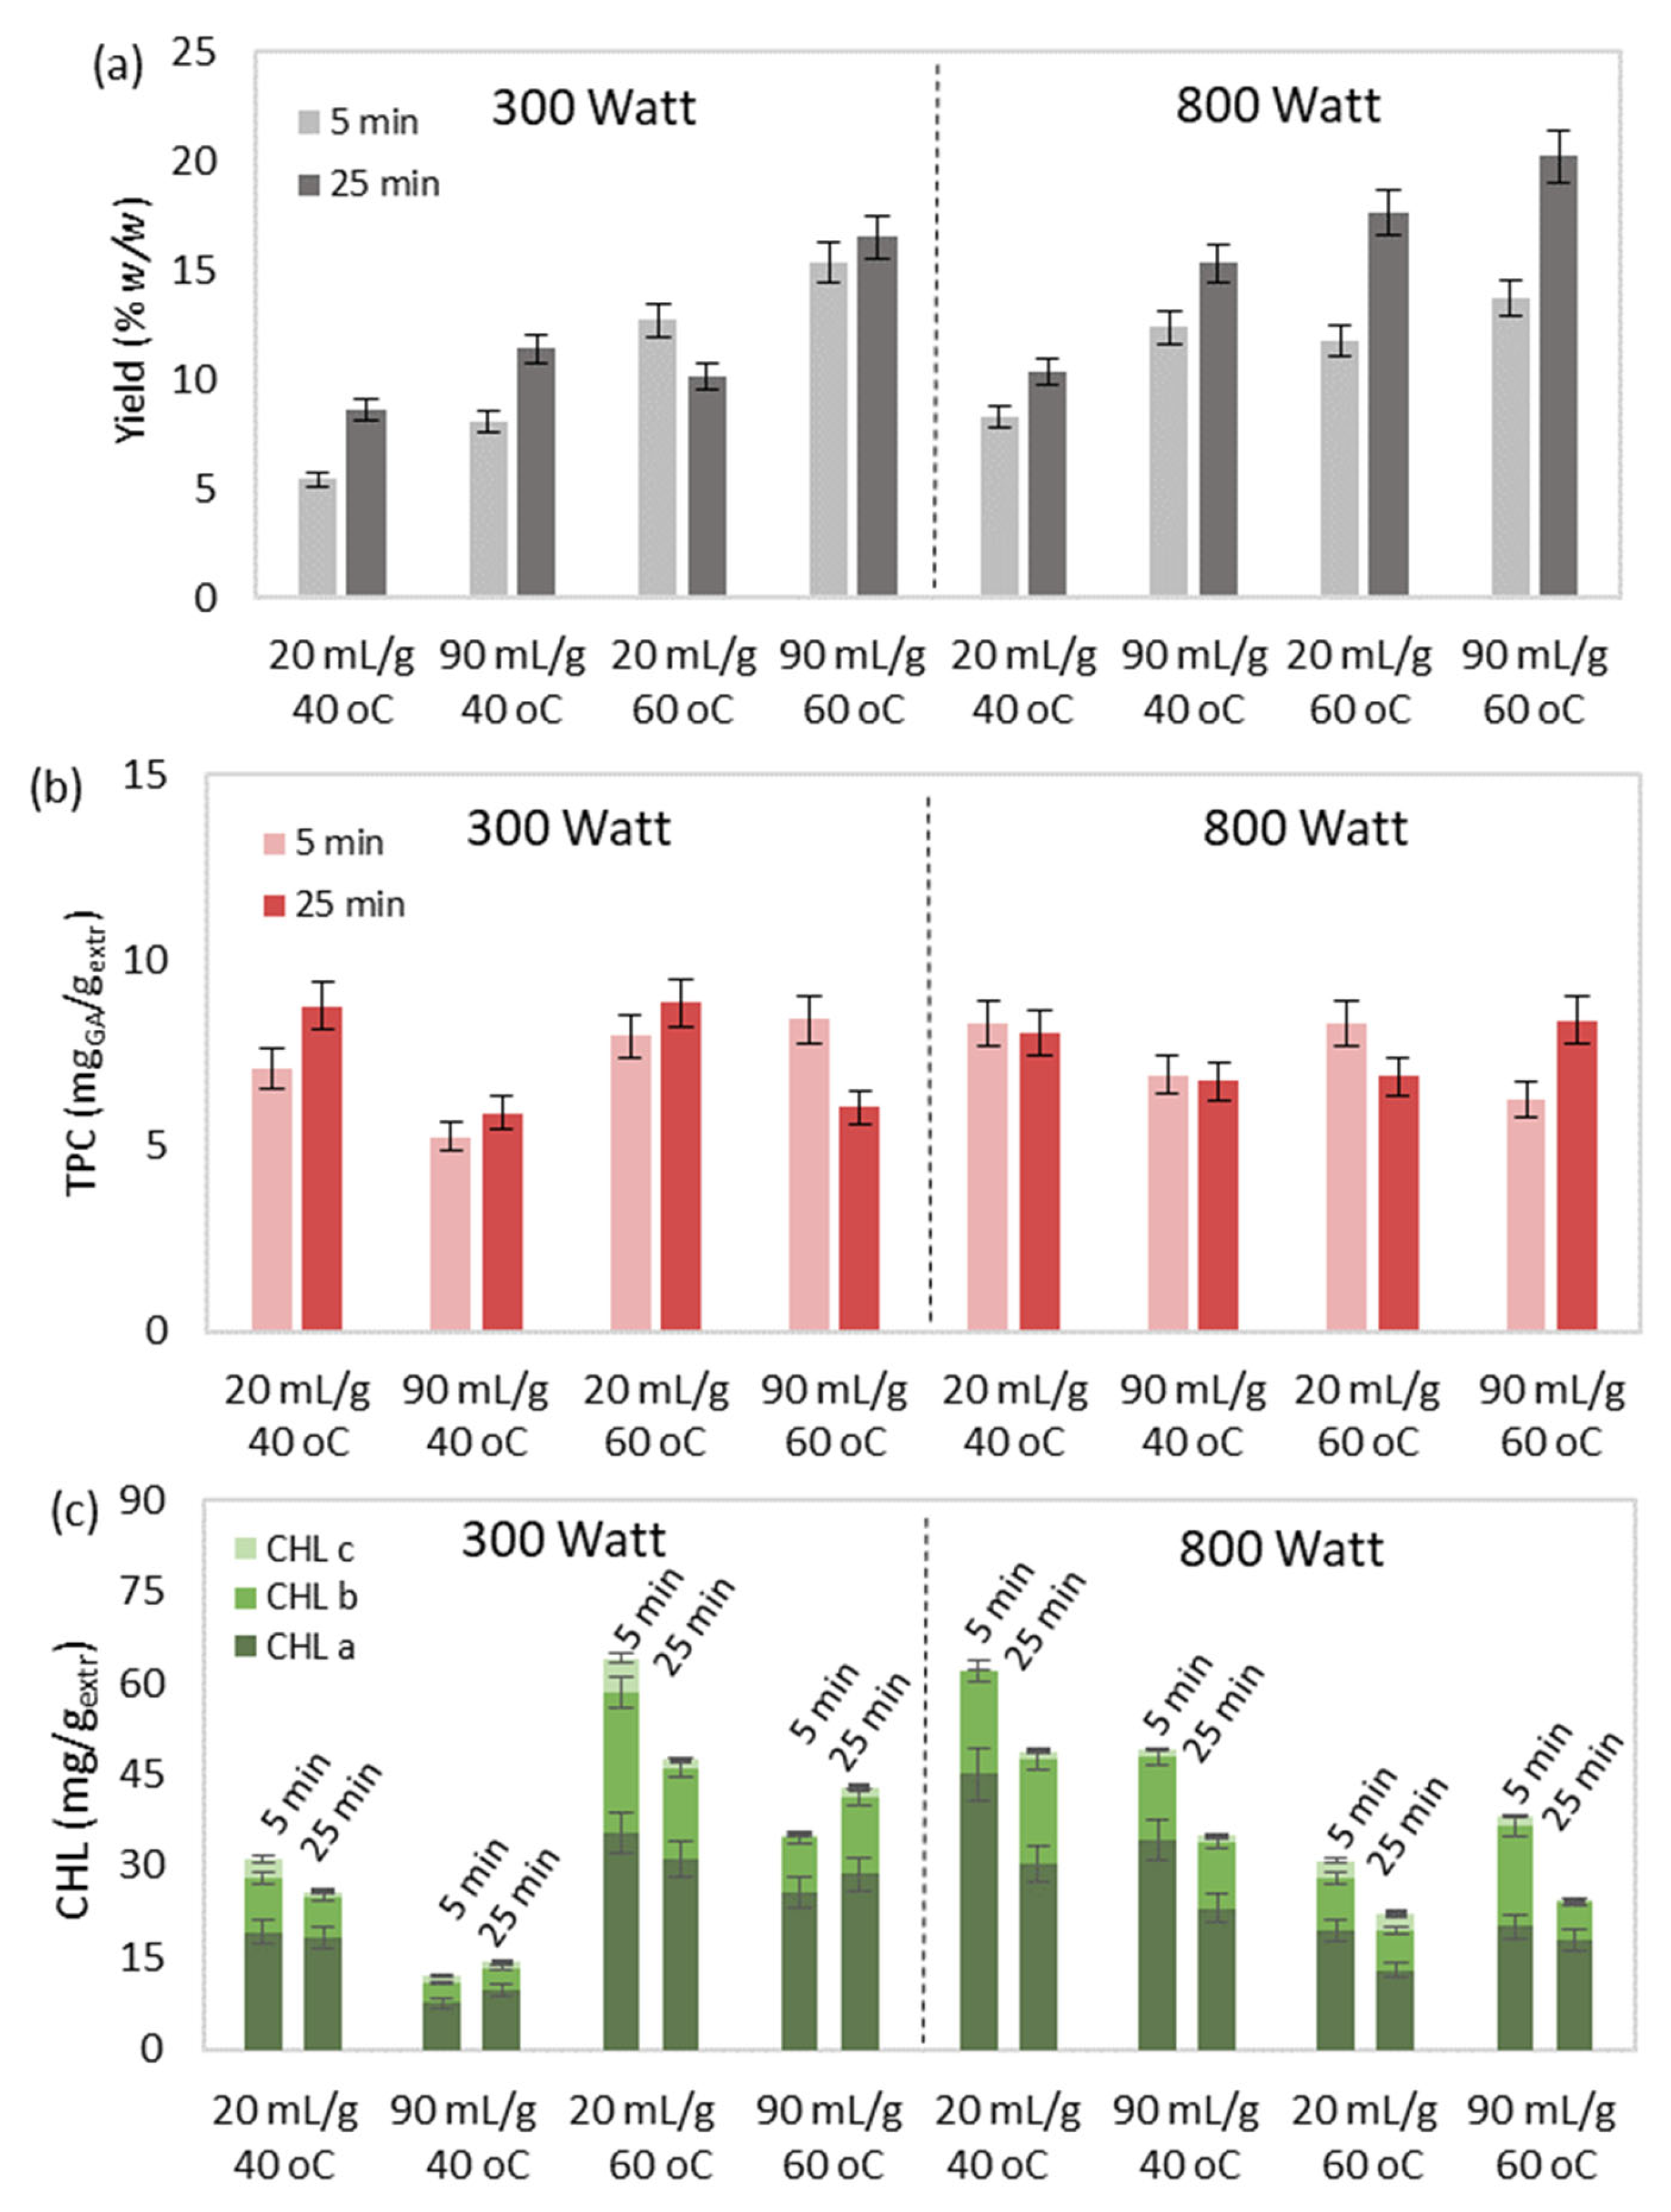
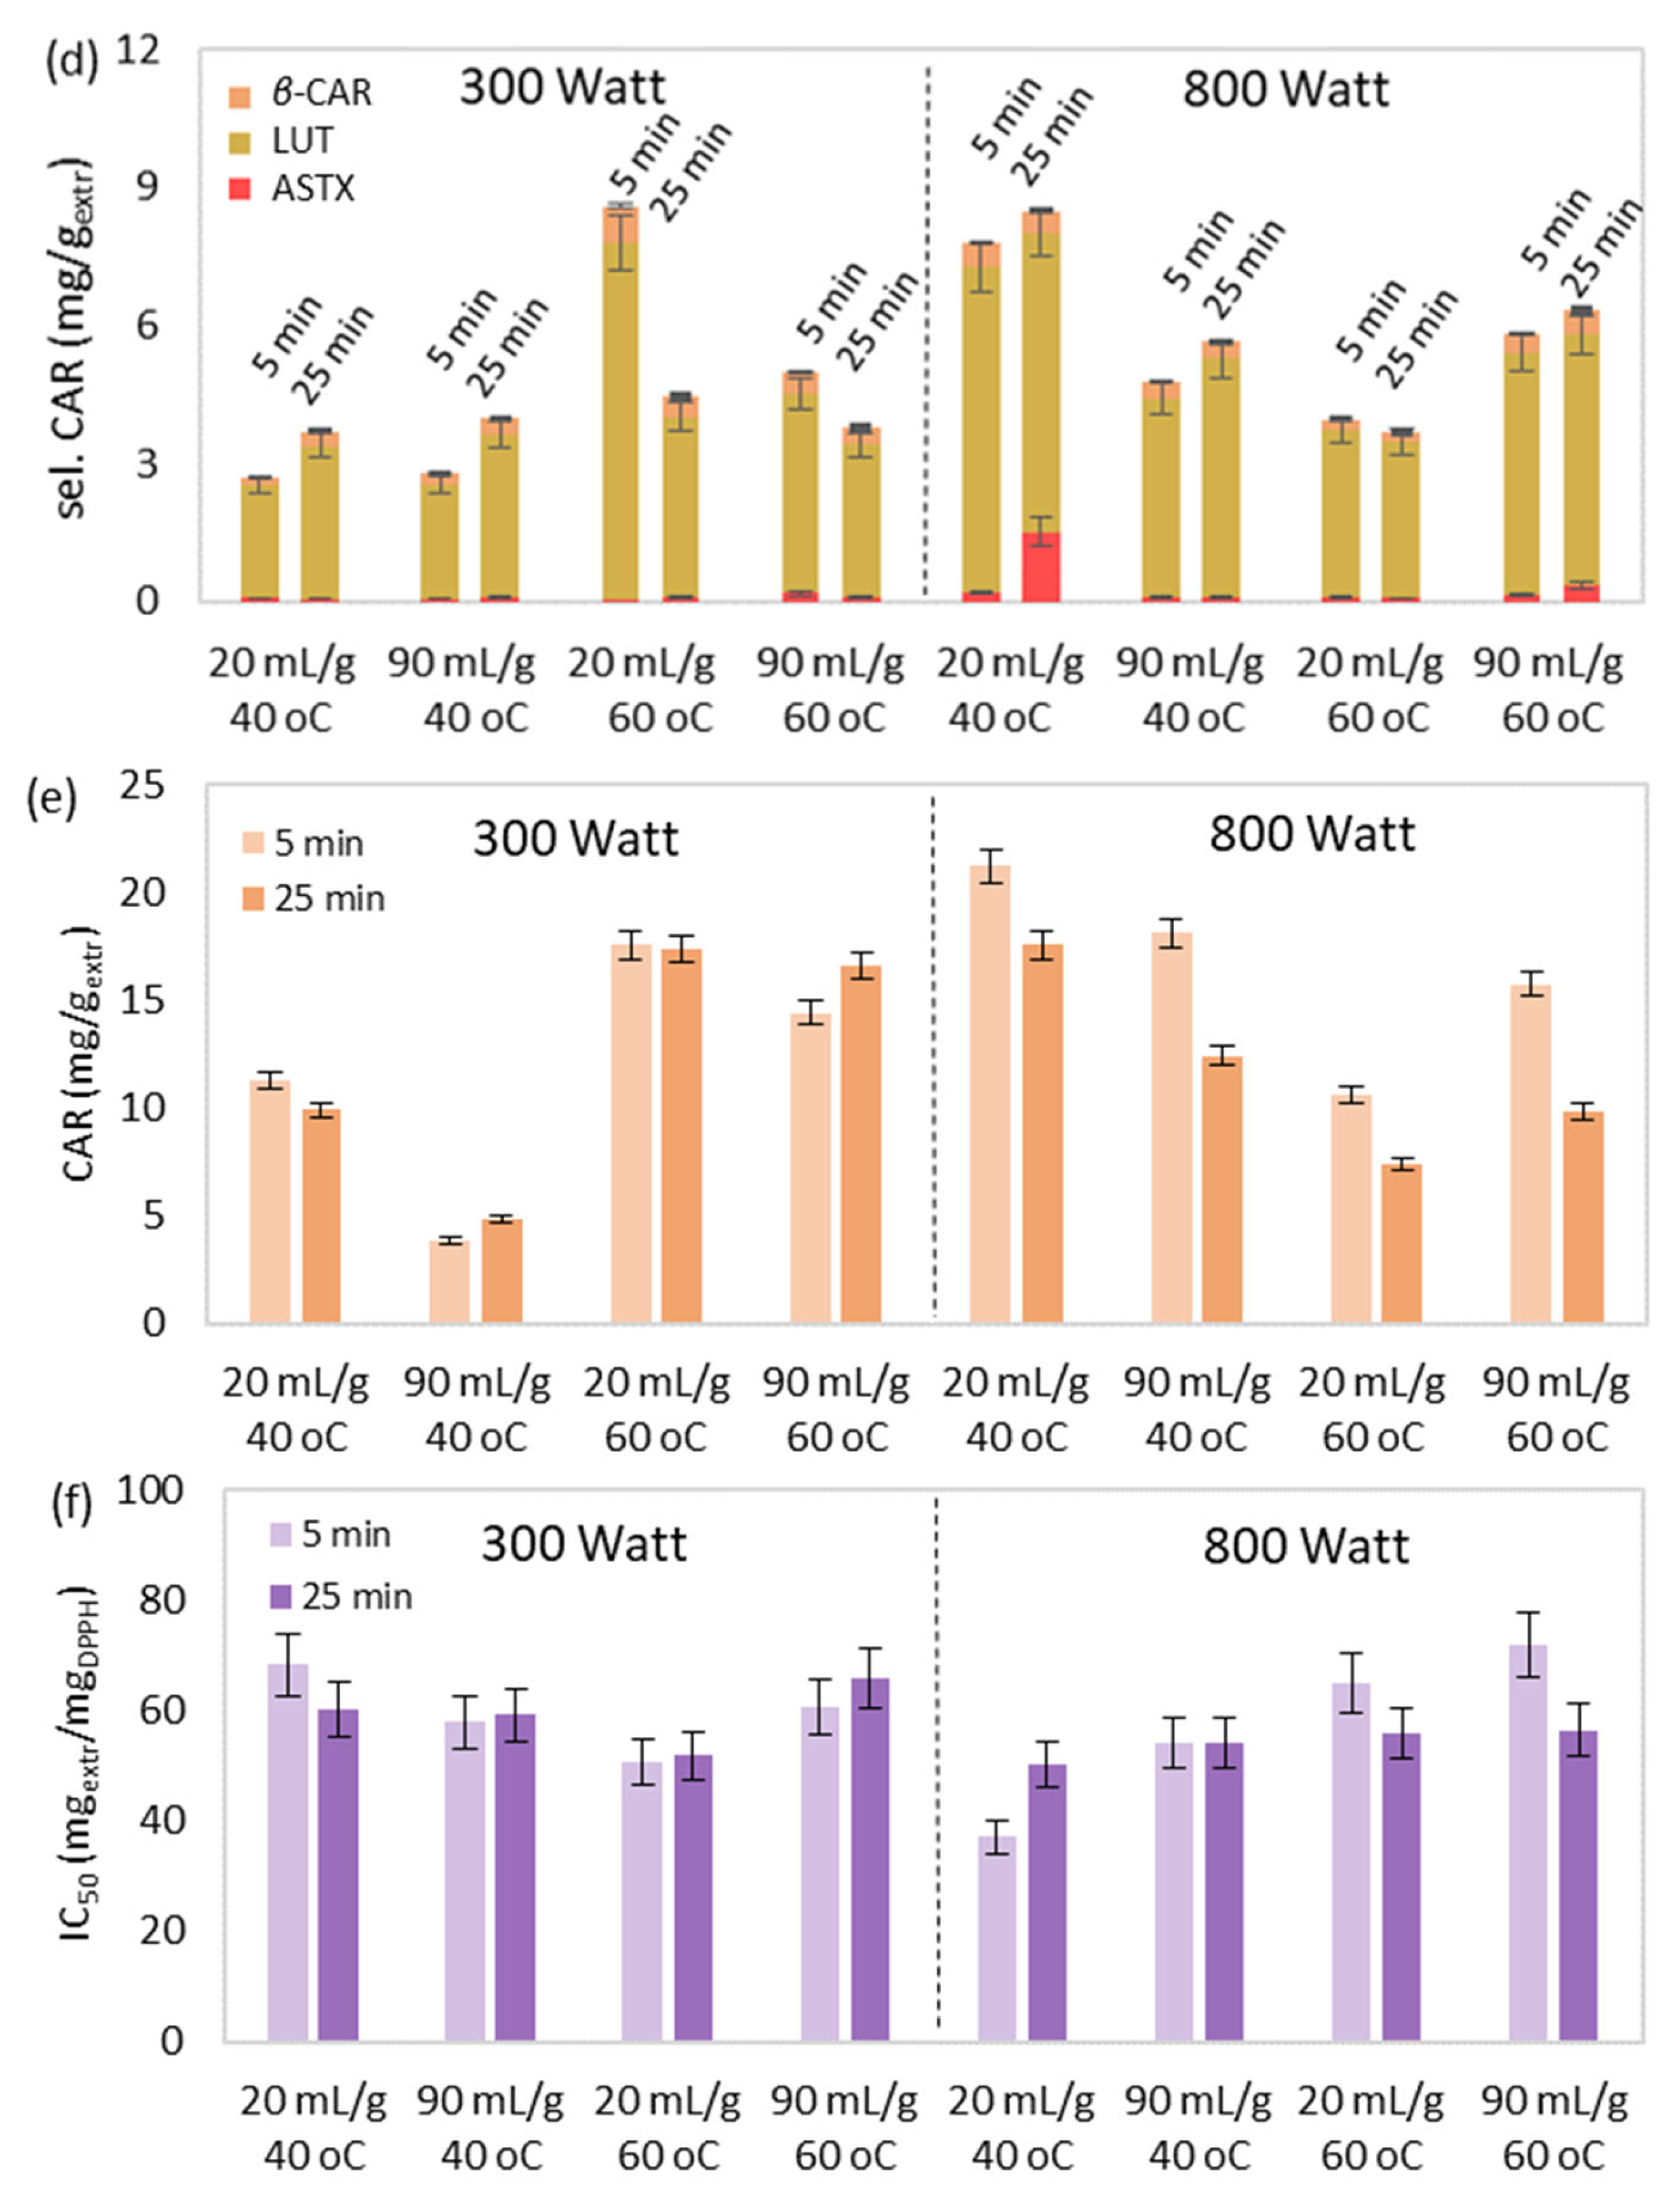
3.1.5. Synergistic Effect

The understanding of the synergistic effect of the examined operational conditions was also attempted through Figure 5. It was observed that the simultaneous increase of extraction temperature, duration, solvent-to-biomass ratio and microwave power led to significantly improved yield (Figure 5a).
However, excessive values of the aforementioned parameters could be responsible for the deterioration and degradation of the extract’s bioactive compounds [65]. More specifically, improved pigment content (Figure 5c–e) and antioxidant activity (Figure 5f) were observed under either high temperature and low microwave power or low temperature and high microwave power during low values of extraction duration and solvent-to-biomass ratio. Finally, no specific trend was observed regarding the total phenolic content (Figure 5b), with the lowest values occurring during MAE at low temperatures and microwave power levels and high solvent-to-biomass ratios.

3.2. Statistical Analysis & Process Optimization

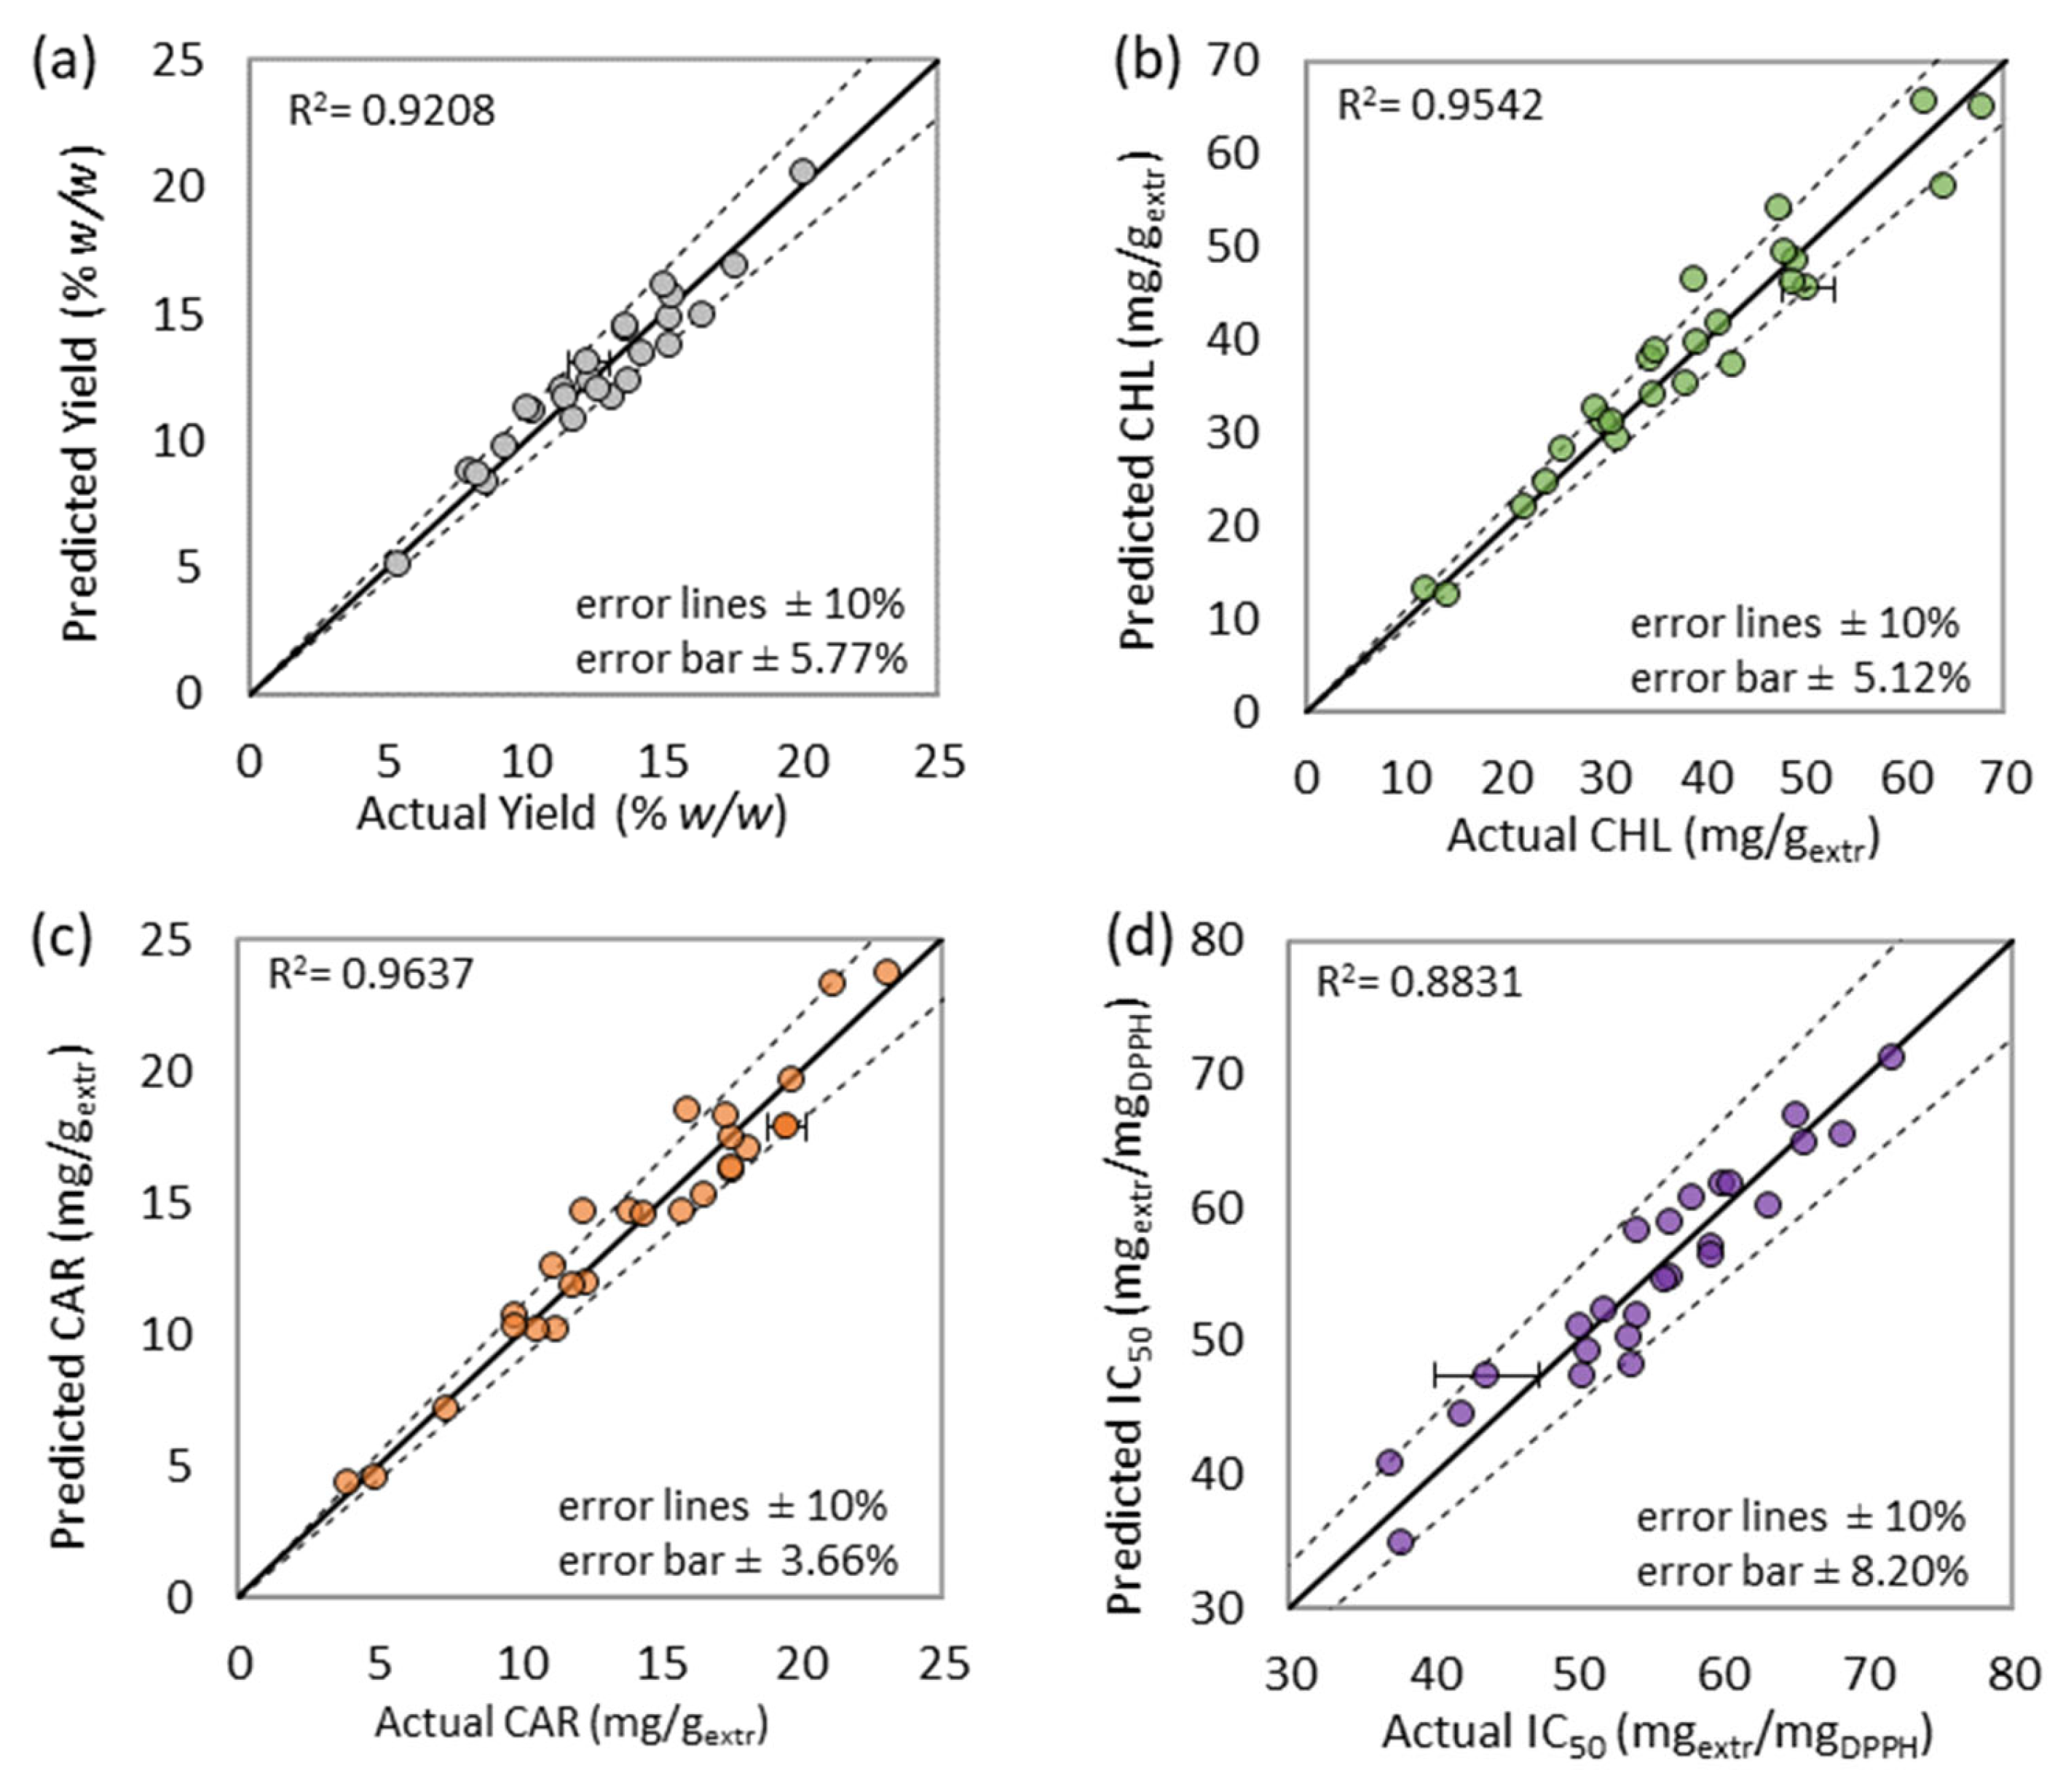
3.2.1. Regression Model Equations

The analysis tool of ANOVA was employed for the statistical analysis of the examined responses. The results of ANOVA are presented and evaluated in Appendix B. The Equations (1) and (2) were applied to fit the experimental responses of yield, extract’s total chlorophyll and carotenoid content, as well as antioxidant activity (Table 3) and are presented below:
Yield = −115.1271 + 4.3438 T + 0.2334 P + 1.0443 t + 0.1885 R − 0.0090 TP − 0.0215 T t − 0.0016 P t − 0.0374 T2 − 0.0012 R2 + 0.3828 10−4 T P t + 0.8281 10−4 T2 P
CHL′ = −0.6675 + 0.0686 T + 0.0120 P + 0.0775 t − 0.0448 R − 0.1400 10−3 T P + 0.3049 10−3 T R − 0.3119 10−4 P t + 0.1409 10−4 P R − 0.4491 10−4 P2 − 0.0023 t2
+ 0.1540 10−3 R2
Chlorophylls = expCHL′
CAR′ = −1.5102 + 0.0580 T + 0.0124 P + 0.0964 t − 0.0506 R − 0.1365 10−3 T P + 0.4853 10−3 T R − 0.4068 10−4 P t + 0.1564 10−5 P R − 0.4901 10−5 P2 − 0.0027 t2
+ 0.1296 10−3 R2
Carotenoids = expCAR′
IC50 = 416.4306 − 6.7840 T − 1.2351 P − 5.0817 t − 1.1183 R + 0.0237 T P + 0.0545 T t + 0.0228 T R + 0.0061 P t + 0.0019 P R + 0.8633 10−3 P2 + 0.0805 t2 − 0.1266 10−3 T P t − 0.3453 10−4 T P R − 0.1656 10−4 T P2
where yield is expressed in % w/w, carotenoids and chlorophylls are expressed in mg/gextr, and the antioxidant’s activity quantitative measure IC50 is expressed in mgextr/mgDPPH. The correlation of the extract’s total phenolic and selected carotenoid content was not accomplished to the desired extent; thus, the corresponding models were not included.
The ANOVA results (Appendix B) led to a successful data correlation, while the models’ satisfactory accuracy and precision are also proved by the affinity of the predicted and experimental data presented in Figure 6. According to the information provided in Appendix B, the extraction yield is considered highly affected by the individual effect of temperature and solvent-to-biomass ratio and the combined effect of temperature, pressure, and duration (T P t). Moreover, chlorophyll content is proved highly dependent on solvent-to-biomass ratio, while the same applies between antioxidant activity and temperature. Finally, all the successfully associated responses were significantly affected by the combined factor of temperature and microwave power (T P).

3.2.2. Optimization of MAE’s Operational Conditions & Model’s Verification

Regarding the optimization process followed, the examined responses of yield and pigment content were set to maximize, and IC50 was set to minimize, as the independent variables ranged in their domain. Among the proposed solutions, the final choice was based on the maximization of the objective function of desirability, the possibility of low microwave power application and, thus, the moderate cooling needs of the extraction vessel to maintain a temperature-controlled system. Therefore, MAE’s optimal conditions chosen were 60 °C, 300 watts, 14 min, and 22 mLsolv/gbiom.
Finally, a confirmation experiment was carried out under the proposed set of operational conditions, the results of which are presented in Table 3. None of the experimental responses exceeded 10%, indicating the sufficient description and adequate precision of the models [66,67].

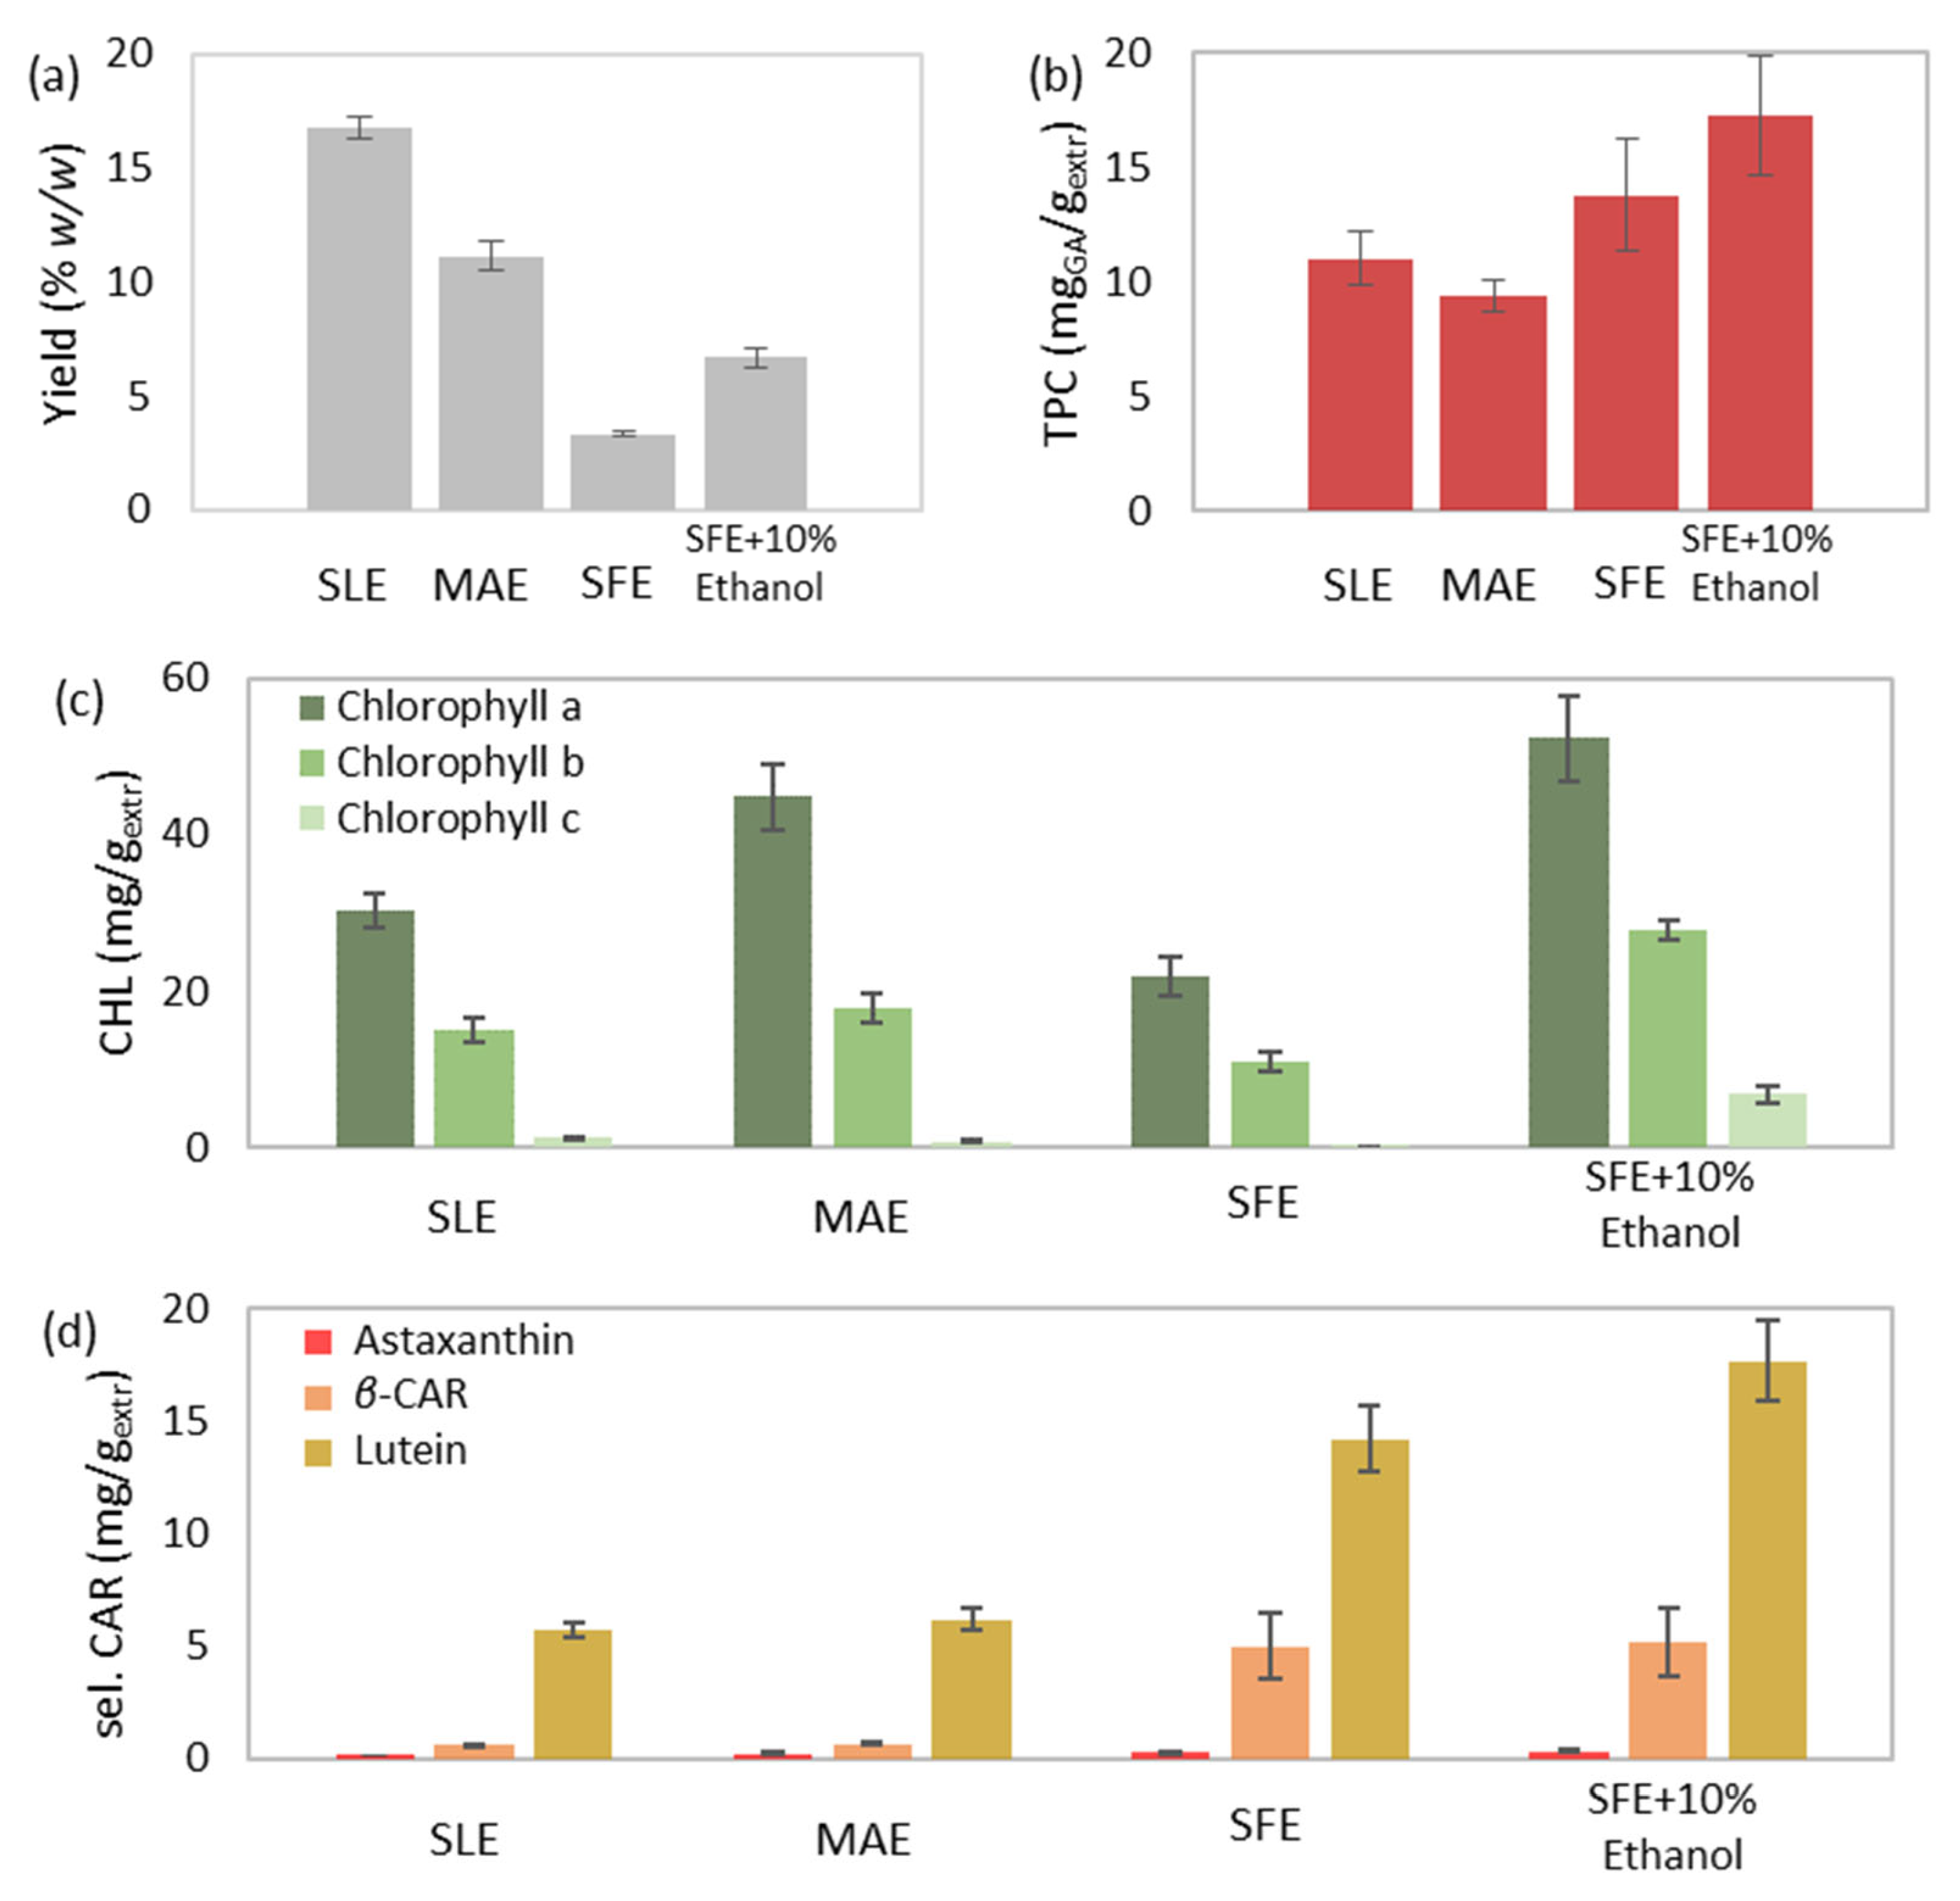
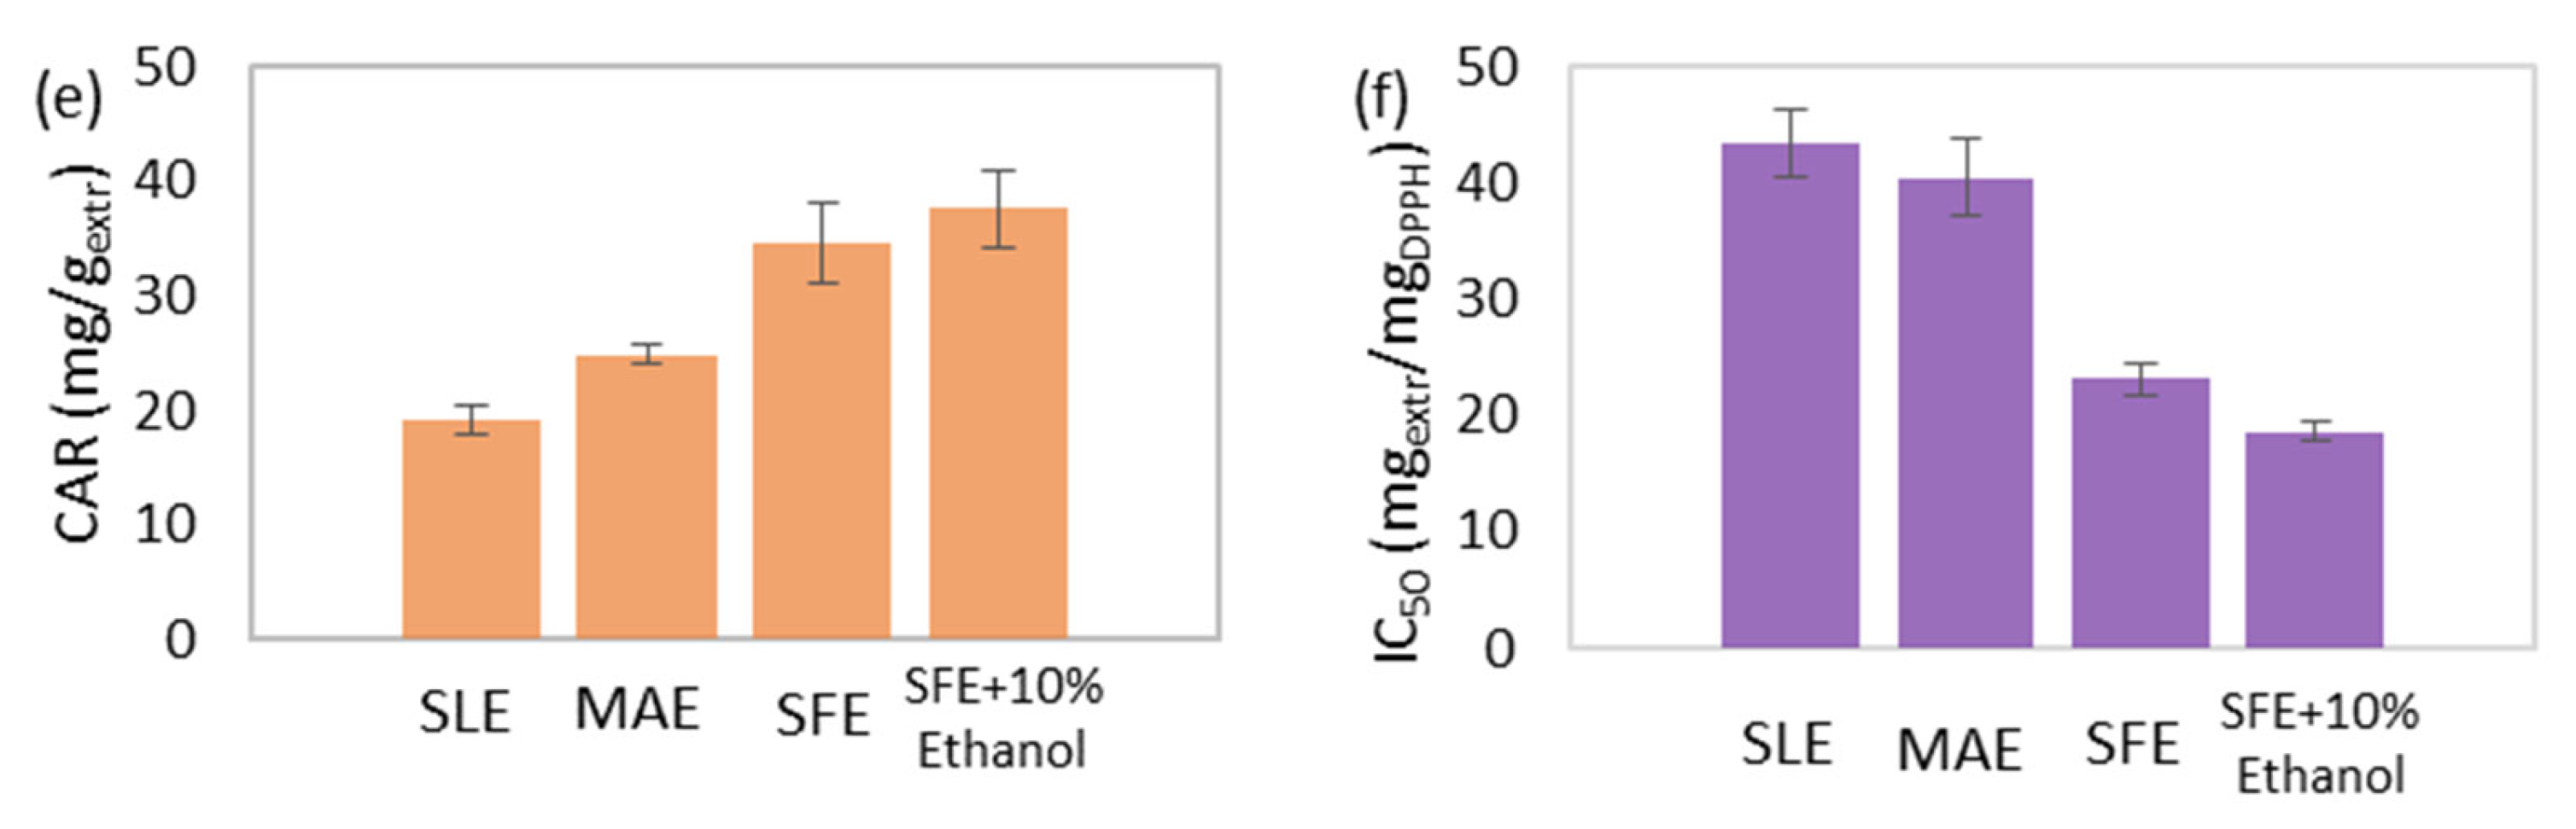
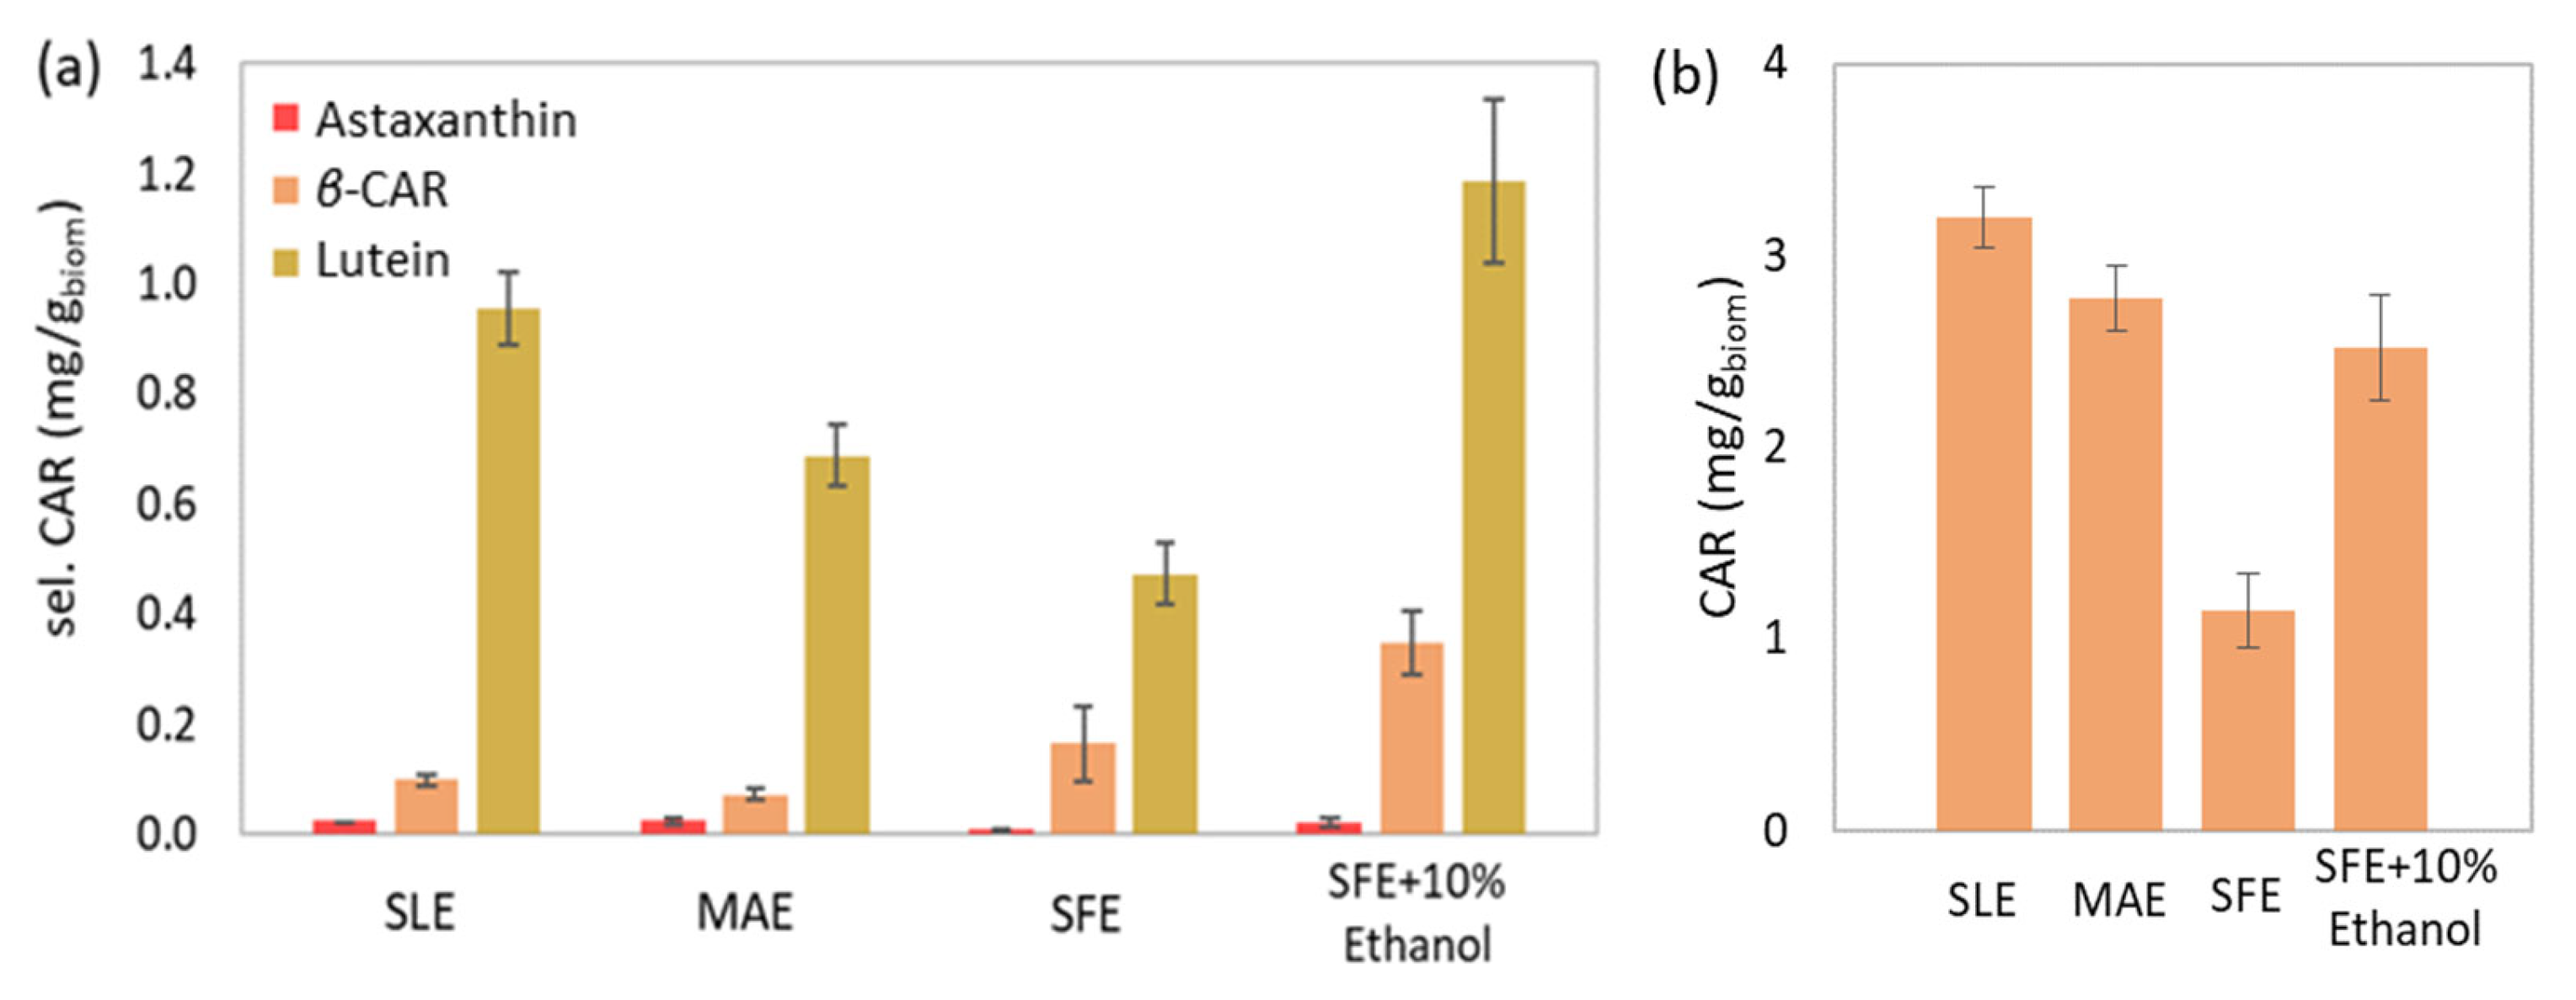
3.3. Comparison of MAE, SLE & SFE

The selected methods of SLE, MAE, SFE and SFE-10% ethanol were examined for comparison purposes. SLE, MAE and SFE were conducted under optimal conditions [25,27], while a typical low cosolvent concentration [68,69] was also examined during SFE-10% ethanol. The extraction conditions of each method are presented in Table 4.
The extraction yield increased in the following order: SFE (3.32% w/w) < SFE-10% ethanol (6.70% w/w) < MAE (11.14% w/w) < SLE (16.77% w/w; Figure 7a). The simple yet protracted process of SLE resulted in the highest extraction efficiency. Thereinafter, MAE resulted in a 34% decreased yield compared to SLE. However, the duration of MAE was almost 104 times shorter than SLE. The application of SFE led to an 80% reduced yield compared to SLE; nevertheless, it was achieved more than seven times faster. Finally, the addition of ethanol during SFE allowed the co-extraction of more polar compounds enhanced SFE and doubled the extraction yield. In conclusion, among all the performed methods, MAE offered the foremost yield in the shortest possible time and with the lowest solvent requirements.
Regarding the phenolic compounds, the use of polar solvents has been reported to favor the extraction of flavonoid glycosides and phenols of high molecular weight, whereas non-polar solvents are considered more effective for phenolic acids, flavonoid aglycons and certain phenolic terpenes [70]. It could be assumed that similar types of phenolic compounds were extracted during SLE (11.02 mgGA/gextr) and MAE (9.34 mgGA/gextr) and that the assistance of the conventional extraction via microwave power led to a comparable recovery in reduced time (Figure 7b). On the other hand, SFE probably extracted other phenolic types of lower polarity and led to a slightly enhanced phenolic content (13.80 mgGA/gextr). Finally, the highest phenolic content was derived from SFE-10% ethanol (17.30 mgGA/gextr), probably due to the recovery of several phenolic types of varying polarities. However, the significant experimental error did not allow for safe conclusions.
The individual and total chlorophyll content presented an increasing trend in the following order: SFE < SLE < MAE < SFE-10% ethanol (Figure 7c). A polar solvent is considered capable of easily dissolving green pigments [71]. Consequently, the chlorophyll content of SLE (46.65 mg/gextr) and MAE (63.36 mg/gextr) emerged higher than the less chlorophyll selective method of SFE (32.88 mg/gextr). Moreover, the presence of ethanol has been proven efficient for the extraction of chlorophylls during SFE by modifying the solvent’s polarity [72]. Therefore, the extract’s chlorophyll content derived from SFE-10% ethanol (86.95 mg/gextr) prevailed over the rest of the extracts.
The total carotenoid content presented an increasing trend with the following order: SLE (19.06 mg/gextr) < MAE (24.88 mg/gextr) < SFE (34.61 mg/gextr) < SFE-10% ethanol (37.60 mg/gextr; Figure 7e). Similarly, the selected carotenoid content followed the same increasing trend (Figure 7d). Carotenoids are non-polar components consisting of non-polar hydrocarbons and more polar xanthophylls [73]. Among the abundance of carotenoids, the hydrocarbon β-carotene, as well as the xanthophylls, lutein, astaxanthin, canthaxanthin, violaxanthin and zeaxanthin have been identified in C. vulgaris biomass [8,74]. Utilizing a polar solvent during conventional SLE favored the extraction of lutein and other more polar carotenoids over the non-polar β-carotene. Providing microwave power through MAE using the same solvent simply enhanced the solubility of more polar carotenoids. Applying SFE with a non-polar solvent increased both hydrocarbons and xanthophylls, while the addition of a polar cosolvent during SFE-10% ethanol enhanced the coextraction of more polar carotenoids (e.g., lutein) and led to the extract with the highest carotenoid content.
Moreover, IC50 presented a decreasing trend with the following order: SLE (43.51 mgextr/mgDPPH) > MAE (40.49 mgextr/mgDPPH) > SFE (23.17 mgextr/mgDPPH) > SFE-10% ethanol (18.66 mgextr/mgDPPH; Figure 7f), which is inversely proportional to antioxidant power. Carotenoids are valuable bioactive components that present a notable antioxidant activity [59]. Moreover, chlorophyll content can positively affect antioxidant power in case of high concentration [61]. Consequently, the chlorophyll and carotenoid richest extract emerging from SFE-10% ethanol presented the strongest antioxidant activity.
Finally, the extracts of SLE and MAE presented a dark green color and a characteristic fishy odor, whereas the dark brown-green extract of SFE-10% ethanol and the dark yellow SFE extract presented no unpleasant smell. The fishy odor of the extract was avoided during SFE due to the abrupt depressurization of CO2 and the subsequent removal of the VOCs, the volatile organic compounds responsible for the odor of microalgae [75].
Additionally, the evaluation of the biocomponent recovery per biomass was attempted for each extraction method. The recovery of carotenoids is presented indicatively in Figure 8, considering their significantly high prices (250–2000 USD/kg) [76]. The SLE presented the highest selected (1.08 mg/gbiom) and total carotenoid (3.20 mg/gbiom) recovery. However, ΜAΕ results (selected: 0.79 and total carotenoids: 2.77 mg/gbiom) rival those of SLE and can support its application against the conventional technique. The rich selected carotenoid content of SFE compensates for the noticeably lower yield (0.65 mg/gbiom); however, this is not the case for total carotenoid content, leading to a significantly lower recovery (1.15 mg/gbiom). Nevertheless, cosolvent addition gives SFE a comparative advantage over the other methods regarding the selected carotenoids (2.52 mg/gbiom) and is considered competitive with the conventional SLE and the proposed MAE referring to total carotenoids (2.52 mg/gbiom).
In conclusion, SLE provided the highest yield yet the most inferior extract in terms of the examined bioactive compounds and antioxidant activity. On the one hand, MAE offered the advantage of a satisfactory yield in an exceptionally reduced extraction time and with lower solvent consumption while providing relatively improved extract quality compared to SLE. On the other hand, SFE presented the lowest extraction yield and selectivity towards chlorophylls, yet a significantly improved extract was obtained in terms of carotenoid content, antioxidant activity and smell. Eventually, the addition of a cosolvent improved the dissolving ability of SC-CO2, therefore, increasing the yield of SFE, the bioactive compound content, and the extract’s antioxidant activity.

4. Conclusions

In the present work, the main parameters of the extraction, i.e., temperature, duration, solvent-to-biomass ratio, and microwave power, were examined during the microwave-assisted extraction of bioactive compounds from C. vulgaris biomass with aq. ethanol 90% v/v. The obtained extracts were subjected to determination of their yield, total phenolic, chlorophyll, and carotenoid content, as well as their antioxidant activity. The correlation between the examined parameters and the determined responses was based on the ANOVA and led to reliable models, except for the total phenolic and selected carotenoid content, which failed to correlate.
The data correlation proved the significance of the individual influence of temperature and solvent-to-biomass ratio, as well as the combined factor of temperature, power, and duration (T P t) on the extraction yield. The solvent-to-biomass ratio highly affected chlorophyll content, while temperature proved to be the most significant factor affecting the extract’s antioxidant activity. Nevertheless, all the responses of phenolic, chlorophyll, carotenoid content, and the extract’s antioxidant activity were significantly affected by the combined factor of temperature and microwave power (T P).
Consequently, MAE was optimized, aiming at the simultaneous maximization of all the correlated responses. The determined optimal extraction conditions of temperature, microwave power, duration, and solvent-to-biomass ratio were 60 °C, 300 watts, 14 min, and 22 mLsolv/gbiom, respectively.
Furthermore, the comparison of MAE with SLE and SFE with and without cosolvent (10% w/w ethanol) also led to important observations. During the use of the same polar solvent, the MAE’s bioactive compounds and extract’s antioxidant activity were slightly improved compared to SLE. Despite the higher SLE yield, the assistance of microwave power offered a satisfactory extraction yield and an improved extract during an extremely shorter amount of time. Alternatively, the application of SFE with a non-polar solvent proved to be of decisive importance for the greater selectivity towards carotenoids over chlorophylls, and the remarkably improved extract’s antioxidant activity, at the expense of extraction yield, which was significantly lower. However, the attempt to address the yield obstacle of SFE through the addition of a polar cosolvent narrowed the gap between MAE and SFE and also led to an overall enhanced extract.
In conclusion, the two non-conventional time-saving methods of MAE and SFE were considered very promising with competitive extracts compared to the conventional SLE. SFE, with or without the cosolvent presence, offered more limited yet more competing extracts than MAE. However, the products of both methods could be exploited in the demanding industry fields of food, cosmetics, fertilizers, animal feed and health products, according to their characteristics and value.

Author Contributions

Conceptualization, K.M.; methodology, I.G. and S.T.; software, I.G.; validation, I.G., S.T., V.L. and K.M.; investigation, I.G.; data curation, I.G., S.T., V.L. and K.M.; writing—original draft preparation, I.G.; writing—review and editing, V.L., K.M.; supervision, K.M.; project administration, K.M. All authors have read and agreed to the published version of the manuscript.

Funding

The implementation of the doctoral thesis of the author Ioulia Georgiopoulou was co-financed by Greece and the European Union (European Social Fund-ESF) through the Operational Programme “Human Resources Development, Education and Lifelong Learning” in the context of the Act “Enhancing Human Resources Research Potential by undertaking a Doctoral Research” Sub-action 2: IKY Scholarship Programme for PhD candidates in the Greek Universities.

Institutional Review Board Statement

Not applicable.

Data Availability Statement

Additional data for this study are not available in any public database. The corresponding author can provide them upon request.

Conflicts of Interest

The authors declare no conflict of interest.

Appendix A

Supplementary Data of Total Chlorophyll and Carotenoid Determination
During pigment measurement, the extract (~5 mg) was dissolved in the aq. acetone, 90% v/v, The equations provided for the determination of total chlorophyll (a, b and c) and carotenoid content [29,30] are presented as follows:
ca = 11.85 Abs664 − 1.54 Abs647 − 0.08 Abs630
cb = 21.03 Abs647 − 5.43 Abs664 − 2.66 Abs630
cc = 24.52 Abs630 − 1.67 Abs664 − 7.60 Abs647
cCHL = ca + cb + cc
cCAR = 7.60 Abs480 − 1.49 Abs510
where ca, cb, cc, cCHL, and cCAR stand for the concentration of chlorophyll a, b, c, total chlorophylls and total carotenoids, respectively (μg/mL).
The known extract concentration dissolved in the aq. acetone, 90% v/v, was used for the expression of total chlorophyll (CHL) and carotenoid (CAR) in the mass ratio of the corresponding compound to extract (mg/gextr).
Moreover, RP-HPLC was performed for the determination of the selected carotenoids of astaxanthin, lutein and β-carotene. The calibration curves of each carotenoid are presented through Equations (A6)–(A8), followed by its coefficient of variation (R2), the limit of detection (LOD) and the limit of quantification (LOQ). Moreover, Equation (A9) determines the concentration of the selected carotenoid content. It is noted that the calibration curves are considered applicable for the specific column and HPLC apparatus used, as well as the time period in which the experimental study was conducted.
Abs450 = 117,582 cβ-CAR − 84,356
R2 = 0.9983
LOD = 0.0561 mg/L
LOQ = 0.1700 mg/L
Abs474 = 222,356 cASTX − 79,159
R2 = 0.9997
LOD = 0.0321 mg/L
LOQ = 0.0971 mg/L
Abs446 = 302,773 cLUT − 65,866
R2 = 0.9999
LOD = 0.0224 mg/L
LOQ = 0.0678 mg/L
csel. CAR = cβ-CAR + cASTX + cLUT
where Abs450, Abs474, and Abs447 stand for the absorbance value at 450, 474 and 447 nm, respectively, and cASXT, cLUT, cβ-CAR, and csel. CAR stand for the concentration of astaxanthin, lutein, β-carotene and selected carotenoid content, respectively (mg/L).
The known extract concentration dissolved in acetone was used for the expression of each carotenoid as well as the selected carotenoid content (sel. CAR) in the mass ratio of the corresponding compound to extract (mg/gextr).

Appendix B

ANOVA Result of RSM Models

B.1. Analysis of Variance
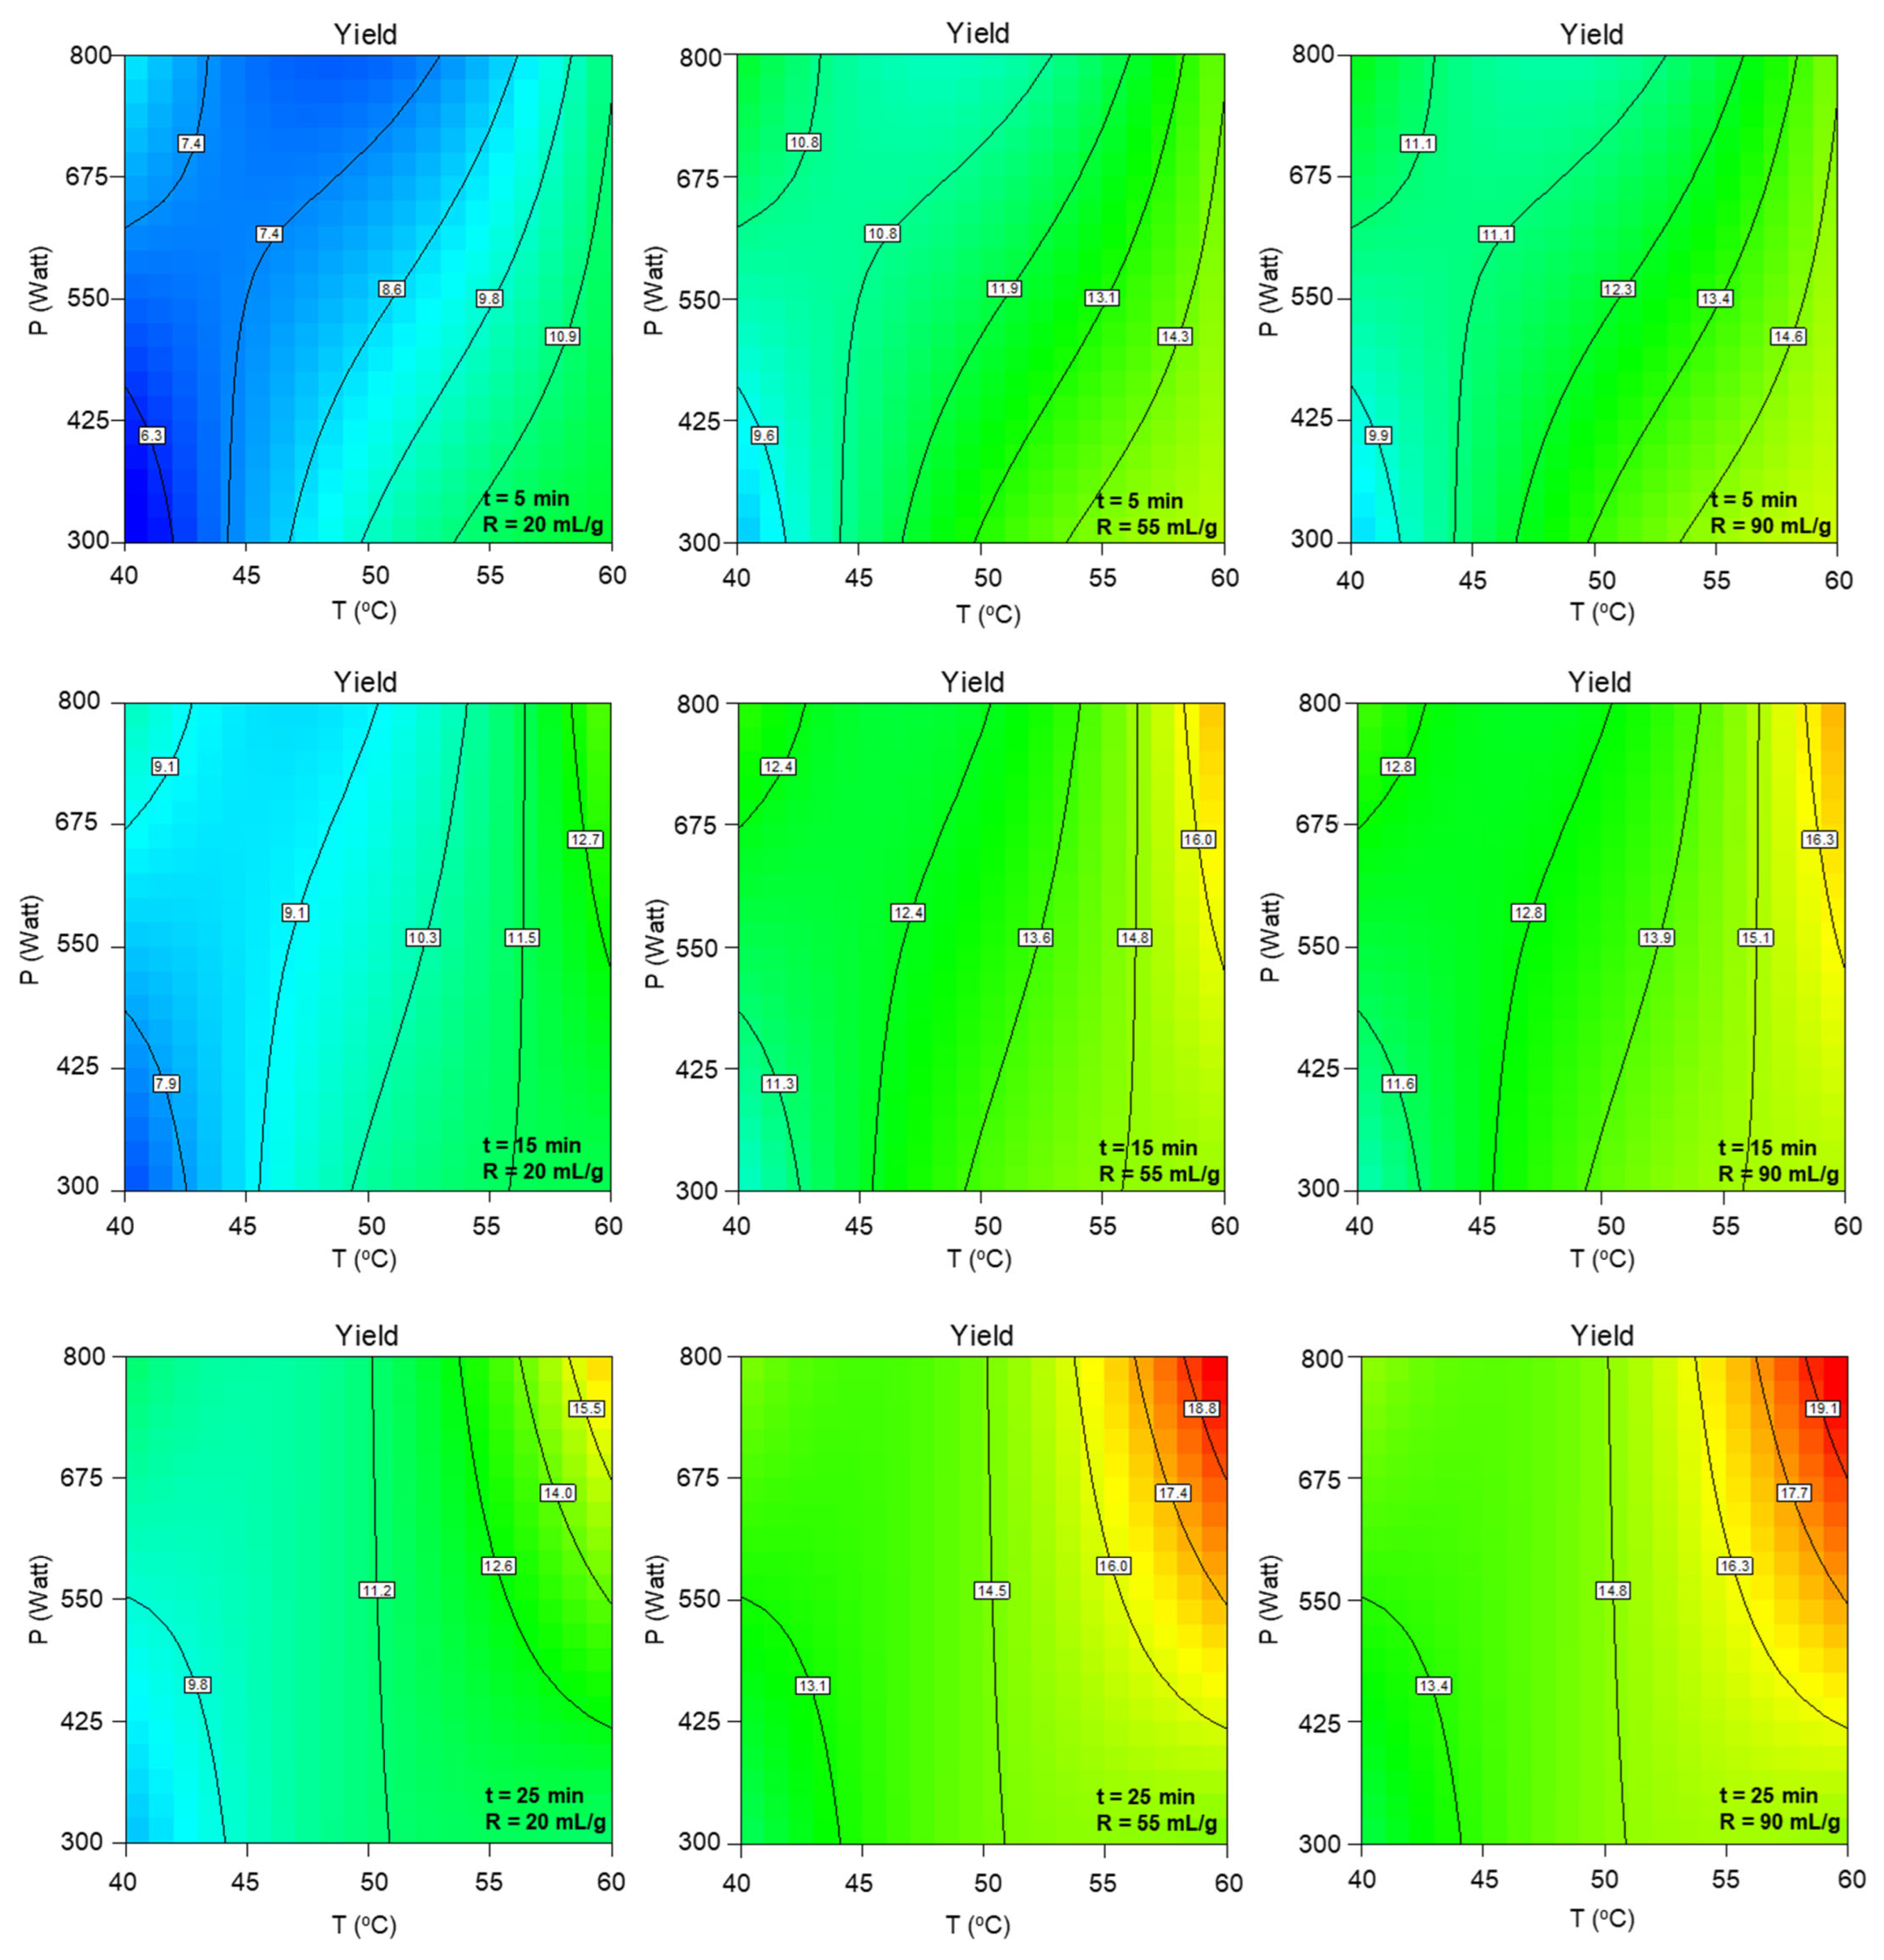
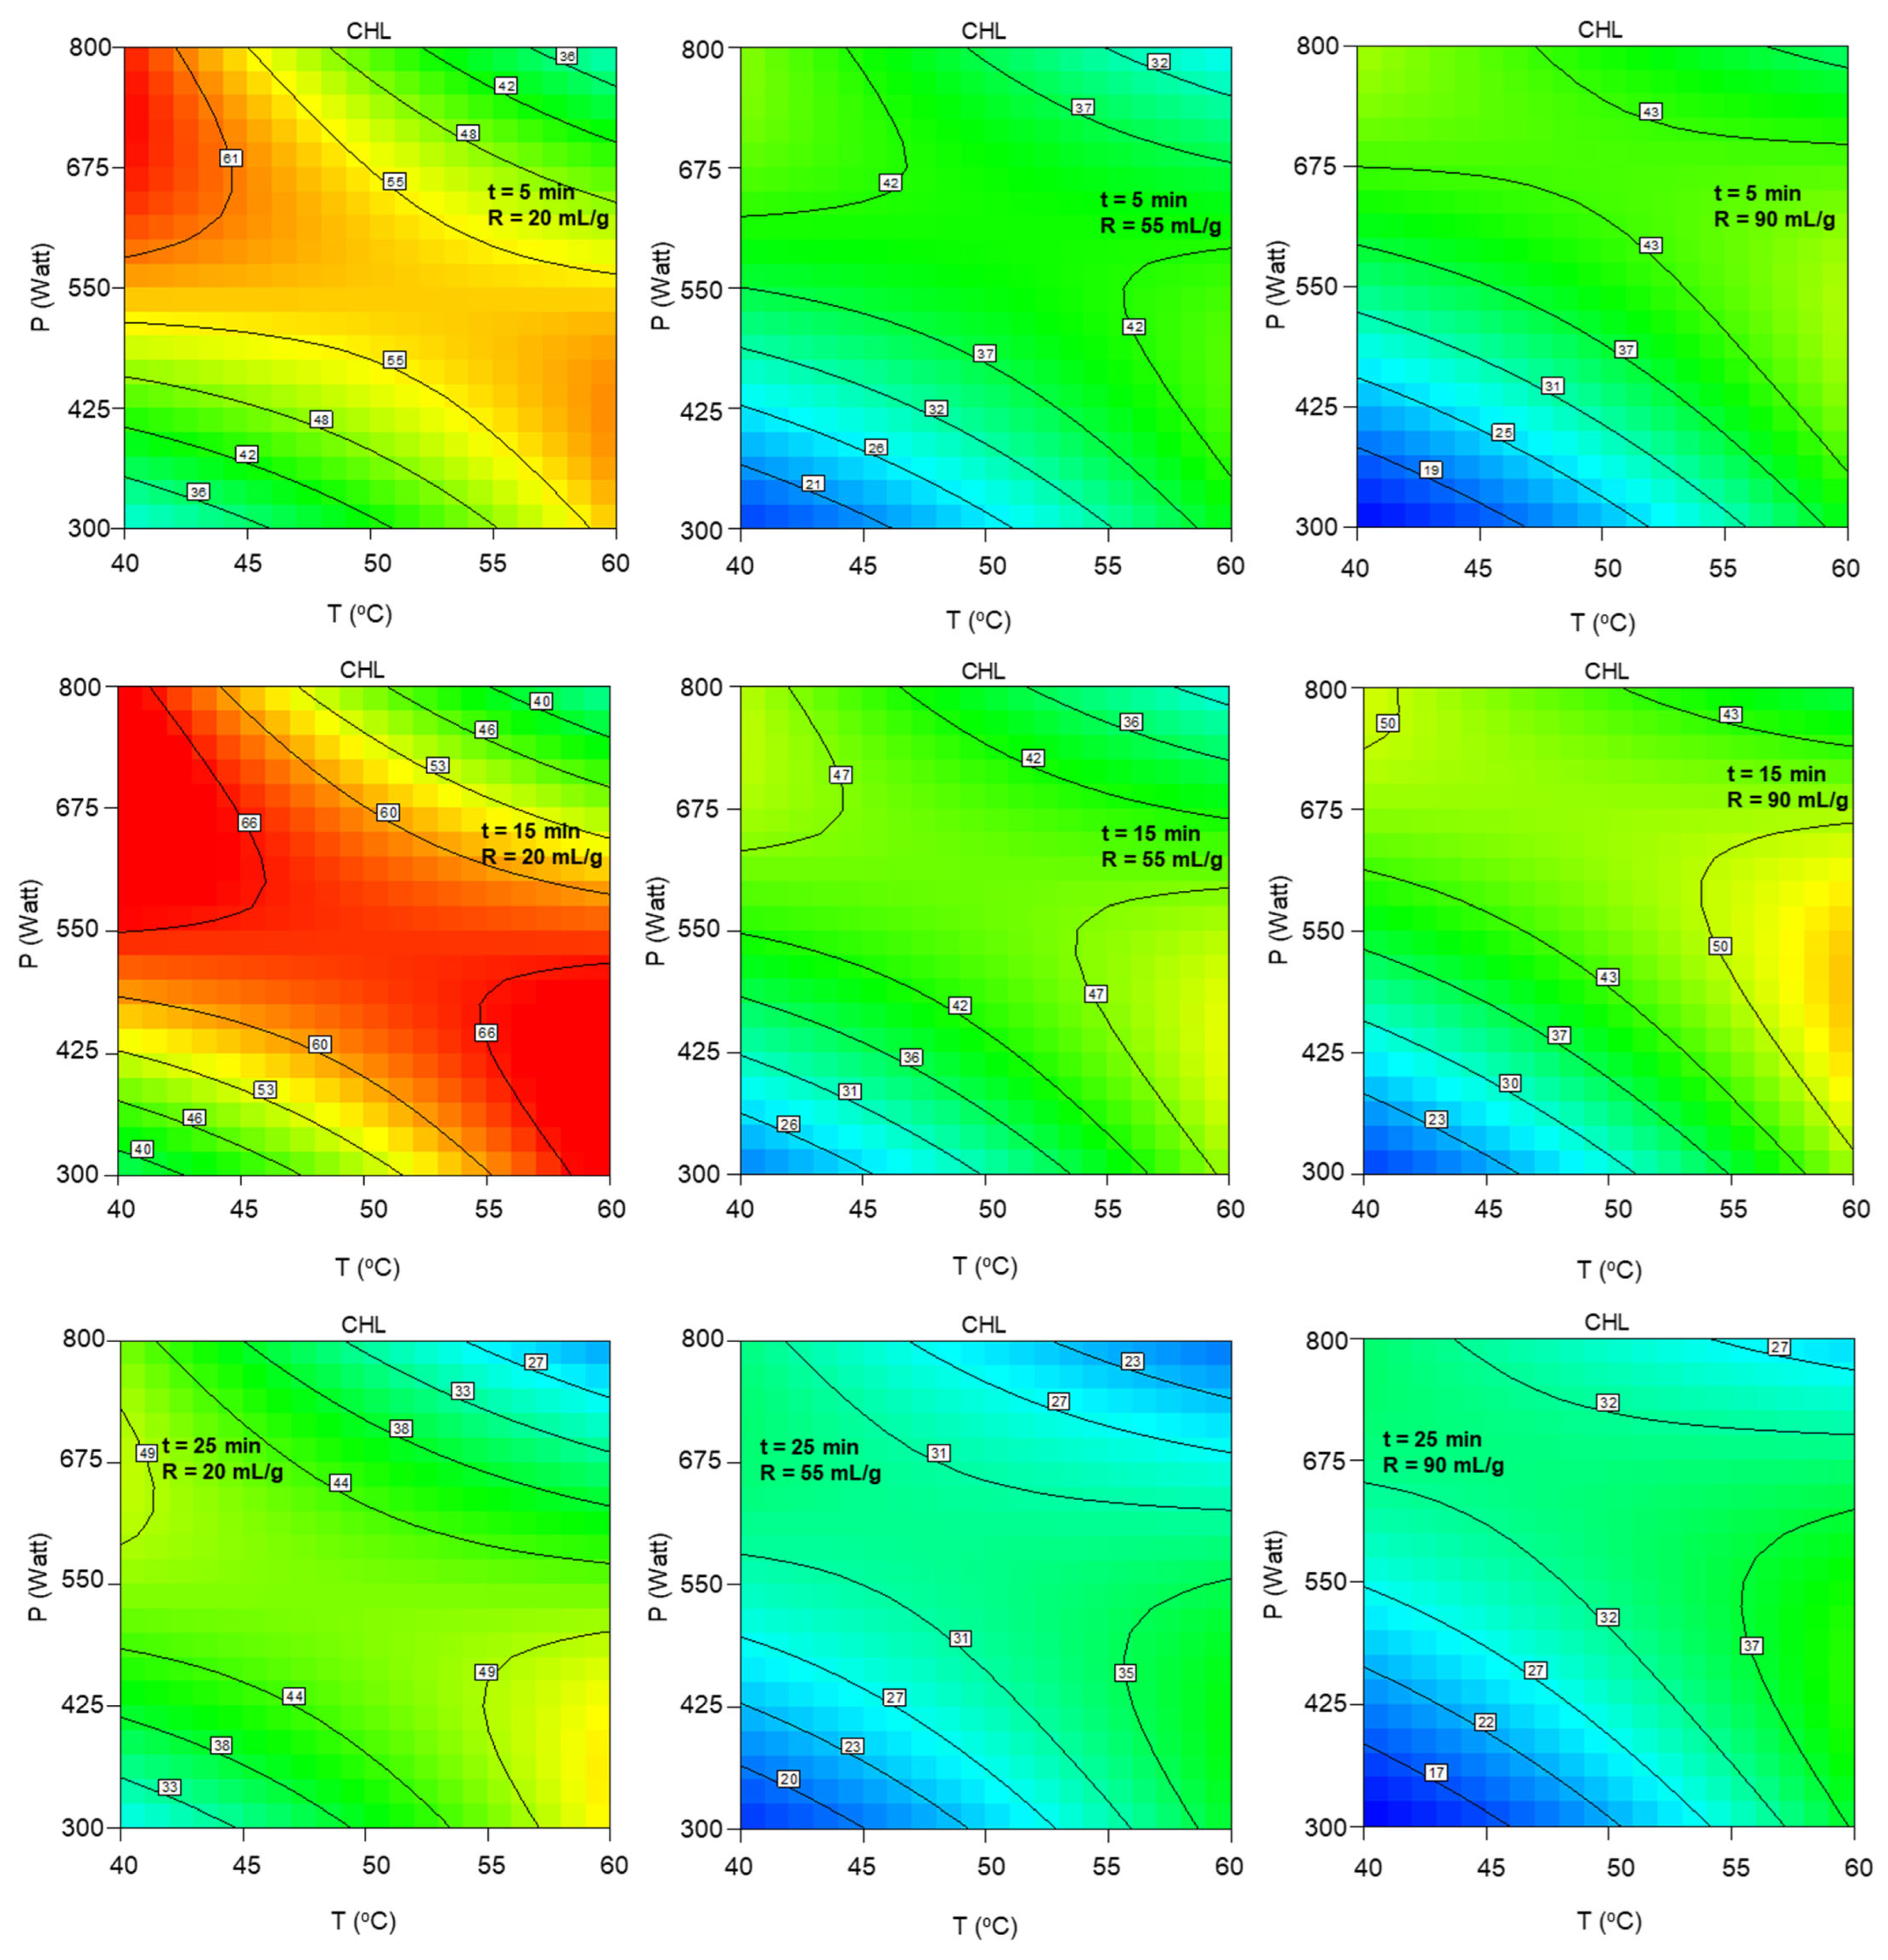
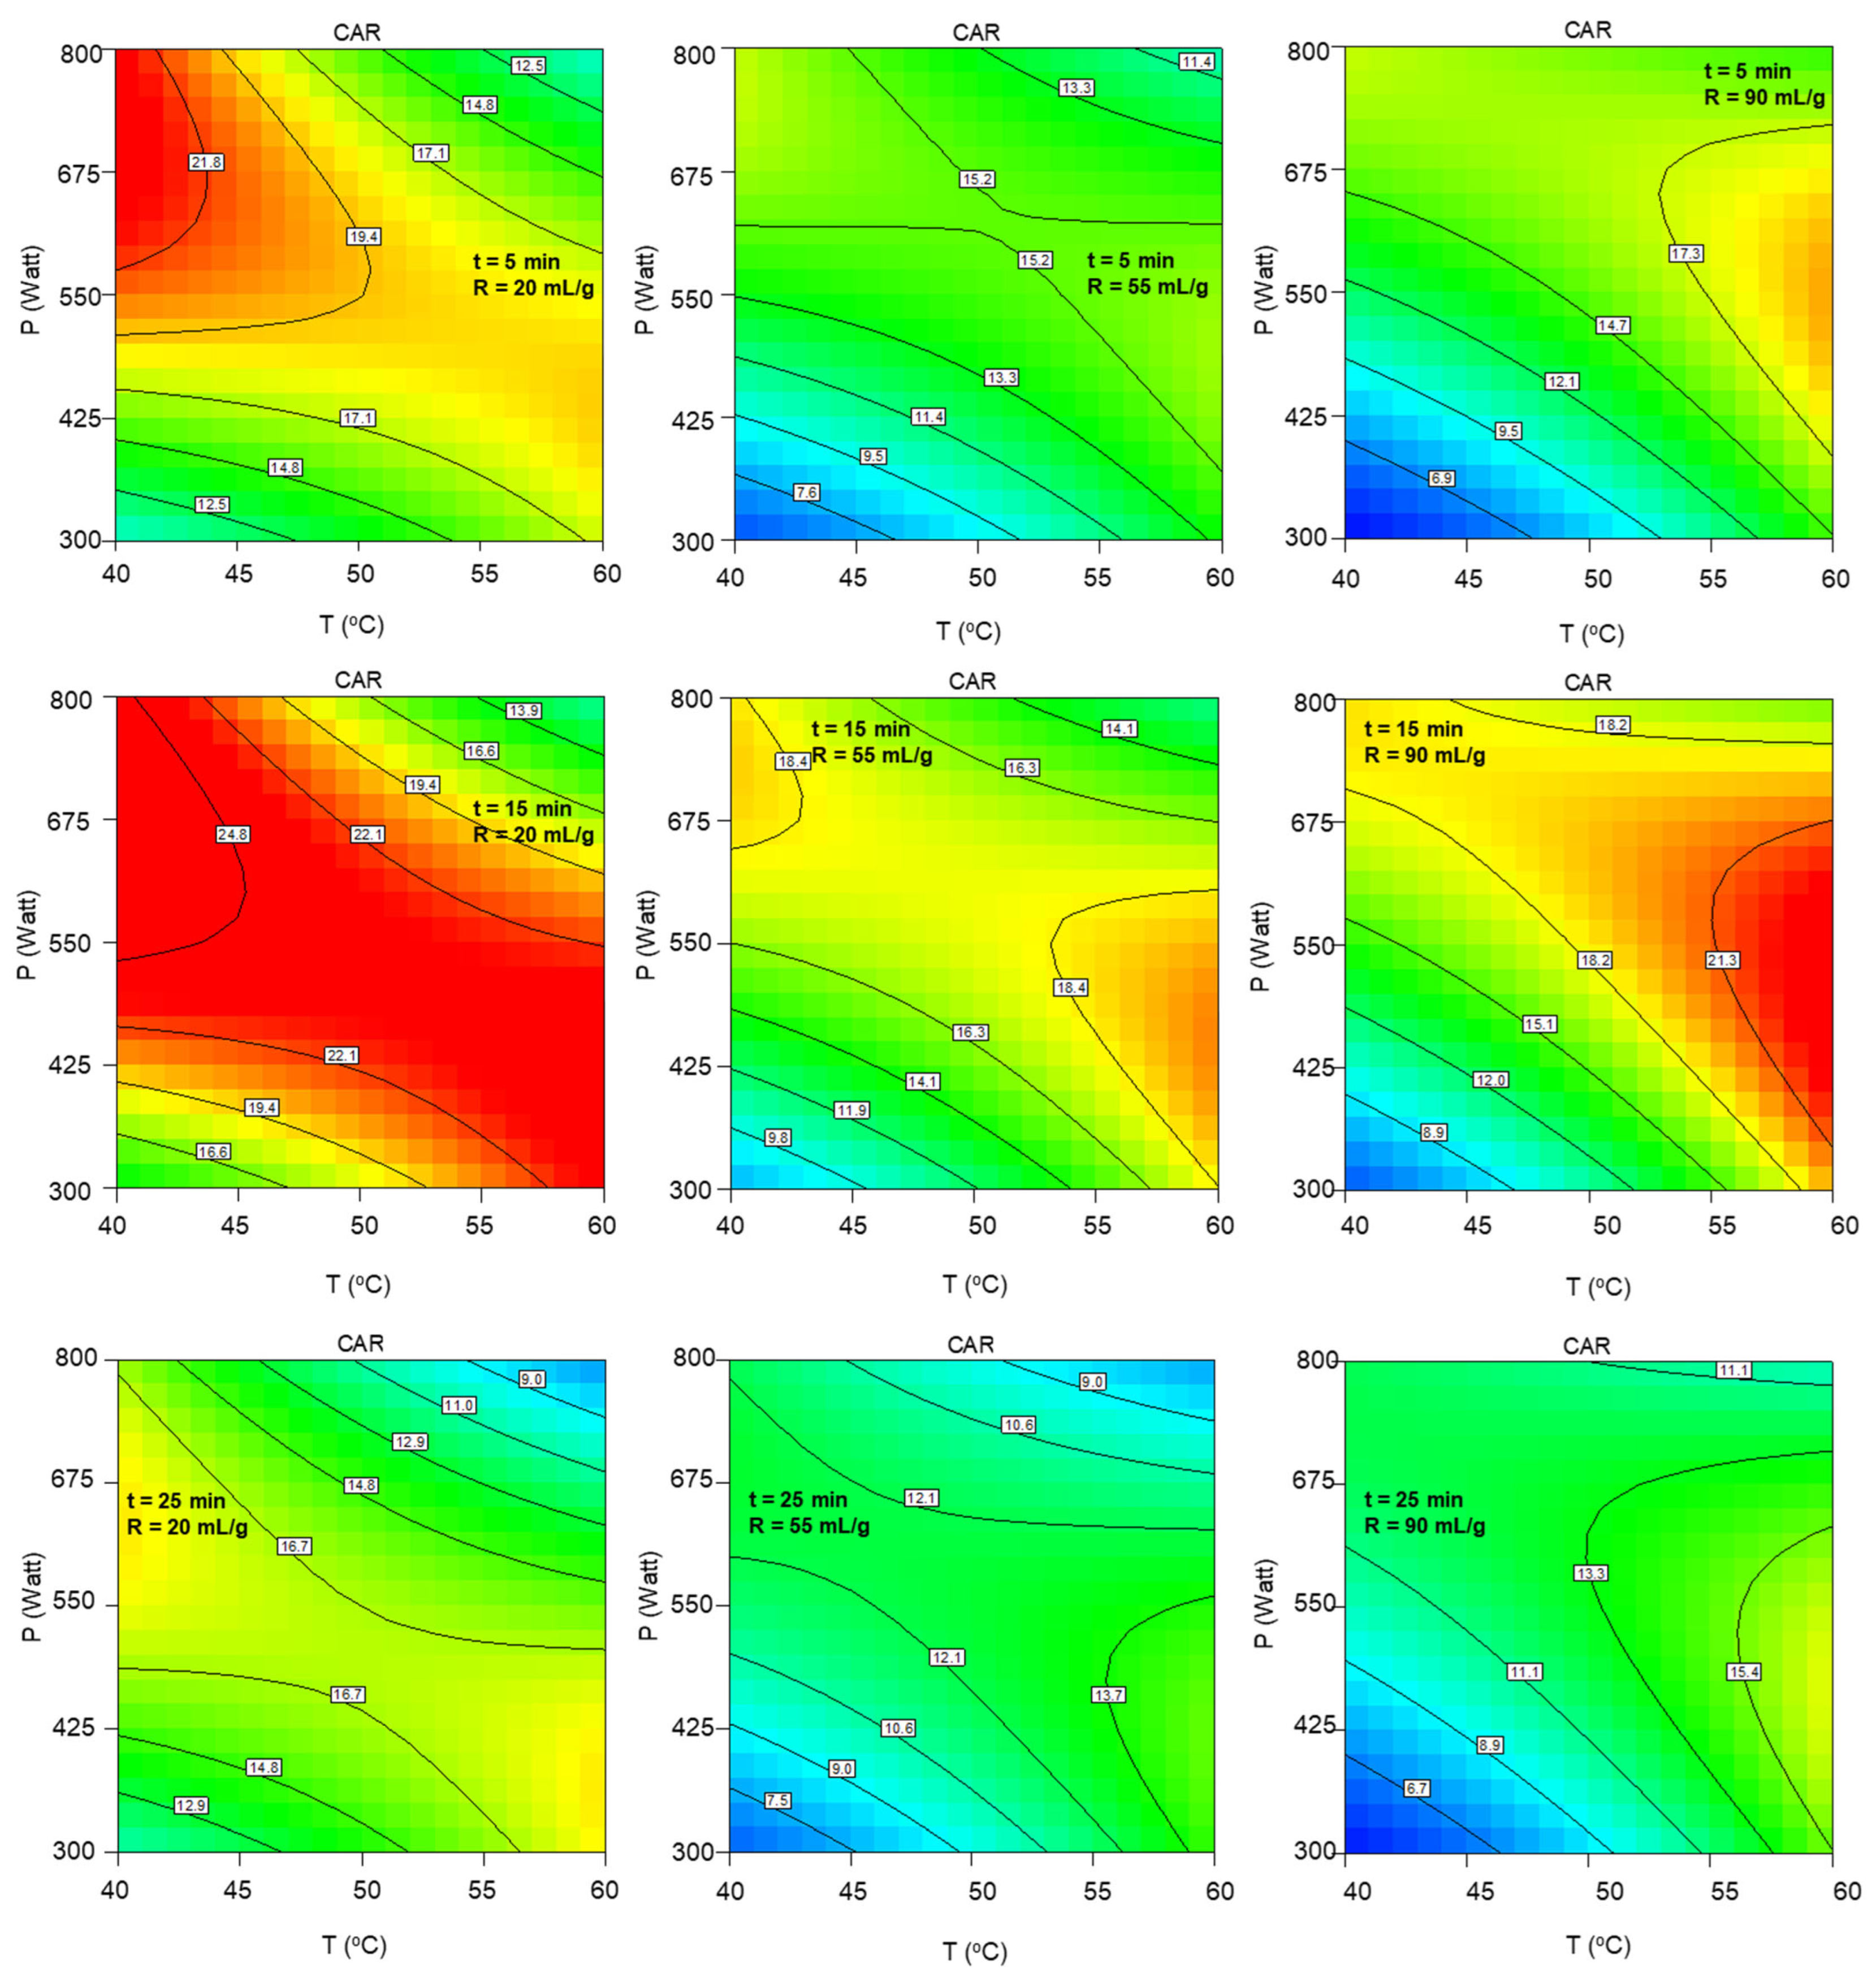
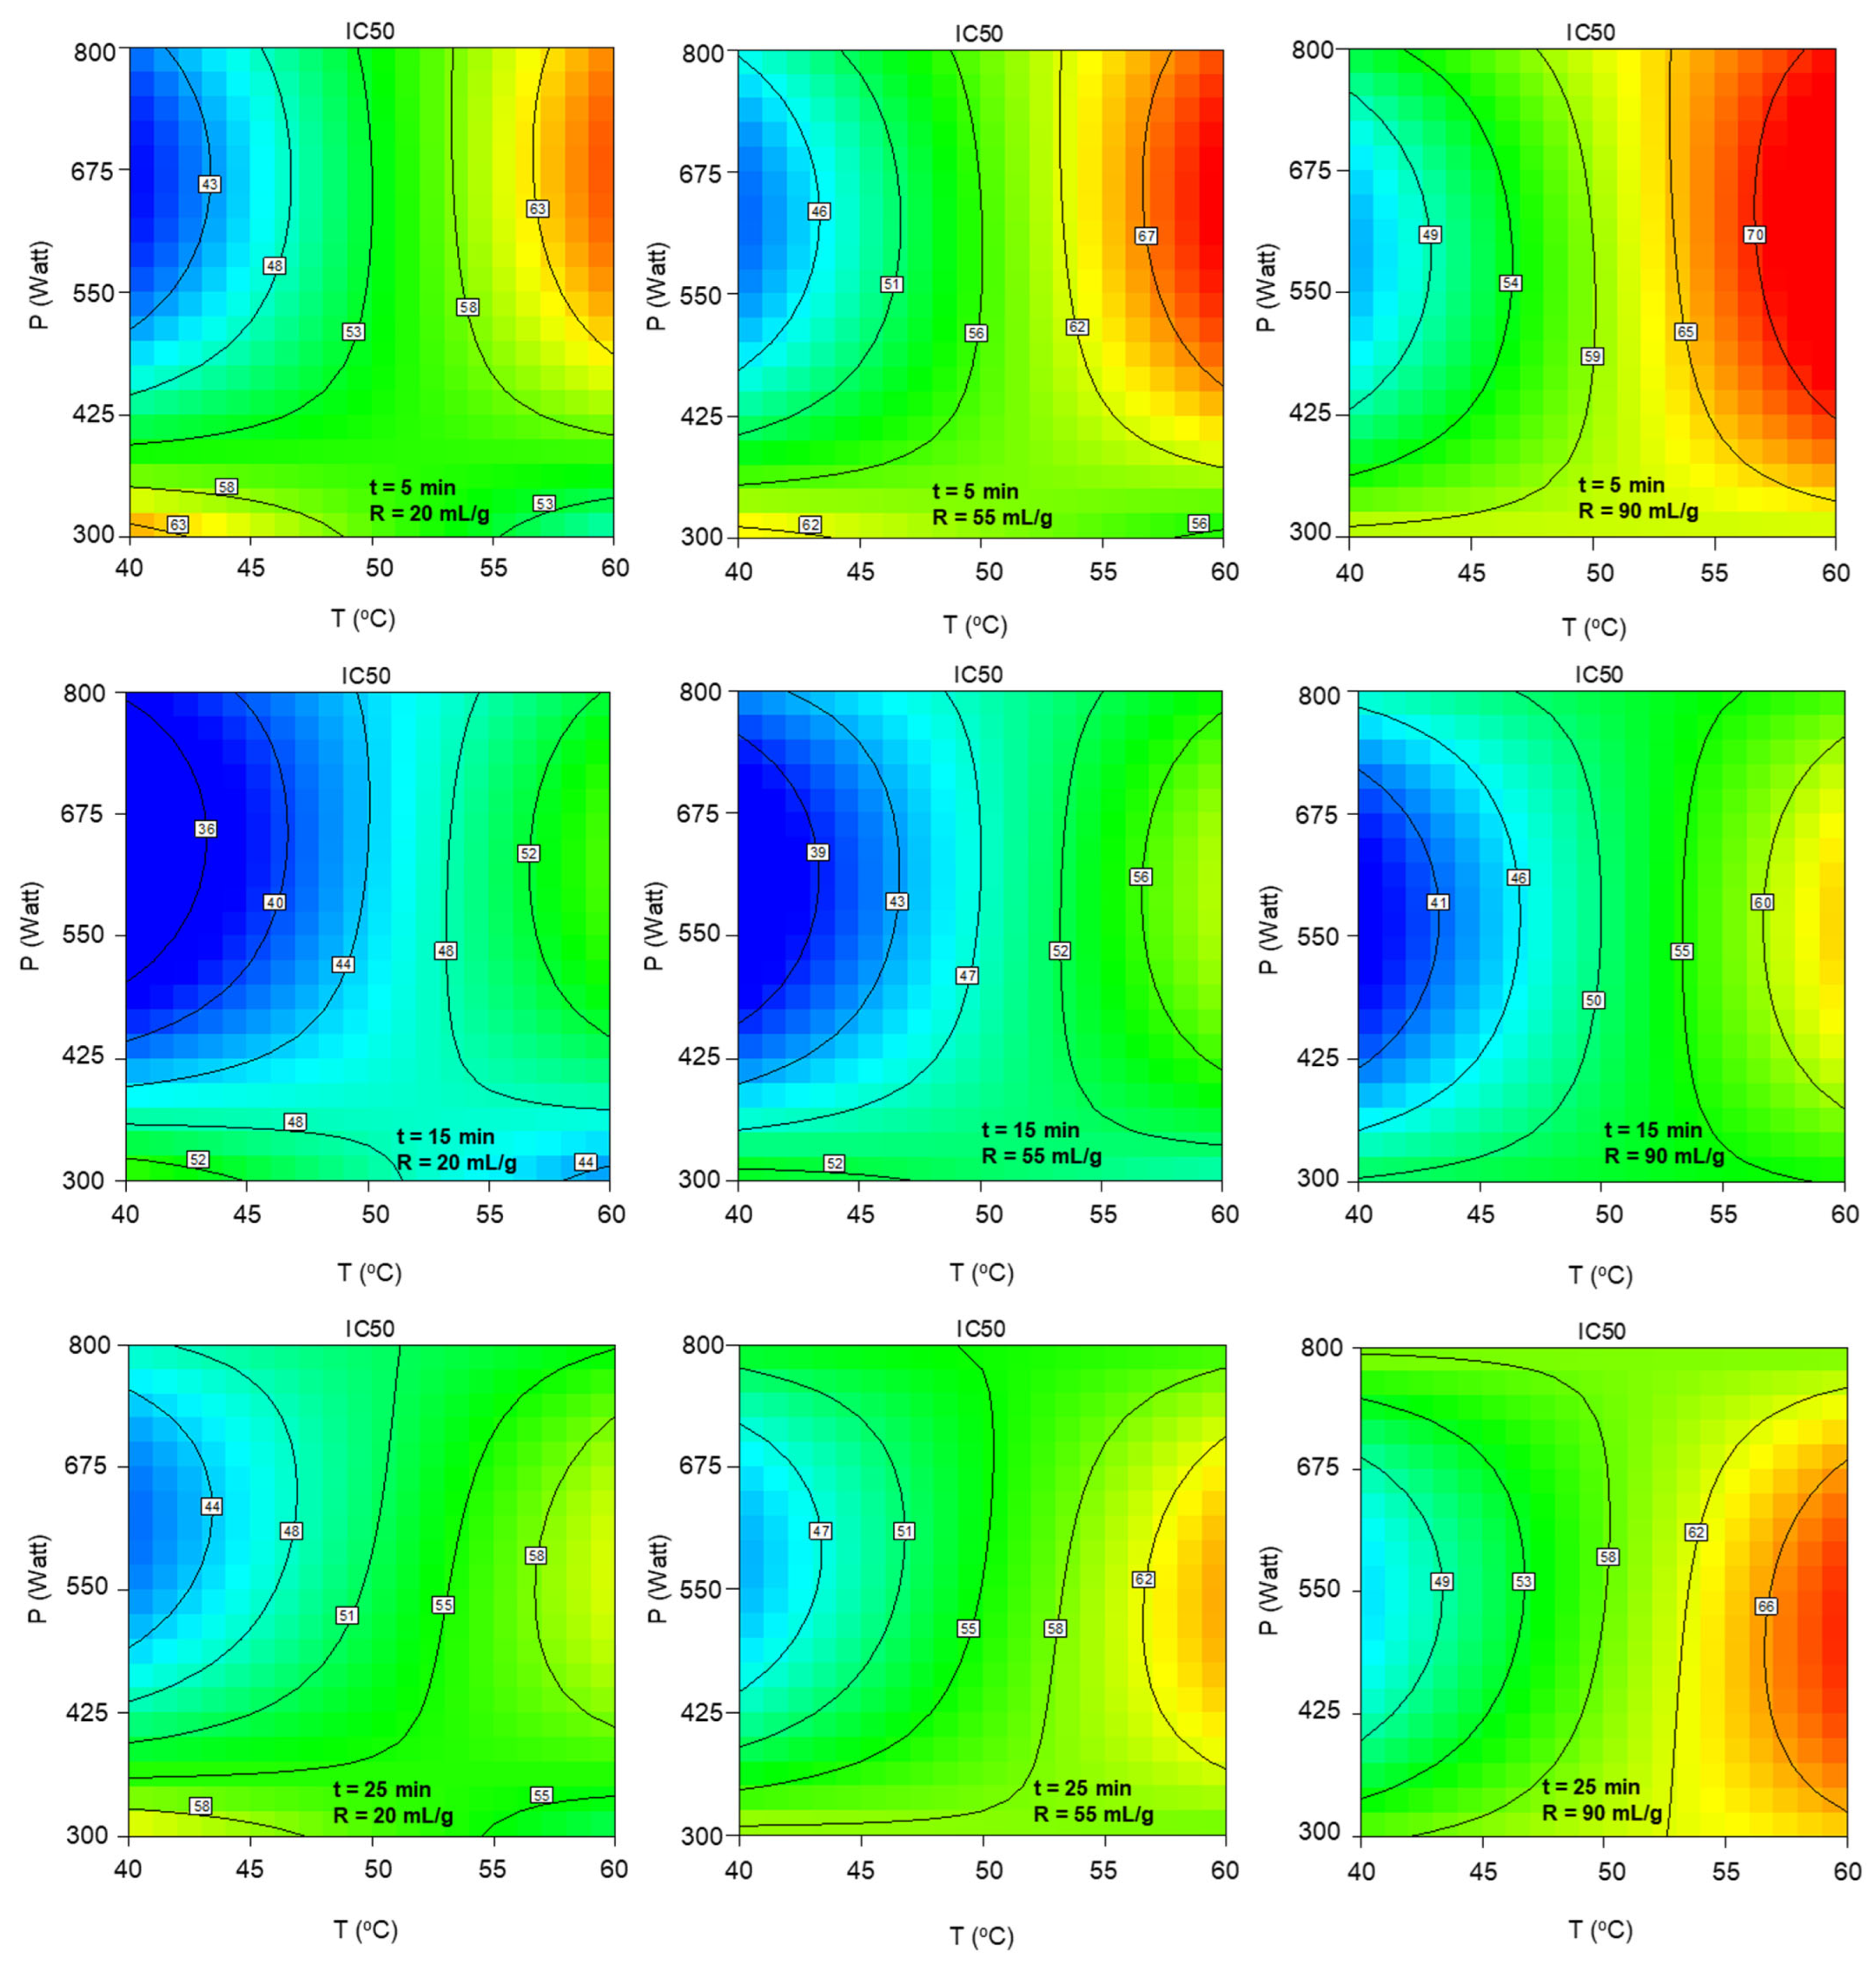
According to Table A1, all the models of yield (Equation (3)), chlorophyll content (Equations (4) and (5)), carotenoid content (Equations (6) and (7)) and IC50 measure of antioxidant activity (Equation (8)) demonstrated low p-values (<0.05) and were considered statistically significant and reliable. Furthermore, the models’ lack of fit presented high p-values (>0.1), which were considered statistically insignificant, indicating that the models satisfyingly fit the experimental data. In addition, the appreciably high values of the coefficient of variation and the satisfactory values of the adjusted coefficient of variation proved the satisfactory correlation as well as the avoidance of overfitting, respectively. Finally, the models’ accuracy was justified by the high values of adequate precision (>4).
The correlation of the extract’s total phenolic content was not accomplished to the desired extent; thus, the corresponding ANOVA results were not included.

B.2. Model Graphs

The evaluation of the predicted model behavior is visualized through the model graphs, which subsequently contribute to MAE’s optimization. The graphic display of each response is presented through the two-dimensional contour plots for the selected factors of extraction temperature and microwave power, including snapshots at the low, central and high levels of extraction duration and solvent-to-biomass ratio (Figure A1, Figure A2, Figure A3 and Figure A4). The value increase of each response is expressed by the color transition from dark blue to green, yellow and, finally, red.
Figure A1 confirms the positive effect of the simultaneous temperature, microwave power, duration, and solvent-to-biomass ratio increase on the extraction yield. The most significant combined term of temperature, microwave power, and duration (T P t), according to Table A1, leads to a remarkable yield elevation with its increase, while the increase of a statistically significant factor of solvent-to-biomass ratio seems to affect the extraction yield up to 55 mLsolv/gbiom.
Table A1. The ANOVA results and statistical measures of models’ adequacy.
YieldChlorophyllsCarotenoidsIC50
Sourcep-Value p-Value p-Value p-Value
Model<0.0001sign.1<0.0001sign.1<0.0001sign.10.0013sign.1
T<0.0001sign.10.0077sign.10.0018sign.10.0019sign.1
P0.4005 0.0026sign.10.0008sign.10.2084
t0.0002sign.10.0025sign.10.0085sign.10.4539
R<0.0001sign.1<0.0001sign.10.0002sign.10.0194
T × P0.3959 <0.0001sign.1<0.0001sign.10.0022sign.1
T × t0.8838 0.2082
T × R 0.0023sign.1<0.0001sign.10.2619
P × t0.0214sign.10.0173sign.10.0018sign.10.5738
P × R 0.0007sign.10.0001sign.10.4118
t × R
T20.2308
P2 0.0011sign.10.0003sign.10.3924
t2 0.0043sign.10.0007sign.10.0070sign.1
R20.0342sign.10.0162sign.10.0262sign.1
T × P × t0.0057sign.1 0.0162sign.1
T × P × R 0.0205sign.1
T2 × P0.0346sign.1
T × W2 0.0102sign.1
Lack of Fit0.3828not sign.20.2323not sign.20.141not sign.20.5726not sign.2
R 2,30.9208 0.9542 0.9637 0.8831
Adj-R 2,4 0.8627 0.9206 0.9371 0.7467
Ad. Prec.519.51 21.21 23.65 10.79
1 statistically significant model term, 2 not significant lack of fit of the model, 3 Coefficient of determination, 4 Adjusted coefficient of determination, 5 Adequate precision.
Figure A1. Contour plots of MAE yield as a function of extraction temperature and microwave power at the low, central and high levels of extraction duration and solvent-to-biomass ratios.
Applsci 13 02740 g0a1
Moreover, Figure A2 illustrates the significant effect of the combined term of temperature and microwave power (T P) on the total chlorophyll content. The improved results are observed diagonally, from moderate to high microwave power values under lower temperatures to higher microwave power under higher temperature values. The solvent-to-biomass ratio increase leads to severe deterioration from 20 to 55 mLsolv/gbiom and imperceptible improvement up to 90 mLsolv/gbiom, while the duration increases up to the central level is considered beneficial.
Figure A2. Contour plots of extract’s total chlorophyll content as a function of extraction temperature and microwave power at the low, central and high levels of extraction duration and solvent-to-biomass ratios.
Applsci 13 02740 g0a2
Similar behavior is depicted in Figure A3 regarding the total carotenoid content. Likewise, carotenoids are increased following the same diagonal while maintaining a low solvent-to-biomass ratio and intermediate extraction duration.
Figure A3. Contour plots of extract’s total carotenoid content as a function of extraction temperature and microwave power at the low, central and high levels of extraction duration and solvent-to-biomass ratios.
Applsci 13 02740 g0a3
Finally, according to Figure A4, significant improvement of the antioxidant activity, i.e., a decrease of IC50, is observed during the midpoint of the extraction duration range, while the solvent-to-biomass ratio reduction offers a positive, yet less strong, contribution. Therefore, while maintaining a medium and a low value of duration and ratio, respectively, stronger antioxidant activity is achieved either under high temperature and low microwave power or under below midpoint temperature and microwave power above 400 watts.
Figure A4. Contour plots of extract’s antioxidant activity indicator, IC50, as a function of extraction temperature and microwave power at the low, central and high levels of extraction duration and solvent-to-biomass ratio.
Applsci 13 02740 g0a4

References

  1. Khaligh, S.F.; Asoodeh, A. Recent advances in the bio-application of microalgae-derived biochemical metabolites and development trends of photobioreactor-based culture systems. 3 Biotech 2022, 12, 260. [Google Scholar] [CrossRef] [PubMed]
  2. Uysal, O.; Uysal, F.O.; Ekinci, K. Determination of fertilizing characteristics of three different microalgae cultivated in raceways in greenhouse conditions could increase soil fertility and product yield. Agron. Ser. Sci. Res. 2016, 59, 15–19. [Google Scholar]
  3. Morais Junior, W.G.J.; Gorgich, M.; Corrêa, P.S.; Martins, A.A.; Mata, T.M.; Caetano, N.S. Microalgae for biotechnological applications: Cultivation, harvesting and biomass processing. Aquaculture 2020, 528, 735562. [Google Scholar] [CrossRef]
  4. Araújo, R.; Vázquez Calderón, F.; Sánchez López, J.; Azevedo, I.C.; Bruhn, A.; Fluch, S.; Garcia Tasende, M.; Ghaderiardakani, F.; Ilmjärv, T.; Laurans, M. Current status of the algae production industry in Europe: An emerging sector of the blue bioeconomy. Front. Mar. Sci. 2021, 7, 626389. [Google Scholar] [CrossRef]
  5. Koyande, A.K.; Chew, K.W.; Rambabu, K.; Tao, Y.; Chu, D.T.; Show, P.L. Microalgae: A potential alternative to health supplementation for humans. Food Sci. Hum. Wellness 2019, 8, 16–24. [Google Scholar] [CrossRef]
  6. Cichoński, J.; Chrzanowski, G. Microalgae as a source of valuable phenolic compounds and carotenoids. Molecules 2022, 27, 8852. [Google Scholar] [CrossRef]
  7. Zakaria, S.M.; Kamal, S.M.M.; Harun, R.; Omar, R.; Siajam, S.I. Characterization on phenolic acids and antioxidant activity of Chlorella sp. microalgae using subcritical water extraction. Sains Malays. 2020, 49, 765–774. [Google Scholar] [CrossRef]
  8. Safi, C.; Zebib, B.; Merah, O.; Pontalier, P.-Y.; Vaca-Garcia, C. Morphology, composition, production, processing and applications of Chlorella vulgaris: A review. Renew. Sustain. Energy Rev. 2014, 35, 265–278. [Google Scholar] [CrossRef] [Green Version]
  9. Ampofo, J.; Abbey, L. Microalgae: Bioactive composition, health benefits, safety and prospects as potential high-value ingredients for the functional food industry. Foods 2022, 11, 1744. [Google Scholar] [CrossRef]
  10. Kapoore, R.V.; Butler, T.O.; Pandhal, J.; Vaidyanathan, S. Microwave-assisted extraction for microalgae: From biofuels to biorefinery. Biology 2018, 7, 18. [Google Scholar] [CrossRef] [Green Version]
  11. Gilbert-López, B.; Barranco, A.; Herrero, M.; Cifuentes, A.; Ibáñez, E. Development of new green processes for the recovery of bioactives from Phaeodactylum tricornutum. Food Res. Int. 2017, 99, 1056–1065. [Google Scholar] [CrossRef] [PubMed] [Green Version]
  12. Eskilsson, C.S.; Björklund, E. Analytical-scale microwave-assisted extraction. J. Chromatogr. A 2000, 902, 227–250. [Google Scholar] [CrossRef]
  13. Bagade, S.B.; Patil, M. Recent advances in microwave assisted extraction of bioactive compounds from complex herbal samples: A review. Crit. Rev. Anal. Chem. 2021, 51, 138–149. [Google Scholar] [CrossRef]
  14. Rehman, M.U.; Khan, F.; Niaz, K. Introduction to natural products analysis. In Recent Advances in Natural Products Analysis; Elsevier: Amsterdam, The Netherlands, 2020; pp. 3–15. [Google Scholar]
  15. Destandau, E.; Michel, T.; Elfakir, C. Microwave-assisted extraction. In Natural Product Extraction: Principles and Applications; Rostagno, M.A., Prado, J.M., Eds.; The Royal Society of Chemistry: London, UK, 2013; Volume 4. [Google Scholar]
  16. Krishnan, S.; Abd Ghani, N.; Aminuddin, N.F.; Quraishi, K.S.; Azman, N.S.; Cravotto, G.; Leveque, J.-M. Microwave-assisted lipid extraction from Chlorella vulgaris in water with 0.5%–2.5% of imidazolium based ionic liquid as additive. Renew. Energy 2020, 149, 244–252. [Google Scholar] [CrossRef]
  17. Moretto, J.A.; de Souza, A.O.; Berneira, L.M.; Brigagão, L.G.G.; de Pereira, C.M.P.; Converti, A.; Pinto, E. Microwave-assisted extraction of fatty acids from cultured and commercial phytoplankton species. Appl. Sci. 2022, 12, 2407. [Google Scholar] [CrossRef]
  18. Pan, J.; Muppaneni, T.; Sun, Y.; Reddy, H.K.; Fu, J.; Lu, X.; Deng, S. Microwave-assisted extraction of lipids from microalgae using an ionic liquid solvent [BMIM][HSO4]. Fuel 2016, 178, 49–55. [Google Scholar] [CrossRef]
  19. Wahidin, S.; Idris, A.; Shaleh, S.M.R. Rapid biodiesel production using wet microalgae via microwave irradiation. Energy Convers. Manag. 2014, 84, 227–233. [Google Scholar] [CrossRef]
  20. Ahmad, N.; Mounsef, J.R.; Lteif, R. A simple and fast experimental protocol for the extraction of xanthophylls from microalga Chlorella luteoviridis. Prep. Biochem. Biotechnol. 2021, 51, 1071–1075. [Google Scholar] [CrossRef]
  21. Leema, J.T.M.; Jothy, T.P.; Dharani, G. Rapid green microwave assisted extraction of lutein from Chlorella sorokiniana (NIOT-2)–Process optimization. Food Chem. 2022, 372, 131151. [Google Scholar] [CrossRef]
  22. Chew, K.W.; Chia, S.R.; Lee, S.Y.; Zhu, L.; Show, P.L. Enhanced microalgal protein extraction and purification using sustainable microwave-assisted multiphase partitioning technique. Chem. Eng. J. 2019, 367, 1–8. [Google Scholar] [CrossRef]
  23. Yu, M.; Chen, M.; Gui, J.; Huang, S.; Liu, Y.; Shentu, H.; He, J.; Fang, Z.; Wang, W.; Zhang, Y. Preparation of Chlorella vulgaris polysaccharides and their antioxidant activity in vitro and in vivo. Int. J. Biol. Macromol. 2019, 137, 139–150. [Google Scholar] [CrossRef]
  24. Cha, K.H.; Lee, H.J.; Koo, S.Y.; Song, D.-G.; Lee, D.-U.; Pan, C.-H. Optimization of pressurized liquid extraction of carotenoids and chlorophylls from Chlorella vulgaris. J. Agric. Food Chem. 2010, 58, 793–797. [Google Scholar] [CrossRef] [PubMed]
  25. Georgiopoulou, I.; Tzima, S.; Pappa, G.D.; Louli, V.; Voutsas, E.; Magoulas, K. Experimental design and optimization of recovering bioactive compounds from Chlorella vulgaris through conventional extraction. Molecules 2021, 27, 29. [Google Scholar] [CrossRef] [PubMed]
  26. Papamichail, I.; Louli, V.; Magoulas, K. Supercritical fluid extraction of celery seed oil. J. Supercrit. Fluids 2000, 18, 213–226. [Google Scholar] [CrossRef]
  27. Georgiopoulou, I.; Tzima, S.; Louli, V.; Magoulas, K. Supercritical CO2 extraction of high-added value compounds from Chlorella vulgaris: Experimental design, modelling and optimization. Molecules 2022, 27, 5884. [Google Scholar] [CrossRef]
  28. Drosou, C.; Kyriakopoulou, K.; Bimpilas, A.; Tsimogiannis, D.; Krokida, M. A comparative study on different extraction techniques to recover red grape pomace polyphenols from vinification byproducts. Ind. Crops Prod. 2015, 75, 141–149. [Google Scholar] [CrossRef]
  29. Jeffrey, S.W.; Humphrey, G.F. New spectrophotometric equations for determining chlorophylls a, b, c1 and c2 in higher plants, algae and natural phytoplankton. Biochem. Physiol. Pflanz. 1975, 167, 191–194. [Google Scholar] [CrossRef]
  30. Jeffrey, S.W.; Mantoura, R.F.C.; Wright, S.W. Phytoplankton Pigments in Oceanography: Monographs on Oceanographic Methodology; United Nations Educational, Scientific and Cultural Organizations: Paris, France, 1997. [Google Scholar]
  31. Laina, K.M.; Eleni, P.N.; Tsitseli, K.G.; Krokida, M.K. Process design for the extraction of bioactive compounds from several mediterranean medicinal plants. Chem. Eng. Trans. 2021, 86, 1327–1332. [Google Scholar] [CrossRef]
  32. Stramarkou, M.; Papadaki, S.; Kyriakopoulou, K.; Krokida, M. Effect of drying and extraction conditions on the recovery of bioactive compounds from Chlorella vulgaris. J. Appl. Phycol. 2017, 29, 2947–2960. [Google Scholar] [CrossRef]
  33. Montgomery, D.C. Design and Analysis of Experiments, 7th ed.; John Wiley & Sons: Hoboken, NJ, USA, 2017. [Google Scholar]
  34. Benmoussa, H.; Béchohra, I.; He, S.; Elfalleh, W.; Chawech, R. Optimization of sonohydrodistillation and microwave assisted hydrodistillation by response surface methodology for extraction of essential oils from Cinnamomum cassia barks. Ind. Crops Prod. 2023, 192, 115995. [Google Scholar] [CrossRef]
  35. Miyazawa, T.; Nakagawa, K.; Kimura, F.; Nakashima, Y.; Maruyama, I.; Higuchi, O.; Miyazawa, T. Chlorella is an effective dietary source of lutein for human erythrocytes. J. Oleo Sci. 2013, 62, 773–779. [Google Scholar] [CrossRef] [Green Version]
  36. Kitada, K.; Machmudah, S.; Sasaki, M.; Goto, M.; Nakashima, Y.; Kumamoto, S.; Hasegawa, T. Supercritical CO2 extraction of pigment components with pharmaceutical importance from Chlorella vulgaris. J. Chem. Technol. Biotechnol. Int. Res. Process Environ. Clean Technol. 2009, 84, 657–661. [Google Scholar] [CrossRef]
  37. Li, H.-B.; Jiang, Y.; Chen, F. Isolation and purification of lutein from the microalga Chlorella vulgaris by extraction after saponification. J. Agric. Food Chem. 2002, 50, 1070–1072. [Google Scholar] [CrossRef]
  38. Ruen-ngam, D.; Shotipruk, A.; Pavasant, P.; Machmudah, S.; Goto, M. Selective extraction of lutein from alcohol treated Chlorella vulgaris by supercritical CO2. Chem. Eng. Technol. 2012, 35, 255–260. [Google Scholar] [CrossRef]
  39. Goto, M.; Kanda, H.; Machmudah, S. Extraction of carotenoids and lipids from algae by supercritical CO2 and subcritical dimethyl ether. J. Supercrit. Fluids 2015, 96, 245–251. [Google Scholar] [CrossRef] [Green Version]
  40. Kowallik, W.; Schürmann, R. Chlorophyll a/chlorophyll b ratios of Chlorella vulgaris in blue or red light. In Blue Light Effects in Biological Systems; Springer: Berlin/Heidelberg, Germany, 1984; pp. 352–358. [Google Scholar]
  41. Marambio, J.; Rodriguez, J.P.; Mendez, F.; Ocaranza, P.; Rosenfeld, S.; Ojeda, J.; Rautenberger, R.; Bischof, K.; Terrados, J.; Mansilla, A. Photosynthetic performance and pigment composition of Macrocystis pyrifera (Laminariales, Phaeophyceae) along a gradient of depth and seasonality in the ecoregion of Magellan, Chile. J. Appl. Phycol. 2017, 29, 2575–2585. [Google Scholar] [CrossRef]
  42. Soroush, D.R.; Solaimanimehr, S.; Azizkhani, M.; Kenari, R.E.; Dehghan, B.; Mohammadi, G.; Sadeghi, E. Optimization of microwave-assisted solvent extraction of hemp (Cannabis sativa L.) seed oil using RSM: Evaluation of oil quality. J. Food Meas. Charact. 2021, 15, 5191–5202. [Google Scholar] [CrossRef]
  43. Lovrić, V.; Putnik, P.; Bursać Kovačević, D.; Jukić, M.; Dragović-Uzelac, V. Effect of microwave-assisted extraction on the phenolic compounds and antioxidant capacity of blackthorn flowers. Food Technol. Biotechnol. 2017, 55, 243–250. [Google Scholar] [CrossRef]
  44. Pasquet, V.; Chérouvrier, J.-R.; Farhat, F.; Thiéry, V.; Piot, J.-M.; Bérard, J.-B.; Kaas, R.; Serive, B.; Patrice, T.; Cadoret, J.-P. Study on the microalgal pigments extraction process: Performance of microwave assisted extraction. Process Biochem. 2011, 46, 59–67. [Google Scholar] [CrossRef] [Green Version]
  45. Esquivel-Hernández, D.A.; Rodríguez-Rodríguez, J.; Rostro-Alanis, M.; Cuéllar-Bermúdez, S.P.; Mancera-Andrade, E.I.; Núñez-Echevarría, J.E.; García-Pérez, J.S.; Chandra, R.; Parra-Saldívar, R. Advancement of green process through microwave-assisted extraction of bioactive metabolites from Arthrospira Platensis and bioactivity evaluation. Bioresour. Technol. 2017, 224, 618–629. [Google Scholar] [CrossRef]
  46. Nguyen, N.H.K.; An, N.T.D.; Anh, P.K.; Truc, T.T. Microwave-assisted extraction of chlorophyll and polyphenol with antioxidant activity from Pandanus amaryllifolius Roxb. in Vietnam. In Proceedings of the IOP Conference Series: Materials Science and Engineering, Coimbatore, India, 8–9 April 2021; Volume 1166, p. 012039. [Google Scholar] [CrossRef]
  47. Yan, M.-M.; Liu, W.; Fu, Y.-J.; Zu, Y.-G.; Chen, C.-Y.; Luo, M. Optimisation of the microwave-assisted extraction process for four main. Food Chem. 2009, 119, 1663–1670. [Google Scholar] [CrossRef]
  48. Gao, M.; Song, B.-Z.; Liu, C.-Z. Dynamic microwave-assisted extraction of flavonoids from Saussurea medusa Maxim cultured cells. Biochem. Eng. J. 2006, 32, 79–83. [Google Scholar] [CrossRef]
  49. Xu, W.; Chu, K.; Li, H.; Zhang, Y.; Zheng, H.; Chen, R.; Chen, L. Ionic liquid-based microwave-assisted extraction of flavonoids from Bauhinia championii (Benth.) Benth. Molecules 2012, 17, 14323–14335. [Google Scholar] [CrossRef] [PubMed] [Green Version]
  50. Kaderides, K.; Papaoikonomou, L.; Serafim, M.; Goula, A.M. Microwave-assisted extraction of phenolics from pomegranate peels: Optimization, kinetics, and comparison with ultrasounds extraction. Chem. Eng. Process. Process Intensif. 2019, 137, 1–11. [Google Scholar] [CrossRef]
  51. Zheng, X.; Xu, X.; Liu, C.; Sun, Y.; Lin, Z.; Liu, H. Extraction characteristics and optimal parameters of anthocyanin from blueberry powder under microwave-assisted extraction conditions. Sep. Purif. Technol. 2013, 104, 17–25. [Google Scholar] [CrossRef]
  52. Xiao, W.; Han, L.; Shi, B. Microwave-assisted extraction of flavonoids from Radix Astragali. Sep. Purif. Technol. 2008, 62, 614–618. [Google Scholar] [CrossRef]
  53. Luo, M.; Zhou, D.-D.; Shang, A.; Gan, R.-Y.; Li, H.-B. Influences of microwave-assisted extraction parameters on antioxidant activity of the extract from Akebia trifoliata peels. Foods 2021, 10, 1432. [Google Scholar] [CrossRef]
  54. Radojković, M.; Zeković, Z.; Jokić, S.; Vidović, S.; Lepojević, Ž.; Milošević, S. Optimization of sSolid-Liquid Extraction of Antioxidants from Black Mulberry Leaves by Response Surface Methodology. Food Technol. Biotechnol. 2012, 50, 167–176. Available online: https://link.gale.com/apps/doc/A299258662/AONE?u=anon~e39d7148&sid=googleScholar&xid=a817b58e (accessed on 16 February 2023).
  55. Kim, W.-K.; Chae, H.-J.; Kim, J.-H. Microwave-assisted extraction of homoharringtonine from Cephalotaxus koreana. Biotechnol. Bioprocess Eng. 2010, 15, 481–487. [Google Scholar] [CrossRef]
  56. Xiao, W.; Han, L.; Shi, B. Optimization of microwave-assisted extraction of flavonoid from Radix Astragali using response surface methodology. Sep. Sci. Technol. 2008, 43, 671–681. [Google Scholar] [CrossRef]
  57. Camel, V. Microwave-assisted solvent extraction of environmental samples. TrAC Trends Anal. Chem. 2000, 19, 229–248. [Google Scholar] [CrossRef]
  58. Pan, X.; Liu, H.; Jia, G.; Shu, Y.Y. Microwave-assisted extraction of glycyrrhizic acid from licorice root. Biochem. Eng. J. 2000, 5, 173–177. [Google Scholar] [CrossRef]
  59. Wang, M.; Tsao, R.; Zhang, S.; Dong, Z.; Yang, R.; Gong, J.; Pei, Y. Antioxidant activity, mutagenicity/anti-mutagenicity, and clastogenicity/anti-clastogenicity of lutein from marigold flowers. Food Chem. Toxicol. 2006, 44, 1522–1529. [Google Scholar] [CrossRef]
  60. Fratianni, A.; Cinquanta, L.; Panfili, G. Degradation of carotenoids in orange juice during microwave heating. LWT Food Sci. Technol. 2010, 43, 867–871. [Google Scholar] [CrossRef]
  61. Marquez, U.M.L.; Barros, R.M.C.; Sinnecker, P. Antioxidant activity of chlorophylls and their derivatives. Food Res. Intern. 2005, 38, 885–891. [Google Scholar] [CrossRef]
  62. Xu, D.-P.; Zheng, J.; Zhou, Y.; Li, Y.; Li, S.; Li, H.-B. Ultrasound-assisted extraction of natural antioxidants from the flower of Limonium sinuatum: Optimization and comparison with conventional methods. Food Chem. 2017, 217, 552–559. [Google Scholar] [CrossRef]
  63. Shang, A.; Luo, M.; Gan, R.-Y.; Xu, X.-Y.; Xia, Y.; Guo, H.; Liu, Y.; Li, H.-B. Effects of microwave-assisted extraction conditions on antioxidant capacity of sweet tea (Lithocarpus polystachyus Rehd.). Antioxidants 2020, 9, 678. [Google Scholar] [CrossRef]
  64. Bachtler, S.; Bart, H.-J. Increase the yield of bioactive compounds from elder bark and annatto seeds using ultrasound and microwave assisted extraction technologies. Food Bioprod. Process. 2021, 125, 1–13. [Google Scholar] [CrossRef]
  65. Dobrinčić, A.; Balbino, S.; Zorić, Z.; Pedisić, S.; Bursać Kovačević, D.; Elez Garofulić, I.; Dragović-Uzelac, V. Advanced technologies for the extraction of marine brown algal polysaccharides. Mar. Drugs 2020, 18, 168. [Google Scholar] [CrossRef] [Green Version]
  66. Aronhime, S.; Calcagno, C.; Jajamovich, G.H.; Dyvorne, H.A.; Robson, P.; Dieterich, D.; Fiel, M.I.; Martel-Laferriere, V.; Chatterji, M.; Rusinek, H.; et al. DCE-MRI of the liver: Effect of linear and nonlinear conversions on hepatic perfusion quantification and reproducibility. J. Magn. Reson. Imaging 2014, 40, 90–98. [Google Scholar] [CrossRef] [Green Version]
  67. Couto, M.F.; Peternelli, L.A.; Barbosa, M.H.P. Classification of the coefficients of variation for sugarcane crops. Ciência Rural 2013, 43, 957–961. [Google Scholar] [CrossRef] [Green Version]
  68. Perez-Vega, S.; Salmeron, I.; Perez-Reyes, I.; Kwofie, E.; Ngadi, M. Influence of the supercritical fluid extraction (SFE) on food bioactives. In Retention of Bioactives in Food Processing; Springer: Berlin/Heidelberg, Germany, 2022; pp. 309–340. [Google Scholar]
  69. Yen, H.-W.; Yang, S.-C.; Chen, C.-H.; Chang, J.-S. Supercritical fluid extraction of valuable compounds from microalgal biomass. Bioresour. Technol. 2015, 184, 291–296. [Google Scholar] [CrossRef] [PubMed]
  70. Galanakis, C.M.; Goulas, V.; Tsakona, S.; Manganaris, G.A.; Gekas, V. A knowledge base for the recovery of natural phenols with different solvents. Int. J. Food Prop. 2013, 16, 382–396. [Google Scholar] [CrossRef] [Green Version]
  71. Amin, M.; Chetpattananondh, P.; Khan, M.N.; Mushtaq, F.; Sami, S.K. Extraction and quantification of chlorophyll from microalgae Chlorella sp. In Proceedings of the IOP Conference Series: Materials Science and Engineering, Quetta, Pakistan, 2–3 April 2018; Volume 414, p. 012025. [Google Scholar] [CrossRef]
  72. Morcelli, A.; Cassel, E.; Vargas, R.; Rech, R.; Marcílio, N. Supercritical fluid (CO2+ ethanol) extraction of chlorophylls and carotenoids from Chlorella sorokiniana: COSMO-SAC assisted prediction of properties and experimental approach. J. CO2 Util. 2021, 51, 101649. [Google Scholar] [CrossRef]
  73. Zaripheh, S.; Erdman, J.W., Jr. Factors that influence the bioavailablity of xanthophylls. J. Nutr. 2002, 132, 531S–534S. [Google Scholar] [CrossRef] [Green Version]
  74. Serra, A.T.; Silva, S.D.; Pleno de Gouveia, L.; Alexandre, A.M.R.C.; Pereira, C.V.; Pereira, A.B.; Partidário, A.C.; Silva, N.E.; Bohn, T.; Gonçalves, V.S.S. A Single dose of marine chlorella vulgaris increases plasma concentrations of lutein, β-carotene and zeaxanthin in healthy male volunteers. Antioxidants 2021, 10, 1164. [Google Scholar] [CrossRef]
  75. Watson, S.B. Algal taste and odor. In Algae: Source to treatment AWWA Manual of Water Supply Practices; AWWA Publishing: Denver, CO, USA, 2010; Volume 57, pp. 329–374. [Google Scholar]
  76. FiorMarkets. Global Carotenoids Market is Expected to Reach USD 3.59 Billion by 2025: Fior Markets. Available online: https://www.globenewswire.com/news-release/2019/10/15/1929461/0/en/Global-Carotenoids-Market-is-expected-to-reach-USD-3-59-billion-by-2025-Fior-Markets.html (accessed on 12 February 2023).
Figure 1. The effect of extraction duration on MAE’s (a) extraction yield, extract’s total (b) phenolic and (c) chlorophyll content, (d) selected and (e) total carotenoid content, and (f) antioxidant activity. The extraction conditions of the single-factor experiments were maintained at 55 mLsolv/gbiom, 50 °C and 550 watts.
Applsci 13 02740 g001aApplsci 13 02740 g001b
Figure 2. The effect of solvent-to-biomass ratio on MAE’s (a) extraction yield, extract’s total (b) phenolic and (c) chlorophyll content, (d) select and (e) total carotenoid content, and (f) antioxidant activity. The extraction conditions of the single-factor experiments were maintained at 50 °C, 15 min and 550 watts.
Applsci 13 02740 g002aApplsci 13 02740 g002b
Figure 3. The effect of extraction temperature on MAE’s (a) extraction yield, extract’s total (b) phenolic and (c) chlorophyll content, (d) selected and (e) total carotenoid content, and (f) antioxidant activity. The extraction conditions of the single-factor experiments were maintained at 55 mLsolv/gbiom, 15 min and 550 watts.
Applsci 13 02740 g003
Figure 4. The effect of microwave power on MAE’s (a) extraction yield, extract’s total (b) phenolic and (c) chlorophyll content, (d) selected and (e) total carotenoid content, and (f) antioxidant activity. The extraction conditions of the single-factor experiments were maintained at 50 °C, 55 mLsolv/gbiom and 15 min.
Applsci 13 02740 g004
Figure 5. The simultaneous effect of extraction temperature, duration, solvent-to-biomass ratio, and microwave power on MAE’s (a) yield, extract’s total (b) phenolic and (c) chlorophyll content, (d) selected and (e) total carotenoid content, and (f) antioxidant activity.
Applsci 13 02740 g005aApplsci 13 02740 g005b
Figure 6. Experimental versus predicted values of (a) extraction yield, (b) total chlorophyll content, (c) total carotenoid content, and (d) antioxidant activity. The error bars refer to the experimental coefficient of deviation.
Applsci 13 02740 g006
Figure 7. Comparison between the conventional solid-liquid extraction (SLE), microwave-assisted extraction (MAE), supercritical fluid extraction (SFE) and supercritical fluid extraction with 10% w/w cosolvent addition (SFE + 10% Ethanol) of Chlorella vulgaris, regarding the (a) extraction yield, total (b) phenolic and (c) chlorophyll content, (d) selected and (e) total carotenoid content, and (f) antioxidant activity.
Applsci 13 02740 g007aApplsci 13 02740 g007b
Figure 8. Comparison between the conventional solid-liquid extraction (SLE), microwave-assisted extraction (MAE), supercritical fluid extraction (SFE) and supercritical fluid extraction with 10% w/w cosolvent addition (SFE + 10% Ethanol) of Chlorella vulgaris, regarding the (a) selected and (b) total carotenoid content expressed in amount of bioactive component per amount of biomass.
Applsci 13 02740 g008
Table 1. The linear gradient adjusted for the RP-HPLC analysis.
Time (min)aq. Phosphoric Acid, 1% v/v (% v/v)Methanol (% v/v)MTBE (% v/v)
048115
1546630
2341680
2741680
27.148115
3548115
Table 2. Experimental conditions and results of MAE of C. vulgaris regarding yield, total phenolic (TPC), chlorophyll (CHL), selected carotenoid (sel. CAR), carotenoid content (CAR) and antioxidant activity (IC50), according to the applied experimental design.
RunTPtRYieldTPCCHLsel. CARCARIC50
(°C)(watts)(min)(mLsolv/
gbiom)
(% w/w)(mgGA(mg/(mg/(mg/(mgextr
/gextr)gextr)gextr)gextr)/mgDPPH)
1403005205.427.0831.162.7011.2768.25
2403005908.025.2312.132.823.8757.95
34030025208.638.7625.853.719.8960.04
440300259011.375.8814.333.994.8859.13
540550155513.1911.5341.397.4417.5937.82
6408005208.298.2862.067.7921.1937.15
74080059012.356.8949.094.7718.0854.17
840800252010.338.0648.878.4817.5350.36
940800259015.316.7434.945.6512.3954.02
1050300155515.259.2029.884.5011.9050.18
115055055511.446.5339.135.2213.9259.25
125055015209.268.8467.8711.8423.0942.00
1350550155511.6611.4151.55.6219.4841.87
1450550155511.9813.0952.85.4818.6540.49
1550550155513.3011.0646.794.9120.448.69
1650550159014.299.7339.067.2116.0353.58
1750550255513.719.1929.088.1711.2256.42
1850800155513.799.0634.705.4012.2653.80
196030052012.687.9564.018.5917.5350.70
206030059015.358.3935.114.9914.4260.47
2160300252010.108.8447.404.4617.3651.77
2260300259016.486.0442.823.7916.5765.64
2360550155515.0210.7448.094.4119.6663.10
246080052011.778.2730.873.9610.6165.00
256080059013.726.2338.125.8015.7571.69
2660800252017.616.8822.033.677.4055.94
2760800259020.188.3824.236.329.8556.43
CV * (%)5.777.485.125.783.668.20
* Coefficient of variation of the central point repetition (Runs: 13–15).
Table 3. Optimal MAE conditions of bioactive compounds from Chlorella vulgaris.
FactorValue
T (°C)60
P (watts)300
t (min)14
R (mLsolv/gbiom)22
ResponsePredictedExperimental
Yield (% w/w)12.0011.14
Total Chlorophylls (mg/gextr)67.7363.36
Selected Carotenoids (mg/gextr)n/a *7.06
Total Carotenoids (mg/gextr)22.8324.88
Total Phenolics (mg/gextr)n/a *9.34
IC50 (mgextr/mgDPPH)43.0040.49
* Not applicable.
Table 4. The applied conditions of conventional solid-liquid extraction (SLE), microwave-assisted extraction (MAE), supercritical fluid extraction with CO2 (SFE), and supercriticzal fluid extraction with CO2 and cosolvent addition (SFE-10% ethanol).
ParameterSLEMAESFESFE-10% Ethanol
Solventaq. Ethanol 90% v/vaq. Ethanol 90% v/vCO2CO2-Ethanol 90/10 w/w
Solvent-to-biomass ratio (mLsolv/gbiom)3022100100
Stirring (rpm)500500n/a*n/a*
Temperature (°C)30606060
Pressure (bar)11250250
Solvent flow rate (g/min)n/a *n/a*4040
Microwave power (watts)n/a *300n/a*n/a*
Duration (h)240.233.33.3
* Not applicable.
Disclaimer/Publisher’s Note: The statements, opinions and data contained in all publications are solely those of the individual author(s) and contributor(s) and not of MDPI and/or the editor(s). MDPI and/or the editor(s) disclaim responsibility for any injury to people or property resulting from any ideas, methods, instructions or products referred to in the content.

