1. Introduction
The essential tools for achieving a sustainable transport vision are global strategic objectives based on the “Strategic Plan for Transport Development in the Slovak Republic until 2030” [
1] and the “Roadmap to a Single European Transport (White Paper)” [
2]. These documents delineate the trends and requirements defined in European and national strategies. The document comprises several strategic global objectives that can be identified as main goals of sustainable railway transport. This study is concerned with the objective of increasing the safety and security of transport, which necessitates the provision of safe mobility through secure infrastructure and advanced technologies/procedures, incorporating preventive and control mechanisms [
3].
Railway transport performance in the conveyance of passengers has seen continual growth and is the safest mode of transportation. The key criterion for any system of transportation is its security [
4].
Rail transport is an ecologically sustainable mode of transportation, as evidenced by its contribution of only 0.5% of total EU greenhouse gas emissions in 2017, according to the European Environment Agency [
5]. Passenger kilometers in the EU-28 have grown from 375 billion in 2004 to 441 billion in 2014, translating to an increase of 17% in the modal share of rail travel from 6.1% to 6.9%. Such an increase in rail transportation has resulted in a decrease in congestion, air pollution, and greenhouse gas emissions in and around the larger cities within the EU. Eurostat reported in 2018 that the railway sector in the EU had a transport performance of 471,701.6 million passenger kilometers and almost ten billion passengers, with a 1.5% increase compared to 2017 figures [
6,
7].
Railway transport safety is highly reliant on the signaling and safety systems employed. These systems are typically divided into four distinct categories: station interlocking equipment, crossing interlocking devices, train protection systems, and line signaling equipment. Station interlocking equipment ensures that the railway infrastructure is in a safe state, crossing interlocking devices protect rail crossings from potential collisions, train protection systems reduce the risk of derailment, and line signaling equipment enhances the visibility of railway signals. All of these distinct systems are essential in providing a high level of safety in railway transport [
8].
Rail transport safety is substantially enhanced by the incorporation of modern safety systems and the continuous modernization thereof. Traffic conditions, means of transport and human factors are the primary determinants of sustainable transport safety. The condition of the infrastructure and the level of signaling and safety systems, as well as weather conditions and other external factors, all contribute to the overall safety of rail transport. Additionally, the technical state of the means of transport, as well as the safety level, are fundamental determinants of safety. Finally, human factors, which constitute one of the most prominent causes of transport accidents, must be taken into account. The failures of infrastructure personnel, train drivers, and third parties can all have significant ramifications on transport safety [
9].
Various definitions of human factors can be identified. Several authors describe it as an area of research that assesses human psychological, social, physical, and biological characteristics, synthesizes the data collected, and applies the findings to the design, operation, or utilization of products or systems with the aim of maximizing human performance, health, safety, and/or habitability [
10,
11,
12].
According to the International Ergonomics Association, the discipline of Human Factors is devoted to the scientific examination of human–system interactions. This field of inquiry centers on the aptitude of human beings to engage with tasks, equipment, technologies, and the environment in order to understand and evaluate these connections [
13]. The Transport Research Board (TRB) additionally indicates that the study of human factors is a multidisciplinary science that scrutinizes the interrelation between humans and devices, products, and systems. This branch of investigation is a fusion of behavioral science, engineering, and other disciplines, striving to establish the principles that ensure the usability of devices and systems by their designated users [
14].
When evaluating the impact of the human element on the railway system, the quality of education and training of railway personnel, their level of experience, and their state of health and wellbeing must be taken into consideration. Factors such as the quality of educational and training programs, the degree of expertise of railway personnel, and the current physical and psychological condition of employees such as fatigue, hunger, thirst, and overwork can all have significant implications [
15].
Ensuring the sustainability of rail transport necessitates the assurance of its safety, wherein the human element plays an essential role. Numerous railway safety regulations exist in the context of railway safety and accidents [
16]. For example, the Commission Directive 2014/88 EC EU of 9 June 2014 amended Directive 2004/49/EC of the European Parliament and the Council concerning common safety indicators and common methods for determining the magnitude of harm in the instance of accidents, and included a Corrigendum to Commission Directive 2014/88/EU of 9 June 2014. June 2014 amended Directive 2004/49/EC of the European Parliament and the Council regarding common safety indicators and common methods for determining the amount of damage in the event of accidents, and the Decision of 11 December 2013 C (2013) 8780. This Decision established common safety targets (CSTs) for the interval 2011–2015 for all Member States. The European Railway Agency (ERA) is responsible for their computation and adherence to safety levels. Varying national regulations are also in place, based on European safety rules.
The issue of railway accidents relating to the train driver’s culpability is of importance due to the particular type of accidents indicated in
Table 1 sourced from the Czech Rail Safety Inspection Office. The data in
Table 1 encompass the exclusive category of incidents (exceeding the main/shunting stop signal). Drivers are responsible for 99% of this type of crash. An inquiry from the Czech Rail Safety Inspection Office established that the primary causes for drivers’ errors are fatigue, overwork, and inadequate driving techniques and experience. There is no exact protective system in rail transport for evaluating drivers’ driving capabilities, wise/poor practices or vigilance [
17].
The average age of train drivers employed by Company ZSSK (national passenger operator in Slovakia) in 2019 was 46 years, whereas for Company ZSSK Cargo (national cargo operator in Slovakia), the average age was 49 years. A noteworthy fact is that the Czech railway sector, whose companies operate in Slovakia as well, faced a significant shortfall of 330 drivers in 2020, and the average age of those employed was 49.6 years, with 11% being over the age of 65.
Investigation into human–machine interactions is an effective way to ascertain the variables that have an influence on human performance when operating machines. Identifying the critical contributing factors (positive and/or negative) that affect human behavior can lead to enhanced transport safety [
18].
Edkins D. G. and Pollock M.C. conducted a pioneering comprehensive examination of train drivers’ vigilance in 1997. They commenced their investigation with the proposition that railway operations necessitate that train drivers remain alert, oftentimes in tedious conditions, and act quickly to unforeseen critical signals. They scrutinized 112 rail accidents in Australia between 1990 and 1994, and determined that the drivers’ attention was implicated in 70% of the accidents. Moreover, the researchers observed that train driver errors commonly involved skill-based behavior [
19].
Lorenz’s dissertation thesis examines the utility of modern technology in facilitating route knowledge acquisition among inexperienced train drivers. He highlights the importance of Human–Machine Interaction (HMI), which is defined as the communication between a human and a machine via a user interface. User interface encompasses the use of input devices and software, and the human eye is one of the primary input media, providing 80 to 90 percent of information gleaned from the outside world. To gain insight into a user’s gaze point, eye tracking is employed as an experimental research method. Consequently, this research contributes to a better understanding of the effectiveness of modern technology in propagating route knowledge with regard to train driving [
20,
21,
22].
The study of human interaction and behavior in safety-critical environments is a focal point of human factors research [
23]. Traditional techniques for quantifying human performance typically incorporate metrics such as response time and accuracy. Performance measures are thus generated. Furthermore, to gain a better understanding of task progression, an examination of the underlying processes must be conducted. This necessitates the utilization of procedural measures, and in this regard, eye movements are particularly advantageous due to their ability to provide insights into the visual, cognitive, and perceptual aspects of human performance [
24,
25].
Investigation of human factors utilizing the user testing method is a viable approach for exploring the level of interaction between humans and machines. To maximize the efficacy of usability testing, a representative sample of the targeted user group should be chosen and the data collection techniques must be capable of capturing the demands associated with the activities performed. Eye-tracking technology provides a unique opportunity for user testing as it is capable of measuring the perception and behavior of the tested subject while they are completing the assigned tasks. The usefulness of eye-tracking in transport systems is evident, as it has been employed for various measurements in both real and simulated environments and is especially advantageous for the analysis of human behavior in aviation and vehicle driving.
Eye trackers have been employed in flight simulators for the purpose of aviation experiments, as demonstrated by the studies of Kocian and Longridge [
26,
27]. An example of effective utilization of eye-tracking technology in a flight simulator was provided by Anders [
28]. In the course of the experiment, eye and head movements of professional pilots were recorded by eye-tracking equipment in a simulated flight environment. This enabled an analysis of the interaction between the pilot and the Human–Machine Interface (HMI) with regard to the selection and management of information, situational and mode perception in an aircraft cockpit. The experiment was performed in a full flight simulator Airbus 330 certified for airline training. The cockpit was divided into twelve fields of interest, and pilots had to perform flights beginning from a specified altitude, followed by descent and landing. This experiment shows how eye movements effectively inform the assessment of pilots’ performance, as well as the instruction of novice pilots.
The application of eye trackers within driving simulators has been acknowledged to be an efficient method of recognizing the nature of the driving task and improving driver training strategies, as well as preventing road traffic accidents. Chapman and Underwood’s study demonstrated that inexperienced drivers were observed to have a more protracted fixation on stimuli than experienced drivers. This indicates that novices require additional time to process visual information from the scene [
29]. The research of Dishart and Land showed that the use of the road section with tangent points increases with experience and then decreases as drivers learn to optimize the pattern of their visual surveillance and search [
30].
Ho’s driving study investigates the impact of environmental factors such as clutter, illumination, and age on the visual search for traffic signs in images of driving scenes. Results from the study revealed considerable differences in the number of errors, reaction times, number of fixations, and average fixation duration between older and younger participants. Due to the rapidly aging driving population, the authors recommend reducing the number of advertisements near roads, removing superfluous traffic signs, and making them more prominent for the drivers, thereby augmenting road safety [
31]. Recarte and Nunes’s research on mental activity during driving suggests the advisability of raising drivers’ awareness about the possible effects of driving. At the same time, the study indicates that fixation on thoughts unrelated to driving could be reduced by diminishing the windows and mirrors in the car, which would result in a decreased probability of detecting traffic events [
32].
An analysis of driving behavior revealed that eye-tracking technology was primarily employed in aviation and automotive experiments, with a lack of experiments devoted to other modes of transportation. A survey of the Web of Science database uncovered a few studies on the evaluation of driver behavior with user testing technology in railway transport systems:
Luke et al. explored the visual task of train driving by utilizing a corneal dark eye-tracking system to track the visual search and scanning patterns of train drivers. Data collected from the system included the duration and frequency of glances towards different aspects of the dynamic scene both inside and outside the train cab. The primary focus of the experiment was the visual scene in front of the train [
33].
Madlenak et al. conducted an in-depth examination of the driver’s attention during train operation. The study analyzed two common processes during the train driver’s work: locomotion on the tracks (without stops) and locomotion through the train station (with stops at the station) [
9].
Rjabovs and Palacin investigate the performance-shaping factors associated with holistic design considerations of metro systems, and further evaluate their influence on driver behavior through the implementation of eye-tracking techniques in a case study [
34].
Yan et al. investigated the particularity of train drivers’ fatigue in a high-speed railway context [
35].
Naghiyev et al. conducted an explorative eye-tracking study in a real-world setting with conventional and European Rail Traffic Management System drivers on their regularly scheduled routes. The results of this study offered a more comprehensive qualitative examination of the cause of the transition in the standard visual attentional strategy from observation of the tracks to speed information inside the cab [
36].
Guo et al. investigated the role of image velocity and complexity on the dynamic visual field of high-speed train drivers, with eye movement analysis demonstrating that image velocity had a significant impact, whereas complexity did not [
37].
Vera Verstappen conducted a pilot study to investigate the effect of a fellow passenger on train drivers’ performance and attention allocation. Utilizing a train simulator, the results of the study revealed that the presence of an inconsiderate individual in the driver’s cabin had a detrimental effect on driving performance, with tasks being completed more successfully when the driver was alone. These findings are of paramount importance to the optimization of train drivers’ performance and the enhancement of railway safety [
38].
Brandengurger et al. (2020) conducted a study to determine the duties and responsibilities of a locomotive engineer who operates an ultra-modern, high-velocity passenger train. The outcomes of the investigation suggest that the engineer must maintain a persistent level of mental effort and sustained concentration in order to acquire cognitive information and monitor the environment continuously. Consequently, the role of the train driver is set to evolve into that of a train operator in the coming years [
39].
This analysis clarifies the limited implementation of real-world eye-tracking research devoted to examining train driver behavior and operations under specific circumstances. Despite the potential of utilizing eye-tracking technology to gain insight into the cognition and decision-making of train drivers, research in this area has been limited. To date, only a few studies have been conducted, and even those have primarily featured highly controlled, simulated environments. While such research is valuable, the results are not applicable to the dynamic and unpredictable conditions of the real world. It is therefore necessary to develop additional research initiatives that incorporate real-world train operations. Such research could involve collecting data from drivers in diverse operational contexts and varying levels of complexity. In addition, the data should be analyzed to reveal how different factors (e.g., weather, train speed, and passenger load) can affect the decision making of train drivers.
Therefore, the goal of this study is to explore the potential of utilizing eye-tracking technology to gain insight into the cognition and decision making of train drivers and to develop additional research initiatives that incorporate real-world train operations in order to better understand the cognitive processes involved in train operations and ultimately, improve the safety of the rail system.
2. Materials and Methods
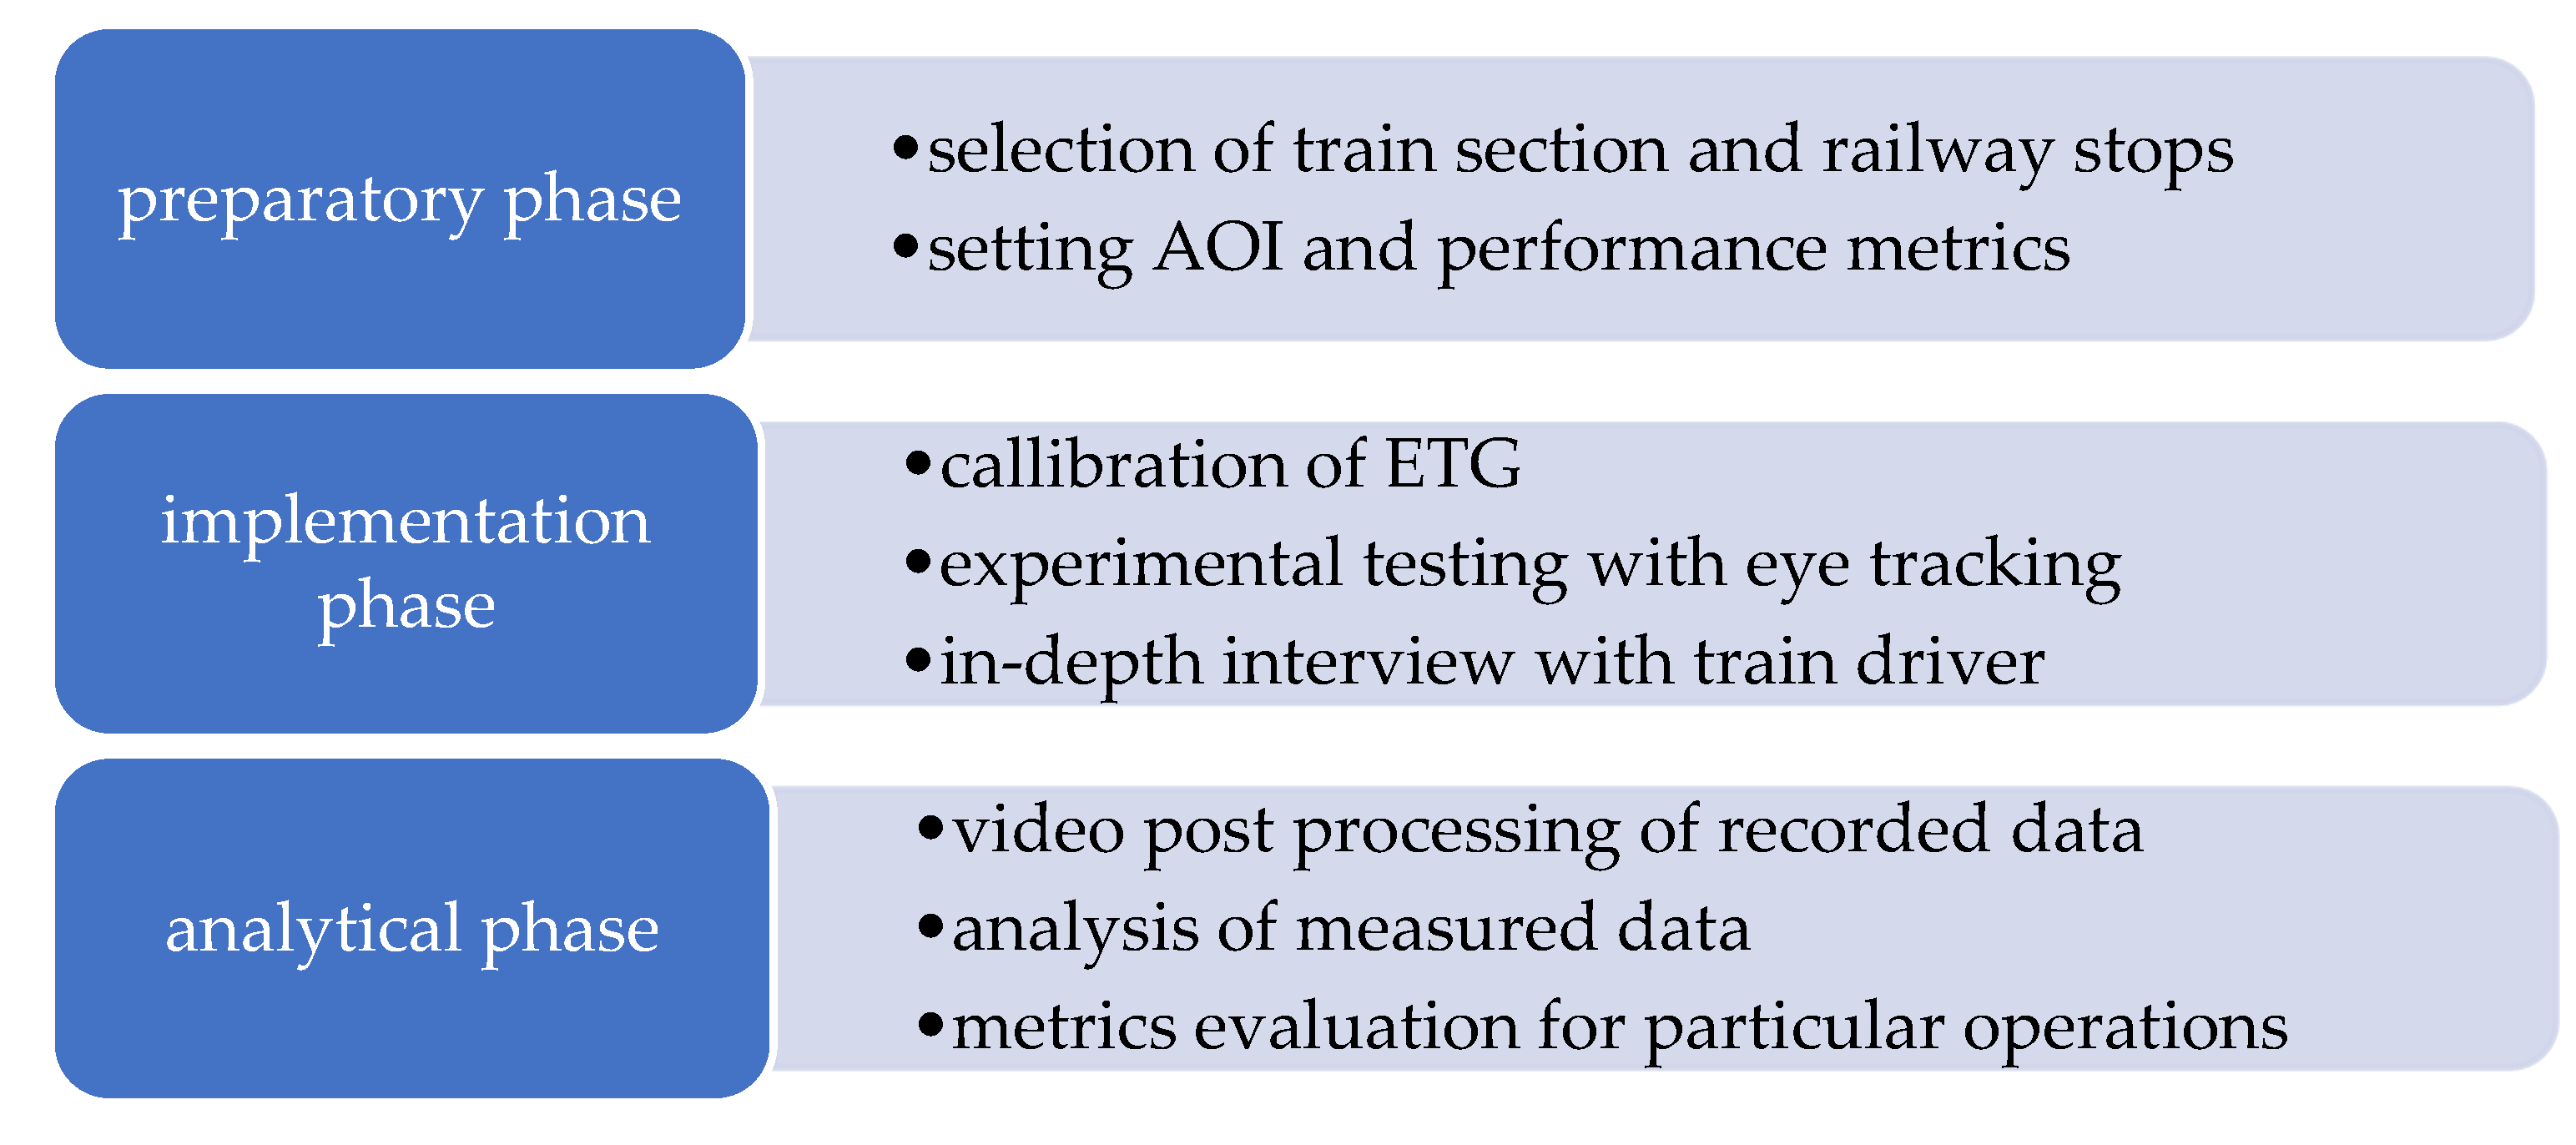
According to the results of a literature review and the requirements for determining optimal practices for the operations of a train driver in certain situations, we have established the primary objective to achieve the goal defined at the end of the article’s introduction: to analyze the approaches to arriving at and departing from several types of train stations, and to identify the most effective practices from the perspective of the train driver. The overall process of conducting the research (research methodology) is presented in
Figure 1. The key sections related to the research are presented in
Section 2.1 and
Section 2.2.
2.1. Research Conditions
In the spring of 2020, an experimental investigation was conducted under real railway traffic circumstances. The primary stage of the study included the determination of an appropriate location for the experiment, which was the railway infrastructure line. After an appraisal of potential railway lines near Žilina, the Žilina-Púchov railway track was chosen due to its recent reconstruction, high-quality condition, modernized safety and train control system, and its widespread representation of Slovak railway characteristics such as double-tracking, electrification, traction system, high density of traffic, safety, and control system. Ten stops were located on the selected track section, from which two train stations and two railway stops were chosen for the analysis. Subsequently, the essential characteristics of the selected train stations and railway stops were identified:
Horný Hričov railway stop is located on the ŽSR line no. 120 Bratislava hl.st.—Žilina, in the interstation section Dolný Hričov—Žilina. The stop position on the track is located at kilometer 195,042, with exits to the right side, in the direction of travel, and the double track is electrified by 3 kV DC.
Dolný Hričov station (Žilina district) is located on the double-track electrified (3 kV DC) line no. 120 Žilina—Bratislava, between Žilina and Bytča at kilometer 193,073. The station has seven transport tracks and one manipulation track. The station building is located on the left side, in the direction of Bratislava.
Bytča railway station is located on the double-track electrified line ŽSR no. 120 Bratislava—Žilina, track kilometer 185,275; 3 kV DC electrifies the track. The station building is located on the right side, in the direction of Bratislava. The station has seven transport and four manipulation tracks.
Predmier railway stop is located on the ŽSR no. 120 Bratislava hl. st.—Žilina, in the interstation section Považská Teplá—Bytča, track kilometer 183,620. The track is a double track, electrified by 3 kV DC. The location of the building is to the left, in the direction of Bratislava hl. st.
Our case study utilized the Škoda Transportation-manufactured electric double-decker multiple-unit series 671 (EPJ), which was utilized in a prior experiment [
9], and is depicted in
Figure 2. This multiple-unit rolling stock includes one electric traction wagon, one wagon, and one control wagon.
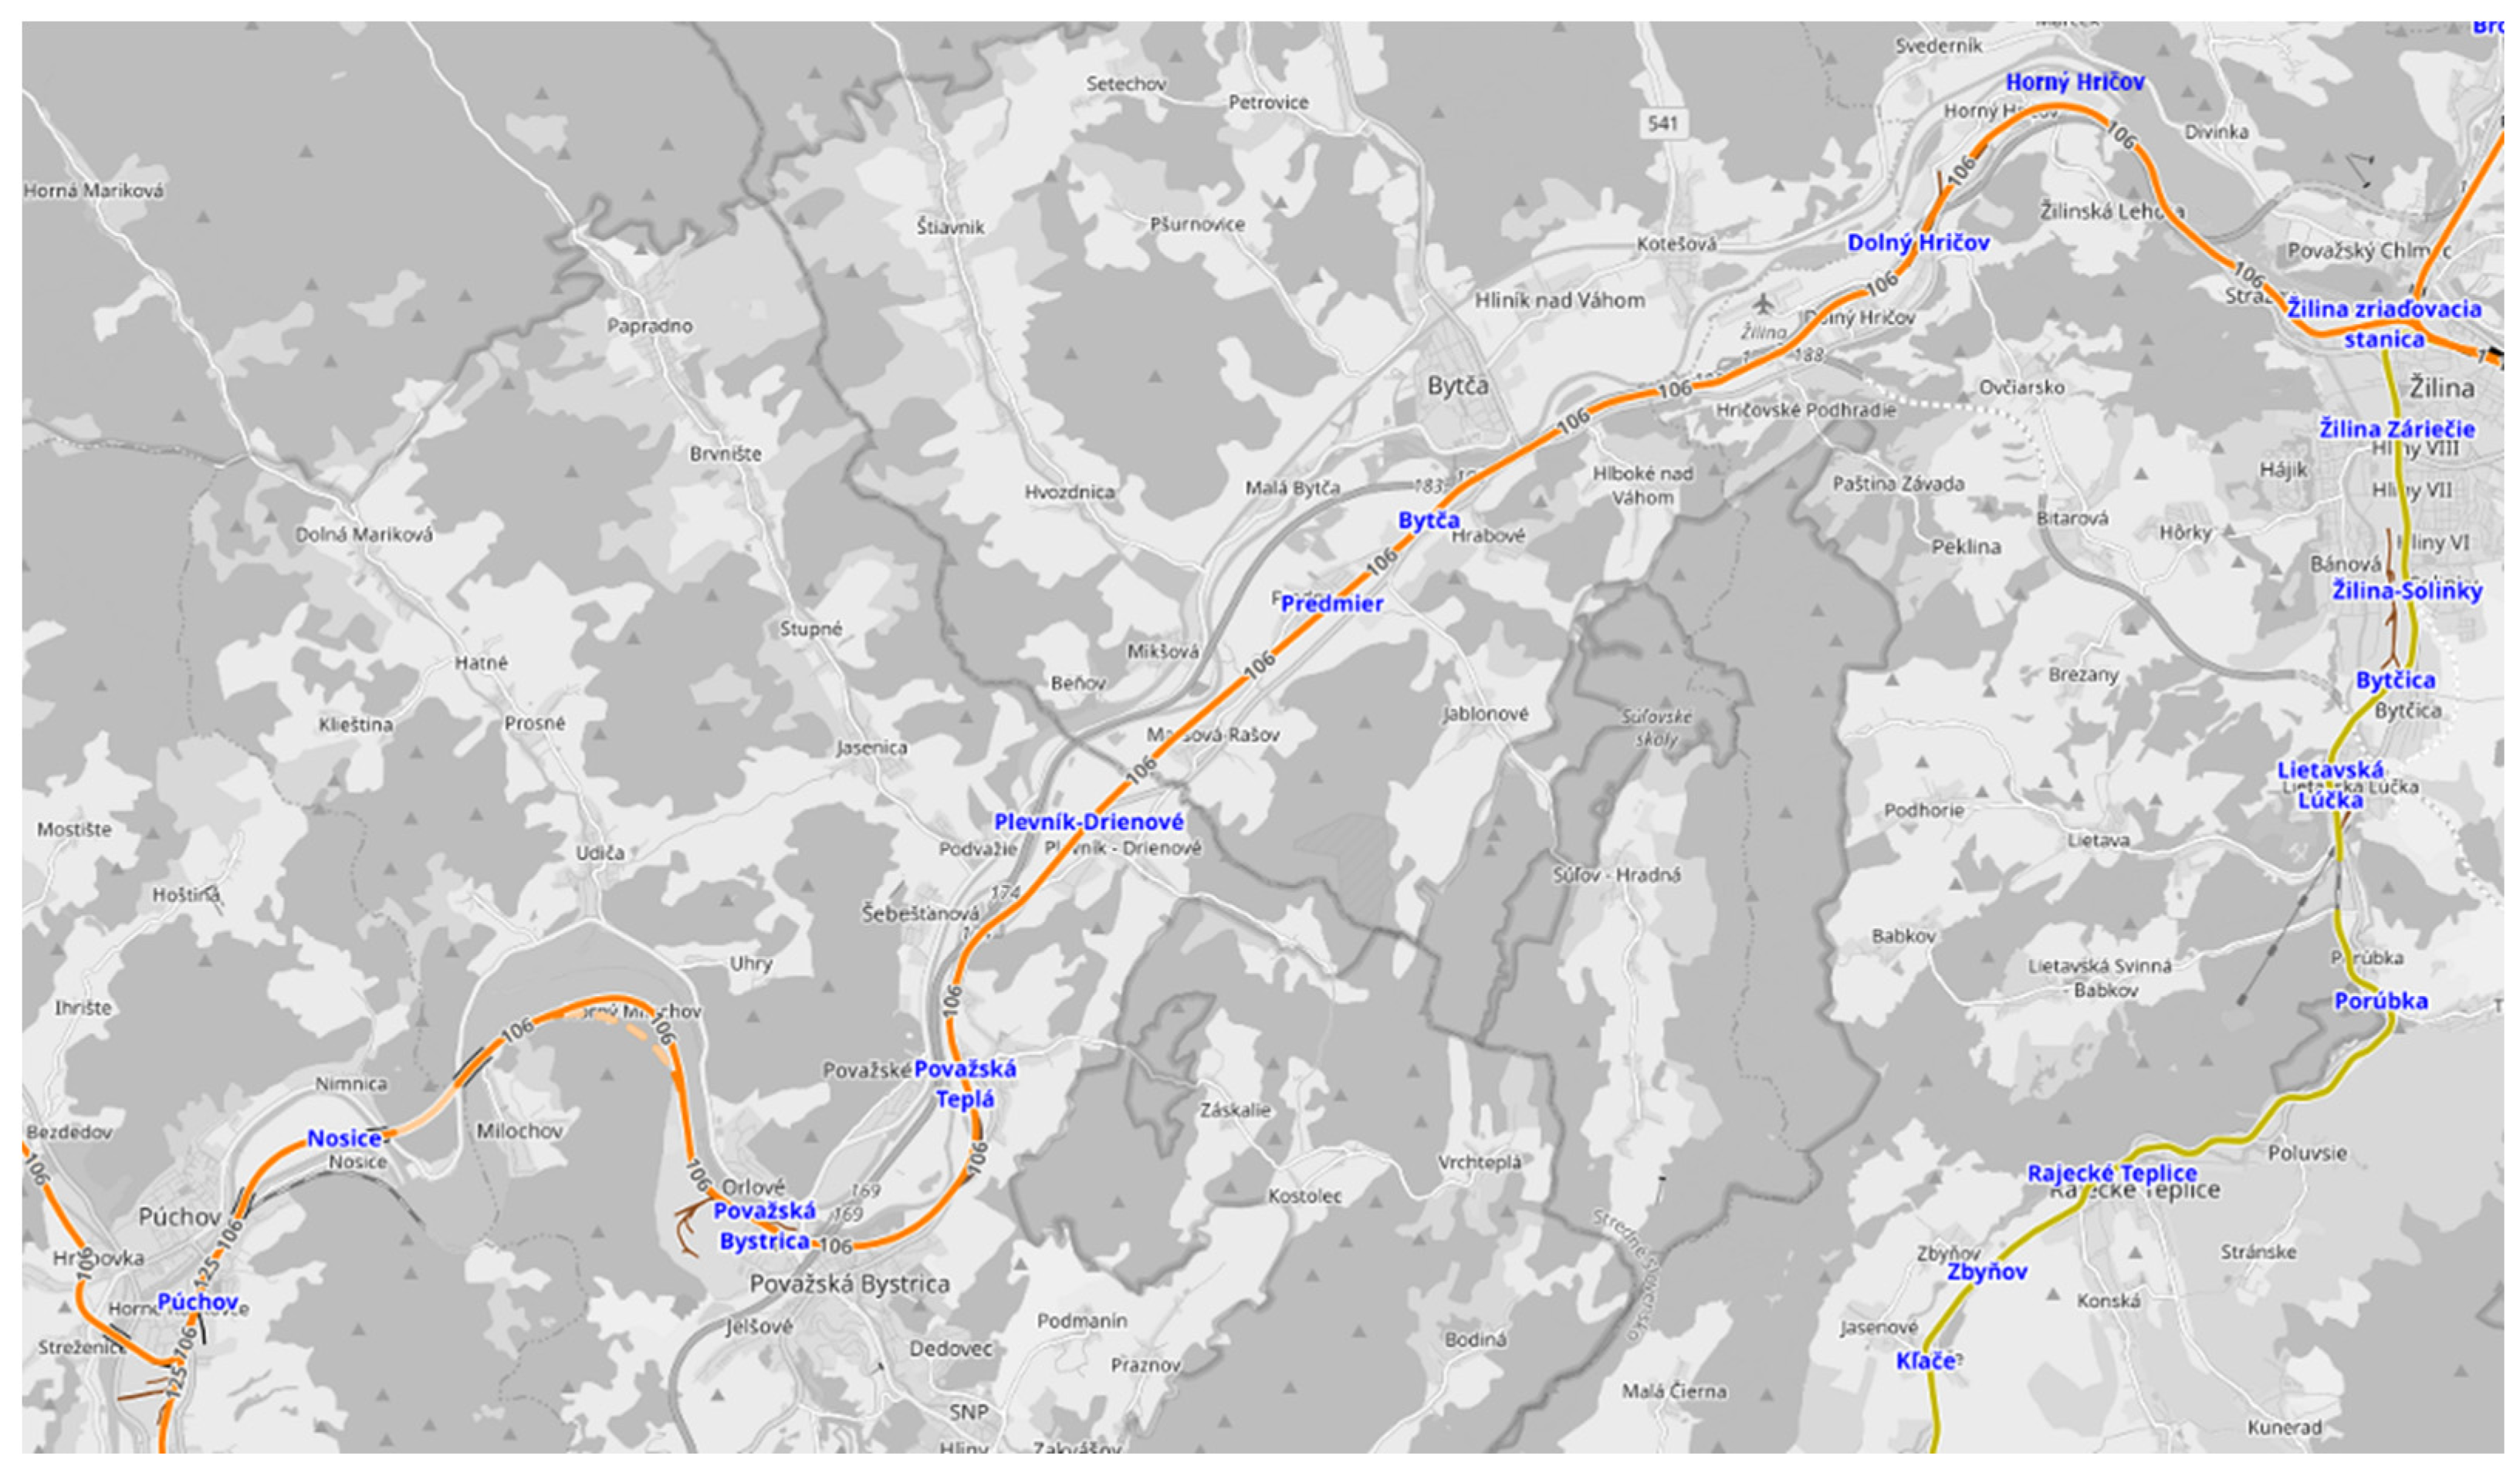
A case study was conducted on Railway Track No. 120: Bratislava-Žilina, situated in the section of Žilina-Púchov of Slovak Railways (ŽSR) (see
Figure 3). This double-track, 3 kV DC electrified railway line measures 44 km and is part of the V Corridor [
41].
The track section has undergone a full overhaul, resulting in the maximum speed for conventional trains being raised to 120–160 km/h (as illustrated in
Figure 4). The utilization of the European Train Control System Level 2 (ETCS Lvl. 2) has enabled tilting trains to achieve higher speeds. The completion of the reconstruction of the Púchov–Zilina lines will make ETCS level 2 fully functional, with it only being employed by compatible vehicles; the Automatic Signal Block system, however, will continue to be used due to the lack of compatible equipment in the carriers’ vehicle fleets. Additionally, a new traction system, signaling apparatus, and information equipment have been installed [
42,
43,
44]. Moreover, a mobile radio network and new telecommunication technology have been implemented to provide a direct radio link between the dispatcher and the moving trains, with the entirety of the track section being regulated from the central transport control center in Púchov [
41].
Between 2014 and 2018, a 22,702 km railway section from Považská Teplá to Žilina underwent full reconstruction, which included the installation of a new traction line, an automatic signal block, an ETCS Level 2 European Train Control System, and an information device. Additionally, the stations and stops are now compliant with the requirements for full accessibility by individuals with reduced mobility.
2.2. Eye-Tracking Technology
Investigation of human factors utilizing the user testing method is a viable approach for exploring the level of interaction between humans and machines. To maximize the efficacy of usability testing, a representative sample of the targeted user group should be chosen and the data collection techniques must be capable of capturing the demands associated with the activities performed. Eye-tracking technology provides a unique opportunity for user testing as it is capable of measuring the perception and behavior of the tested subject while they are completing the assigned tasks. The usefulness of eye tracking in transport systems is evident, as it has been employed for various measurements in both real and simulated environments and is especially advantageous for the analysis of human behavior in aviation and vehicle driving.
The application of eye-tracking technology was utilized to analyze the train driver’s behavior with great accuracy while in operation. The SMI ETG 2W head-mounted eye-tracking glasses with software iViewETG version 2.8 were selected to procure raw data. This device was specifically designed to capture the visual conduct of the subject in real-time scenarios. Equipped with three high-speed cameras, two infrared cameras were used to record the subject’s pupils’ movement and position in both eyes, while the third high-definition scene camera with a resolution 1280 × 960 p @24 fps captured the surrounding environment. Additionally, a smartphone was connected to the glasses for data recording purposes. The SMI ETG 2W provides eye tracking with a sampling frequency of 60 Hz throughout the field of view and guarantees precise data with a tracking range of 80° horizontal, 60° vertical, and a gaze tracking accuracy of 0.5° over all distances [
45].
The SMI BeGaze software 3.7.59 (produced by SensoMotoric Instruments (SMI), Teltow, Germany) was employed to conduct an in-depth analysis of the raw data collected by the SMI ETG 2W. This comprehensive application provided a range of analytical functionalities, including Scan Path, which illustrated the map of the driver’s gaze fixations and the order in which they occurred. The most beneficial analytical tool for our research, included in the BeGaze software, was the AOI (Areas of Interest) analysis. In this analysis, user-defined metrics were extracted from the pre-defined regions in the visual stimulus. To identify the areas of train control and operation, the AOI editor was used to designate the main AOIs in the train cabin. As a result, thirteen AOIs (panels) were identified (see
Figure 5).
The Areas of Interest (AOI) displayed in the figure are numerically coded from A to M, each representing a distinct aspect of the train’s operation:
A stands for the view of the external environment, encompassing front, right, and left windows.
B stands for the left and right rear-view mirrors.
C denotes railway signals.
D is indicative of the actual speed, as shown in Panel D.
E is the main train operating window.
F corresponds to the cab signaling and the train protection system Mirel
G is for the brake system pressure.
H refer to the set of train driving controllers.
I is the automatic train speed controller.
J is the main train controller, controlling both acceleration and braking.
K is the timetable sheet.
L is for notes pertaining to the section, such as speed restrictions.
M is the signaling of safety closure of the train doors.
Observe that the cab display of the European Train Control System (ETCS) is depicted in
Figure 5, with the black window located above region K. Nonetheless, since the ETCS is not in use, it has been deactivated.
In order to acquire pertinent information from eye-tracking recordings, the fixation-to-fixation coding technique was utilized. This video-coding procedure enabled the generation of a reference image from a segment of the scene (train cabin) camera video, and successive clicks in the reference image at the identical position as the fixation within the superimposed scene video, once for each fixation in the data [
46].
The Human–Machine Interaction Laboratory (HMI-LAB) of the University of Zilina is located at the University Science Park and is equipped with both software and hardware. The primary purpose of the HMI-LAB is to conduct research and testing related to human-machine interactions in a variety of settings. This lab was used to evaluate data for their final publication.
The experiment was conducted to evaluate the behavior of a train driver during daylight on a chosen stretch of track. A climatized train cabin was utilized, free from any external interferences. A 51-year-old train driver, with 30 years of experience in regional, long-distance national, international, and railway transport, was engaged in the experiment; he had been absent from any category A or B railway accident (as classified by international railway safety standards) [
9]. The train driver’s task was to drive the train in the usual way. He wore eye-tracking goggles to record his interaction with the locomotive’s controls and surroundings. He had no information about the variables to be evaluated during the measurement. He passed through 9 stations during his journey. Measurements on the same track were repeated 6 times, and the results presented in the paper are the average values of indicators from four selected types of stations.
It should be emphasized that there are no standardized tasks that a driver must abide by. The two main regulations governing Slovak railways are the Regulation: Z1 Railway Operation Rules and Regulation: Performance of the driver’s activities ZSSK V2. The Railway Operation Rules (Z1) is an extensive (more than 500 pages) set of regulations on transport activities and train operation on railways managed by ŽSR. The Regulation on the Performance of Train Driver Activities ZSSK V2 details technological procedures and activities related to work activity and drive management of rolling stock. Despite their scope, neither regulation contains detailed processes and work procedures for the oper-ational actions of the train driver during the arrival of the train to the station/stop and the departure of the train from the station/stop.
In order to obtain optimum raw data, SMI eye-tracking glasses were used to monitor the driver’s visual attention. The following three steps were essential prior to measurement: establishing a connection between the eye-tracking glasses and the recording device (smartphone); configuring the experiment for the subject being tested in the recording device; and, completing the calibration process of the eye-tracking glasses and initiating the recording of the subject’s gaze.
The experiment has a critical analytical component that is designed to evaluate metrics that delineate the operation of the train and the interaction between the driver and the train’s cabin control systems and panels during specialized operations. This research aims to elucidate the location, duration and frequency of the driver’s gaze directed towards the areas of interest [
47,
48]. The metrics to be established for each of the areas of interest in the cabin are as follows:
Dwell time is defined as the period of time from a participant’s entry to their exit in a particular AOI. In some human factor research, dwell is referred to as glance or gaze duration. Dwell time is generally the aggregate of fixation and saccades durations during the stay in an AOI. The recorded dwell time for an AIO is contingent upon the AOI semantics and the participant’s task. Dwell time is indicative of the attention paid to an AOI or the informative nature of said AOI. It may be presented in an absolute (time in milliseconds) or relative format (% of total time).
The number of fixations is defined as a period when the eye is relatively stationary; yet, certain definitions incorporate visual intake as an auxiliary parameter on fixations. During the period inside of the AOI, the number of fixations has also been referred to as fixation density. The number of ocular fixations indicates the significance of the AOI for the subject under examination.
Average fixation duration is a measure commonly employed in eye-tracking research, with variation in duration across different tasks and stimuli being observed. It is generally accepted that longer fixations denote a more intensive and strenuous cognitive process. This measure can be expressed quantitatively in terms of absolute time in milliseconds.
Revisits denote a transition from one AOI to another; the number of revisits can provide insight into the subject’s attentional focus with respect to a particular AOI. The frequency of revisits is thus indicative of the amount of time the subject devoted to a given AOI.
In order to guarantee the correct conduct of the research and interpretation of the acquired data, we employed a variety of scientific techniques. Initial research and extraction of extant bibliographic resources, the amalgamation of knowledge obligatory for experimental assessment, observation during the experiment period, analysis, comparison, induction, deduction, statistical techniques in the investigative period, and graphical techniques for representing the data aided each stage of the completed research.
For the purpose of linking conscious and unconscious perceptions of the situation with which the driver is confronted, the eye-tracking research is complemented by the implementation of an in-depth interview.
An in-depth interview is a type of qualitative research method that involves conducting an in-depth, semi-structured conversation with a participant to explore their thoughts, feelings and experiences on a particular topic. It is usually conducted after conducting eye tracking analysis to provide an additional layer of understanding of how and why the test participants interacted with a situation with which they are confronted. In-depth interviews can help identify user needs, uncover motivations and uncover how the user interacts with the product or medium [
49].
3. Results
In the methodological component of our investigation, we identified and subsequently concentrated on two particular locomotive operations (train arriving at stations and train leaving the station) at two distinct locations (train station and railway stop). The assessment was partitioned into four trials, and each trial was divided into two operations.
3.1. Trial 1—Railway Stop Horný Hričov
At this railway station, the average total time for arriving and departing was 200 s. The mean period of entry was 120 s (
Table 2), while the mean duration of the departure procedure was 80 s (as illustrated in
Table 3).
3.2. Trial 2—Train Station Dolný Hričov
The aggregate duration of the arrival and departure processes at this train station was 215 s on average. The mean length of the entry process was 140 s (see
Table 4), and the mean duration of the departure process was 75 s (as shown in
Table 5).
3.3. Trial 3—Train Station Bytča
The average amount of time taken for people to enter and exit this railway station was 170 s. As seen in
Table 6, the mean duration of the entry process was 100 s and the mean duration of the exit process was 70 s (
Table 7).
3.4. Trial 4—Railway Stop Predmier
The mean duration for the arrival and departure operations at this railway station was 75 s.
Table 8 reveals that the average time for the arrival process was 40 s and
Table 9 indicates that the average time for the departure process was 35 s.
The results of the eye-tracking experiment demonstrate that the most pertinent panels in the train cabin are panel E (train operating window) and panel D (information concerning the train’s speed). It is evident that the driver’s attention is differently devoted to the AOIs (based on dwell time, number of fixations, and revisits) between the arrival and departure scenarios. During arrival, the driver’s focus is mainly on the front and side windows, then panel E and panel D; whereas, during the departure, the driver’s attention is mainly concentrated on panel E.
The train driver stated the following: “Ensuring safety and the safety of others was paid attention to during the drive by following the rules of the railway, monitoring speed and the speed of other trains, and being aware of surroundings. The traffic around, including other trains, track-side objects, and any other objects on the track were monitored, as well as railway signals, crossings, and any changes in the environment”.
Eye-tracking research revealed that the driver’s gaze was particularly attentive to the safety elements of the cockpit, and that he was able to quickly and accurately identify the controls he needed to ensure the safety of the train. Furthermore, the research revealed that the driver had strong cognitive abilities and was able to quickly and accurately identify the controls he needed to operate the train.
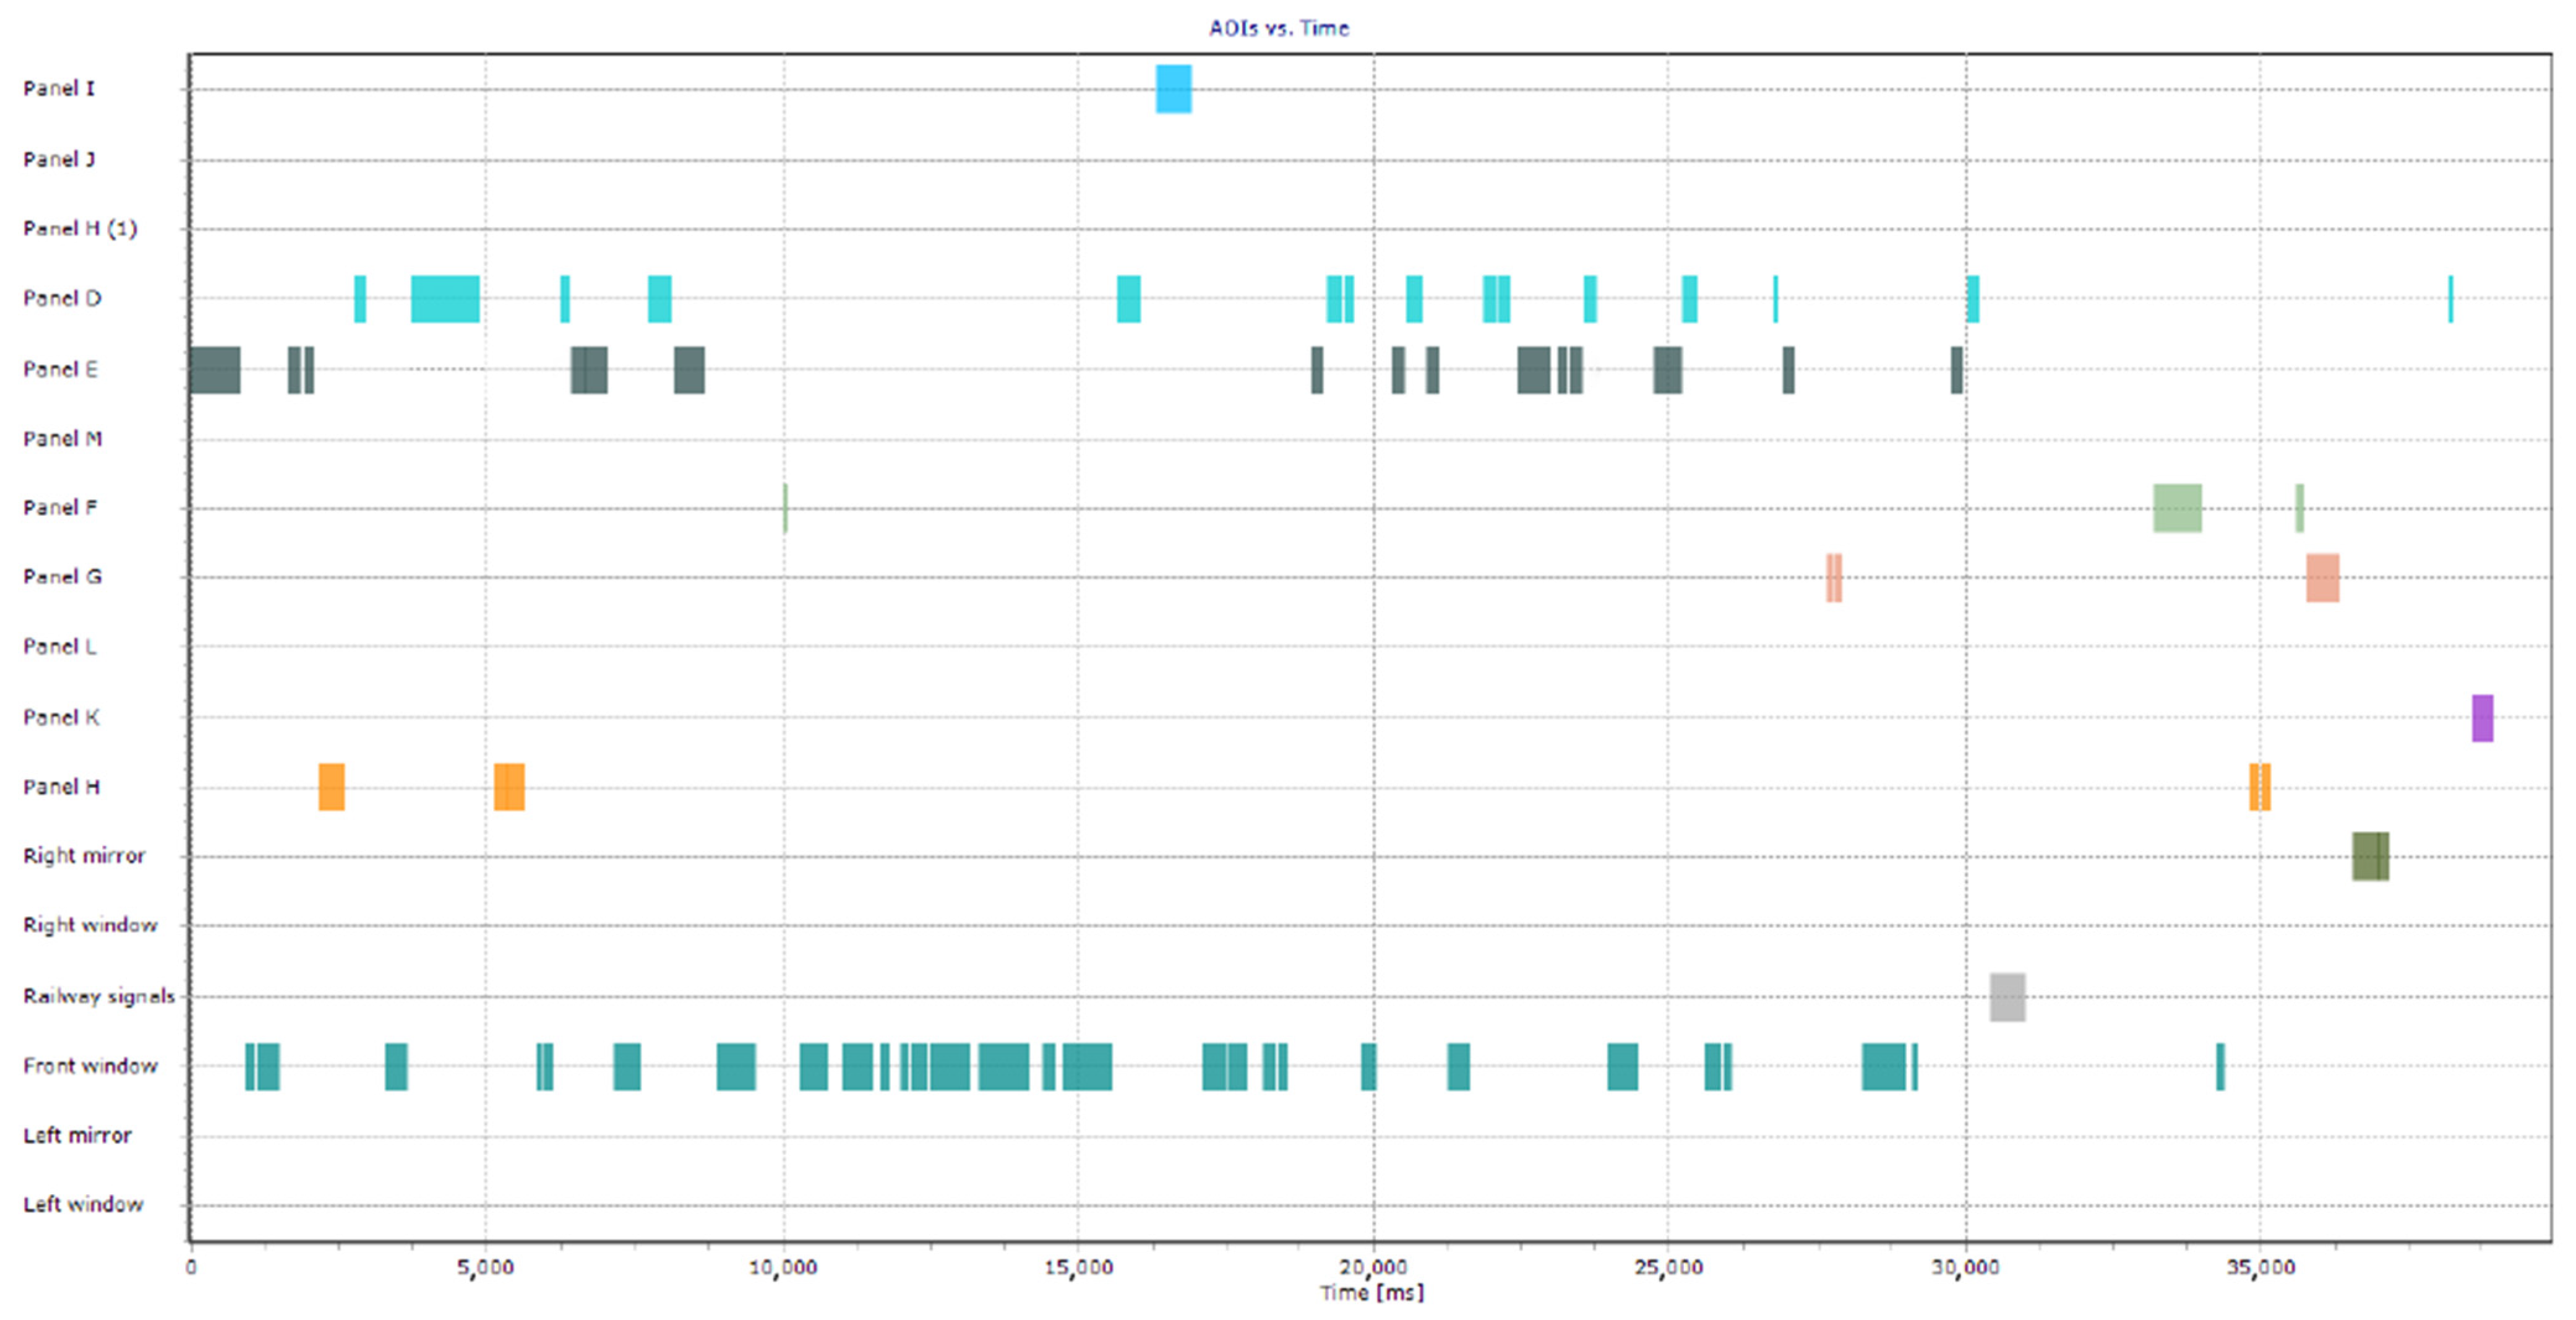
The disparities between the arrival and departure procedures can be discerned in the AOI Sequence Chart. This chart displays the temporal order in which the AOIs were canvassed by the train driver’s line of sight. The colored bars symbolize the individual AOIs that were perused. The AOIs’ labels are located along the y-axis, while the x-axis shows the extent of time in milliseconds.
Figure 6 illustrates the average train driver’s gaze trajectory upon nearing a railway station. On average, nine seconds prior to the train coming to a halt, the driver began to scrutinize panels F, G, and H (respectively pertaining to the train safety system, the pressure in the brake system, and other train driving controllers). Just before the train stops (an average of three seconds prior), the driver surveyed the mirror and side window for any potential hazards. Finally, one second before the train’s stop, the driver checked the timetable and compared the actual time to the train’s schedule. What the train driver did while passengers are getting on and off the train is not part of the measurements.
The
Figure 7 AOI sequence chart illustrates the train driver’s operational procedure during departure. Initially, the driver assessed the automatic speed controller and panels E and D, alongside his notes pertaining to the upcoming train section. Subsequently, he surveyed the side window for any potential late passenger boarding, while also analyzing the panels containing preliminary information concerning train operations and the actual speed. Following this, the driver inspected the timetable with the train schedule and information regarding the safety of the train doors. Finally, the train was set in motion, and the driver’s attention oscillated between panels E/D and the front window, as the arrival procedure began.
3.5. Comparison of Arrival and Departure Procedures
In the concluding section of the article, we presented particular outcomes from eye-tracking examinations focused on the train driver conduct during the arrival and departure operations in railway halts and train stations. It is imperative to appraise the outcomes from a more comprehensive point of view. Thus, we constructed an overall dataset that elucidates arrival and departure procedures. The dataset comprises the mean information from train driver behavior testing during four arrivals and four departures of the train, repeated during the six train runs at the same track. The average outcomes collaborate with data sets from twenty-four assessments for the arrival procedure and twenty-four assessments for the departure procedure.
During all arrivals at the stations, the driver directed his gaze to the window section (front window, side windows, and mirrors) for an average of 49.9% dwell time, to the panel section (29.9% of the dwell time), and to the railway signal section (1.15% of the dwell time) (see
Figure 8). The correlation between the number of fixations on a particular Area of Interest (AOI) and the dwell time metric was noted. A greater number of fixations on a certain AOI indicates that the AOIs are more salient (or the AOI content is regularly fluctuating) and are more perceptible to the driver than others. On the whole, the average number of fixations on the whole window section was 168.75, on the panel section 108.75, and on the railway signal section only 4.5. This is likely due to the fact that the scenery on the main window is constantly changing, and the driver must direct most of his attention to the window section.
The mean fixation time for the AOI displays a range of 119.8 milliseconds (panel I) to 397.3 milliseconds (mirrors). This variance can be attributed to the varying levels of complexity between the two stimuli, the buttons of the automatic speed controller (panel I) being easier to evaluate than the presence of passengers boarding and staying on the platform (mirrors). This is illustrated in
Figure 9.
The ultimate metric is the average revisits, which reflects the number of times the driver’s gaze has been directed at the specified Area of Interest (AOI) through all trials. This statistic elucidates the magnitude of importance associated with the designated AOI. In the context of train arrival procedures, the most common revisits were the front and side window sections (27).
Various categories of train driver operations are the techniques of leaving the station. We studied all actions of the train driver in all four departures from two railway halts and two railway stations throughout the six measurements and established the average characteristics. During the departure processes, the train driver directed his gaze towards the window sector for 41.2% of the overall duration, to the control panel section for 56.3% of the total span, and towards the railway signal sector for 2.2% of the whole period on average (see
Figure 8).
The quantified values of dwell time demonstrate that the locomotive engineer devoted more attention to the manipulation of the panel than to the surveillance through windows or mirrors. Upon analyzing the mean number of fixations on the sections, the total window section had 70.8 and the panel section 107.3, with only five fixations on the railway signal section. This higher mean figure of fixations on the panel section of the cabin reveals the requirement to manipulate, control, and operate the panel controls during the train departure procedure during all trials of the experiment.
Upon assessment of the average fixation time during all train departures, the minimum average fixation time was 41.5 ms (panel L). The greatest average fixation time of 452.9 ms was identified on panel K (refer to
Figure 9). All the necessary data pertaining to the train schedule (as a comprehensive train schedule, and arrival and departure times for each stop at the train section) were situated on panel K. Notations situated on panel L merely served an informative purpose. Consequently, the average fixation duration was insignificant. Nevertheless, the timetable located on panel K had a fundamental role in driving and operating the train; thus, the average fixations were the most prolonged (the cognitive process when the train driver was deciphering the text content from the timetable).
Investigation of the particular Area of Interest (AOI) during train departures demonstrated the magnitude of its impact. In the course of the operation on the railway line, the highest mean values of return visits were observed in the window (front and side windows) region (18.5), Panel E (16.3), and Panel D (13.5). This more detailed analysis enabled distinguishing the disparities in the driver’s actions in distinct (arrival and departure of the train) circumstances. Ultimately, it must be affirmed that the employed procedures and measuring equipment had no influence on the security of the train operations during the experimentation.
In order to further investigate the patterns of driver behavior during the operation of a train arriving and departing from a station, we conducted an in-depth analysis of the activities performed. The aim of the analysis was to identify patterns of train operation based on the test subject’s fixations on objects in the cab and around the train. The initial analysis showed a high degree of fragmentation of the train operator’s views on the different panels in the train cab, so we decided to generalize the areas of interest to the following:
Front window, which will include everything in the driver’s view in front of the train cab (AOI: A—Front Window and C—Railway signals)
Side windows, which will contain everything in view to the right and left of the train cab (AOI: A—Left and right windows, B—Left and right mirrors)
Control panels, which contains the set of control panels in the train cab (all panels in the train cab. AOI: panel D to panel M)
White space, representing the fixation of the train driver on the area outside our investigation.
We analyzed the average values of fixations on our defined regions of interest obtained during the six measurements in each station. The length of fixations on each region of interest over time shows the pattern of cognitive actions of the train driver during the arrival and departure of the train from the stations and railway stops. Stations and railway stops are marked in figures as A “railway stop Predmier”, B “station Dolný Hričov”, C “railway stop Horný Hričov” and D “station Bytča”. We also normalized the length of the analyzed processes and took into account the activities that took place 35 s before the train stopped in the station and 35 s after the train left the station.
In
Figure 10, it is possible to identify the behavior of the driver when the train arrives at the station. The operations performed by the train driver can be divided into three phases. In the initial phases, the driver’s gaze is directed to the situation of what is in front of the train, i.e., the Front Window area. In the middle phase, the driver alternates his attention between the Front window and the Control panels. The driver starts to check the real speed and braking status of the train with the instruments located in the Control panels area. There is a sequence of rapid saccades between the Front window and the Control panels. In the final phase, the driver monitors the situation on the sides of the train through the side windows and mirrors (AOI Side windows). He also focuses his vision on the Control panels area, where he checks the full stop status of the train. Again, a sequence of fast saccades between Control panels and Side windows can be identified.
Figure 11 shows the flow of procedures that the train driver performs when leaving the station. In principle, they can be divided into 2 phases, depending on the speed of the train and the distance from the station. In the initial phase, a visual check of the situation on the side of the train (platform) takes place, as the train driver’s gaze is directed to the Side windows area, and only after the train has started to move does the driver also focus his attention on the Control panels area. At this stage it is possible to identify a significant length of eye fixation on the monitored area of interest. In the second part of the process of the train leaving the station, the tracking of the situation in front of the train starts. It is possible to identify frequent alternation of the driver’s gaze between the Control panels and the Front window. The train at this point is already completely outside the station environment.
Examining the duration of fixations during the arrival and departure of a train from the station provides us with a unique perspective on driver behavior. Oftentimes, fixations are a means of extracting information, and longer fixations indicate a more complex cognitive process. On average, fixations last 200–300 ms. Analyzing the average fixation durations (see
Figure 12), the highest values are seen in the Side windows area. This is likely due to the increased rate of movement in the vicinity of the train during its arrival and departure. When the train arrives at the station (
Figure 12A1–D1), the Frontal window area of interest (AOI) has a higher fixation length value than the Control panels, as identifying potential hazards in front of the train is of utmost importance. Conversely, when the train departs the station (
Figure 12A2–D2), the Control panels gain more attention than the Frontal Window, as the train driver needs to interact with the train controls in order to set the train in motion.
3.6. In-Depth Interview
The eye-tracking measurement was additionally complemented by an in-depth interview with the driver. The conclusions of this interview are as follows:
The train driver stated: “Ensuring safety and the safety of others was paid attention to during the drive by following the rules of the railway, monitoring speed and the speed of other trains, and being aware of surroundings. The traffic around, including other trains, track-side objects, and any other objects on the track were monitored, as well as railway signals, crossings, and any changes in the environment”.
Each railway operative must develop and adhere to comprehensive protocols and routines derived from their own experiences and conduct, which can be time consuming and costly as well as encouraging the acquisition of substandard railway operating behaviors and precipitating hazardous situations and collisions.
To sum it up, eye-tracking research revealed that the driver’s gaze was particularly attentive to the safety elements of the cockpit, and that he was able to quickly and accurately identify the controls he needed to ensure the safety of the train. Furthermore, the research revealed that the driver had strong cognitive abilities and was able to quickly and accurately identify the controls he needed to operate the train.
4. Discussion
Sustainable security in rail transportation systems is a critical issue, directly impacting the sustainability of the entire rail transport sector. To mitigate the increasing number of tragic railway accidents, train operators and infrastructural providers must implement various signaling and train protection systems. According to Edkins and Pollock’s research on railway traffic accidents, the behavior of train drivers is the most significant factor [
19]. In our research, we employed user testing with eye-tracking technology to study the activities and behavior of drivers in real traffic conditions. This innovative method has great potential for future use in the railway sector. The results of the measurement of the train driver’s actions can be utilized to better comprehend the driver’s work and to recognize beneficial practices and skills. As Lorenz’s work stipulates, recognizing route knowledge and sharing it with other drivers is essential for enhancing railway safety [
20].
The aforementioned measurement and its outcomes provide evidence of the authors’ research into railway safety. The investigation was conducted by a highly experienced driver, with an impeccable safety record, in real-world conditions, on a genuine track, with passengers on board (not in a simulated environment). This experiment confirmed the proof of concept and validated the methods and methodology in actual operation. We have identified a set of driver attention sequences that are applicable to different types of rail stations, which we consider to be the best practice based on the extensive practical experience of train drivers. Additionally, we are exploring the importance of the interior equipment (panels) in the train cabin for the driver during the arrival and departure of the train. This level of significance is reflected in the average dwelling time and the average duration of the driver’s gaze on a particular panel. During the aforementioned train operations, the cognitive process of the driver was measured by the average time spent fixating on a specific panel within the cabin. By comparing the average data collected in the arrival and departure procedures, we have been able to demonstrate the various levels of importance of the panels and the duration of the driver’s cognitive processes. All these results will be used as a reference for further research.
Research Limitations of this study can be summed as following:
The number of participants limits the study. Although we conducted the measurement six times, we had only one participant. Increasing the number of participants can help ensure better validity and reliability of the research results.
The study was conducted on only two train stations and two railway stops, which may limit the generalizability of the results.
The study used eye-tracking methodology, which is limited to visual attention and may not capture all aspects of the driver’s cognitive processes.
The methodology and technology may not be applicable to all railway systems, and further research is needed to assess its applicability in different systems.
Future research in our field of driver activity measurement (as seen in other modes of transport [
26,
27,
28,
29,
30,
31,
32]) will involve the following stages:
Testing the behavior, attentiveness and activity of drivers in an anomalous work environment through the implementation of eye-tracking technology and comparing the results to a reference benchmark established by the experiment.
Exploring the activities of various driver profiles and collecting and classifying data regarding their psychological characteristics, capabilities and experiences through a combination of eye-tracking and electroencephalography (EEG) technology.
Revising existing teaching approaches for novice train drivers and devising novel methods of assessing train driver skills.
Disseminating the “route knowledge” of experienced train drivers to rookie drivers or novices with a particular focus on the attention sequences in the train cabin.
Verification of the efficacy of the proof of concept and validation of the techniques and methods in actual operation should proceed in forthcoming research with experimentally altered internal (inside the cabin) and external (climatic, luminous) circumstances, with various competent and experienced drivers’ operation circumstances. The upcoming research offers numerous new chances and should result in examination for a superior comprehension of the driver’s means of operating and amplify the railway transport system’s sustainability and security.


