
A Powerful Predicting Model for Financial Statement Fraud Based on Optimized XGBoost Ensemble Learning Technique


Abstract
:1. Introduction
Motivation and Contribution
2. Related Research
3. Data and Methodology
3.1. Data
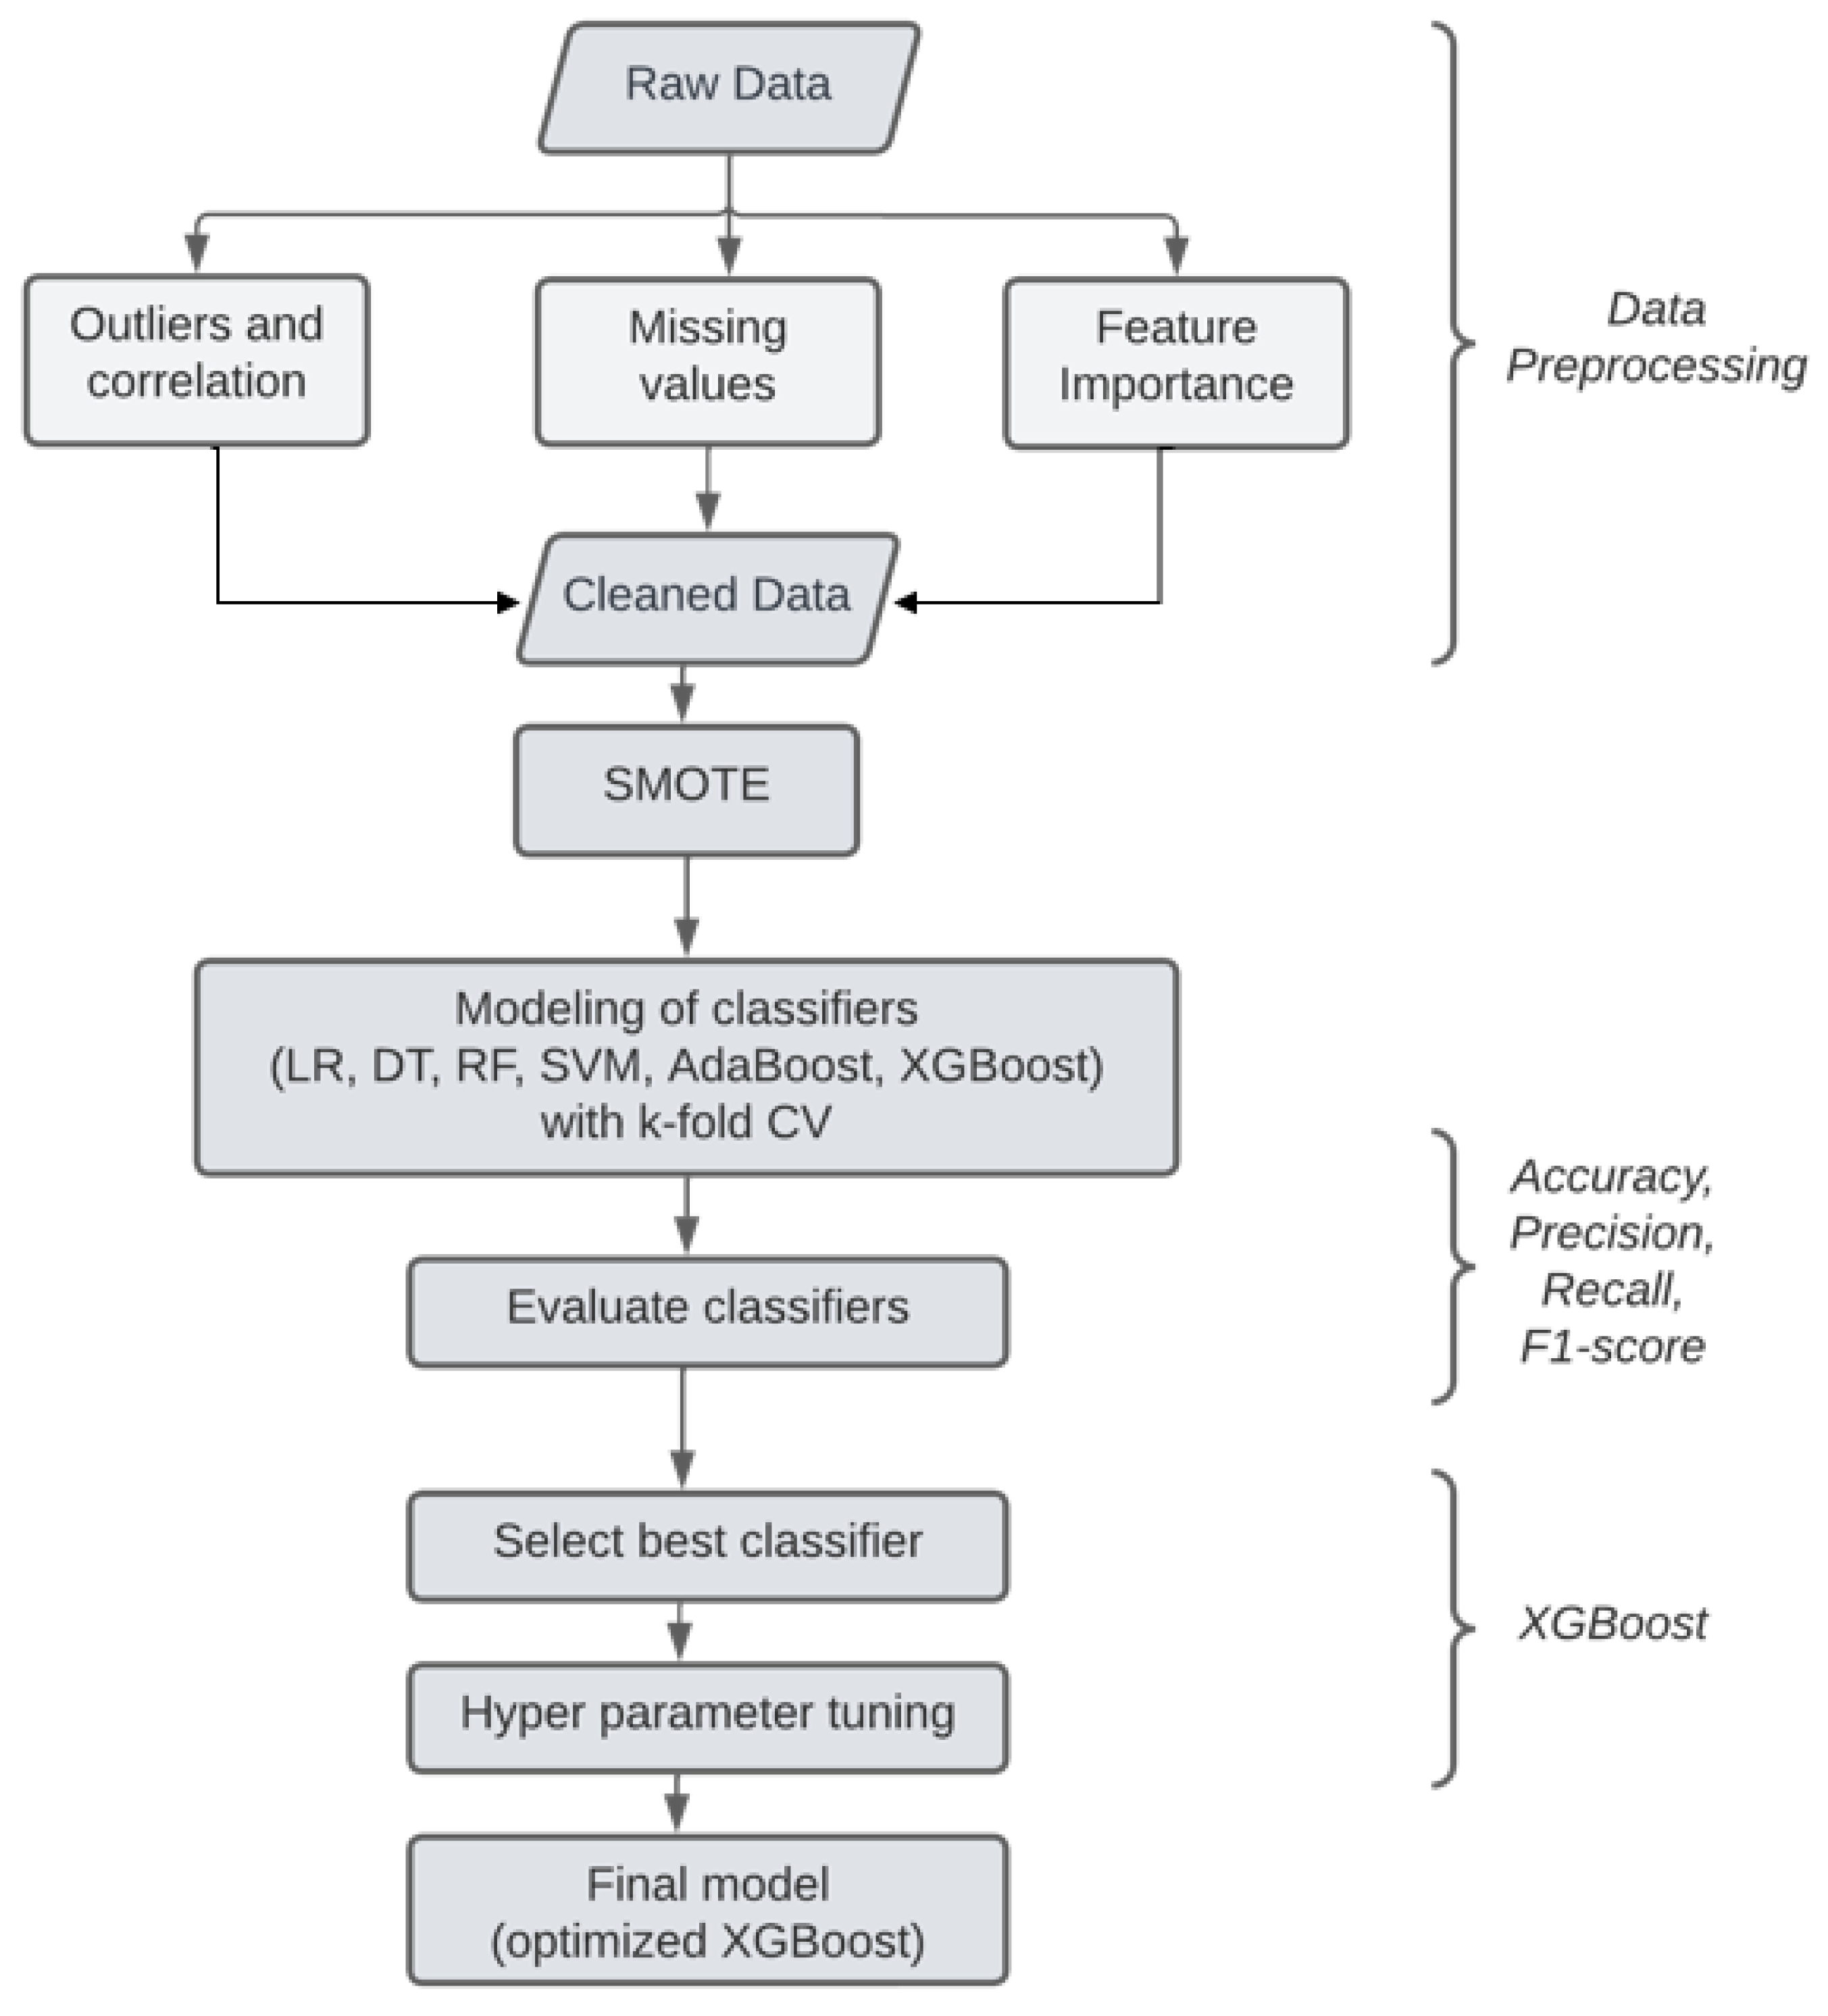
3.2. Methodology
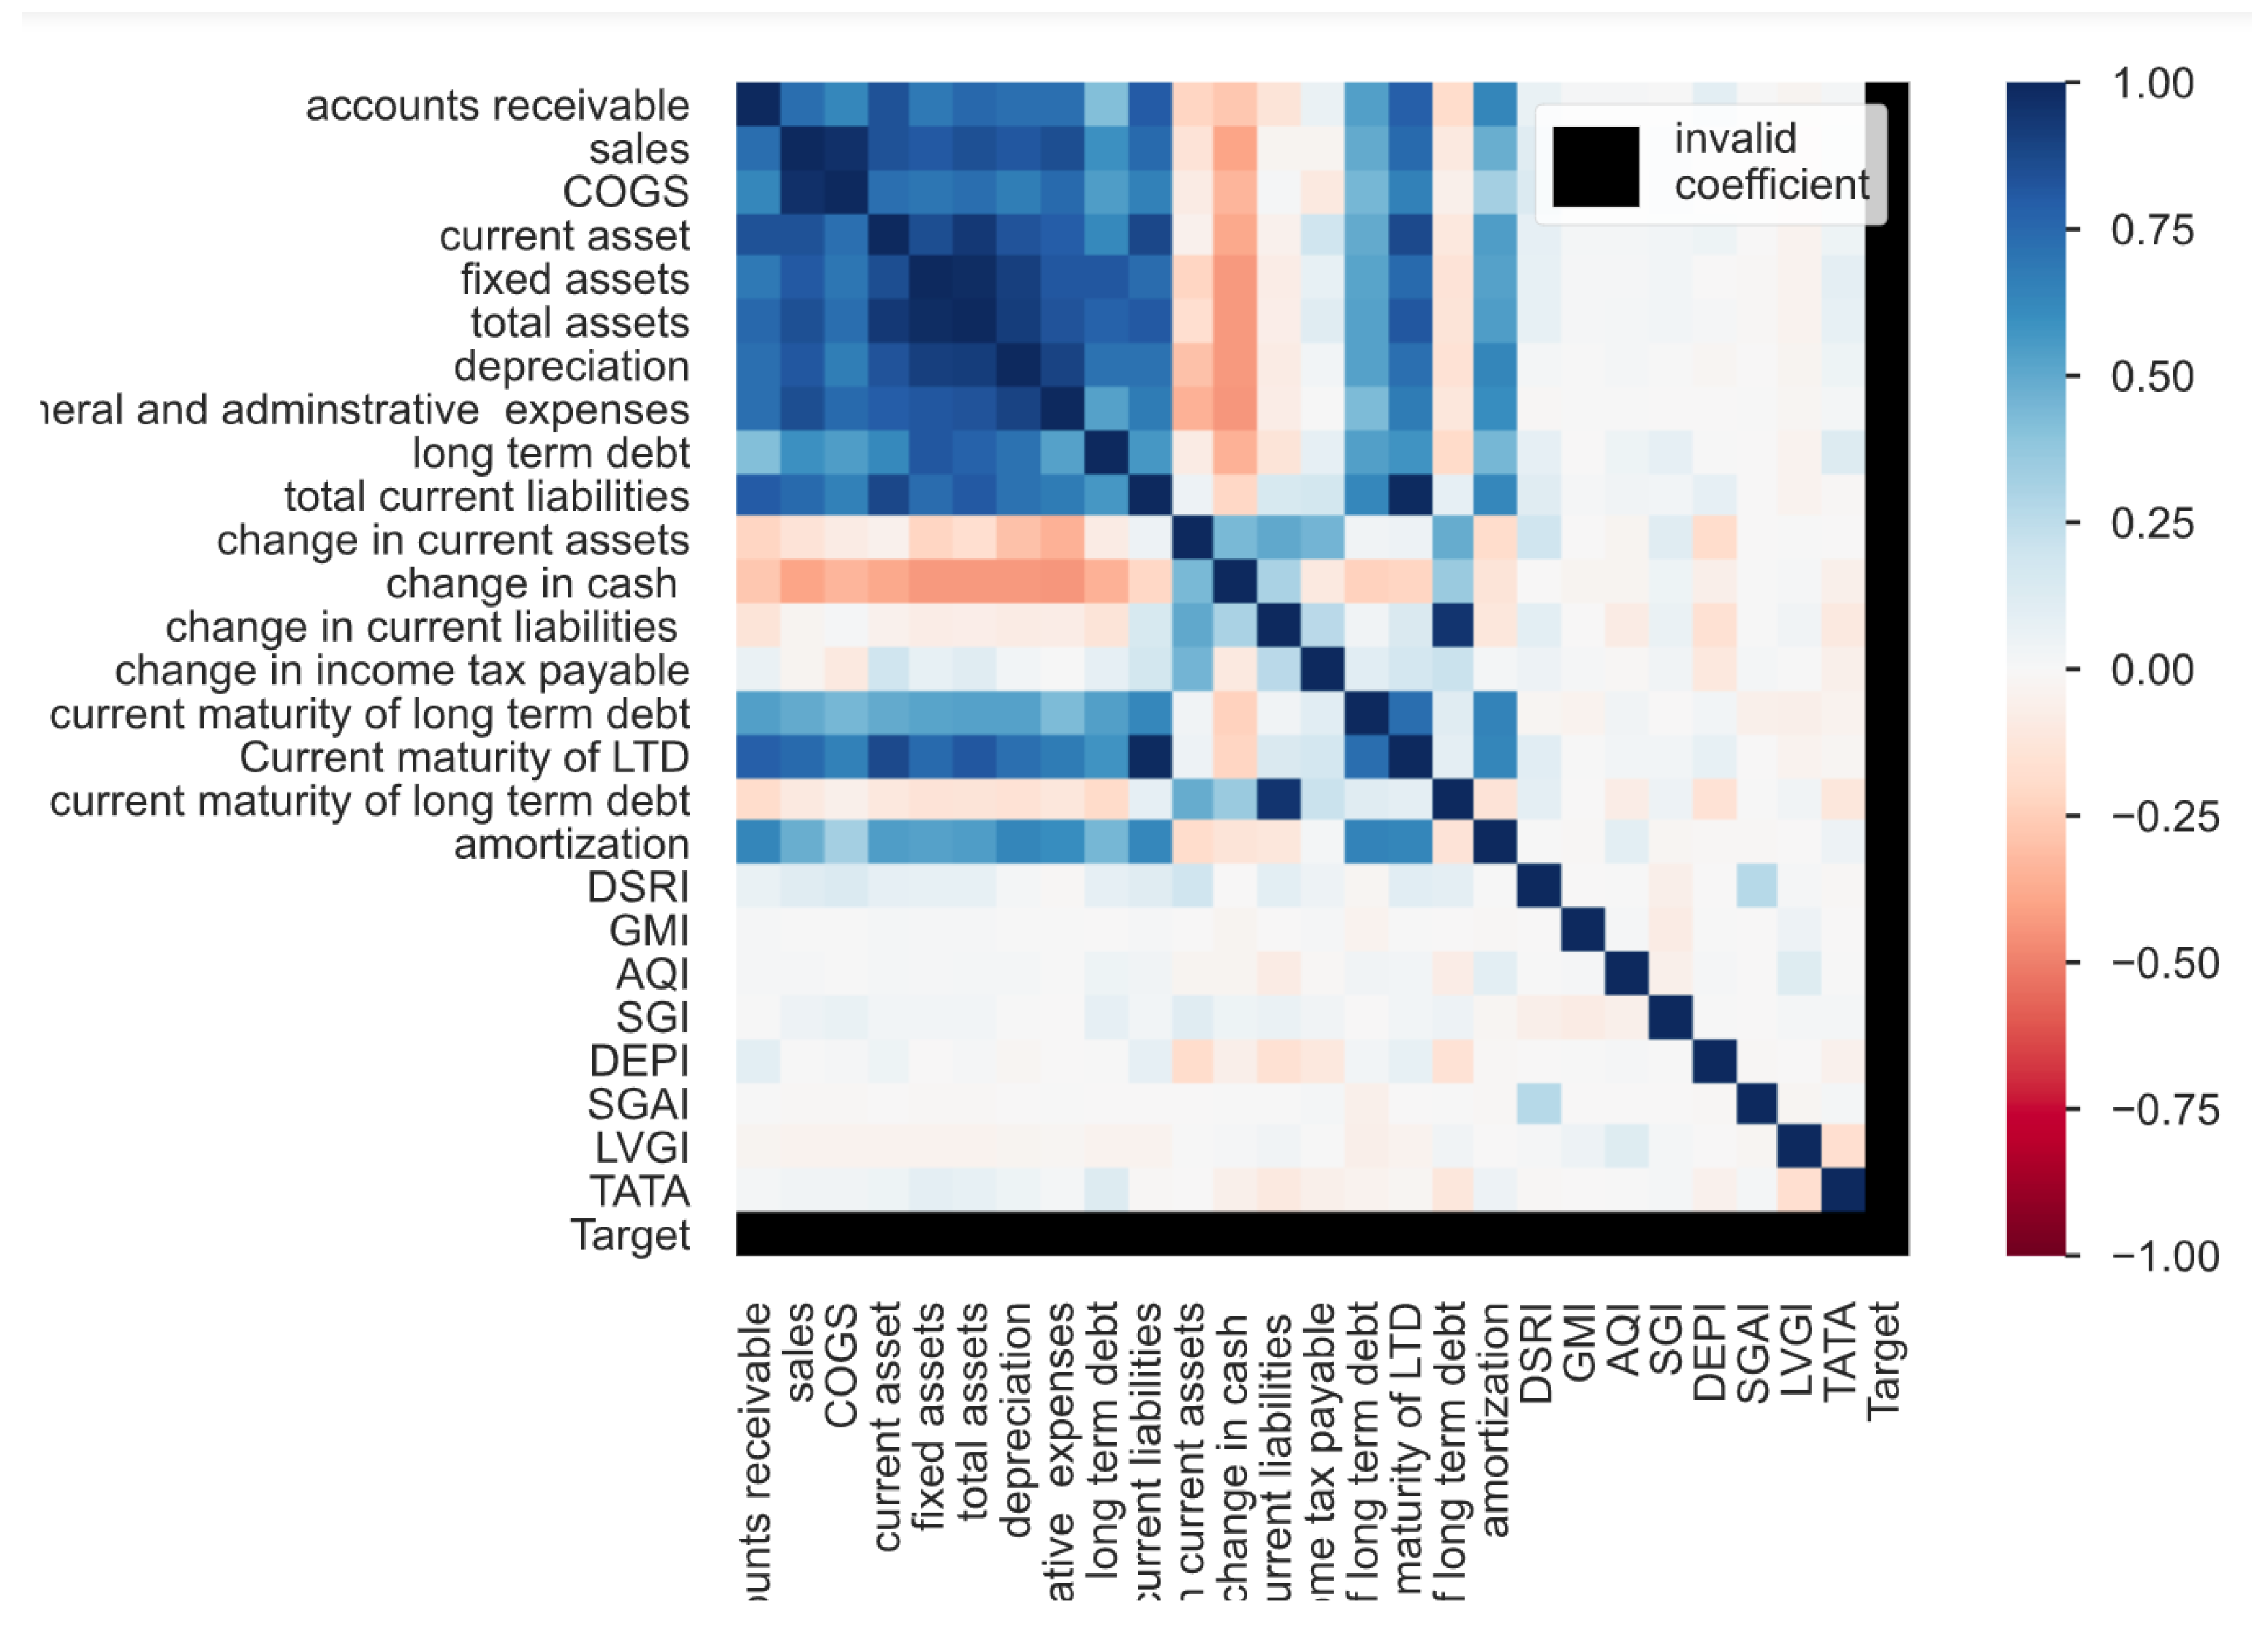
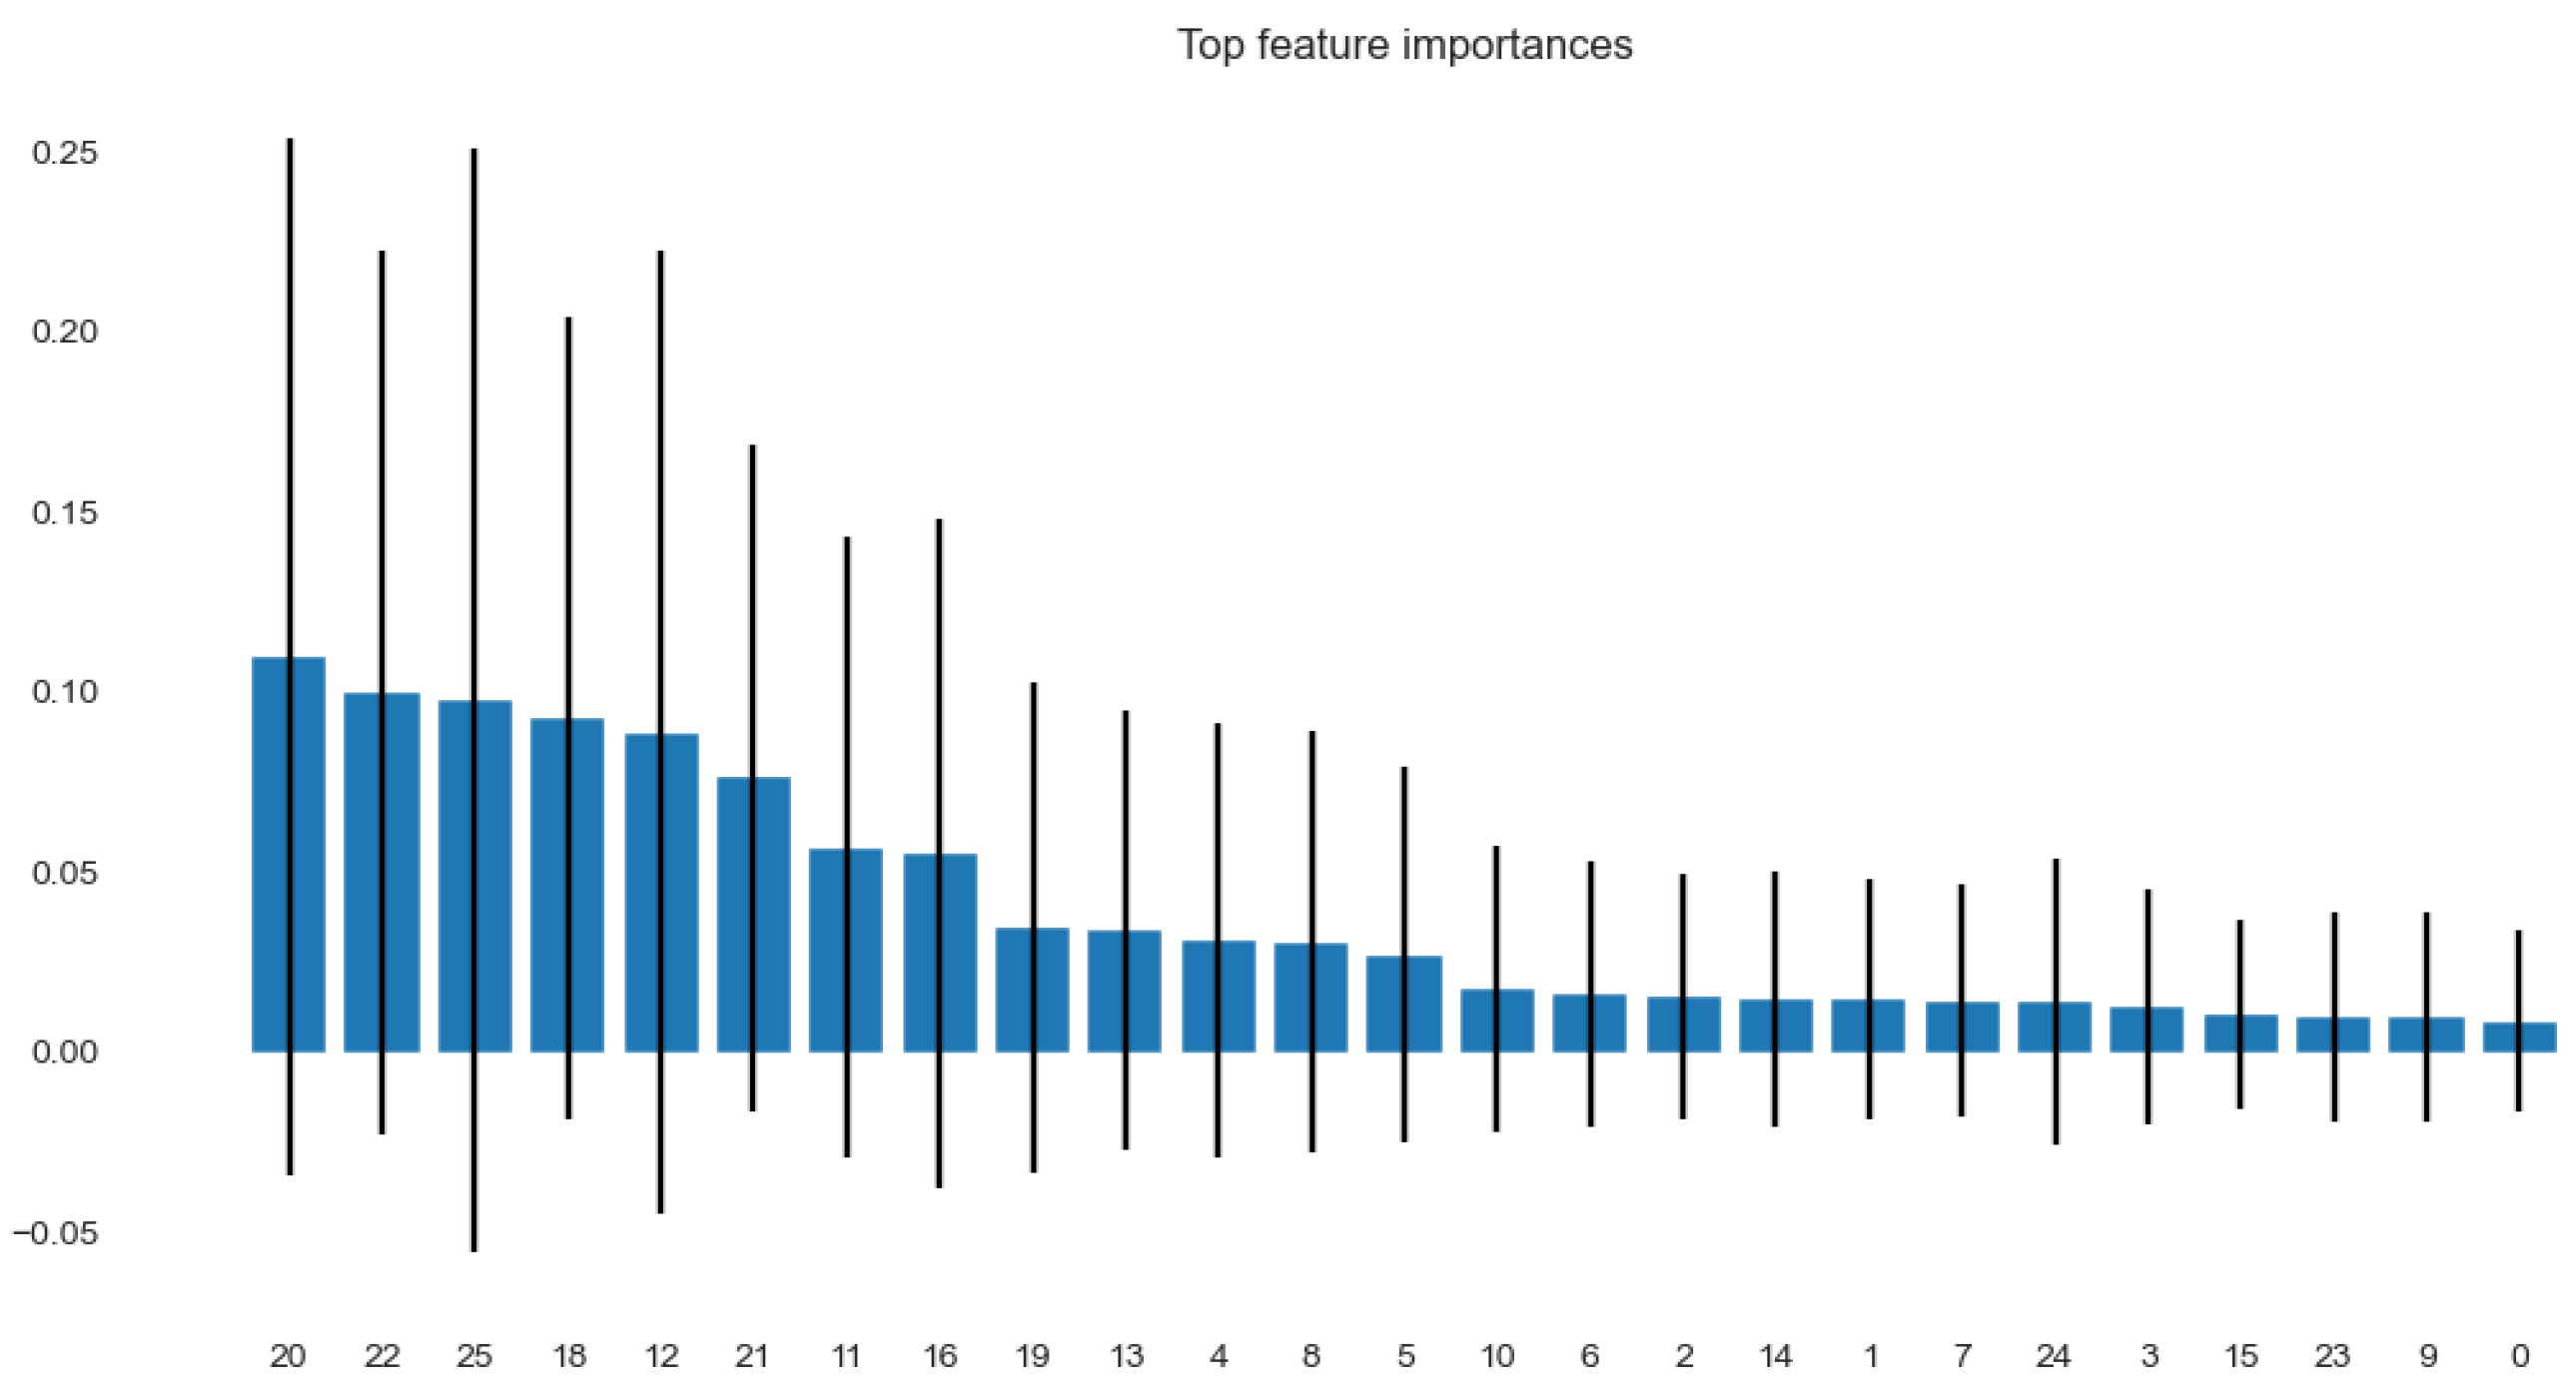
3.2.1. Data Preprocessing
3.2.2. Synthetic Minority Oversampling Technique (SMOTE)
3.2.3. Base Classifiers: SVM, DT, and LR
Support Vector Machine (SVM)
Decision Tree (DT)
Logistic Regression (LR)
3.2.4. Ensembles: RF, AdaBoost, and XGBoost
Random Forest (RF)
AdaBoost
XGBoost
4. Implementation and Analysis
4.1. Implementation
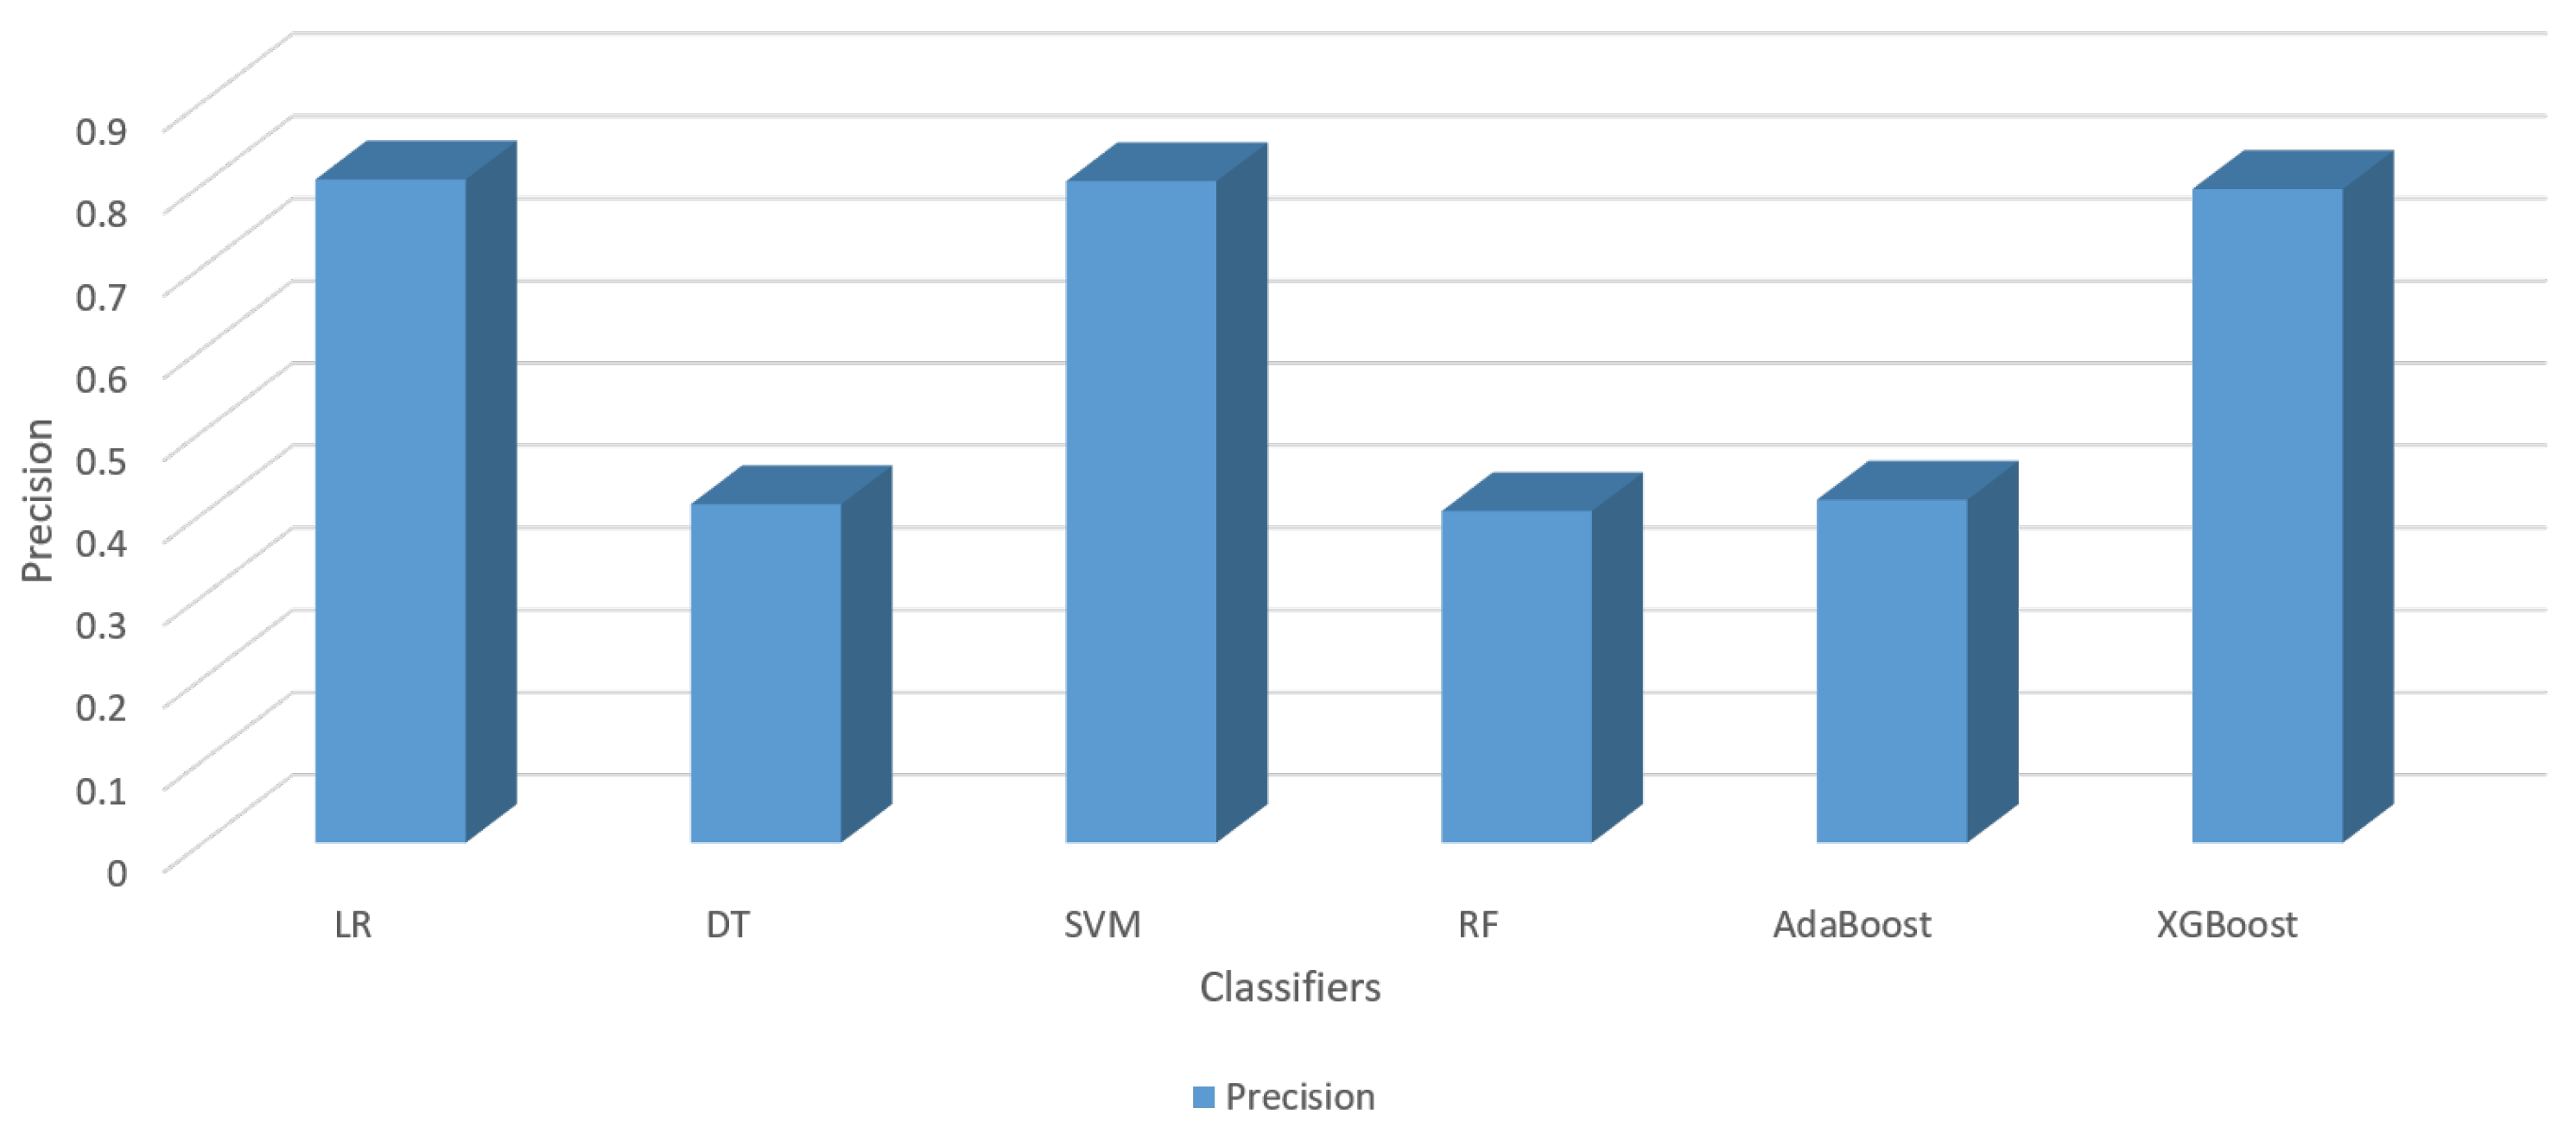
4.2. Performance Measures
4.3. Analysis
4.4. XGBoost Optimization
- learning _rate: [0.03, 0.01, 0.003, 0.001],
- min_child_weight: [1, 3, 5, 7, 10],
- gamma: [0, 0.5, 1, 1.5, 2, 2.5, 5],
- subsample: [0.6, 0.8, 1.0, 1.2, 1.4],
- colsample_bytree: [0.6, 0.8, 1.0, 1.2, 1.4],
- max_depth: [3, 4, 5, 6, 7, 8, 9, 10, 12, 14],
- reg_lambda:[0.4, 0.6, 0.8, 1, 1.2, 1.4]
- learning_rate: 0.03,
- min_child_weight: 3,
- gamma: 1.5,
- subsample: 0.8,
- colsample_bytree: 1.0,
- max_depth: 9,
- reg_lambda: 1
5. Conclusions
Author Contributions
Funding
Informed Consent Statement
Data Availability Statement
Conflicts of Interest
Abbreviations
| MENA | Middle East and North Africa |
| XGBoost | eXtreme Gradient Boosting |
| SMOTE | Synthetic Minority Oversampling Technique |
| FSF | Financial Statement Fraud |
| ML | Machine Learning |
| LR | Logistic Regression |
| DT | Decision Tree |
| SVM | Support Vector Machine |
| RF | Random Forest |
| NN | Neural Network |
| ANN | Artificial Neural Network |
| NB | Naive Bayes |
| GP | Genetic Programming |
| LDA | Linear Discriminant Analysis |
| MLP | Multi-Layer Perceptron |
| RBF | Radial Basis Function |
| KNN | K Nearest Neighbors |
| BN | Bayesian Network |
| BBN | Bayesian Belief Network |
| CART | Classification And Regression Tree |
| DA | Discriminant Analysis |
| SGB | Stochastic Gradient Boosting |
| ACFE | Association of Certified Fraud Examiners |
| CAQ | Center for Audit Quality |
| AAER | Accounting and Auditing Enforcement Releases |
| AUC | Area Under the receiver operating characteristic Curve |
| Acc | Accuracy |
| TP | True Positive |
References
- El-Bannany, M.; Sreedharan, M.; Khedr, A.M. A robust deep learning model for financial distress prediction. Int. J. Adv. Comput. Sci. Appl. 2020, 11, 170–175. [Google Scholar] [CrossRef]
- Kulikova, L.; Satdarova, D. Internal control and compliance-control as effective methods of management, detection and prevention of financial statement fraud. Acad. Strateg. Manag. J. 2016, 15, 92. [Google Scholar]
- Deebak, B.; Memon, F.H.; Dev, K.; Khowaja, S.A.; Wang, W.; Qureshi, N.M.F. TAB-SAPP: A trust-aware blockchain-based seamless authentication for massive IoT-enabled industrial applications. IEEE Trans. Ind. Inform. 2022, 19, 243–250. [Google Scholar] [CrossRef]
- Sreedharan, M.; Khedr, A.M.; El Bannany, M. A Multi-Layer Perceptron Approach to Financial Distress Prediction with Genetic Algorithm. Autom. Control. Comput. Sci. 2020, 54, 475–482. [Google Scholar] [CrossRef]
- Kumar, R.; Tripathi, R. Secure healthcare framework using blockchain and public key cryptography. In Blockchain Cybersecurity, Trust and Privacy; Springer: Cham, Switzerland, 2020; pp. 185–202. [Google Scholar]
- Andrew, C.; Robin. Detecting Fraudulent of Financial Statements Using Fraud S.C.O.R.E Model and Financial Distress. Int. J. Econ. Bus. Account. Res. (IJEBAR) 2022, 6, 211–222. [Google Scholar] [CrossRef]
- Paulo Sérgio Gomes Macedo, H.C.I.; Vieira, E.S. A model to detect financial statement fraud in Portuguese companies by the auditor. Contaduría Adm. 2022, 67, 185–209. [Google Scholar]
- Wadhwa, A.V.K.; Kumar, S. Financial Fraud Prediction Models: A Review of Research Evidence. Int. J. Sci. Technol. Res. 2020, 9, 677–680. [Google Scholar]
- Amar, I.A.A.B.; Jarboui, A. Detection of Fraud in Financial Statements: French Companies as a Case Study. Int. J. Acad. Res. Bus. Soc. Sci. 2013, 3, 456–472. [Google Scholar] [CrossRef]
- Alsinglawi, M.M.A.S.M.A.O.; Almari, M.O.S. Predicting Fraudulent Financial Statements Using Fraud Detection Models. Acad. Strateg. Manag. 2021, 20, 1–17. [Google Scholar]
- Schreiber-Gregory, D.; Bader, K. Logistic and Linear Regression Assumptions: Violation Recognition and Control. In Proceedings of the SESUG Conference, St. Pete Beach, FL, USA, 14–17 October 2018; pp. 1–6. [Google Scholar]
- Pintelas, P.; Livieris, I. Ensemble learning and their applications. Algorithms 2020, 1–184. [Google Scholar]
- Beneish, M.D. The detection of earnings manipulation. Financ. Anal. J. 1999, 55, 24–36. [Google Scholar] [CrossRef]
- Bao, Y.; Ke, B.; Li, B.; Yu, Y.J.; Zhang, J. Detecting accounting fraud in publicly traded US firms using a machine learning approach. J. Account. Res. 2020, 58, 199–235. [Google Scholar] [CrossRef]
- Fernández-Delgado, M.; Cernadas, E.; Barro, S.; Amorim, D. Do we need hundreds of classifiers to solve real world classification problems? J. Mach. Learn. Res. 2014, 15, 3133–3181. [Google Scholar]
- Gorenc, M. Empirical evidence of financial statement manipulation during economic recessions. Management 2019, 14, 19–31. [Google Scholar] [CrossRef]
- Tilden, C.; Janes, T. Benford’s Law as a Useful Tool to Determine Fraud in Financial Statements. J. Financ. Account. 2012, 14, 1–15. [Google Scholar]
- Saville, A. Using Benford’s Law to Detect Data Error and Fraud: An Examination Of Companies Listed on the Johannesburg Stock Exchange. SAJEMS 2006, 9, 341–354. [Google Scholar] [CrossRef]
- Mohammadi, M.; Yazdani, S.; Khanmohammadi, M.H.; Maham, K. Financial reporting fraud detection: An analysis of data mining algorithms. Int. J. Financ. Manag. Account. 2020, 4, 1–12. [Google Scholar]
- Humpherys, S.L.; Moffitt, K.C.; Burns, M.B.; Burgoon, J.K.; Felix, W.F. Identification of fraudulent financial statements using linguistic credibility analysis. Decis. Support Syst. 2011, 50, 585–594. [Google Scholar] [CrossRef]
- West, J.; Bhattacharya, M.; Islam, R. Intelligent financial fraud detection practices: An investigation. In Proceedings of the International Conference on Security and Privacy in Communication Networks, Beijing, China, 24–26 September 2014; Springer: Cham, Switzrland, 2014; pp. 186–203. [Google Scholar]
- Hamal, S.; Senvar, Ö. Comparing performances and effectiveness of machine learning classifiers in detecting financial accounting fraud for Turkish SMEs. Int. J. Comput. Intell. Syst. 2021, 14, 769–782. [Google Scholar] [CrossRef]
- Craja, P.; Kim, A.; Lessmann, S. Deep learning for detecting financial statement fraud. Decis. Support Syst. 2020, 139, 113421. [Google Scholar] [CrossRef]
- Gupta, S.; Mehta, S.K. Data mining-based financial statement fraud detection: Systematic literature review and meta-analysis to estimate data sample mapping of fraudulent companies against non-fraudulent companies. Glob. Bus. Rev. 2021, 1–26. [Google Scholar] [CrossRef]
- Cecchini, M.; Aytug, H.; Koehler, G.J.; Pathak, P. Detecting management fraud in public companies. Manag. Sci. 2010, 56, 1146–1160. [Google Scholar] [CrossRef]
- Pai, P.F.; Hsu, M.F.; Wang, M.C. A support vector machine-based model for detecting top management fraud. Knowl.-Based Syst. 2011, 24, 314–321. [Google Scholar] [CrossRef]
- Alfaiz, N.S.; Fati, S.M. Enhanced Credit Card Fraud Detection Model Using Machine Learning. Electronics 2022, 11, 662. [Google Scholar] [CrossRef]
- Strelcenia, E.; Prakoonwit, S. Improving Classification Performance in Credit Card Fraud Detection by Using New Data Augmentation. AI 2023, 4, 172–198. [Google Scholar] [CrossRef]
- Kumar, S.; Ahmed, R.; Bharany, S.; Shuaib, M.; Ahmad, T.; Tag Eldin, E.; Rehman, A.U.; Shafiq, M. Exploitation of Machine Learning Algorithms for Detecting Financial Crimes Based on Customers’ Behavior. Sustainability 2022, 14, 13875. [Google Scholar] [CrossRef]
- Albashrawi, M. Detecting financial fraud using data mining techniques: A decade review from 2004 to 2015. J. Data Sci. 2016, 14, 553–569. [Google Scholar] [CrossRef]
- Perols, J. Financial statement fraud detection: An analysis of statistical and machine learning algorithms. Audit. J. Pract. Theory 2011, 30, 19–50. [Google Scholar] [CrossRef]
- Asimit, A.V.; Kyriakou, I.; Santoni, S.; Scognamiglio, S.; Zhu, R. Robust Classification via Support Vector Machines. Risks 2022, 10, 154. [Google Scholar] [CrossRef]
- Moepya, S.O.; Akhoury, S.S.; Nelwamondo, F.V. Cost-sensitive classification for financial fraud detection under high class-imbalance. In Proceedings of the 2014 IEEE international conference on data mining workshop, Shenzhen, China, 14–17 December 2014; IEEE: New York, NY, USA, 2014; pp. 183–192. [Google Scholar]
- Yao, J.; Pan, Y.; Yang, S.; Chen, Y.; Li, Y. Detecting fraudulent financial statements for the sustainable development of the socio-economy in China: A multi-analytic approach. Sustainability 2019, 11, 1579. [Google Scholar] [CrossRef]
- Han, D. Researches of Detection of Fraudulent Financial Statements Based on Data Mining. J. Comput. Theor. Nanosci. 2017, 14, 32–36. [Google Scholar] [CrossRef]
- Lin, C.C.; Chiu, A.A.; Huang, S.Y.; Yen, D.C. Detecting the financial statement fraud: The analysis of the differences between data mining techniques and experts’ judgments. Knowl.-Based Syst. 2015, 89, 459–470. [Google Scholar] [CrossRef]
- Ravisankar, P.; Ravi, V.; Rao, G.R.; Bose, I. Detection of financial statement fraud and feature selection using data mining techniques. Decis. Support Syst. 2011, 50, 491–500. [Google Scholar] [CrossRef]
- Rizki, A.A.; Surjandari, I.; Wayasti, R.A. Data mining application to detect financial fraud in Indonesia’s public companies. In Proceedings of the 2017 3rd International Conference on Science in Information Technology (ICSITech), Bandung, Indonesia, 25–26 October 2017; IEEE: New York, NY, USA, 2017; pp. 206–211. [Google Scholar]
- Murorunkwere, B.F.; Tuyishimire, O.; Haughton, D.; Nzabanita, J. Fraud Detection Using Neural Networks: A Case Study of Income Tax. Future Internet 2022, 14, 168. [Google Scholar] [CrossRef]
- Pérez López, C.; Delgado Rodríguez, M.; de Lucas Santos, S. Tax Fraud Detection through Neural Networks: An Application Using a Sample of Personal Income Taxpayers. Future Internet 2019, 11, 86. [Google Scholar] [CrossRef]
- Gupta, R.; Gill, N.S. Prevention and detection of financial statement fraud–An implementation of data mining framework. Editor. Pref. 2012, 3, 150–160. [Google Scholar] [CrossRef]
- Chen, S. Detection of fraudulent financial statements using the hybrid data mining approach. SpringerPlus 2016, 5, 1–16. [Google Scholar] [CrossRef] [PubMed]
- Misstatements; Bertomeu, J.; Cheynel, E.; Floyd, E.; Pan, W. Ghost in the Machine: Using Machine Learning to Uncover Hidden; Springer: Cham, Switzrland, 2018; Volume 4, pp. 233–241. [Google Scholar]
- Whiting, D.G.; Hansen, J.V.; McDonald, J.B.; Albrecht, C.; Albrecht, W.S. Machine learning methods for detecting patterns of management fraud. Comput. Intell. 2012, 28, 505–527. [Google Scholar] [CrossRef]
- Song, X.P.; Hu, Z.H.; Du, J.G.; Sheng, Z.H. Application of machine learning methods to risk assessment of financial statement fraud: Evidence from China. J. Forecast. 2014, 33, 611–626. [Google Scholar] [CrossRef]
- Yao, J.; Zhang, J.; Wang, L. A financial statement fraud detection model based on hybrid data mining methods. In Proceedings of the 2018 International Conference on Artificial Intelligence and Big Data (ICAIBD), Chengdu, China, 26–28 May 2018; IEEE: New York, NY, USA, 2018; pp. 57–61. [Google Scholar]
- Hajek, P.; Henriques, R. Mining corporate annual reports for intelligent detection of financial statement fraud—A comparative study of machine learning methods. Knowl.-Based Syst. 2017, 128, 139–152. [Google Scholar] [CrossRef]
- Li, H.; Wong, M.L. Financial fraud detection by using Grammar-based multi-objective genetic programming with ensemble learning. In Proceedings of the 2015 IEEE Congress on Evolutionary Computation (CEC), Sendai, Japan, 25–28 May 2015; IEEE: New York, NY, USA, 2015; pp. 1113–1120. [Google Scholar]
- Ragab, Y. Financial Ratios and Fraudulent Financial Statements Detection: Evidence from Egypt. Int. J. Acad. Res. 2017, 4, 1–6. [Google Scholar]
- Kanapickiene, R.; Grundiene, Z. The Model of Fraud Detection in Financial Statements by Means of Financial Ratios. Procedia Soc. Behav. Sci. 2015, 213, 321–327. [Google Scholar] [CrossRef]
- Grove, H.; Basilico, E. Fraudulent Financial Reporting Detection Key Ratios Plus Corporate Governance Factors. Int. Stud. Mgt. Org. 2008, 38, 10–42. [Google Scholar] [CrossRef]
- Gu, Q.; Zhu, L.; Cai, Z. Evaluation measures of the classification performance of imbalanced data sets. In Proceedings of the Computational Intelligence and Intelligent Systems: 4th International Symposium, ISICA 2009, Huangshi, China, 23–25 October 2009; Proceedings 4. Springer: Cham, Switzerland, 2009; pp. 461–471. [Google Scholar]
- Khedr, A.M.; Mahmoud, R. Agents for integrating distributed data for function computations. Comput. Inform. 2012, 31, 1101–1125. [Google Scholar]
- Khedr, A.M.; Mahmoud, R. Decomposable naive Bayes classifier for partitioned data. Comput. Inform. 2012, 31, 1511–1531. [Google Scholar]
- Khedr, A.M.; Raj, P.P. DRNNA: Decomposable Reverse Nearest Neighbor Algorithm for Vertically Distributed Databases. In Proceedings of the 2021 18th International Multi-Conference on Systems, Signals and Devices (SSD), Monastir, Tunisia, 22–25 March 2021; pp. 681–686. [Google Scholar]
- Khedr, A.M. Decomposable algorithm for computing k-nearest neighbours across partitioned data. Int. J. Parallel Emergent Distrib. Syst. 2016, 31, 334–353. [Google Scholar] [CrossRef]
- Khedr, A.M.; Osamy, W.; Salim, A.; Salem, A. Privacy preserving data mining approach for IoT based WSN in smart city. Int. J. Adv. Comput. Sci. Appl. 2019, 10, 555–563. [Google Scholar] [CrossRef]
- Palanivinayagam, A.; Damaševičius, R. Effective Handling of Missing Values in Datasets for Classification Using Machine Learning Methods. Information 2023, 14, 92. [Google Scholar] [CrossRef]
- Kim, T.; Ko, W.; Kim, J. Analysis and Impact Evaluation of Missing Data Imputation in Day-ahead PV Generation Forecasting. Appl. Sci. 2019, 9, 204. [Google Scholar] [CrossRef]
- França, C.M.; Couto, R.S.; Velloso, P.B. Missing Data Imputation in Internet of Things Gateways. Information 2021, 12, 425. [Google Scholar] [CrossRef]
- Weed, L.; Lok, R.; Chawra, D.; Zeitzer, J. The Impact of Missing Data and Imputation Methods on the Analysis of 24-Hour Activity Patterns. Clocks Sleep 2022, 4, 497–507. [Google Scholar] [CrossRef]
- Chawla, N.V.; Bowyer, K.W.; Hall, L.O.; Kegelmeyer, W.P. SMOTE: Synthetic minority over-sampling technique. J. Artif. Intell. Res. 2002, 16, 321–357. [Google Scholar] [CrossRef]
- Elreedy, D.; Atiya, A.F. A comprehensive analysis of synthetic minority oversampling technique (SMOTE) for handling class imbalance. Inf. Sci. 2019, 505, 32–64. [Google Scholar] [CrossRef]
- Rivera, W.A.; Xanthopoulos, P. A priori synthetic over-sampling methods for increasing classification sensitivity in imbalanced data sets. Expert Syst. Appl. 2016, 66, 124–135. [Google Scholar] [CrossRef]
- Goyal, A.; Rathore, L.; Kumar, S. A survey on solution of imbalanced data classification problem using smote and extreme learning machine. In Communication and Intelligent Systems: Proceedings of ICCIS 2020; Springer: Cham, Switzerland, 2021; pp. 31–44. [Google Scholar]
- Mishra, S. Handling imbalanced data: SMOTE vs. random undersampling. Int. Res. J. Eng. Technol. (IRJET) 2017, 4, 317–320. [Google Scholar]
- Cortes, C.; Vapnik, V. Support-vector networks. Mach. Learn. 1995, 20, 273–297. [Google Scholar] [CrossRef]
- Alhashmi, S.M.; Khedr, A.M.; Arif, I.; El Bannany, M. Using a Hybrid-Classification Method to Analyze Twitter Data During Critical Events. IEEE Access 2021, 9, 141023–141035. [Google Scholar] [CrossRef]
- Wu, X.; Kumar, V.; Quinlan, J.R.; Ghosh, J.; Yang, Q.; Motoda, H.; McLachlan, G.J.; Ng, A.; Liu, B.; Philip, S.Y.; et al. Top 10 algorithms in data mining. Knowl. Inf. Syst. 2008, 14, 1–37. [Google Scholar] [CrossRef]
- Khedr, A.M.; Arif, I.; P V, P.R.; El-Bannany, M.; Alhashmi, S.M.; Sreedharan, M. Cryptocurrency price prediction using traditional statistical and machine-learning techniques: A survey. Intell. Syst. Account. Financ. Manag. 2021, 28, 3–34. [Google Scholar] [CrossRef]
- Cramer, J.S. The origins of logistic regression. SSRN 2002, 119, 1–16. [Google Scholar] [CrossRef]
- Randhawa, K.; Loo, C.K.; Seera, M.; Lim, C.P.; Nandi, A.K. Credit card fraud detection using AdaBoost and majority voting. IEEE Access 2018, 6, 14277–14284. [Google Scholar] [CrossRef]
- Ho, T.K. Random decision forests. In Proceedings of the 3rd International Conference on Document Analysis and Recognition, Lausanne, Switzerland, 5–10 September 1995; IEEE: New York, NY, USA, 1995; Volume 1, pp. 278–282. [Google Scholar]
- Lin, W.; Wu, Z.; Lin, L.; Wen, A.; Li, J. An ensemble random forest algorithm for insurance big data analysis. IEEE Access 2017, 5, 16568–16575. [Google Scholar] [CrossRef]
- Freund, Y.; Schapire, R.E. A decision-theoretic generalization of on-line learning and an application to boosting. J. Comput. Syst. Sci. 1997, 55, 119–139. [Google Scholar] [CrossRef]
- Sun, J.; Jia, M.Y.; Li, H. AdaBoost ensemble for financial distress prediction: An empirical comparison with data from Chinese listed companies. Expert Syst. Appl. 2011, 38, 9305–9312. [Google Scholar] [CrossRef]
- Sreedharan, M.; Khedr, A.M.; El Bannany, M. A comparative analysis of machine learning classifiers and ensemble techniques in financial distress prediction. In Proceedings of the 2020 17th International Multi-Conference on Systems, Signals & Devices (SSD), Monastir, Tunisia, 20–23 July 2020; IEEE: New York, NY, USA, 2020; pp. 653–657. [Google Scholar]
- Chen, T.; Guestrin, C. Xgboost: A scalable tree boosting system. In Proceedings of the KDD 16: Proceedings of the 22nd ACM SIGKDD International Conference on Knowledge Discovery and Data Mining, San Francisco, CA, USA, 13–17 August 2016; pp. 785–794. [Google Scholar] [CrossRef] [Green Version]


| Year & Ref. | Methods | Data Source (Fraud: Non-Fraud) | Input Features | Best Model (Performance in %) | Limitations |
|---|---|---|---|---|---|
| 2010 [25] | Probit, NN, LR, SVM | AAER (205:6427) | 23 raw variables | SVM (AUC – 87.8) | Unable to provide adequate fraud detection capabilities, limited features germane to the domain of fraud detection. |
| 2011 [26] | LR, LDA, C4.5, MLP, RBF, SVM | Taiwan Stock Exchange (25:50) | 15 financial ratios + 3 raw variables | SVM (Acc - 92) | Limited selection of input features in analyzing financial statement data. |
| 2011 [31] | SVM, NB, KNN | McGreggor-BFA (123:2888) | 14 financial ratios | SVM (Acc-95.9) | The entire data sample was used in both preprocessing and classification algorithm evaluation, and ensemble learning methods are not examined. |
| 2019 [34] | SVM, CART, NN, LR, NB, KNN | Shanghai and Shenzhen Stock exchanges (134:402) | 17 financial ratios + 7 non-financial variables | SVM(Acc-81.88) | This study did not cover overall companies that listed in the Shanghai Stock Exchange and Shenzhen Stock Exchange and may also require some necessary modification when it is applied to other countries. |
| 2011 [37] | LR, SVM, GP, NN | Chinese Stock Exchange (1:1) | 28 financial ratios + 7 raw variables | NN (AUC-98), GP with feature selection (AUC-92.9) | Class imbalance in data set is not handled and limited selection of input features. |
| 2015 [36] | LR, DT, NN | Taiwan and China sources (129:447) | 3 financial ratios + 21 other factors | ANN(Acc-92.8) | Earlier financial statements are difficult to access due to the prolonged study period of time and incomplete samples are eliminated, which may affect the prediction rate. |
| 2016 [42] | DT, BBN, SVM, NN | Taiwan’s listed and OTC companies (44:132) | 21 financial ratios + 2 raw variables + 7 non-financial variables | DT (Acc-87.97) | Class imbalance in data set is not handled and limited selection of input features. |
| 2012 [44] | Probit regression, Logit regression, SGB, RF, Rule ensemble | AAER (114:114) | 12 financial ratios + 1 variable | RF (AUC-90.1) | Test on how this methodology holds up with different sets of fraudulent firms is not analyzed. |
| 2017 [47] | LR, BN, DT, SVM, NN, Bagging, RF, AdaBoost | AAER (311:311) | 24 financial variables +8 other variables | RF (TP-86.93) | Feature selection is performed using a filter method, and the study is limited by the use of a balanced sample of fraudulent and non-fraudulent firms. |
| 2014 [45] | Logit regression, DT, NN, SVM, Ensemble of LR, DT, NN and SVM | Shanghai and Shenzhen stock exchanges (110:440) | 23 financial ratios | Ensemble (Acc-88.9) | The factors including sample, period and changes in the Chinese economy may influence the prediction modes and is unable to provide adequate fraud detection capabilities. |
| 2018 [46] | SVM, RF, DT, ANN, LR | China Securities Regulatory Commission (120:120) | 17 financial variables+5 non-financial | RF (Acc-75) | The data is not large enough that only Chinese companies contained and the variables are not various and innovative. |
| 2020 [14] | LR, SVM, RUSBoost, AdaBoost | AAER (1171:204855) | 28 raw financial variables | RUSBoost (AUC-72.5) | Raw financial variables are only considered. |
| Proposed | XGBoost, LR, DT, SVM, AdaBoost, and RF | Osiris database | 26 financial attributes including financial attributes from Beneish model | Optimized XGBoost (Acc-96.05) | Non-financial attributes are not considered and is treated as future work. |
| Features | Description |
|---|---|
| a1 | Accounts receivable |
| a2 | Sales |
| a3 | Cost of Goods Sold (COGS) |
| a4 | Current asset |
| a5 | Fixed assets |
| a6 | Total assets |
| a7 | Depreciation |
| a8 | General and administrative expenses |
| a9 | Long term debt |
| a10 | Total current liabilities |
| a11 | Change in current assets |
| a12 | Change in cash |
| a13 | Change in current liabilities |
| a14 | Change in income tax payable |
| a15 | Current maturity of long term debt |
| a16 | Current maturity of LTD |
| a17 | Change in current maturity of long term debt |
| a18 | Amortization |
| a19 | Day’s Sales in Receivables Index (DSRI) |
| a20 | Gross Margin Index (GMI) |
| a21 | Asset Quality Index (AQI) |
| a22 | Sales Growth Index (SGI) |
| a23 | Depreciation (DEPI) |
| a24 | Sales, General and Administrative Expenses (SGAI) |
| a25 | Leverage Index (LVGI) |
| a26 | Total Accruals to Total Assets (TATA) |
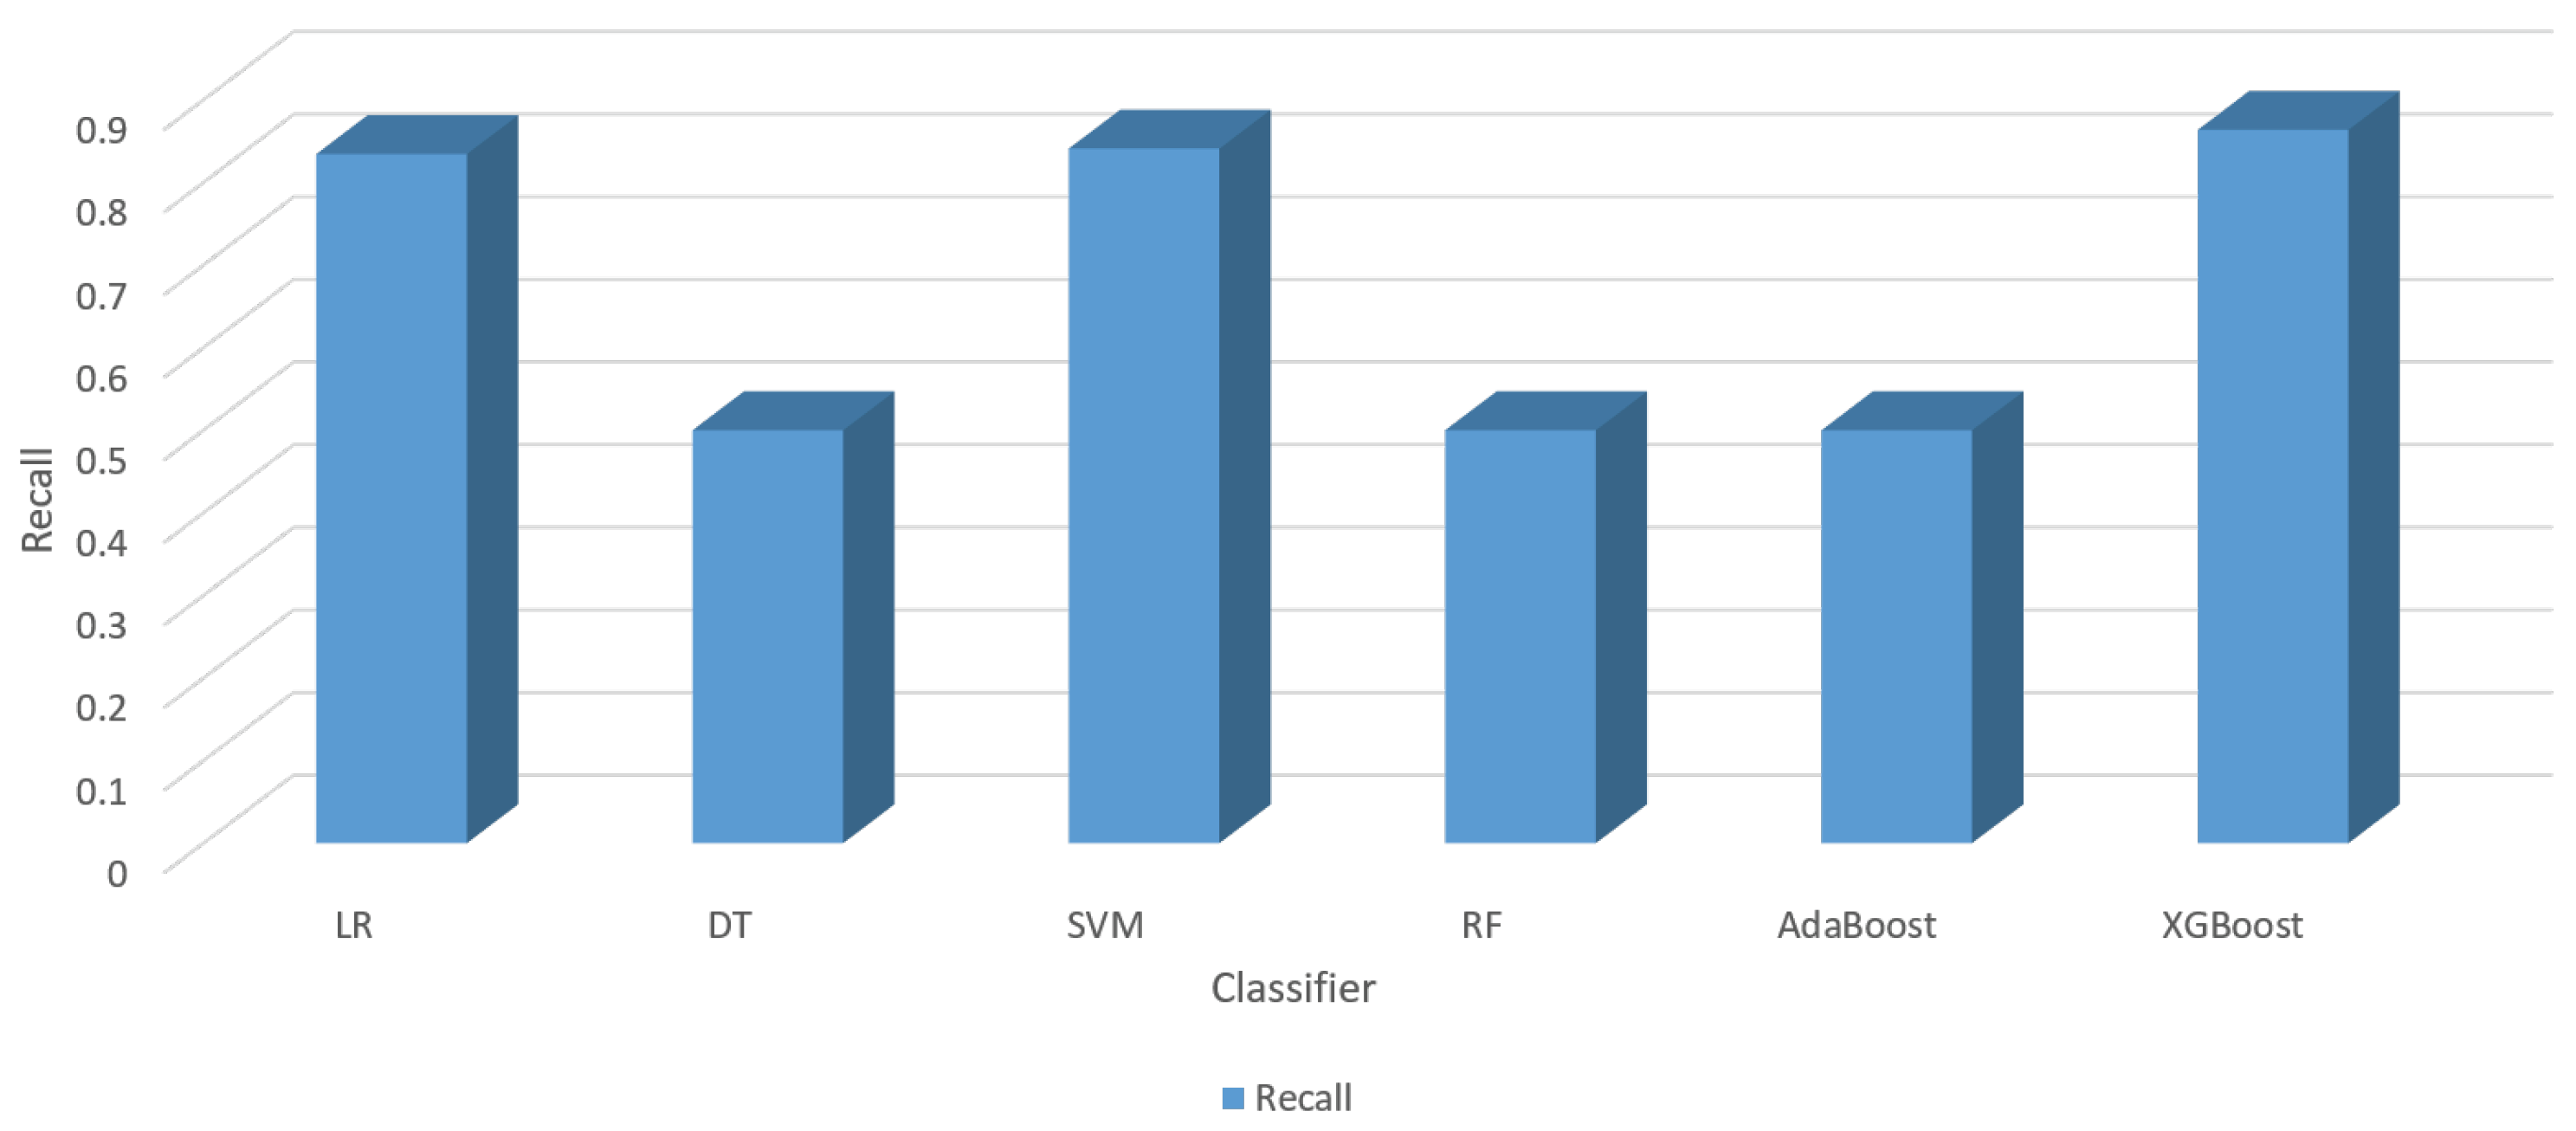
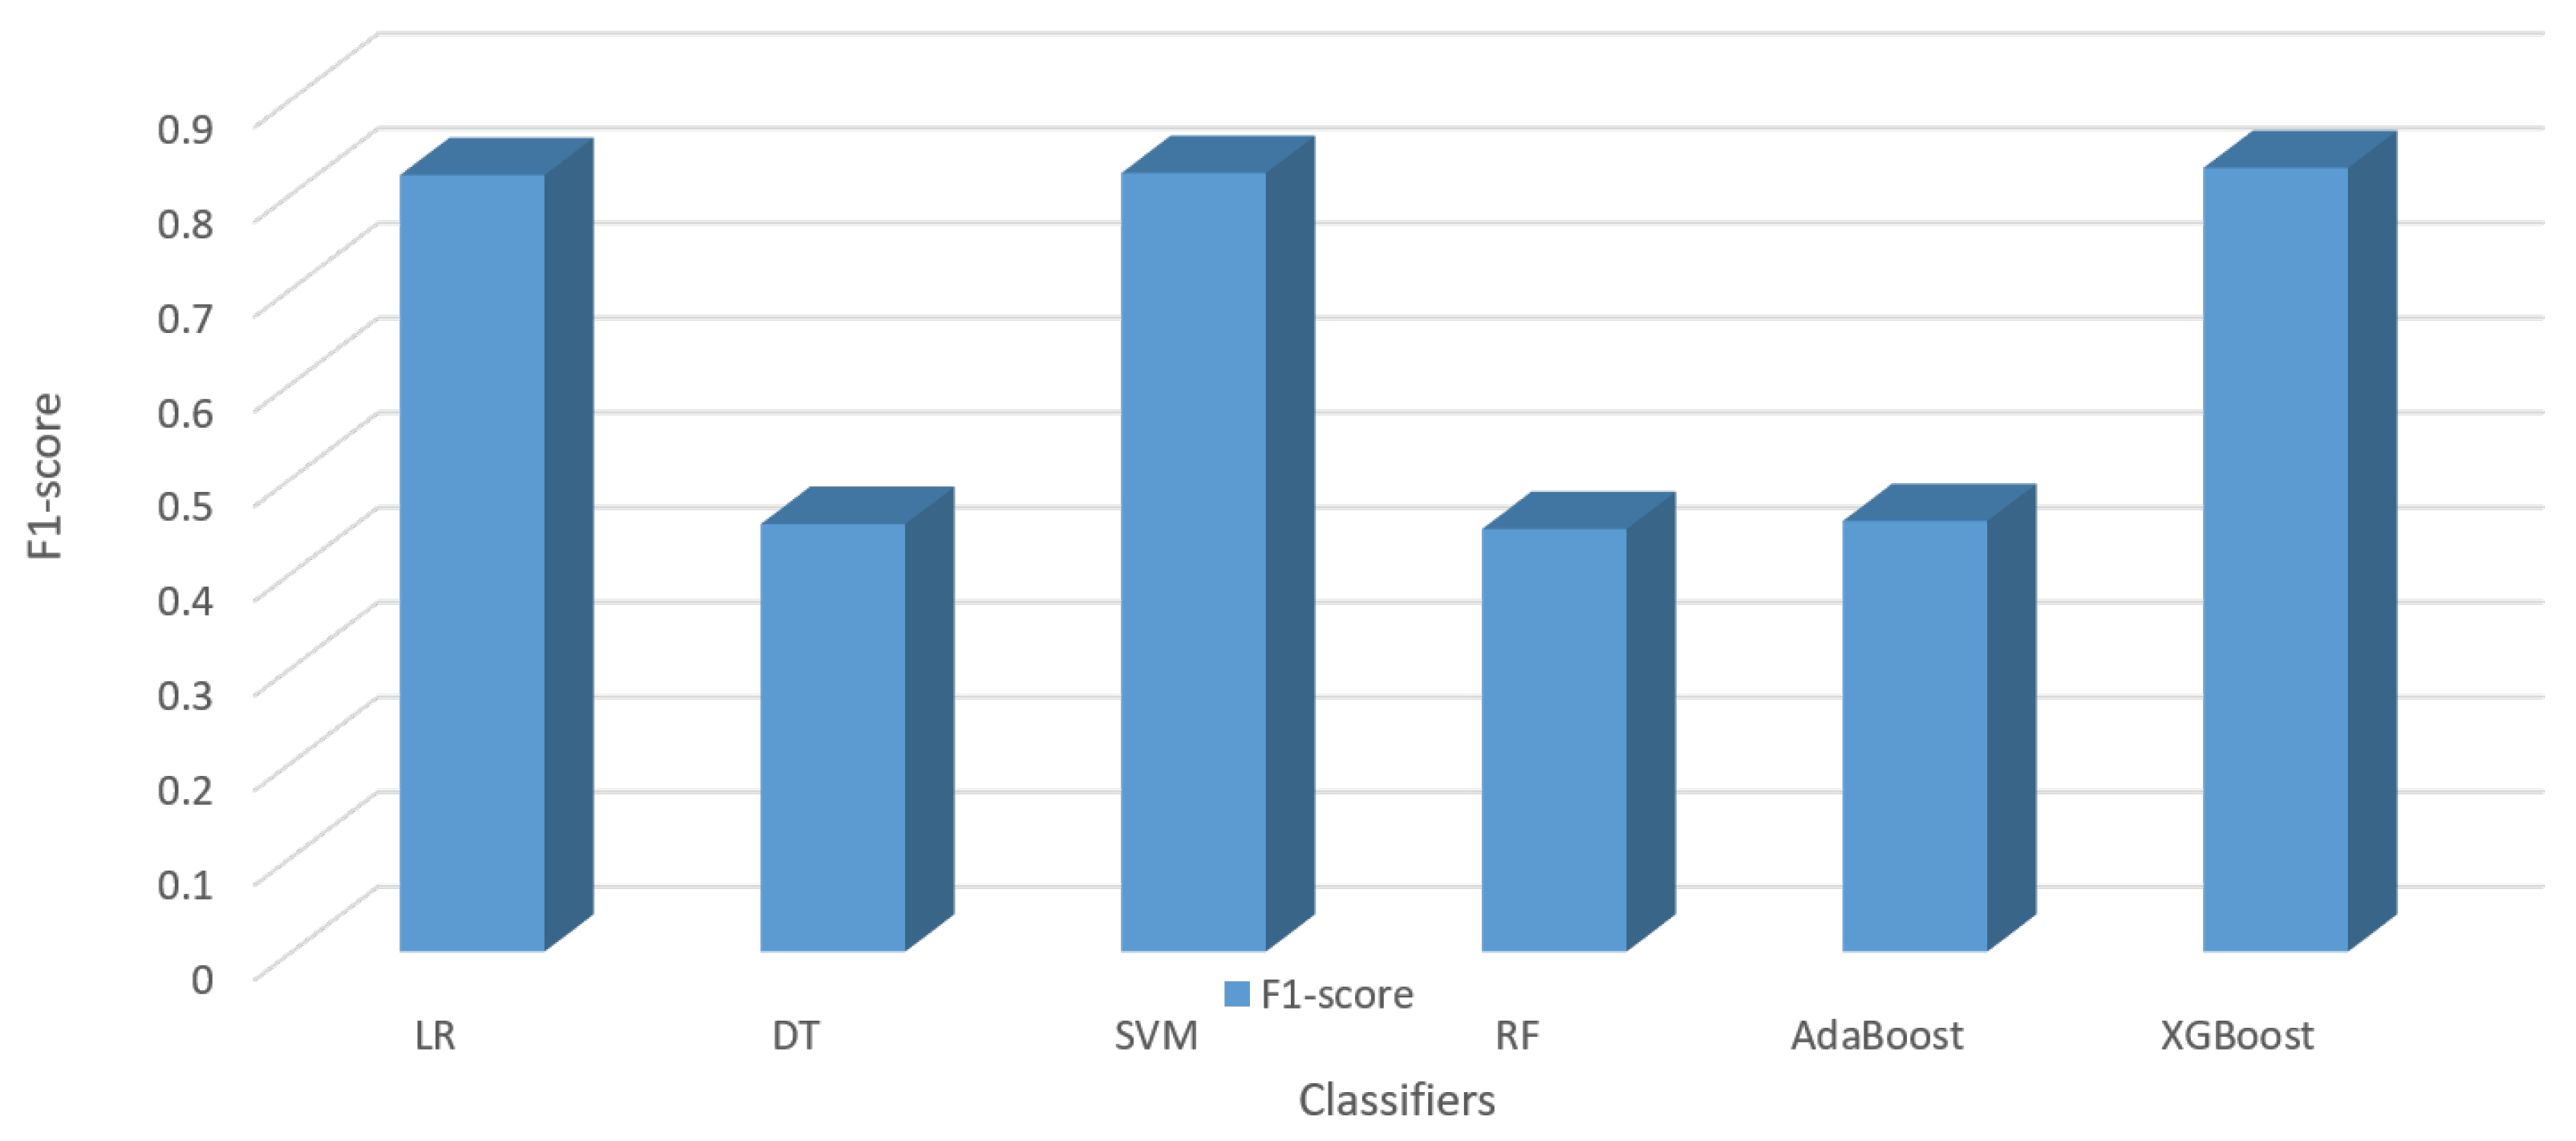
| Classifier | Accuracy | Precision | Recall | F1-Score | ||
|---|---|---|---|---|---|---|
| Mean | Std. Dev. | Mean | Std. Dev. | |||
| LR | 0.7388 | 0.049 | 0.8055 | 0.8344 | 0.8196 | 0.067 |
| DT | 0.8222 | 0.06 | 0.4111 | 0.5000 | 0.4513 | 0.071 |
| SVM | 0.8888 | 0.046 | 0.8034 | 0.8411 | 0.8218 | 0.076 |
| RF | 0.8055 | 0.051 | 0.4027 | 0.5000 | 0.4461 | 0.08 |
| AdaBoost | 0.8333 | 0.044 | 0.4166 | 0.5000 | 0.4545 | 0.066 |
| XGBoost | 0.9366 | 0.05 | 0.7938 | 0.8637 | 0.8272 | 0.082 |
| Steps | Description |
|---|---|
| Hyperparameter tuning using RandomizedSearchCV on accuracy scores with n_iter = 1000 and three-fold cross-validation | ‘learning_rate’: [0.03, 0.01, 0.003, 0.001], ‘min_child_weight’: [1, 3, 5, 7, 10], ‘gamma’: [0, 0.5, 1, 1.5, 2, 2.5, 5], ‘subsample’: [0.6, 0.8, 1.0, 1.2, 1.4], ‘colsample_bytree’: [0.6, 0.8, 1.0, 1.2, 1.4], ‘max_depth’: [3, 4, 5, 6, 7, 8, 9, 10, 12, 14], ‘reg_lambda’:[0.4, 0.6, 0.8, 1, 1.2, 1.4] |
| Model training until validation_0- error improvement in ten rounds | Fitting achieved by three-fold cross-validation for each of 1000 candidates, totalling 3000 folds. The best iteration for each round is the one with the least validation error. |
| Select parameters | ‘learning_rate’: 0.03, ‘min_child_weight’: 3, ‘gamma’: 1.5, ‘subsample’: 0.8, ‘colsample_bytree’: 1.0, ‘max_depth’: 9, ‘reg_lambda’: 1 |
| Obtain the best accuracy score | 0.9605, a significant improvement on the accuracy score of 0.9366 in the previous stage. |
Disclaimer/Publisher’s Note: The statements, opinions and data contained in all publications are solely those of the individual author(s) and contributor(s) and not of MDPI and/or the editor(s). MDPI and/or the editor(s) disclaim responsibility for any injury to people or property resulting from any ideas, methods, instructions or products referred to in the content. |
© 2023 by the authors. Licensee MDPI, Basel, Switzerland. This article is an open access article distributed under the terms and conditions of the Creative Commons Attribution (CC BY) license (https://creativecommons.org/licenses/by/4.0/).
Share and Cite
Ali, A.A.; Khedr, A.M.; El-Bannany, M.; Kanakkayil, S. A Powerful Predicting Model for Financial Statement Fraud Based on Optimized XGBoost Ensemble Learning Technique. Appl. Sci. 2023, 13, 2272. https://doi.org/10.3390/app13042272
Ali AA, Khedr AM, El-Bannany M, Kanakkayil S. A Powerful Predicting Model for Financial Statement Fraud Based on Optimized XGBoost Ensemble Learning Technique. Applied Sciences. 2023; 13(4):2272. https://doi.org/10.3390/app13042272
Chicago/Turabian StyleAli, Amal Al, Ahmed M. Khedr, Magdi El-Bannany, and Sakeena Kanakkayil. 2023. "A Powerful Predicting Model for Financial Statement Fraud Based on Optimized XGBoost Ensemble Learning Technique" Applied Sciences 13, no. 4: 2272. https://doi.org/10.3390/app13042272