Article

Finite Element Modeling of the Soil-Nailing Process in Nailed-Soil Slopes

Civil Eng. Dept., College of Engineering, King Khalid University, Abha 61421, Saudi Arabia
*
Author to whom correspondence should be addressed.
Appl. Sci. 2023, 13(4), 2139; https://doi.org/10.3390/app13042139
Submission received: 1 January 2023 / Revised: 29 January 2023 / Accepted: 3 February 2023 / Published: 7 February 2023
(This article belongs to the Special Issue New Trends in Sustainable Geotechnics—Volume II)

Abstract

:
The finite element technique has been accepted as a tool for modeling geotechnical complex processes. In this study, finite element (FE) modeling of various stages of the soil-nailing process, i.e., construction stages and overburden pressure stages, is carried out considering different soil parameters, simulating with in-house developed laboratory models. The soil-nailing process built in laboratory models is idealized as a plain strain problem and modeled in PLAXIS software. The laboratory models of the soil-nailing process consist of a Perspex sheet box containing a sandy soil slope, a Perspex sheet facing, steel bars as reinforcement and a steel plate as foundation. The stress–strain relationship of the sand is represented by a Hardening-Soil model. The interface at the soil and nail is described by the Coulomb friction model. The behavior of the soil-nailing process, during the construction stage and under varying overburden pressure and varying soil density, are investigated in terms of displacements of slope and stress conditions in slope soil mass. The slope displacements and stress conditions in slope soil mass are all well presented by the FE modeling and compared with laboratory model test data. The sensitivity analysis of the laboratory models’ dimensions is carried out by three-dimensional modeling of the nailed-soil slope. It can be concluded that the developed finite element model has the potential to simulate the performance of a field nailed-soil slope during construction and working stages and could provide guidance for the construction/maintenance of soil-nailed cut slopes in granular soils/weathered rocks.

1. Introduction

The finite element technique has been accepted as a tool for modeling geotechnical complex processes. The soil-nailing process for slope stability is constructed in sequential stages, as explained by Stocker et al. [1], from top to the bottom as the construction proceeds. The soil-nailing process is the most cost-effective and efficient method for stabilizing the natural and engineered slopes [2]. The process can be implemented in small spaces without vibration or disturbing the environment [3]. The numerical methods are best suited to simulate the soil–reinforcement interaction effect and the influence of inhomogeneity of soil on slope instability in a nailed-soil slope, which is not possible to incorporate in analytical methods and laboratory models. The numerical methods can model the non-uniformity of soil medium and soil properties, including strain hardening with time and temperature-dependent properties. The basic concept of a reinforced-soil system depends upon the tensile forces transfer into the soil via friction or adhesion developed at the nail interfaces. The soil mass applies the lateral earth force on the potentially sliding soil mass while providing the resistance due to nail bonding. The interaction between the soil and nails due to friction confines the soil movement in construction of the nailed-soil slope. A state-of-the-art soil stabilization technique using a soil-nailing system, construction parameter influence on the design method and failure modes of the nailed-soil system are summarized by Sharma et al. [4]. Among the various methods used for slope stability, three methods are commonly applied to analyze the nailed-soil slopes, namely the limit equilibrium method [5], finite difference method [6] and finite element method [7]. The limit equilibrium method cannot simulate the nail–soil interaction, which impacts nail resistance mobilization. The reduction of the tensile strain due to adhesion and friction between reinforcement and soil adds to the stability of soil mass [8]. Wu et al. [9] have conducted a slope stability analysis of a combined system of soil nails and stabilization piles on loose soil. The soil-nailing system design optimization using the genetic algorithm base is proposed by Benayoun et al. [10]. The effect of construction process on the behavior of nailed-soil structures using the FE-based software PLAXIS 2D is studied by Ehrlich et al. [11]. Ceccato et al. [12] have proposed a computational approach based on the material point technique to explore the plate anchor application for stabilization of earth slopes, and the proposed approach results are compared with the results of small-scale laboratory tests. The stabilizing mechanisms of loose-fill slopes using a hybrid nail arrangement have been studied by Cheuk et al. [13], and they concluded that a hybrid nail arrangement can be used to increase the robustness of the nailing process in soil stabilization. Alhabshi [14] has suggested the nail length requirements to decrease the displacement of the soil slope. In the nailed-soil slope parametric study, namely nail parameters (nails size, length, angle) and soil–nail interface friction coefficient variation on the pull-out force for the grouted soil-nailing system in non-cohesive soil are examined by Ye et al. [15] using the numerical approach. The numerical modeling of layered and homogenous piled stabilized earth slopes is employed by Sojoudi and Sharafi [16] to study the influence of foundation location and surcharge loading distance from the crest on soil deformation distribution, on the slope stability and on the soil bearing capacity enhancement ratio.
The stability and deformation properties of a composite nailed-soil foundation pit were numerically studied by Han et al. [17]. They have computed the optimum inclination and spacing of the soil nails and the diameter and embedded depth of the mixing pile for stability of the foundation pit. Zhao et al. [18] have modeled the soil nails in a soil mass under different overburden pressures using the FE method and studied the nails’ pullout performances. The constitutive relation of soil follows the modified Drucker–Prager/Cap model, while the Coulomb friction model describes the soil–nail interface. Stauffer [19] has developed FE 2D and 3D models for unreinforced and reinforced slopes. The 2D models use four node bilinear quadrilateral elements to discretize the slope domain in conjunction with Drucker–Prager failure-yielding criteria for slope soil, whereas the 3D models implement eight node linear brick elements in conjunction with the Mohr–Coulomb failure-yielding criteria. He found that the results of FE models and the results of the limit equilibrium method were in good agreement. Kaothon et al. [20] have analyzed the steep soil-nailed slope using the finite element method to investigate the range of the nail parameters, i.e., nail spacing and inclination, appropriate to various slope angles. They have recommended that the range of nails parameters in the existing specification are applicable only to the slope angles of 55° and lower. Rawat and Gupta [21] proposed a comparative study using limit equilibrium and FE approaches to examine the influence of various slope angles and nail inclinations on safety factors and critical slip surfaces of nailed-soil slopes. Compared to the FE method, the limit equilibrium method gives higher values for the factor of safety for slope and nail parameters. Sobhey et al. [22] have compared between the results of the 2D FEM and results of the 3D FEM for assessment of the factor of safety of clay slopes stabilized with vertical piles. The increase in the factor of safety (FSI) of the stabilized clay slope is investigated considering the slope width, location of the piles, pile diameter, pile spacing and shear strength of the clay. Jayanandan and Chandrakaran [23] have investigated the behavior of soil-nailed structures, considering orientation and vertical spacing of nails and bas heave. They have found that lateral deformation is reduced by about 41 percent using nails and the factor of safety is increased by almost 1.2 times that of the slope without nails. Tong and Tang [24] have conducted finite element simulation of soil-nailing support for deep foundation pits using PLAXIS software.
The numerical and experimental study on the ground improvement through the implementation of a soil-nailing system has been presented by various researchers. Dong et al. [25] have analyzed the stability of slope under varying anti-slip pile conditions (pile spacing, row spacing and pile locations) using Midas GTS NX software. FE analysis results of the earth pressure on pile-side and thrust on landslide were compared the results obtained from earth pressure theory and field observations. Sterpi et al. [26] have stabilized the tunnel face under the drainage condition using a new type of soil nail of fiberglass pipe, with improved performance for coupled reinforcement and drainage action of the nails. Chen et al. [27] used finite element analysis to explore the deformation behaviors in tunnel excavation in the presence of rock. The optimization study of soil-nailing parameters using finite element and multi-regression analysis is due to Sharma and Ramkrishnan [28]. They have also developed a correlation between the geotechnical properties, nail parameters and the serviceability conditions using multi-regression analysis. Villalobos and Villalobos [29] investigated the influence of nail spacing on soil-nailed walls using hybrid limit equilibrium and finite element methods. Kalehsar et al. [30] have presented numerical modeling using FLAC3D to study the nailed-soil slope behavior under varying surcharge pressure. A limit equilibrium and finite difference coupled approach was used by Singh et al. [31] for stability analysis of nailed-soil slopes. The stability analysis of soil slope reinforced with pre-stress anchors, including an anchor parameter optimization study, was conducted by Deng et al. [32] using the limit equilibrium method. The slope sliding for shear failure of the slip surface has been described according to the nonlinear Mohr–Coulomb yielding criterion. Panigrahi and Dhiman [33] have reviewed the various aspects and restrictions related to soil-nailing systems. They have also presented the design of a soil-nailing system for landslide prevention and mitigation. Sahoo et al. [34] have carried out shaking table tests to study the dynamic behavior of nailed-soil slopes. They infer from the study that smaller nail inclination provided better reinforcement action for stabilizing the soil slopes than the horizontal nails and nails of large inclination. Centrifuge tests were carried out by Shoari et al. [35] to determine the impacts of overburden pressure on the performance of nailed vertical excavations.
It is clear from the literature review that the various development stages of the soil-nailing process have not been modeled numerically. The analytical models are unable to incorporate the soil–reinforcement interaction and inhomogeneity of soil mass. The laboratory models are difficult to construct and are not cost effective. Moreover, the behavior of the soil-nailing process is affected by various nail, soil and slope parameters, and parameters are difficult to implement in analytical models and laboratory models. Therefore, numerical models need to be developed to investigate the behavior of the soil-nailing process at construction and overburden stages. In this study, finite element (FE) modeling of various stages of the soil-nailing process, i.e., construction stages and overburden pressure stages, is carried out considering different soil parameters simulated by in-house developed laboratory models [33]. The soil-nailing process built in the laboratory models is idealized as a plain strain problem and modeled in PLAXIS 2D and 3D software. The 15-node triangular elements and 5-node plate elements are employed, respectively, for soil and foundation modeling. The 2-node elements are taken to simulate the nail reinforcements. The elements at the interface are employed to simulate the soil–reinforcement interactions. The laboratory models of the soil-nailing process consist of a Perspex sheet box filled with sandy soil, a Perspex sheet facing, steel bars for reinforcement and a steel plate for foundation. The stress–strain behavior of the sand is represented by a Hardening-Soil model. The interface at soil and nails is defined by the Coulomb friction law. The behavior of the soil-nailing process during the construction stage and under overburden pressure are investigated in terms of lateral/vertical displacement of slope and stress conditions in slope soil mass. The results of the FE models of various stages of the soil-nailing, process, i.e., construction stages and under overburden pressure stages, are also compared with the laboratory model results. The numerical simulation using PLAXIS 3D were developed for laboratory model dimension sensitivity by varying the extents of the nailed-soil model. The sensitivity analysis of the experimental model was conducted for the toe soil depth variation and for plain strain condition validity.

2. Laboratory Model of the Soil-Nailing Process

For development of finite element models of the soil-nailing process, a three-dimensional laboratory model was built by the authors to simulate a process of soil nailing of an earth slope [33]. Granular soil in the model was formed using a sand-raining system for the development of different characteristics of soil medium, namely loose, medium and dense sand. The relative density (RD) and angle of internal friction for loose, medium and dense sand produced are 35%, 30°, 48%, 34° and 69%, 40°, respectively. The laboratory models have varying steel reinforcement parameters, i.e., length, spacing and inclination of nails. The force mobilized in the nail, lateral displacement of the slope, settlement of the footing and the earth pressure at the slope face under and behind the soil mass at various overburden pressure (q) has been observed with various reinforcement parameters and soil characteristics to validate the finite element model.

2.1. Nailed-Soil Slope Component Properties

The laboratory models of the soil-nailing process consist of a Perspex sheet box filled with sandy soil, a Perspex sheet facing, steel bars for reinforcement and a steel plate for foundation. A special density control apparatus was designed using a sand-raining system by using a sand deposition device and controlling load-cells system by using four load cells below the corner of the model in order to obtain homogeneous sand beds and controlled relative densities. The sieve analysis test was conducted to determine the gradation of sand. The shear strength parameters of the used sand were determined by means of direct shear apparatus. A direct tension test was performed to determine the strength characteristics of the nail used in this study. The properties of the Perspex sheet facing were determined in the laboratory. The properties of the sand used in the laboratory model are given in Table 1. The thickness of the Perspex plate was 5 mm, the diameter of the nails was 5 mm and thickness of the footing plate was 22 mm. The engineering properties of the Perspex plate, steel plate and steel nails are given in Table 2 and Table 3.

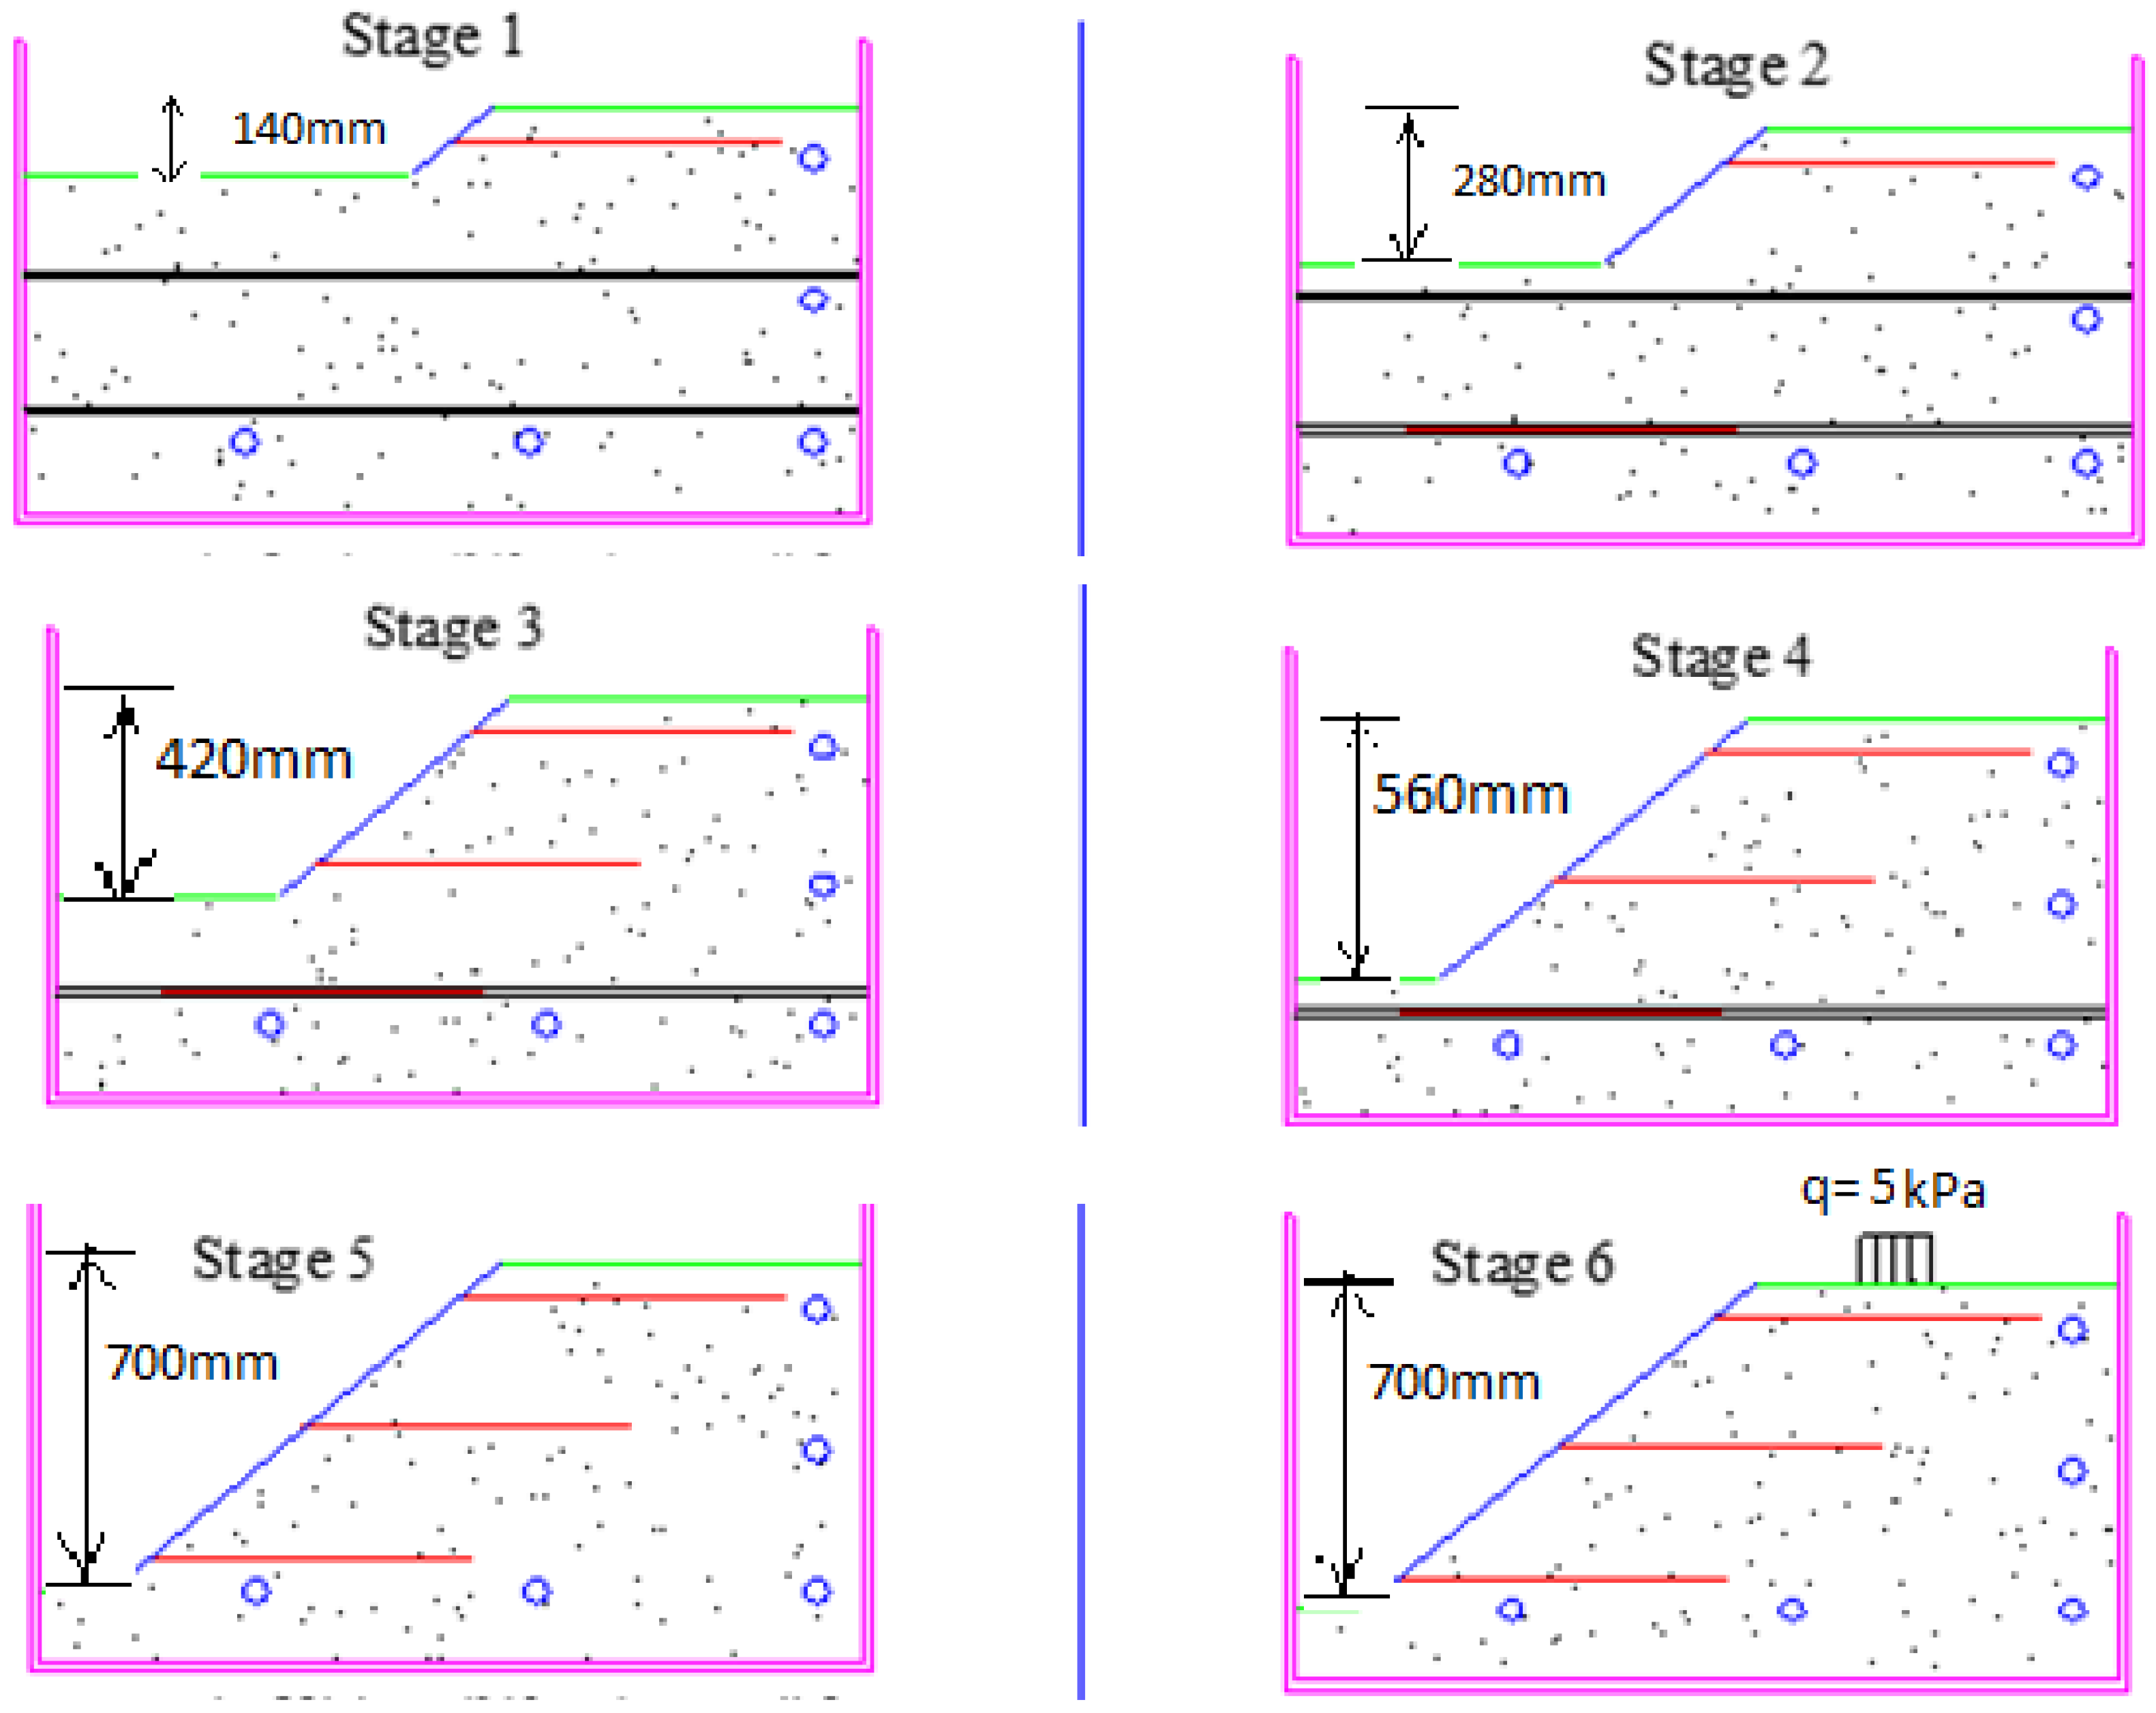
2.2. Soil-Nailing Process

The laboratory model of the soil-nailing process (total soil slope model with a length of 1760 mm and a height of 850 mm) was completed in nine sequential stages [36], as follows (Figure 1).
Stage 1: First excavation stage to a depth of 140 mm below ground surface, construction of the first facing panel and installation of the first nail row at a depth of 70 mm from the ground surface.
Stage 2: Second excavation stage to a depth of 280 mm below ground surface and construction of the second facing panel.
Stage 3: Third excavation stage to a depth of 420 mm below ground surface, construction of the third facing panel and installation of the second nail row at a depth of 350 mm from the ground surface.
Stage 4: Fourth excavation stage to a depth of 560 mm below ground surface and construction of the fourth facing panel.
Stage 5: Final excavation stage to a depth of 700 mm below ground surface, construction of the last facing panel and installation of the third nail row at a depth of 630 mm from the ground surface.
Stages 6–9: Footing is placed at the desired location, applying footing pressure to obtain strip stress (q) equal to 5 kPa (stage 6), 10 kPa (stage 7), 20 kPa (stage 8) and 30 kPa (stage 9) (including foundation weight).

3. FE Model of Nailed-Soil Slopes

3.1. Types of Elements

Finite element formulation-based PLAXIS 2D software is employed to model the laboratory set-up of the soil-nailing process of various stages, as explained in the previous section. Finite element idealization of the soil-nailing process considering the plane strain conditions is made to simulate the laboratory model, i.e., to model the sand soil, facing elements (panels of Perspex), steel nails, foundation and boundary conditions. Table 4 presents the soil slope geometry parameters, and Figure 2 shows the laboratory model with a dimensional sketch of the nailed-soil slope used in the finite element modeling. Triangular and line elements were employed to model the sand, Perspex material and steel reinforcement. The soil materials were modeled using fifteen-node triangle elements. They provided an interpolation of the fourth order for displacements, The numerical integration comprises the 12 gauss points. The fifteen-node triangle element, as shown in Figure 3a, is a very precise element that can be used to yield quality results. The nails in the finite element model are simulated using a 2-node elastic spring element with constant spring stiffness (normal stiffness).
Slope facing and foundation can be modeled in PLAXIS software by beam elements. The beam elements have three degrees of freedom per node, two translation degrees of freedom (ux, uy) and one rotational degree of freedom (rotation in the x–y plane, φz). When 15-node elements are employed for soil medium, then each beam element is defined by 5 nodes, as shown in Figure 3b. PLAXIS code allows for beam deflections due to shearing as well as bending. In addition, the element can change length when an axial force is applied. Beams can become plastic if a prescribed maximum bending moment or maximum axial force is reached. The most important parameters for slope facing and foundation elements are the flexural rigidity (bending stiffness, EI) and the axial stiffness (EA), as given in Table 1. The shear deformation is also considered, and the equivalent plate thickness deq and shear stiffness of the plate is determined as given below.
Equivalent   plate   thickness , d e q = 12 E I E A   ,
Shear   stiffness = 5 E A 12 ( 1 + ν ) = 5 E ( d e q ) 12 ( 1 + ν ) ,
Interface elements are used between soil and nail, facing and foundation to simulate the interaction between structures and the soil. The roughness of the interaction between the soil and the structure elements is simulated by selecting an appropriate value for the factor for strength reduction in the interface (Rinter). The factor relates the interface strength (slope friction and adhesion) to the soil strength (friction angle and cohesion) and the coulomb criterion is used to distinguish between elastic behavior, where small displacements can occur within the interface, and plastic behavior, where permanent slip may occur. The strength/stiffness reduction factor is related to the properties of the adjacent soil as given below [37],
ci = Ri csoil; Φi = tan −1 (Ri tan Φsoil);
ψi = 0 when Ri < 1.0 and ψi = ψsoil when Ri = 1.0;
Gi = Ri Gsoil; E = 2Gi [(1 −νi)/1 − 2νi),
where csoil is the soil cohesion; Φsoil is the soil friction angle; ψsoil is the soil dilatancy angle; and Gsoil is the soil shear modulus.
For the elastic zone, the interface strength is given by the following relation.
| τ | < σ n tan ϕ i + c i   .
For plastic behavior, the interface strength is given by the following relation.
| τ | = σ n tan ϕ i + c i   ,
where ci and ϕi are the interface cohesion and angle of friction.
Each interface element has assigned a “virtual thickness”, which is an imaginary dimension used to define the material properties of the interface. The virtual thickness is calculated as the virtual thickness factor times the average element size. The average element size is determined by the global coarseness setting for the two-dimensional mesh generation. The default value of the virtual thickness factor is 0.1. A total of 5 stress points are used for a 10-node interface element, as shown in Figure 3c. Damians et al. [37] have studied the effect of interface element parameters, the element sizes and shapes at the interfaces on the reinforced soil structure analysis results, and they found that interface element parameters influence the results.

3.2. Nailed-Soil Slope Boundary Conditions

The boundary conditions were applied in the finite element model, at the bottom of the model and at the left- and right-hand side of the model. The boundaries of the model were selected to avoid a size effect on the output of the models. At the bottom, the nodes were treated as fixed, i.e., with no horizontal or vertical movement or rotation. The nodes at the left and right side were free to move in the vertical direction and rotate, but they were restrained in the horizontal direction. The rest of the nodes were allowed to move in the horizontal and vertical direction and rotate.

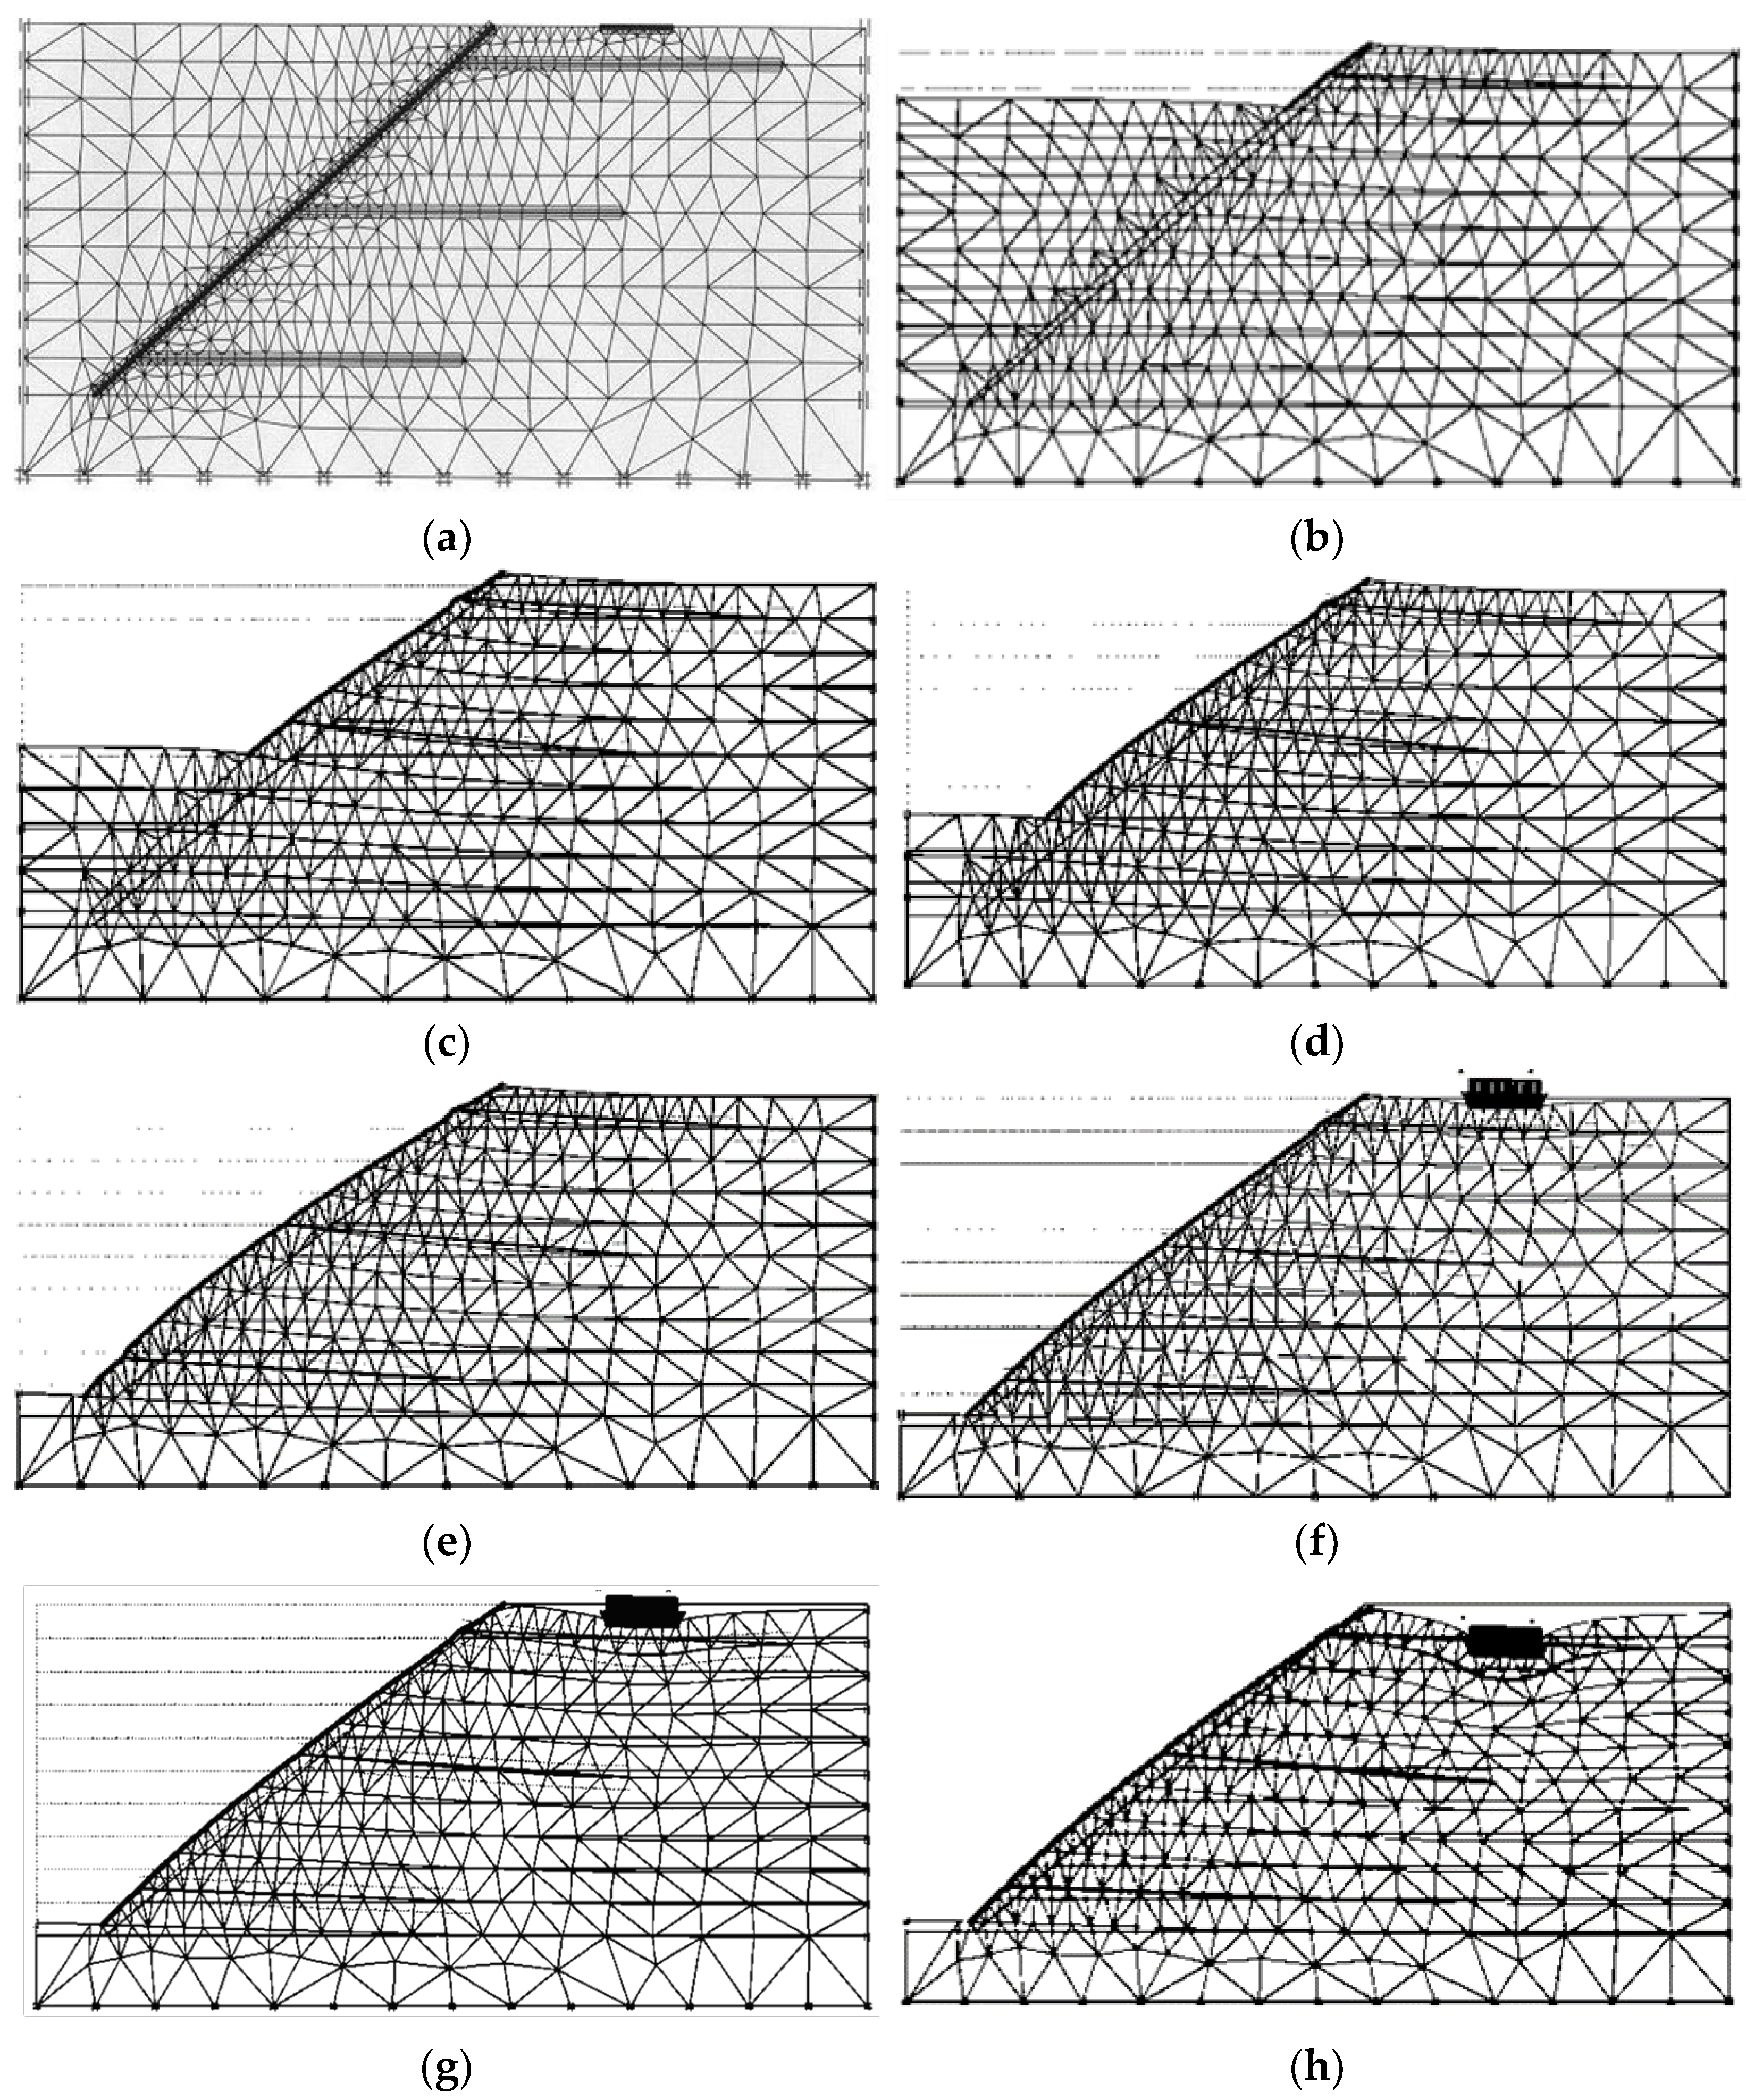
3.3. Finite Element Mesh

The mesh generator needs an optimum meshing parameter, which represents the average element size, (Le). Abioghli [38] have studied the sensitivity of the mesh parameter, considering very coarse to very fine mesh, on the reinforced soil wall analysis results, and they found that meshing has minimal influence on analysis results of reinforced soil wall. The Le parameter is calculated from the outer geometry dimensions (Xmin, Xmax, Ymin, Ymax) and global coarseness setting (nc) in PLAXIS as follows.
L e = ( X m a x X m i n ) ( γ m a x γ m i n ) n c .
The number of generated triangular elements is around 250 elements, considering the nc value as 100. The discretized domains of the soil slope during the construction stage and working stage are portrayed in Figure 4. It is observed from discretized domain figures that the meshes are deformed in sequential construction and loading stages. The deformation is more on the slope face during construction and on the backfill during the loading stages.

3.4. Constitutive Models of Soil

The ability to accurately reflect the field conditions depends mainly on the ability of the constitutive model to represent the soil behavior. The nonlinear elastic (hyperbolic) model, Hardening-Soil (HS) model, is used to simulate the sandy soil. Stress–strain behavior of soil becomes nonlinear, particularly at failure condition. Duncan and Chang [39] have presented a procedure to model the soil behavior by varying the soil modulus, in which the stress–strain curve is hyperbolic and the soil modulus is a function of confining stress and the shear stress experienced by the soil. Figure 5 shows the nonlinear stress–strain behavior and different soil modules. When a soil is subjected to zero deviator stress (i.e., σ1σ3 = 0), its stress–strain behavior is modeled using the initial modulus (Ei) given by the following relation.
E i = K L P a [ σ 3 P a ] n   ,
where Ei is the initial tangent modulus, KL is the loading modulus numbers, Pa is atmospheric pressure, σ3 is the confining stress and n is the exponent for defining the influence of the confining pressure on the initial modulus.
When soil is subjected to stress higher than it has previously experienced, the soil constitutive behavior is governed by the tangent modulus (Et) given by the following equation.
E t = [ 1 R f ( σ 1 σ 3 ) ( 1 s i n ϕ ) 2 c ( c o s ϕ ) + 2 σ 3 s i n ϕ ] E i   ,
where ϕ is the angle of internal friction, c is the cohesive strength of soil, Rf is the ratio between the asymptote to the hyperbolic curve and maximum deviator stresses = (σ1σ3)f/(σ1σ3)ult and σ1 and σ3 are the major and minor principal stress, respectively.
When a soil is unloaded from a higher shear stress state, the nonlinear model uses the unloading–reloading modulus (Eur) and can be calculated as follows, similar to the initial modulus (Ei).
E u r = K u r P a [ σ 3 P a ] n   ,
In the Hardening-Soil model (HS-model), the soil stiffness is described by using three different input stiffnesses, the triaxial loading stiffness (E50), the triaxial unloading stiffness (Eur) and the Oedometer loading stiffness (Eoed). The average values for various soil types are (Eur)ref ≈ 3(E50)ref and (Eoed)ref ≈ (E50)ref. The HS-model accounts for stress-dependency of the stiffness module. All three input stiffnesses are related to a reference stress, usually taken as 100 kN/m2. The hyperbolic part of the stress–strain curve can be defined by using a single secant modulus, as shown in Figure 5, as an additional input parameter, E50. In contrast to E50, which determines the magnitude of both the elastic and plastic strains, Eur determines the soil behavior under unloading and reloading [40].
Both the average primary loading modulus E50 and the unloading modulus Eur are stress level-dependent.
E 50 = ( E 50 ) r e f [ σ 3 + c ( c o t ϕ ) p r e f + c ( c o t ϕ ) ] m   ,
E u r = ( E u r ) r e f [ σ 3 + c ( c o t ϕ ) p r e f + c ( c o t ϕ ) ] m   ,
where (E50)ref is the secant stiffness in a standard drained triaxial test, (Eur)ref is unloading-reloading stiffness, pref is reference stress for stiffness and m is the power for stress-level dependency of stiffness (m = 0.5 for sand [40]). Table 5 shows the material model parameters for the three types of sand considered in the present study.

4. Finite Element Modeling Results and Discussion

The developed finite element (FE) models of the soil-nailing process were used to obtain horizontal/vertical displacement and horizontal/vertical stresses at different locations of nailed-soil slope under various stages, i.e., construction stages and overburden pressure stages, using the commercial software PLAXIS. Deformed shapes of slope were also obtained at the different soil-nailing process stages. The medium dense sand with relative density of 48% was used in the development of FE models. However, the effect of density was studied considering three relative densities of sand, i.e., 34%, 48% and 68%.

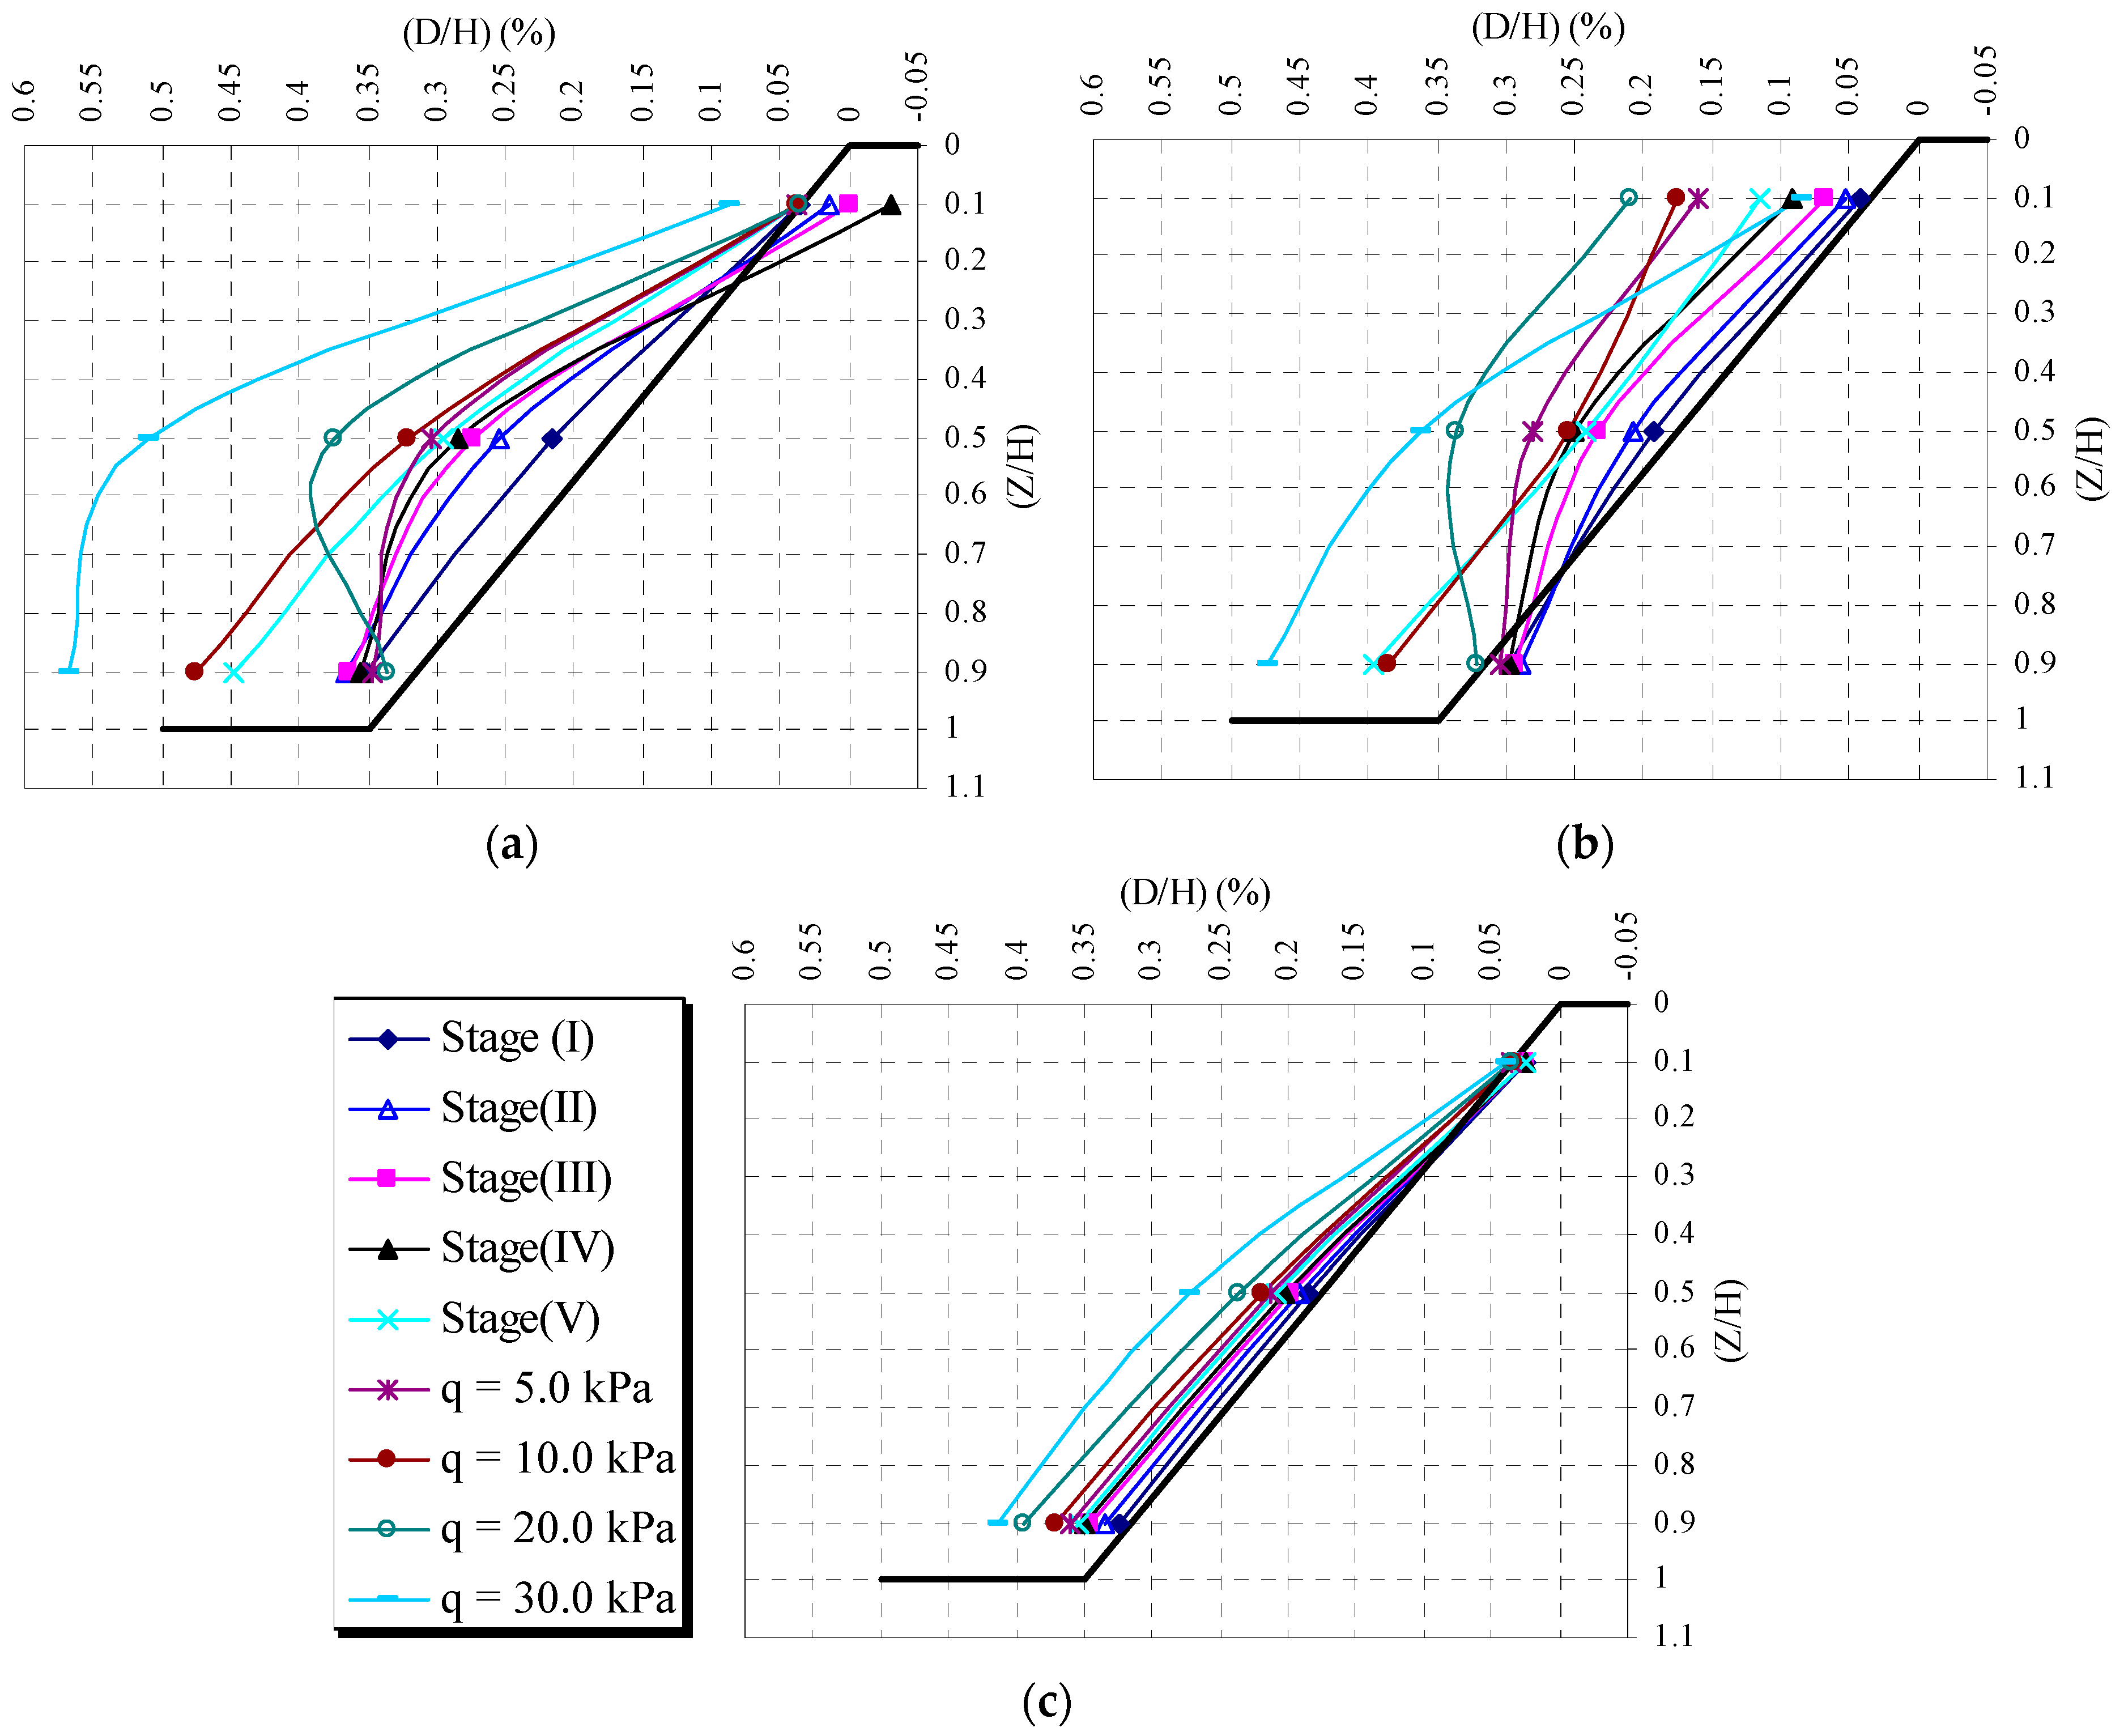
4.1. Horizontal and Vertical Displacements at Different Stages of the Soil-Nailing Process

The horizontal and vertical displacements of the soil mass during the construction stage and loading stage are portrayed in Figure 6 and Figure 7. The red color in Figure 6 and Figure 7 and its intensity shows the soil movement horizontally and vertically. The horizontal displacement of the slope face is given in Section 4.2. The amount of vertical settlement of footing is depicted in Section 5.2. It infers from Figure 6 and Figure 7 that, during the construction stages, there were small horizontal movements of the slope face, and these movements were increased by increasing the overburden pressure, particularly at the middle third of the slope towards the toe of the slope. The maximum horizontal displacement of the slope face occurred in the middle third of the slope and decreased as we moved far from the slope face. During the overburden pressure stage, the horizontal movements increased near the slope face at the top and around the nails. The minimum displacement was at the upper third of the slope at various stages of the soil-nailing process. The vertical movement was decreased as we moved far from the foundation location in all the directions during the overburden pressure.

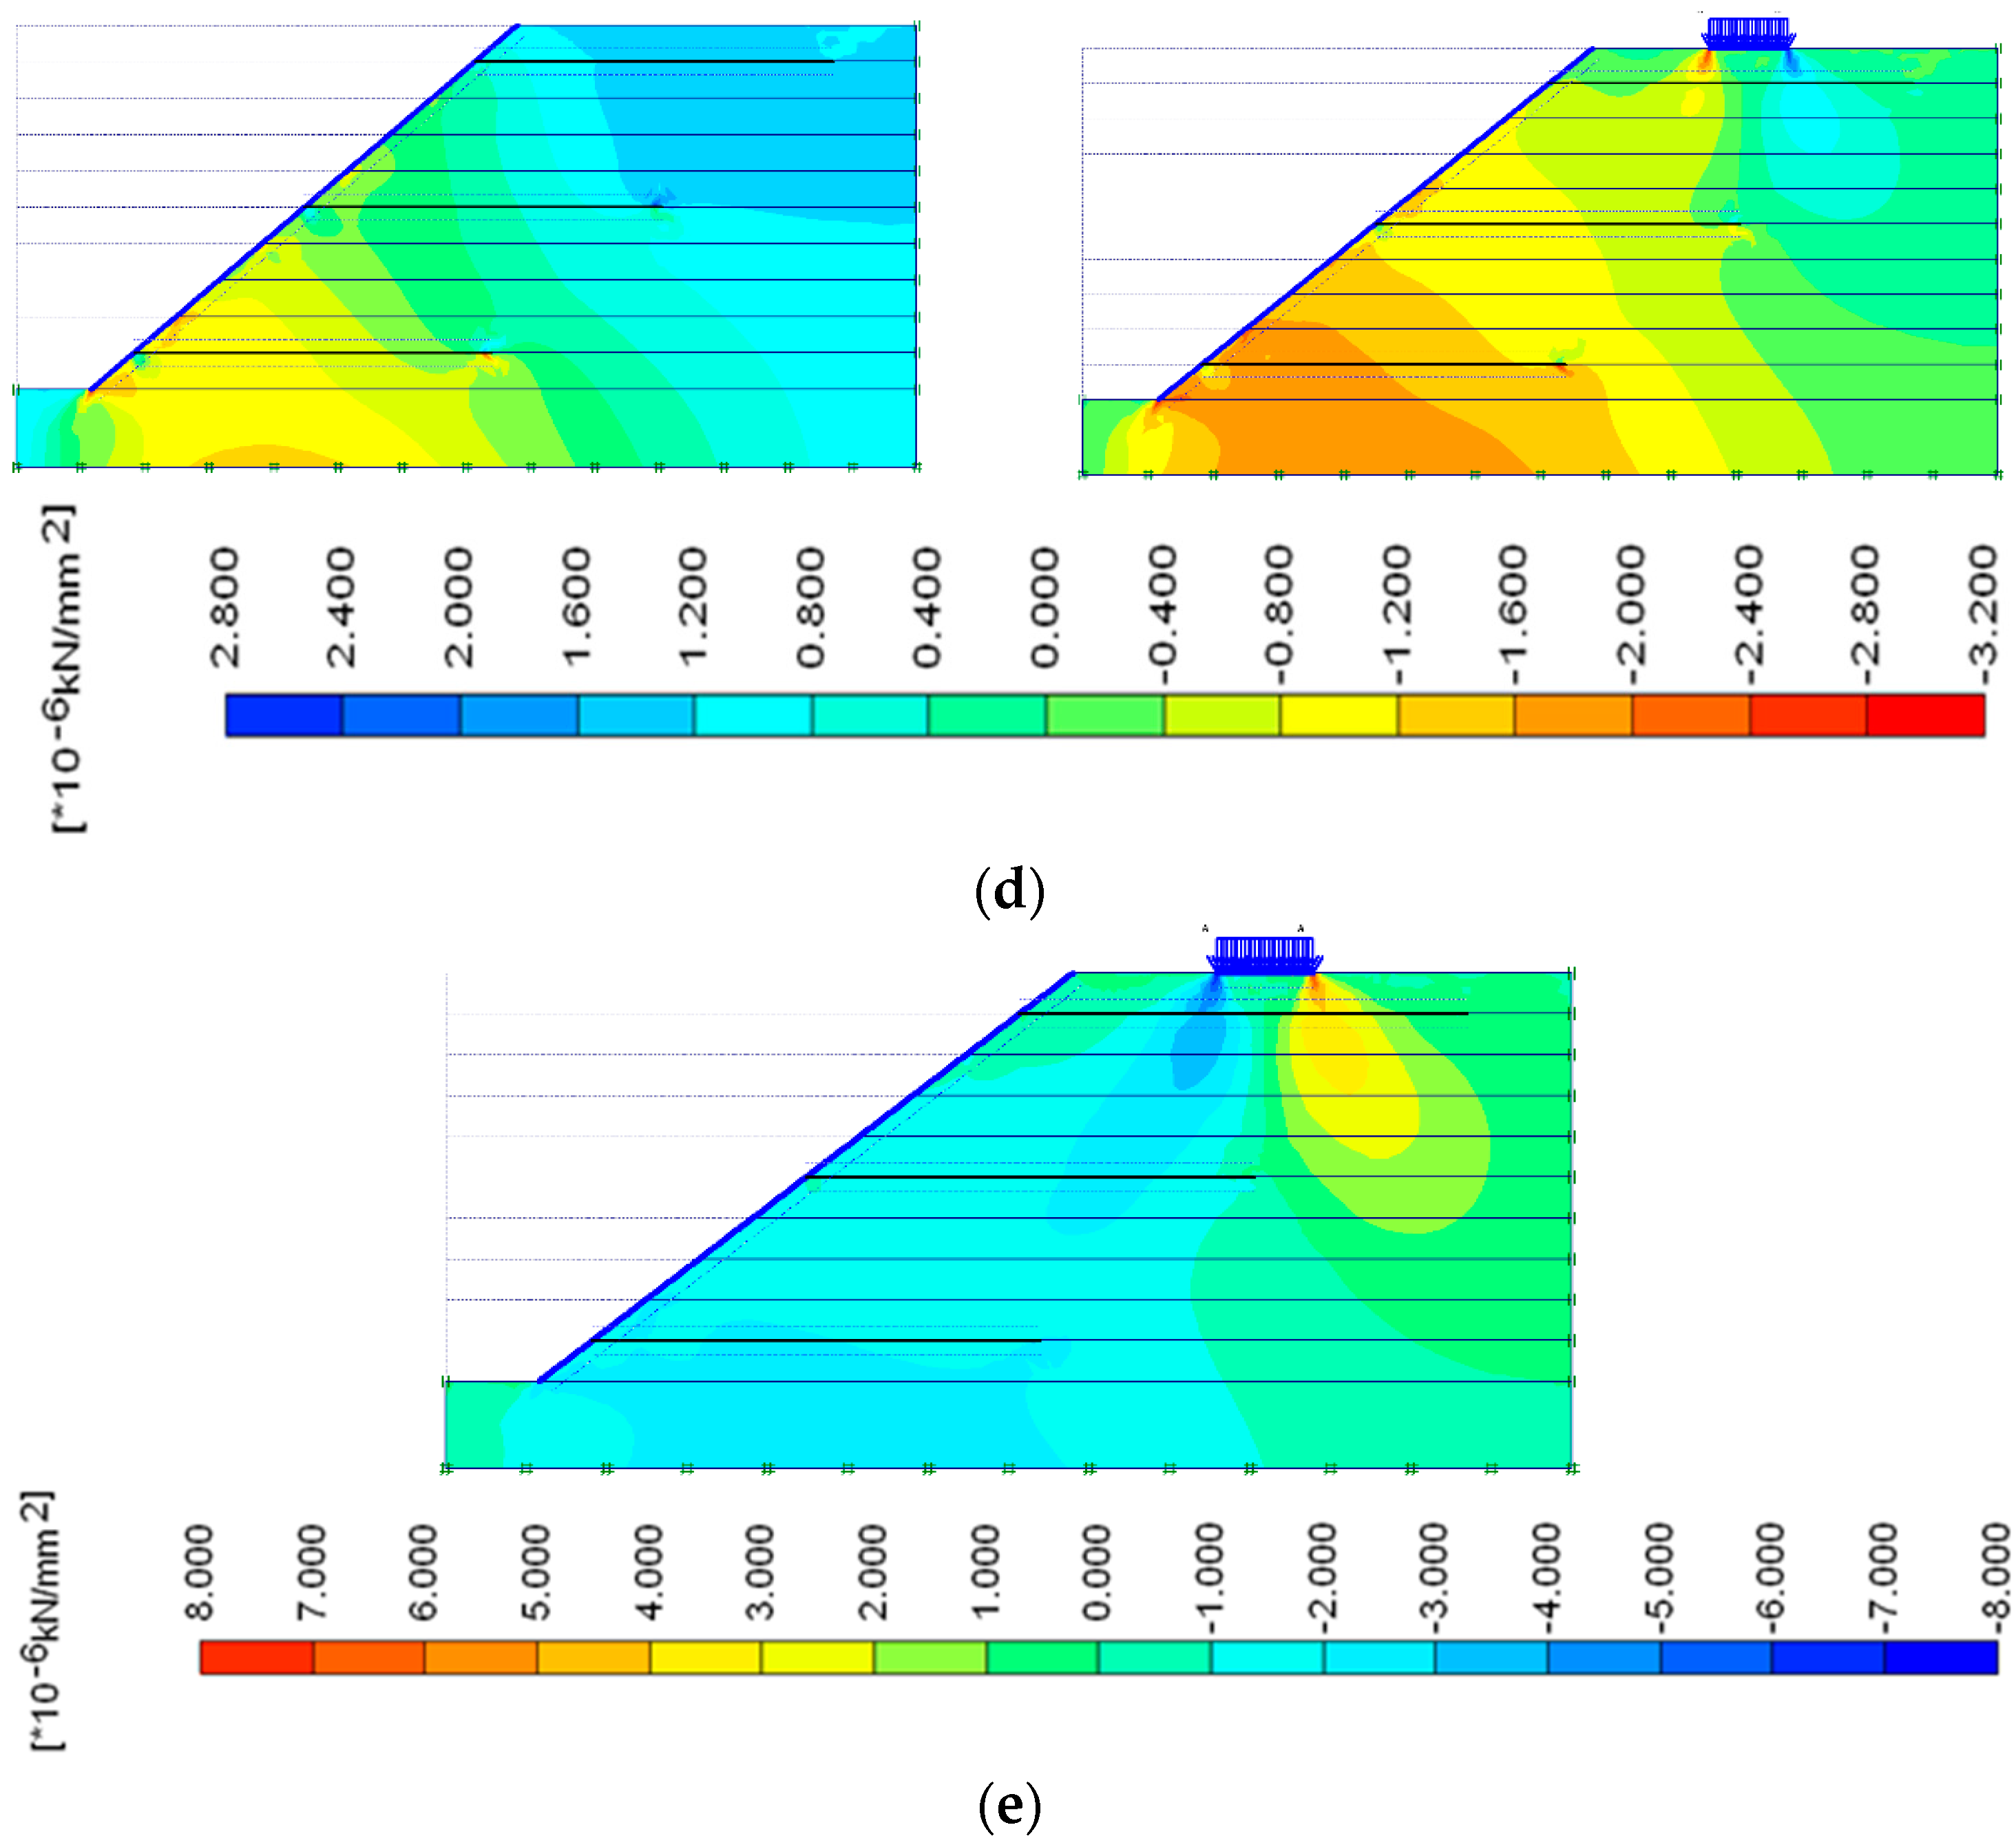
4.2. Horizontal, Vertical and Shear Stresses at Different Stages of the Soil-Nailing Process

Figure 8 shows the horizontal stresses in the soil medium during the construction and working stages. It is observed from the figure that horizontal stresses increased progressively with the depth and increased as we moved far from the face of the slope and with the increase of loadings. It is most significant to observe that most of the backfill zones in horizontal stresses were in the tension state. It is also noticed that concentration of the stresses was higher near the foundation, top surface of the slope and around and between nails, which will be resisted by the presence of nails otherwise, and failure may occur.
Figure 9 depicts the vertical stresses in the soil medium during the construction stage and overburden pressure stages. The vertical stresses increased with the depth and with overburden pressure. The vertical stresses decreased under the slope as the excavation proceeded. It is noticed that the vertical stresses were not the same at any horizontal plane. This may be due to a sudden change in rigidity of the nailed-soil slope due to excavation and the presence of nails. Vertical stress concentration occurred around the footing, near the slope surface and around the nail. Some of these stresses were tensile and others were compression. Tensile stresses are resisted by the nails.
Shear stress distributions in nailed-soil mass during construction stages and overburden pressure stages are shown in Figure 10. The shear stresses rose near the top surface of the sand bed and the face of the slope as well as near and under footing, while, within the soil medium, the shear stress values were almost similar. As expected, no shear stress regions developed at the reinforced soil, indicating a change in direction of shear stresses. In the overburden pressure stage, shear stresses rose by the increase of the loadings.

5. Parametric Study: Finite Element Analysis of a Nailed-Soil Slope with Varying Soil Densities

FE analysis on developed models with different soil relative density (RD) values is carried out to examine the influence of density of soil on the slope horizontal displacement and settlement of footing. The vertical and horizontal stresses developed in the nailed-soil mass with different soil relative density (RD) values are also studied. The soils used in this study were loose sand (RD = 35%), medium dense sand (RD = 48%) and dense sand (RD = 69%). The properties of the loose sand, medium dense sand and dense sand are given in Table 5.

5.1. Horizontal Displacement of the Nailed-Soil Slope

Figure 11 and Figure 12 show the effect of the soil density on the horizontal displacement of the face of the slope during construction and overburden pressure stages. It can be observed from the results that, with the increase of the soil density, the slope displacements decreased, i.e., the higher soil density, the lesser the lateral displacement of the facing. This is because of interface friction of the soil and nails depending on the soil density. In dense granular soil, restrained dilatant behavior is due to an increase of normal stress on the nail level, which increases the friction between soil and the nails and increases the nail ability to resist the deformations. The increase in soil density reduces the slope face displacement by a ratio ranging from 44.01% to 72.43%. It is clear from the slope lateral displacement graphs that a greater reduction of the lateral displacement with higher soil density is found in overburden pressure stages as compared to in construction stages.

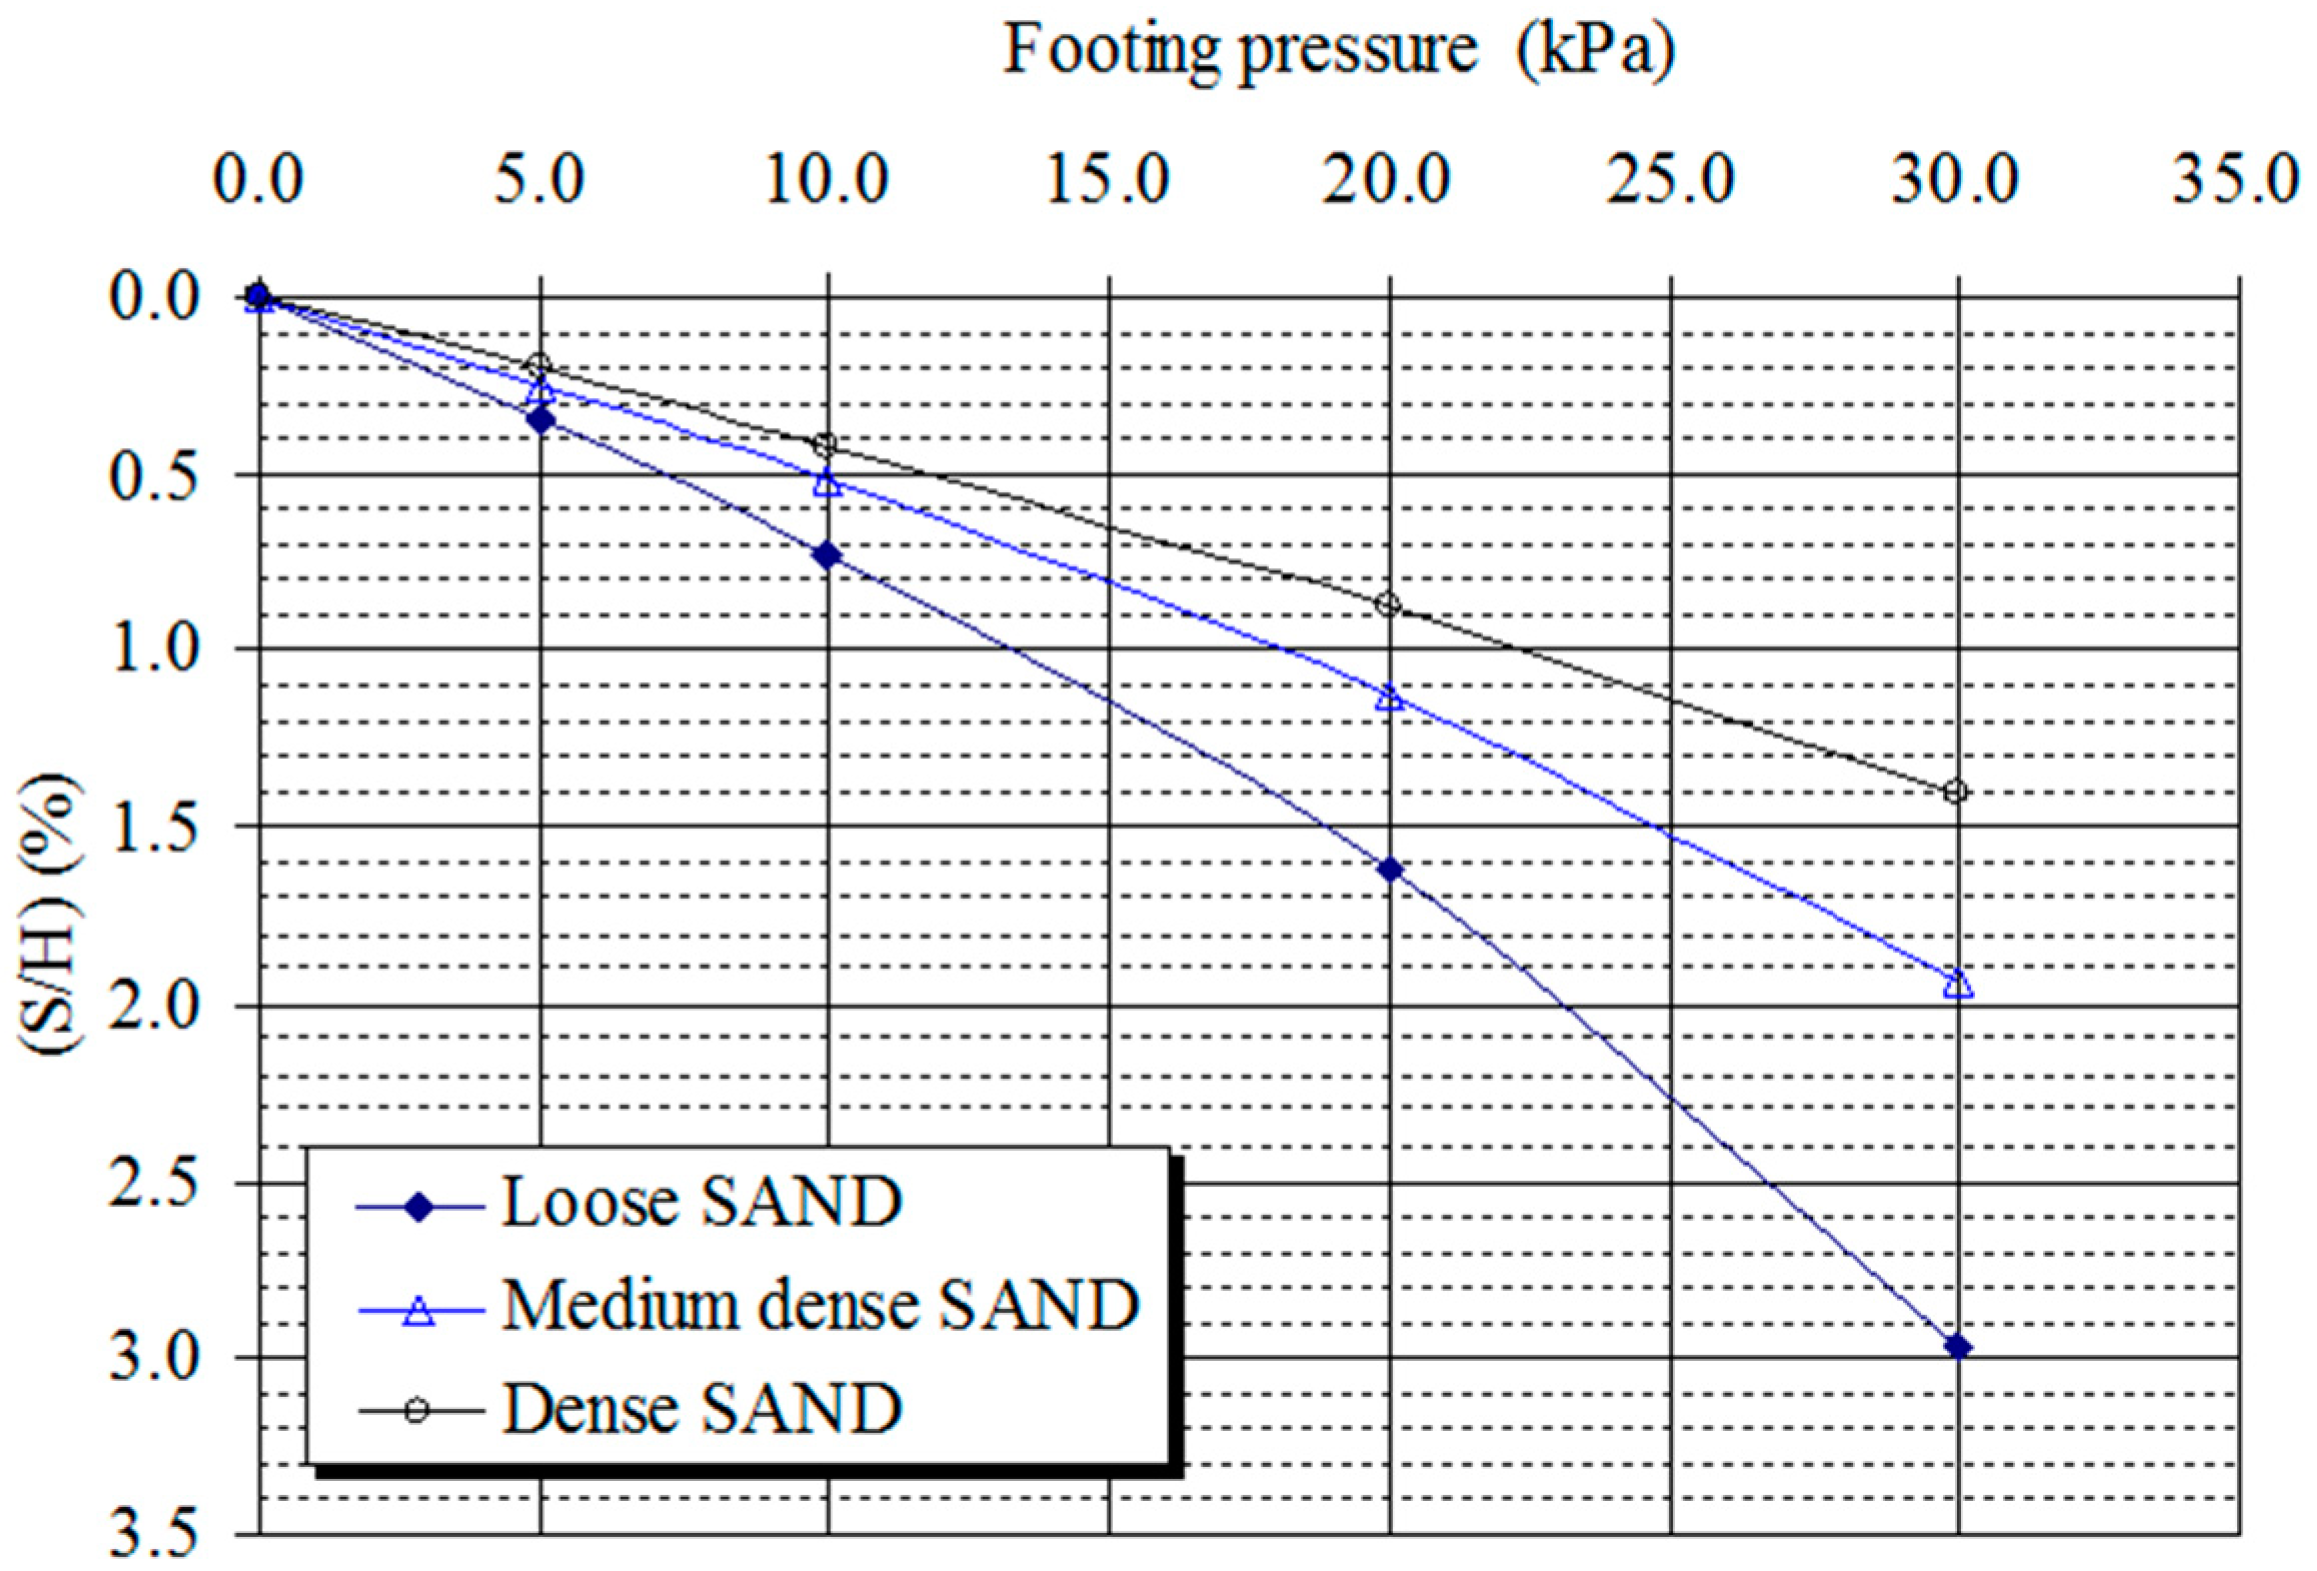
5.2. Vertical Settlement of the Footing

Figure 13 presents the vertical settlements of the foundation for various soil densities at different footing loads. The increase in the soil relative density decreases the footing vertical settlement. This decrease of the settlement could be attributed to the decrease of the slope face displacement. Moreover, the increase in the soil relative density is accompanied by a rise of shearing resistance, and, thus, reduction of vertical settlement of the footing. The reduction in footing vertical settlement ranged from 28.39% to 52.65%. It can be observed from the footing settlement’s variation that a greater reduction of the settlements with higher soil density is found at higher footing pressure.

5.3. Horizontal Stresses on the Slope Face

Figure 14 and Figure 15 present the influence of soil density on the horizontal stresses at the face of the slope at construction and overburden pressure stages. It is observed from the figures that decreasing relative density of the sand leads to increasing the horizontal stresses on the face of the slope, and stress enlargement ratio ranged from 12.50% to 61.54% for the soil type changing from dense sand to loose sand. It is observed from the graphs of variation of horizontal stress on the slope face developed in different densities of nailed-soil slopes that, when the overburden pressure is applied (stage 6) after construction of the slope, the horizontal stress decreases in the loose sand slope and increases in the dense sand slope, while it has no effect on the horizontal stress of the medium dense sand slope with the increase of soil density.

5.4. Vertical Stresses under Nailed-Soil Slope Mass

Figure 16 and Figure 17 present the influence of soil density on the vertical stresses under the nailed-soil mass at construction and overburden pressure stages. It is inferred from the plots that the influence of soil relative density on vertical stresses under the nailed-soil mass is directly related, i.e., the higher the soil density, the larger the vertical stresses under the soil mass. Increasing the relative density of the sand results in a rise of the vertical stresses under the nailed-soil mass up to 20.0% for the considered soil types. It is observed from the graph of vertical stresses under the nailed-soil mass with varying density that, when compared to construction stages, overburden pressure stages exhibit a higher increase in vertical stress with the increase in soil density.

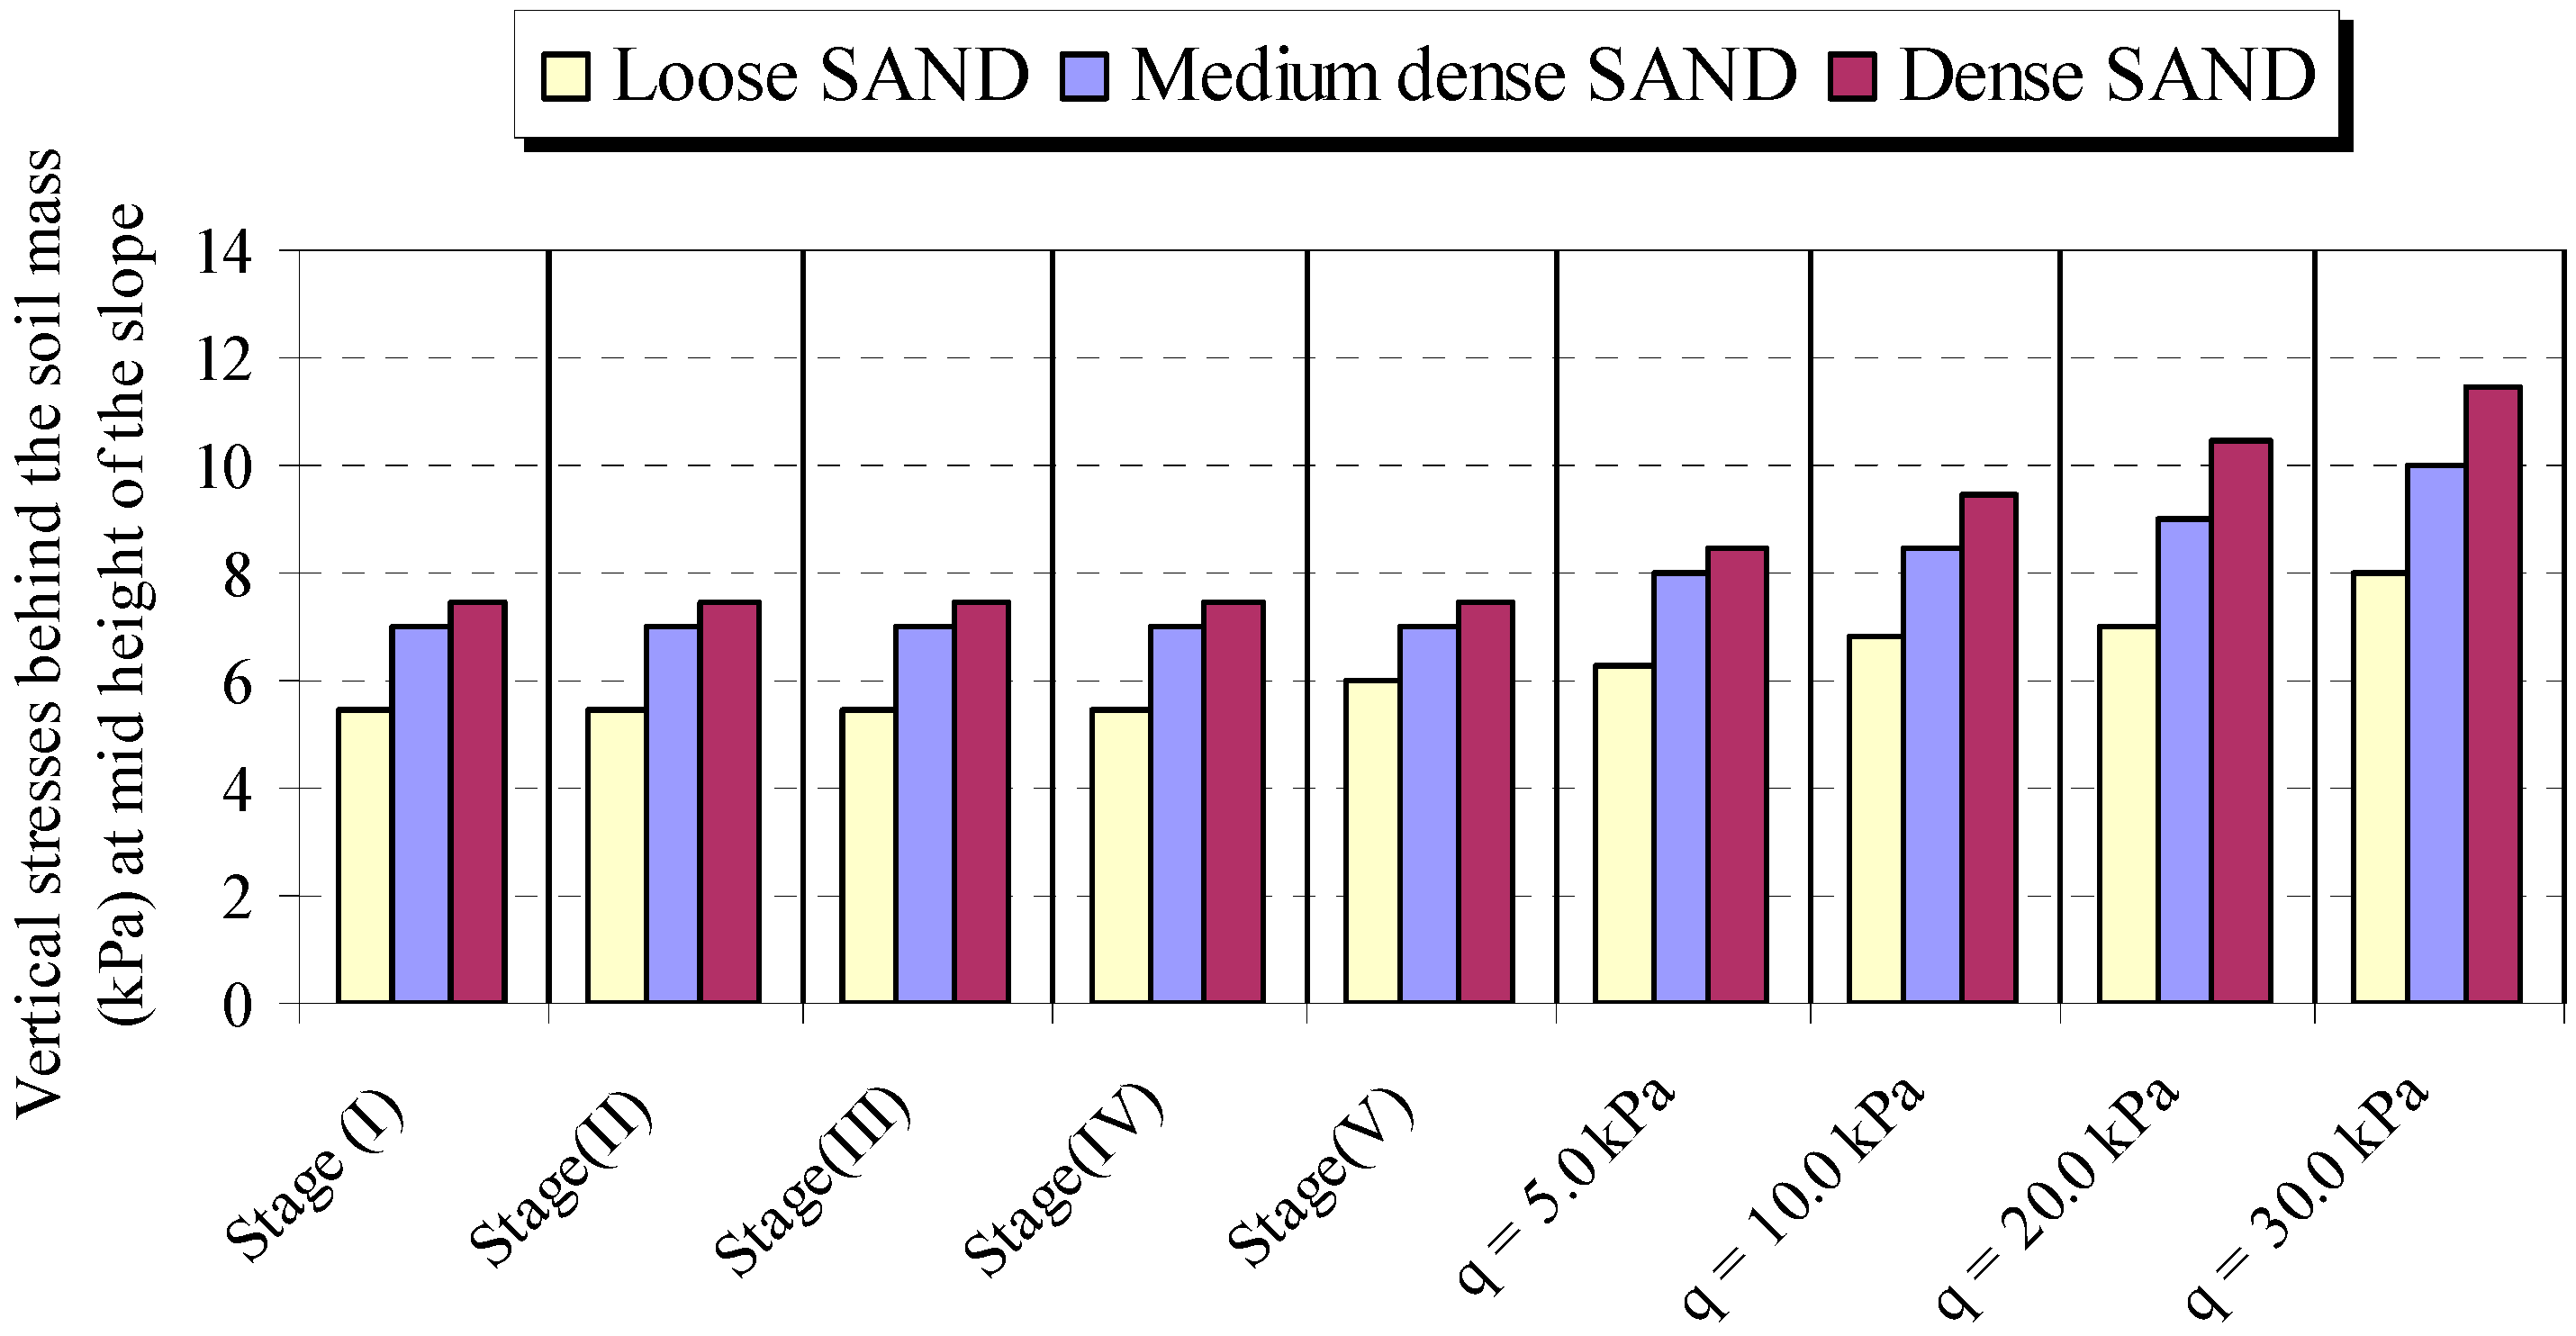
5.5. Horizontal and Vertical Stresses behind the Nailed-Soil Mass

The influence of soil density on the horizontal and vertical stresses behind the nailed-soil mass in construction and overburden pressure stages at mid-height points are shown in Figure 18, Figure 19, Figure 20 and Figure 21. It can be inferred from the graphs that, at construction stages, the horizontal stresses behind the nailed-soil mass rise as the soil relative density decreases. The performance of vertical stresses behind the soil mass with the soil density has an inverse behavior, i.e., the vertical stresses behind the nailed-soil mass increase as the soil relative density increases. Similar behavior has been observed in loading stages. This may be due to increasing density results in the shear strength of nailed-soil mass increase and less movement occurring in the nailed-soil mass.
Increasing relative density of the sand leads to a rise in the vertical stresses behind the nailed-soil mass with a ratio ranging from 25.0% to 50.0%, with the higher value for the case of loose sand. This may be due to increasing the overburden pressure. Meanwhile, a reduction in horizontal stresses behind the nailed-soil mass occurred, with a ratio ranging from 3.85 to 28.57%, with the lower value for the case of loose sand.

6. Performance Comparison of FE and Laboratory Models of Nailed-Soil Slopes

The FE analysis results of a nailed-soil slope have been compared with the laboratory model measured results. The lateral or horizontal slope displacements at various nail locations, i.e., at distances of 70, 350 and 630 mm from the top surface, are taken for comparison purposes. The measured and computed results of foundation vertical settlements (S/H, %) at various soil densities are also compared. The plots showing the comparison of computed and observed results from FE and laboratory models at various stages of a nailed-soil slope, i.e., at construction stages and the overburden pressure stage, are depicted in Figure 22 and Figure 23.

6.1. Vertical Settlement of the Foundation

Figure 22 shows foundation vertical settlements (S/H, %) at different soil densities for both laboratory and FE models, (laboratory model results are drawn in solid lines, while the dotted lines represent the FE model results) [33]. It can be seen from the figure that the maximum footing settlement occurred at an overburden pressure of 30 kN/m2. It can be observed from the graph that the FE models overestimate the footing settlements. The variation in observed and computed settlement ranges from 4.4% to 18.7 in the case of loose dense sand, whereas it ranges from 13.4% to 40.6% and from 0.4% to 35.0% in the cases of medium and dense sand, respectively.

6.2. Horizontal Movement of the Slope Face

Figure 23, Figure 24 and Figure 25 show the horizontal slope movement (D/H, %) at different soil densities for both laboratory and FE models. It can be seen from the figures that, for loose sand, at the construction stage, the highest horizontal movement occurs at the lower point of the slope in the FE model, whereas it is at the middle point in the laboratory model. In the overburden pressure stages, the maximum movement is at the mid-point in both models. The highest horizontal slope movement occurs at an overburden pressure of 30 kN/m2 in both cases. The percentage of difference in highest movement varies between 16.15% at overburden pressure of 30 kN/m2 to 27.0% at overburden pressure of 10 kN/m2.
For medium sand and dense sand, at the construction stage, the highest horizontal displacement occurs at the lower point of the slope in the FE model, whereas it is at the middle point in the laboratory model. The highest movement is at mid-point under overburden pressure stages, and the highest horizontal slope movement occurs at an overburden pressure of 30 kN/m2 in both FE and laboratory models. The percentage of variation in highest movement ranges between 14.68% at overburden pressure of 30 kN/m2 to 29.01% at overburden pressure of 10 kN/m2 for the medium dense sand slope. For the dense sand slope, the difference in highest movement ranges from 17.58% at surcharge 30.0 kN/m2 to 15.38% at overburden pressure of 10 kN/m2. It can be concluded that the FE model and the laboratory model exhibit similar trends in the behavior of the nailed-soil slope.

7. Sensitivity Analysis of Experimental Set-Up Dimensions

The sensitivity analysis of the obtained results is carried out for plain strain conditions validation and dimensions selection. The numerical models using PLAXIS 3D were developed for sensitivity analysis by varying the dimensions of experimental set-up. The sensitivity of the experimental set-up is studied for the different toe soil depth and for plain strain condition. For sensitivity investigation, the experimental results were compared with the numerical results for soil toe depths of 15 cm and 20 mm, and for 100-cm- and 120-cm-deep soil (in transverse direction). In three-dimension finite element models, the soil materials and other volume clusters are modeled using the 10-node tetrahedral elements. The six-node plate elements are used for foundation modeling. The nails in the 3D finite element model are simulated using two-node elastic spring elements with constant spring stiffness. The experimental set-up dimension and increase dimension models are shown in Figure 26.
The plots of horizontal and vertical displacement of the nailed-soil slope using three-dimensional models in the working stage (stage 6) in the experimental set-up dimensions model, model with increased depth and model with increased width are depicted in Figure 27 and Figure 28. The experimental set-up used in the investigation is found to be sensitive to the toe soil depth and is not fully under plain strain conditions.

8. Conclusions

The finite element modeling of various stages of the soil-nailing process, i.e., construction stages and overburden pressure stages, was carried out, simulating with in-house developed laboratory models, in the present study. The soil-nailing process built in the laboratory models was idealized as a plain strain problem and modeled in PLAXIS software. The laboratory models of the soil-nailing process consisted of a Perspex sheet box filled with sandy soil, a Perspex sheet facing, steel bars for reinforcement and a steel plate for foundation. The stress–strain behavior of the sand was represented by a Hardening-Soil model, and the soil–nail interface was described by the Coulomb friction model. The behavior of the soil-nailing process during the construction stage and under overburden pressure were investigated in terms of the horizontal movement of the face of the slope, vertical settlement of the foundation and stress conditions in slope soil mass. The results of the FE model were also compared with the laboratory model results. The sensitivity analysis of the experimental set-up for plain strain condition verification was carried out by three-dimensional modeling of the nailed-soil slope.
The following conclusions may be drawn from the present study.
  • The developed FE model has the potential to simulate the performance of a field nailed-soil slope during construction and working stages.
  • The measured results for lateral displacement and settlement of the strip footing during construction and overburden pressure stages are higher than FE-simulated results of the soil-nailing process.
  • From the sensitivity analysis, it can be inferred that the experimental set-up used in the investigation is found to be sensitive to the toe soil depth, and the plain strain condition assumption is not fully satisfied.
  • The developed FE models could provide guidance for the construction/maintenance of soil-nailed cut slopes in granular soils/weathered rocks.
  • The lateral displacement of the slope’s facing occurs in the slope’s middle third during the construction stages, and lateral displacement further increases with the application of overburden pressure. The minimum lateral displacement is at the upper third of the slope at various stages of investigation. The overburden pressure stages exhibit a higher reduction in facing lateral displacement and stresses within the soil mass with the increase of soil density as compared to the construction stages.
  • Shear stresses increase near the top surface of slope and slope face as well as near and under the foundation at the construction stages, while, within the nailed-soil mass, the values are constant. As expected, zero shear stresses are developed at the reinforced mass. In overburden pressure stages, shear stresses are enlarged with the rise of the overburden pressure.

Author Contributions

Conceptualization, M.H.M. and M.A.; methodology, M.H.M. and M.A.; resources, J.M.; writing—original draft preparation, M.H.M. and M.A., writing—review and editing, J.M.; project administration, S.A.; funding acquisition, M.A. All authors have read and agreed to the published version of the manuscript.

Funding

Funding for this research was given under award numbers R.G.P2/190/43 for Large Group Research Projects by the Deanship of Scientific Research, King Khalid University, Ministry of Education, Kingdom of Saudi Arabia.

Institutional Review Board Statement

Not applicable.

Informed Consent Statement

Not applicable.

Data Availability Statement

Not applicable.

Acknowledgments

The authors extend their appreciation to the Deanship of Scientific Research at King Khalid University for funding this work. The authors acknowledge the Dean of the Faculty of Engineering for his valuable support and help.

Conflicts of Interest

The authors declare no conflict of interest.

References

  1. Stocker, M.F.; Korber, G.W.; Gassler, G.; Gudehus, G. Soil Nailing. In Proceedings of the International Conference on Soil Reinforcement, Reinforced Earth and other Techniques, Paris, France, 20–22 March 1979. [Google Scholar]
  2. Lazarte, C.A.; Robinson, H.; Gomez, J.E.; Baxter, A.; Cadden, A.; Berg, R. Soil Nail Walls-Reference Manual; Geotechnical Engineering Circular No. 7, Report No. FHWA-NHI-14-007; Federal Highway Administration: Washington, DC, USA, 2015.
  3. Cornforth, D.H. Landslide in Practice: Investigation, Analysis, and Remedial/Preventative Options in Soils, 1st ed.; Wiley: Hoboken, NJ, USA, 2005. [Google Scholar]
  4. Sharma, M.; Samanta, M.; Sarkar, S. Soil Nailing: An Effective Slope Stabilization Technique. Landslides: Theory, Practice and Modelling. In Advances in Natural and Technological Hazards Research; Pradhan, S., Vishal, V., Singh, T., Eds.; Springer: Cham, Switzerland, 2019. [Google Scholar]
  5. Mohsen, F.; Khodadadi, R. The Effect of Nail Inclination Angle on Improving the Performance of Nailing System in Vertical Excavation. Civ. Eng. Res. J. 2017, 1, 56–61. [Google Scholar] [CrossRef]
  6. Derghoum, R.; Meksaouine, M. Numerical study for optimal design of soil nailed embankment slopes. Int. J. Geo Eng. 2021, 12, 15. [Google Scholar] [CrossRef]
  7. Elahi, T.E.; Islam, M.A.; Islam, M.S. Parametric Assessment of Soil Nailing on the Stability of Slopes Using Numerical Approach. Geotechnics 2022, 2, 615–634. [Google Scholar] [CrossRef]
  8. Oliaei, M.; Norouzi, B.; Binesh, S.M. Evaluation of soil-nail pullout resistance using mesh-free method. Comput. Geotech. 2019, 116, 103179. [Google Scholar] [CrossRef]
  9. Wu, J.-J.; Cheng, Q.-G.; Liang, X.; Cao, J.-L. Stability analysis of a high loess slope reinforced by the combination system of soil nails and stabilization piles. Front. Struct. Civ. Eng. 2014, 8, 252–259. [Google Scholar] [CrossRef]
  10. Benayoun, F.; Boumezerane, D.; Bekkouche, S.R.; Bendada, L. Application of genetic algorithm method for soil nailing pa-rameters optimization. In Proceedings of the 5th International Conference on New Advances in Civil Engineering (ICNACE), Kyrenia, Cyprus, 8–10 November 2019. [Google Scholar]
  11. Ehrlich, M.; da Rosa, C.A.B.; Mirmoradi, S.H. Effect of construction and design factors on the behaviour of nailed-soil structures. Proc. Inst. Civ. Eng. Geotech. Eng. 2022, 175, 618–630. [Google Scholar] [CrossRef]
  12. Ceccato, F.; Bisson, A.; Cola, S. Large displacement numerical study of 3D plate anchors. Eur. J. Environ. Civ. Eng. 2020, 24, 520–538. [Google Scholar] [CrossRef]
  13. Cheuk, C.Y.; Ng, C.W.W.; Sun, H.W. Numerical experiments of soil nails in loose fill slopes subjected to rainfall infiltration effects. Comput. Geotech. 2005, 32, 290–303. [Google Scholar] [CrossRef]
  14. Alhabshi, A. Finite Element Design Based Design Procedures for MSE/Soil- Nail Hybrid Retaining Wall System. Ph.D. Thesis, Texas Tech University, Lubbock, TX, USA, 2006. [Google Scholar]
  15. Ye, X.; Wang, S.; Zhang, S.; Xiao, X.; Xu, F. Numerical and experimental studies of the mechanical behaviour for compaction grouted soil nails in sandy soil. Comput. Geotech. 2017, 90, 202–214. [Google Scholar] [CrossRef]
  16. Sojoudi, Y.; Sharafi, H. Study of soil deformation pattern in earth slope stabilised with pile. Eur. J. Environ. Civ. Eng. 2021, 25, 205–225. [Google Scholar] [CrossRef]
  17. Han, W.; Li, G.; Sun, Z.; Luan, H.; Liu, C.; Wu, X. Numerical Investigation of a Foundation Pit Supported by a Composite Soil Nailing Structure. Symmetry 2020, 12, 252. [Google Scholar] [CrossRef]
  18. Zhou, W.-H.; Yin, J.-H.; Hong, C.-Y. Finite element modelling of pullout testing on a soil nail in a pullout box under different overburden and grouting pressures. Can. Geotech. J. 2011, 48, 557–567. [Google Scholar] [CrossRef]
  19. Stauffer, K.D. Three-Dimensional Stability Analyses of Soil-Nailed Slopes by Finite Element Method. Ph.D. Thesis, West Virginia University, Morgantown, WV, USA, 2015. [Google Scholar] [CrossRef]
  20. Kaothon, P.; Chhun, K.T.; Yune, C.-Y. Numerical evaluation on steep soil-nailed slope using finite element method. Int. J. Geo Eng. 2021, 12, 31. [Google Scholar] [CrossRef]
  21. Rawat, S.; Gupta, A.K. Analysis of a Nailed Soil Slope Using Limit Equilibrium and Finite Element Methods. Int. J. Geosynth. Ground Eng. 2016, 2, 34. [Google Scholar] [CrossRef]
  22. Sobhey, M.; Shahien, M.; El Sawwaf, M.; Farouk, A. Analysis of Clay Slopes with Piles Using 2D and 3D FEM. Geotech. Geol. Eng. 2021, 39, 2623–2631. [Google Scholar] [CrossRef]
  23. Jayanandan, M.; Chandrakaran, S. Numerical Simulation of Soil Nailed Structures. Int. J. Eng. Res. Technol. 2015, 4, 525–530. [Google Scholar]
  24. Tong, X.; Tang, H. PLAXIS Finite Element Modelling and Analysis of Soil Nailing Support for Deep Foundation Pit. Front. Soc. Sci. Technol. 2017, 3, 135–139. [Google Scholar] [CrossRef]
  25. Dong, B.-C.; Chen, S.-L.; Wang, Y.-X.; Yang, T.; Ju, B.-B. Research on the Stability of Anti-Slip Pile Support Structures for Railway Pile Slopes. Symmetry 2022, 14, 2291. [Google Scholar] [CrossRef]
  26. Sterpi, D.; Rizzo, F.; Renda, D.; Aguglia, F.; Zenti, C.L. Soil nailing at the tunnel face in difficult conditions: A case study. Tunn. Undergr. Space Technol. 2013, 38, 129–139. [Google Scholar] [CrossRef]
  27. Chen, S.-L.; Hsu, K.-J.; Tang, C.-W.; Zhang, X.-L.; Lai, C.-H. Numerical Analysis of the Crown Displacements Caused by Tunnel Excavation with Rock Bolts. Symmetry 2022, 14, 1508. [Google Scholar] [CrossRef]
  28. Sharma, A.; Ramkrishnan, R. Parametric Optimization and Multi-Regression Analysis for Soil Nailing Using Numerical Ap-proaches. Geotech. Geol. Eng. 2020, 38, 3505–3523. [Google Scholar] [CrossRef]
  29. Villalobos, S.A.; Villalobos, F.A. Effect of nail spacing on the global stability of soil nailed walls using limit equilibrium and finite element methods. Transp. Geotech. 2021, 26, 100454. [Google Scholar] [CrossRef]
  30. Kalehsar, R.I.; Khodaei, M.; Dehghan, A.N.; Najafi, N. Numerical modeling of effect of surcharge load on the stability of nailed soil slopes. Model. Earth Syst. Environ. 2022, 8, 499–510. [Google Scholar] [CrossRef]
  31. Singh, S.K.; Negi, M.S.; Singh, J. Strengthening of Slope by Soil Nailing Using Finite Difference and Limit Equilibrium Methods. Int. J. Geosynth. Ground Eng. 2021, 7, 64. [Google Scholar] [CrossRef]
  32. Deng, D.-P.; Li, L.; Zhao, L.-H. Stability analysis of slopes reinforced with anchor cables and optimal design of anchor cable parameters. Eur. J. Environ. Civ. Eng. 2021, 25, 2425–2440. [Google Scholar] [CrossRef]
  33. Panigrahi, R.K.; Dhiman, G. Design and Analysis of Soil Nailing Technique for Remediation of Landslides. Highw. Res. J. 2019, 10, 24–32. [Google Scholar]
  34. Sahoo, S.; Manna, B.; Sharma, K. Shaking Table Tests to Evaluate the Seismic Performance of Soil Nailing Stabilized Embankments. Int. J. Geomech. 2021, 21, 04021036. [Google Scholar] [CrossRef]
  35. Shoar, S.M.S.; Heshmati, R.A.A.; Salehzadeh, H. Investigation of Failure Behaviour of Soil Nailed Excavations under Surcharge by Centrifuge Model Test. KSCE J. Civ. Eng. 2022, 27, 66–79. [Google Scholar] [CrossRef]
  36. Mohamed, M.H.; Ahmed, M.; Mallick, J.; Hoa, P.V. An Experimental Study of a Nailed Soil Slope Model: Effects of Building Foundation and Soil Characteristics. Appl. Sci. 2021, 11, 4842. [Google Scholar] [CrossRef]
  37. Damians, I.P.; Yu, Y.; Lloret, A.; Bathurst, R.J.; Josa, A. Equivalent interface properties to model soil-facing interactions with zero-thickness and continuum element methodologies. In Proceedings of the 15th Panamerican Conference on Soil Mechanics and Geotechnical Engineering, Buenos Aires, Argentina, 15–18 November 2015. [Google Scholar] [CrossRef]
  38. Abioghli, H. Effect of Changes of Mesh Size on the Numerical Analysis of Reinforced Soil Walls. Aust. J. Basic Appl. Sci. 2011, 5, 1693–1696. [Google Scholar]
  39. Duncan, J.M.; Chang, C.-Y. Nonlinear Analysis of stress and strain in soils. J. Soil Mech. Found. Div. 1970, 96, 1629–1653. [Google Scholar] [CrossRef]
  40. Vermeer, P.A.; Meier, C.P. Deformation Analyses for Deep Excavation. In Proceedings of the 4th International Geotechnical Engineering Conference, Cairo, Egypt, 3–4 October 2000; pp. 153–171. [Google Scholar]
Figure 1. Development stages of the soil-nailing process [21].
Applsci 13 02139 g001
Figure 2. Laboratory model and schematic sketch of the nailed-soil slope [36].
Applsci 13 02139 g002
Figure 3. Nodes and stress points in various elements. (a) 15-node triangle element. (b) 5-node beam element. (c) 10-node interface element.
Applsci 13 02139 g003
Figure 4. Mesh plots of the soil-nailing process during the construction and overburden pressure stages. (a) Initial mesh. (b) Mesh at stage 1. (c) Mesh at stage 3. (d) Mesh at stage 4. (e) Mesh at stage 5. (f) Mesh at stage 6. (g) Mesh at stage 8. (h) Mesh at stage 9.
Applsci 13 02139 g004
Figure 5. Stress–strain curve for soil material.
Applsci 13 02139 g005
Figure 6. Horizontal displacement of the nailed-soil system during the construction and overburden pressure stages. (a) Construction stage 1. (b) Construction stage 3. (c) Construction stage 5. (d) Overburden pressure stage 6. (e) Overburden pressure stage 7. (f) Overburden pressure stage 9.
Applsci 13 02139 g006
Figure 7. Vertical displacement of the slope (construction and overburden pressure stages). (a) Overburden pressure stage 6. (b) Overburden pressure stage 7. (c) Overburden pressure stage 9.
Applsci 13 02139 g007
Figure 8. Horizontal stresses during the construction and overburden pressure stages. (a) Construction stage 1. (b) Construction stage 5. (c) Overburden pressure stage 6. (d) Overburden pressure stage 9.
Applsci 13 02139 g008aApplsci 13 02139 g008b
Figure 9. Vertical stresses during the construction and overburden pressure stages. (a) Construction stage 1. (b) Construction stage 5. (c) Overburden pressure stage 6. (d) Overburden pressure stage 9.
Applsci 13 02139 g009aApplsci 13 02139 g009b
Figure 10. Shear stresses during the construction and overburden pressure stages. (a) Construction stage 1. (b) Construction stage 3. (c) Construction stage 5. (d) Overburden pressure stage 6. (e) Overburden pressure stage 9.
Applsci 13 02139 g010aApplsci 13 02139 g010b
Figure 11. Horizontal displacements of the slope face with various soil densities. (a) Loose sand. (b) Medium dense sand. (c) Dense sand.
Applsci 13 02139 g011
Figure 12. Horizontal displacements of the slope face with various soil densities (at mid-height).
Applsci 13 02139 g012
Figure 13. Vertical settlement of the footing with various soil densities.
Applsci 13 02139 g013
Figure 14. Horizontal stresses at the slope face with various soil densities. (a) Loose sand. (b) Medium dense sand. (c) Dense sand.
Applsci 13 02139 g014
Figure 15. Horizontal stresses at the slope face with various soil densities (at mid-height).
Applsci 13 02139 g015
Figure 16. Vertical stresses under the soil mass with various soil densities. (a) Loose sand. (b) Medium dense sand. (c) Dense sand.
Applsci 13 02139 g016
Figure 17. Vertical stresses under the soil mass with various soil densities at mid-point.
Applsci 13 02139 g017
Figure 18. Horizontal stresses behind nailed-soil mass with various soil densities. (a) Loose sand. (b) Medium dense sand. (c) Dense sand.
Applsci 13 02139 g018
Figure 19. Horizontal stresses behind nailed-soil mass with various soil densities at mid-height of the slope.
Applsci 13 02139 g019
Figure 20. Vertical stresses behind nailed-soil mass with various soil densities. (a) Loose sand. (b) Medium dense sand. (c) Dense sand.
Applsci 13 02139 g020
Figure 21. Vertical stresses behind nailed-soil mass with various soil densities at mid-height of the slope.
Applsci 13 02139 g021
Figure 22. Vertical settlement of footing from FE and laboratory models with various soil densities.
Applsci 13 02139 g022
Figure 23. Horizontal movement of the slope from the laboratory and FE model (loose sand). (a) Construction stage 5. (b) Overburden pressure stage 6. (c) Overburden pressure stage 9.
Applsci 13 02139 g023
Figure 24. Horizontal movement of the slope from the laboratory and FE model (medium sand). (a) Construction stage 5. (b) Overburden pressure stage 6. (c) Overburden pressure stage 9.
Applsci 13 02139 g024
Figure 25. Horizontal movement of the slope from the laboratory and FE model (dense sand). (a) Construction stage 5. (b) Overburden pressure stage 6. (c) Overburden pressure stage 9.
Applsci 13 02139 g025
Figure 26. 3D model of the experimental set-up dimensions, model with increased depth and model with increased width. (a) Experimental set-up dimensions model. (b) Model with increased toe depth. (c) Model with increased width.
Applsci 13 02139 g026
Figure 27. Plots of horizontal displacement of the nailed-soil slope in the experimental set-up dimensions model, model with increased depth and model with increased width. (a) Experimental set-up dimensions model. (b) Model with increased toe depth. (c) Model with increased width.
Applsci 13 02139 g027
Figure 28. Plots of vertical displacement of the nailed-soil slope in the experimental set-up dimensions model, model with increased depth and model with increased width. (a) Experimental set-up dimensions model. (b) Model with increased toe depth. (c) Model with increased width.
Applsci 13 02139 g028
Table 1. Properties of the sand used in the soil-nailing process [36].
PropertyValuePropertyValue
Percentage of clay0.00Coefficient of uniformity (Cu)1.99
Percentage of silt1.33Coefficient of gradation (Cc)1.00
Percentage of fine sand39.17Specific gravity (Gs)2.62
Percentage of medium sand58.63Minimum unit weight (γmin) (kN/m3)15.30
Percentage of coarse sand0.87Maximum unit weight (γmax) (kN/m3)17.80
Percentage of fine gravel0.00Void ratio, minimum (emin)0.472
Effective diameter, mm (D10) 0.126Void ratio, maximum (emax)0.712
Table 2. Facing and foundation material properties [36].
Plate ElementMaterialWidth (mm)Thickness
(mm)
Young’s Modulus
(kPa)
Bending
Stiffness
(kN·mm2)
Stiffness (Axial, EA),
(kN)
FoundationSteel15022.021.2 × 107188,186.64665.78
Facing PlatePerspex 1405.042000.043750.021
Table 3. Steel Reinforcement Material Properties [33].
ElementLength
(mm)
Maximum Tensile Force (kN)Strains at Ultimate Stress (10−6)Maximum
Tensile Strength (kPa)
Young’s
Modulus (kPa)
Flexural
Rigidity, EI (kN·mm2)
Normal
Stiffness, EA (kN/m)
Nails700.017.476258.8 × 10521.2 × 1076.51 × 10−34165.9
Table 4. Nailed-soil slope geometry parameters in the laboratory model [36].
Geometry Parameter 1A (mm)B (mm)X (mm)Z (mm)Y (mm)Sh = Sv (mm)Slope Angle (θo)H = Ln (mm)
Value40515022514683428040700
1 A—width of soil beyond the footing; B—footing width; X—distance of footing from crest; Y—width of soil beyond slope toe; Z—base width of soil below the slope; θ—angle of the slope; δ—nail inclination; Ln—length of nail; H—height of excavation; Sv—vertical spacing of nail; Sh—horizontal spacing of nail.
Table 5. Slope material model parameters [33].
Soil TypeBulk Density (kN/m3)Soil Model,
Mohr–Coulomb
Plastic Straining
Due to Primary Compression/Deviator Loading (Eoed)ref (kPa)
Elastic Unloading/ReloadingStress-Dependent Stiffness (m)
φC (kPa)Ψ 1υ(Eur)ref (kPa)υur
Loose Sand (RD = 34%)16.06300.200.33132739810.20.5
Medium Sand (RD = 48%)16.41340.240.31195958770.20.5
Dense Sand (RD = 68%)16.92400.2100.26263278960.20.5
1 Angle of dilatancy (degrees).
Disclaimer/Publisher’s Note: The statements, opinions and data contained in all publications are solely those of the individual author(s) and contributor(s) and not of MDPI and/or the editor(s). MDPI and/or the editor(s) disclaim responsibility for any injury to people or property resulting from any ideas, methods, instructions or products referred to in the content.

