Article

End-of-Life Impact on the Cradle-to-Grave LCA of Light-Duty Commercial Vehicles in Europe

1
Dipartimento Energia “Galileo Ferraris”, CARS@Polito, Politecnico di Torino, c.so Duca degli Abruzzi 24, 10129 Torino, Italy
2
Dipartimento di Chimica, Materiali e Ingegneria Chimica “Giulio Natta”, Politecnico di Milano, p.zza Leonardo da Vinci 32, 20133 Milano, Italy
*
Author to whom correspondence should be addressed.
Appl. Sci. 2023, 13(3), 1494; https://doi.org/10.3390/app13031494
Submission received: 7 December 2022 / Revised: 13 January 2023 / Accepted: 20 January 2023 / Published: 23 January 2023

Abstract

:
A cradle-to-grave life cycle assessment focused on end-of-life (EoL) was conducted in this study for three configurations of a light-duty commercial vehicle (LDCV): diesel, compressed natural gas (CNG), and battery electric vehicle (BEV). The aim is to investigate the impact of recycling under two EoL scenarios with different allocation methods. The first is based on the traditional avoided burden method, while the second is based on the circular footprint formula (CFF) developed by the European Commission. For each configuration, a detailed multilevel waste management scheme was developed in compliance with the 2000/53/CE directive and ISO22628 standard. The results showed that the global warming potential (GWP) impact under the CFF method is significantly greater when compared to the avoided burden method because of the A-parameter, which allocates the burdens and benefits between the two connected product systems. Furthermore, in all configurations and scenarios, the benefits due to the avoided production of virgin materials compensate for the recycling burdens within GWP impact. The main drivers of GWP reduction are steel recycling for all of the considered LDCVs, platinum, palladium, and rhodium recycling for the diesel and CNG configurations, and Li-ion battery recycling for the BEV configuration. Finally, the EoL stage significantly reduces the environmental impact of those categories other than GWP.

1. Introduction

1.1. Context

The life cycle assessment (LCA) is an acknowledged method for assessing the environmental impacts of vehicles over their entire life cycle. Due to its inner nature, the LCA comprises evaluating the environmental impacts related to the end-of-life (EoL) stage.
Nevertheless, the assessment of the EoL stage raises a methodological issue in the LCA regarding the system boundary definition [1]. Quantifying the benefits and burdens from material production and recycling at the EoL stage necessitates addressing the issue of their allocation between connected product systems. Unfortunately, several allocation methods are used in the literature to solve this issue, resulting in a high degree of uncertainty on the effect of EoL on the cradle-to-grave impact.
At the same time, increasing regulatory requirements for material recovery is making end-of-life vehicle (ELV) management a global concern in the automotive industry [2,3,4,5]. With reference to road vehicles, starting from 1 January 2015, the 2000/53/CE directive of the European Union set the objective for ELVs to be reused and recovered for at least 95% of their mass, with no more than 10% of that mass being recovered as energy [6]. Moreover, since landfill disposal poses a substantial environmental risk due to the presence of polycyclic aromatic hydrocarbons (PAHs) and volatile organic compounds (VOCs) in the biogas produced by landfilled compounds [7], no more than 5% of the ELVs mass should be landfilled as the last preferred option. In accordance with the 2000/53/CE directive and the ISO 22628 standard [8], ELVs should be processed through a three-step waste management scheme: depollution, dismantling, and shredding. A fourth stage, which we referred to as the postshredding stage, was included in this study. According to [7], at the end of the third stage, 20–25% of the output consists of the so-called automotive shredder residue (ASR). Although the ASR was largely landfilled prior to 2015 due to its heterogeneous and complex matrix [7,9], in more recent years, to meet the requirements of the 2000/53/CE directive, postshredder technologies were prioritized in an effort to improve the recovery of materials and energy from ASR [7].
Due to the need to be compliant with a mandatory waste management scheme, the existence of several allocation methods, the complexity of the vehicle material breakdown, and the scarcity of primary data, modeling the EoL stage is one of the main challenges in the LCA of vehicles.

1.2. State of the Art and the Contribution of the Present Study

Regarding ELVs, according to the most recent literature review conducted by [2], the existing literature mainly regards waste management, reverse logistic network design, and economic assessment. Regarding waste management, many works [3,4,9,10,11,12,13,14] exist and can be useful in supporting an LCA study, though they do not calculate environmental impacts. Examples of reverse logistic network studies are [5,15,16,17,18], while examples of economic assessments are [19,20]. In addition, some works focus on specific aspects that concern ELVs. The authors of [7,21,22,23,24,25,26] focus on the specific treatment of the ASR fraction, while [27,28,29,30] focus on plastic and steel recovery from ELVs. The authors of [31] focused on rare earth element recovery from ELVs, while [32] focuses on the recovery of the bumper. Finally, the authors of [10,33] conduct a scenario analysis, varying the level of deconstruction.
According to [34], few publications concerning the LCA of vehicles include the EoL stage, and for those that do, even fewer of them evaluate environmental impact categories other than GWP. According to [35], assessing the environmental profile of a vehicle based only on GWP would lead to unrealistic conclusions, as the load of further impact categories could be mainly located in the EoL stage. Among the usually neglected categories, resource depletion is rarely analyzed, even though it should be of primary importance in the assessment of the effect of the EoL stage since it considers the speed rate at which resources are consumed, and ELVs are one of the most valuable sources of secondary raw materials. In addition, more than 95% of the papers analyzed in [34] cover passenger cars, disregarding other means of transport, such as light-, medium- and heavy-duty commercial vehicles.
In the following, there are examples of LCA studies that include the EoL stage and a wide range of environmental impact categories. Although LCA is performed in [36], which considers three EoL scenarios that vary by technology level, the study is limited to passenger cars and the Chinese context. It was found that the main environmental impact category that affected EoL is the human toxicity potential and that, when enhancing the recovery of the engine, the nonmetallic and ASR fractions would effectively improve the environmental benefits [36]. The LCA methodology is used in [9] in order to evaluate the environmental performance resulting from three different ELV waste management scenarios considering a dismantler plant in Portugal. It was found that the scenario that includes the supplementary dismantling of the components is the only one that allows for the accomplishment of the target imposed by the European Union [9]. Both in [35] and [37], the comparative LCAs between the different cars are performed with varying vehicle configurations (conventional and electric). Despite the fact that the focus of [35] is not on EoL, it was found that the impact of EoL is surprisingly negligible in all the impact categories considered [35]. In [37], the incidence of different allocation methods was evaluated. It was found that the allocation method has a significant influence on the LCA results [37]; nevertheless, the study heavily relies on secondary data. Moreover, [9,35,37] are limited to passenger cars. Despite referring to a non-European context, a series of noteworthy publications [3,38,39] focus on the LCA of ELVs. These studies distinguish between vehicles that have reached the end of their useful life and those that have been involved in accidents [3,38,39]. It was found that the latter achieve greater parts and/or materials recovery since they are the ones “lightly used” [3]. Even though useful LCIs based on the primary data of a North American dismantler can be found in [39], in [3,38,39], the environmental impacts are not calculated, and no difference is made between vehicle configurations.
This paper reports the results of a cradle-to-grave LCA of three light-duty commercial vehicles (LDCV) configurations: diesel, compressed natural gas (CNG), and battery electric vehicle (BEV). For each configuration, the environmental benefits and burdens of the EoL stage were evaluated.
This is one of the few studies to have considered a type of vehicle different from the passenger car and to have focused on the transport of goods rather than passengers. Urban freight transport (UFT), in fact, is a growing market sector, especially due to e-commerce [40]. Moreover, the COVID-19 pandemic has highlighted the importance of urban logistics since it further accentuated the expansion of e-commerce and instant deliveries [41].
Another aspect of the novelty of this study concerns the investigation of the recycling effect on its impact under two different allocation methods, which we will refer to as the EoL scenarios. In fact, the environmental impacts calculated through the avoided burden method were compared to the ones calculated with the circular footprint formula (CFF). While the avoided burden method is the most used approach in the literature, the CFF is highly relevant because it was developed within the PEF method of the European Commission, with the aim of standardizing the allocation of burdens and benefits in the EoL stage [42].
Unlike many other studies, a significant number of primary data have been used in this paper: the bill of materials (BOM) of the vehicles, the data of the manufacturing plant, and the data of the supplier locations have been provided by the vehicle manufacturer.
Materials and methods are reported in Section 2, which is divided into three paragraphs. First, a brief description of the LCA methodology is reported in Section 2.1. Second, for each vehicle configuration, the waste management scheme is described in Section 2.2. Finally, the two EoL scenarios are explained in Section 2.3.

2. Materials and Methods

2.1. LCA Methodology

The LCA methodology applied in this work follows the recommendations of ISO 14040 and ISO 14044 [43,44].

2.1.1. Goal of the Study and System Boundary

The aim of this study is two-fold. First, this study contributes to addressing a well-known LCA methodological issue concerning the allocation method to be used if the EoL stage is included in the system boundary. Two EoL scenarios were considered for this purpose, each dealing with the allocation of burdens and benefits between connected product systems in a different way. Specifically, the environmental impacts calculated through the avoided burden (or 0:100) method were compared to the ones calculated with the circular footprint formula (CFF). To prevent double counting of burdens and benefits, the avoided burden method permits the inclusion of the recycling process in the system boundary and prohibits the inclusion of secondary material as input. The CFF method, instead, permits the inclusion in the system boundary of both the recycling and the secondary material (as input), preventing double counting through an economic allocation factor A. For a broader understanding of the outcomes, the following vehicle configurations characterized by different propulsion systems were considered:
  • Diesel oil internal combustion engine vehicle (DIE-ICEV);
  • Compressed natural gas internal combustion engine vehicle (CNG-ICEV);
  • BEV.
The second objective of this study is to evaluate the relevance of the EoL stage to the overall cradle-to-grave life cycle. For this purpose, this study also includes the cradle-to-grave LCA results of the three LDCVs considered. For each vehicle configuration, the following LCA stages (detailed in Appendix A) are constant as the EoL scenario assumed variations in
  • Manufacturing;
  • Distribution;
  • Use;
  • Maintenance;
  • Collection at EoL.
In Figure 1, the system boundary is reported, wherein the EoL stage is highlighted in yellow. At the end of the manufacturing stage, the DIE-ICEV, CNG-ICEV, and BEV references of this study are characterized by a curb weight of 2700 kg, 2845 kg, and 2876 kg, respectively.
Regarding the EoL stage, for each vehicle configuration, an LCI based on a detailed multilevel waste management scheme was developed in compliance with the 2000/53/CE directive and the ISO 22628 standard to chiefly investigate the environmental emissions of the EoL stage and their effect on the overall life cycle. For each EoL scenario, the depollution, dismantling, shredding, and postshredding stages were considered, along with the following fates of the materials: recycling, reuse, incineration with energy recovery, and landfilling. More detail regarding the other LCA stages can be found in the authors’ previous works [40,45].

2.1.2. Functional Unit and Reference Flow

In this study, the functional unit is 1 vehicle reaching the EoL when the assessment is limited to the comparison of the EoL scenarios. The functional unit is 1 km of the driving mission when the assessment is expanded to the entire cradle-to-grave LCA. Since it was supposed that the three configurations of the LDCVs were used in an urban logistic scenario, a specific driving mission was chosen for the use phase, which includes a trip from the warehouse to the distribution locations (payload equal to 50% of maximum load condition) and back to the warehouse (null payload condition). The lifetime considered for the three configurations under study is 240,000 km, as proposed by the manufacturer.

2.1.3. Data Sources

Life cycle inventories (LCIs) were compiled with the data provided by the vehicle manufacturer. All the background processes involved in the production of the vehicles were included in the LCIs: mining and transforming of the raw materials, production and distribution of electricity and heat through the national grids, and transportation emissions during the distribution of the vehicles from plant to retailers. The Ecoinvent 3.6 database was used as the background database. Environmental impacts of the BEV configuration strongly depend on the electricity mix used. In this study, it was assumed the European electricity mix was characterized by 117 gCO2eq/MJ.

2.1.4. Impact Assessment

For the impact categories considered in the present study, almost all were assessed using the August 2016 updated version (v. 4.7) of the CML baseline method, while cumulative energy demand (CED) was accounted for by referring to the CED method.

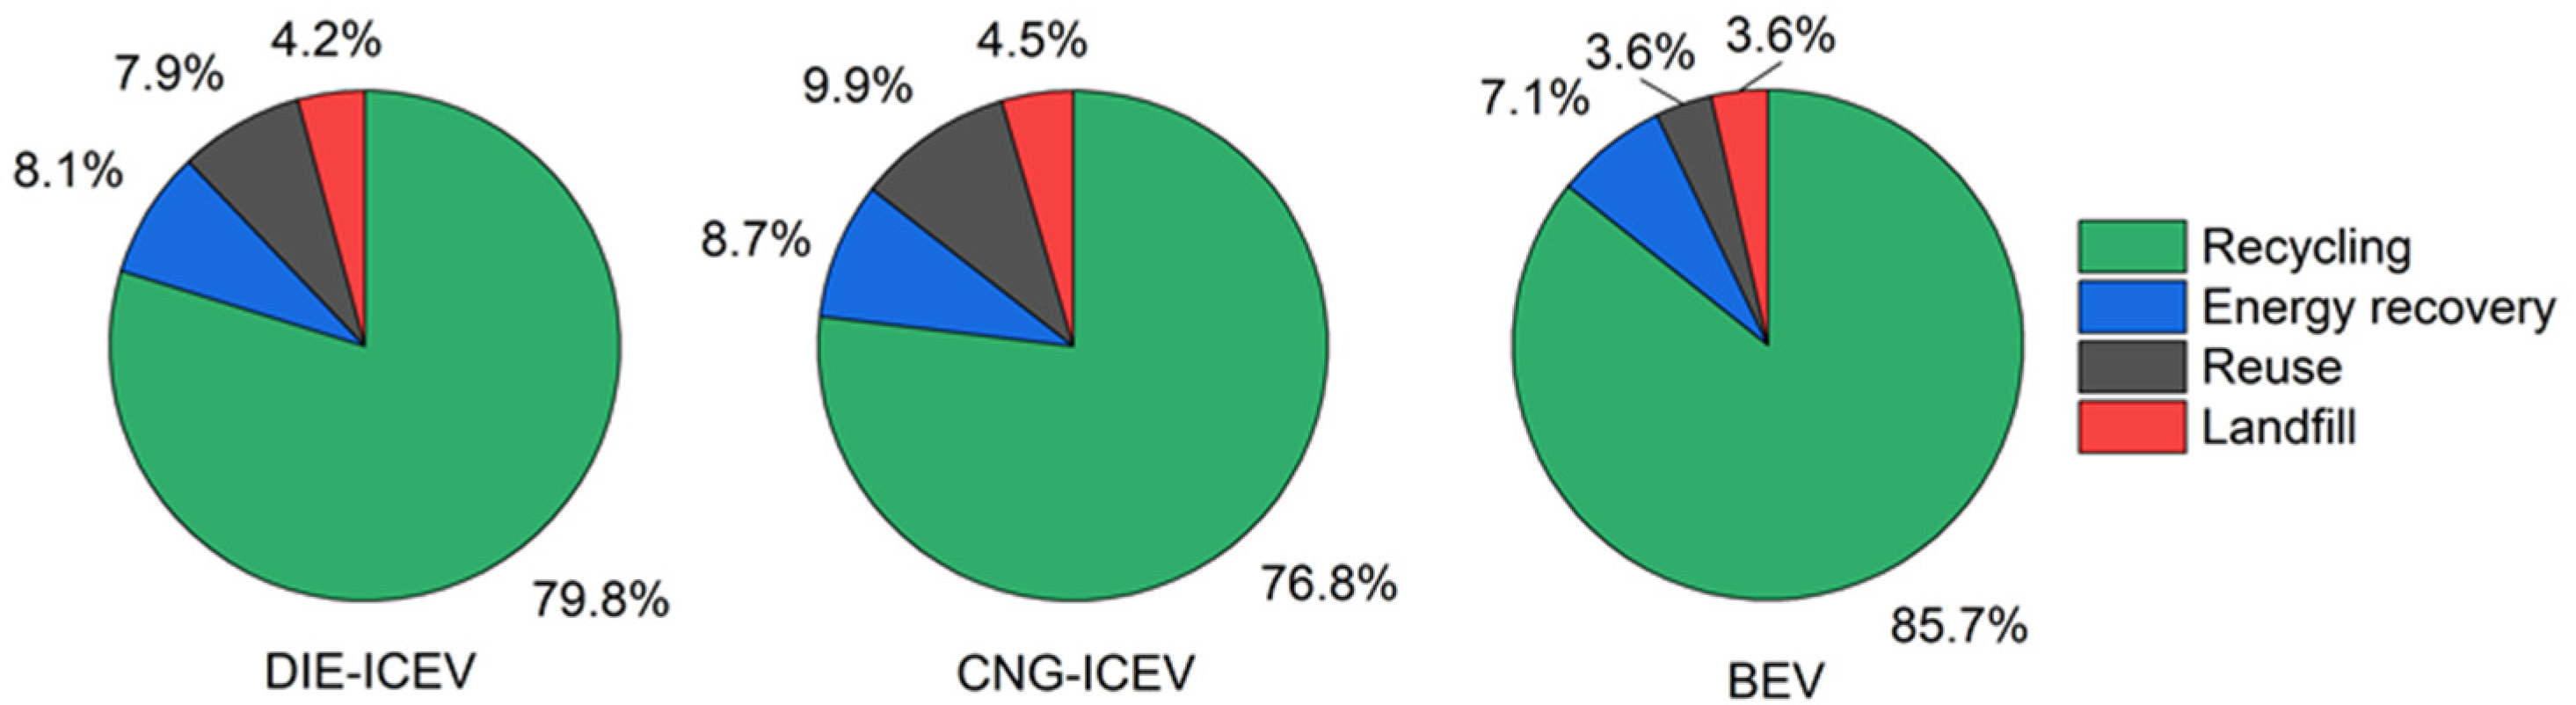
2.2. Waste Management Scheme

For both the EoL scenarios, for each vehicle configuration, a detailed multilevel waste management scheme was developed in compliance with the 2000/53/CE directive and the ISO 22628 standard. All the relevant waste management stages involved were identified: depollution, dismantling, shredding, and postshredding. As a summary, a flowchart of the material and components recovered for each vehicle configuration is reported in Figure 2. The assumptions that have guided the subdivision of the material flows are detailed hereafter.
The first step of the waste management scheme is the depollution stage (referred to as pretreatment in the ISO 22628). This stage is mandatory to remove hazardous components, which could hinder some of the subsequent EoL stages (in the case of airbags, for example, the hazardous components, if not removed during the depollution stage, might hamper the subsequent shredding process) [7]. Components removed in this stage are mainly reused or are characterized by dedicated recycling routes (e.g., batteries). Lead-acid and Li-ion batteries, CNG tanks, and all types of fluids and airbags are assumed to be removed in this stage. As can be seen in Figure 2, a significant part of the weight is removed in the depollution stage for the CNG-ICEV (254 kg) and BEV (483 kg) configurations due to the CNG tanks and Li-ion batteries, respectively.
The second stage of the waste management scheme is the dismantling stage, which aims at removing the components and parts to be recycled. The following components are assumed to be removed in this stage: electric and electronic components, metal components containing copper, aluminum, and magnesium (e.g., steering shaft, brake disc, shock absorber, steering wheel, antilock braking system, seats, gearbox, clutch control, engine, and all the components containing magnesium alloys), tires, exhaust systems, BEV powertrain, glass, and all components that could represent a source of income (e.g., spare parts). In addition, Directive 2000/53/EC also mentions plastic components from “bumpers, dashboard, fluid containers” to be removed in this stage. According to [46], the amount of plastic and elastomers removed in the dismantling stage corresponds to the 2% of the total ELV weight; thus, this value was used.
At this point, the remaining wrecks are shredded. A detailed description of the shredding material breakdown is provided in [10], in which three campaigns of deconstruction were conducted on 90 ELV samples.
According to [10], considering the C3 campaign (maximum removal share of components), it was assumed that the share of ASR in the output of the shredding process corresponds to the 24.9% in weight of the shredding input mass. As can be seen in Figure 2, the remaining part of the shredding input (75.1%) is constituted by ferrous and nonferrous metal fractions.
The ASR fraction is finally involved in a postshredding stage to further promote recycling. It was assumed, in this stage, that the ASR fraction is divided into three parts: metallic, polymeric, and nonidentified (mainly constituted by textiles and fines). Percentage by weight of the metallic ASR fraction was based on [10] and is reported in Table 1. Consequently, the percentages by weight of the polymeric and nonidentified ASR fractions are estimated and reported in Table 1.
Percentages by weight of material removed in each stage for each vehicle configuration are reported in Table 2. The role of the depollution stage is particularly significant for the CNG and BEV configurations due to the removal of the CNG tanks and Li-ion batteries. The role of the postshredding stage also appears to be significant. The contribution of both the shredding and postshredding stages is about 64–72%, depending on the configuration chosen. This is in line with [7].

Material Fate

After the division of the material flows, it is necessary to assume material fate. In compliance with the 2000/53/EC directive, there are 4 possible fates: reuse, recycling, incineration with energy recovery, and disposal (Figure 2). Another term is reported in the directive: “recovery” and it includes both material (recycling) and thermal (incineration with energy recovery) valorizations.
Some components were identified as possible spare parts, and they are assumed to be reused. Other components necessitating selective collection for easier recycling (e.g., tires, batteries, and plastic parts) [47] were assumed to be disposed of with special treatments. In Table S2 the assumed fates are reported for all components based on [45,48,49].
Before directive 2000/53/EC, the ASR fraction was largely landfilled, but to reach the targets imposed, new postshredding technologies have been developed [7]. For this reason, it was assumed that the metallic and polymeric fractions of the ASR were successfully separated and recycled [50], while the nonidentified fraction are partially incinerated with energy recovery and partially landfilled.
As explained previously, directive 2000/53/EC requires that a specific percentage of the weight must be recycled [47]. The rate of both reuse and recovery is set at a minimum of 95%. For each ELV, Figure 3 shows the rates of recycling, reuse, landfill, and incineration with energy recovery obtained (with the waste management scheme described in the previous paragraph). The rates of reuse and recycling are 88%, 87%, and 89% for DIE-ICEV, CNG-ICEV, and BEV configurations, respectively. The rates of reuse and recovery are 96%, 95%, and 96%. This is possible if the ASR nonidentified fraction, which consists mainly of textiles and fines, is incinerated with energy recovery for 65% of its weight and landfilled for 35%.

2.3. EoL Scenarios

Reuse, recycling, landfilling, and incineration with/without energy recovery, as well as the use of secondary materials as recycled content, leads to questions on how to allocate the benefits and burdens between the two connected product systems. Several approaches for the EoL stage have been broadly discussed within the LCA community [34] to deal with the identification of the boundary between the two connected life cycles and to solve how the benefits and burdens of generating and using recycled material should be shared between the two [51]. From a legislative point of view, the question surrounding EoL is whether the focus is more on promoting recycling or the use of secondary materials [34]. In fact, while the most common EoL approaches promote, respectively, recycling (avoided burden approach or 0:100 approach) or the use of secondary materials (cut-off approach or 100:0 approach), the CFF method aims at partitioning the burden and benefits through A, an economic allocation factor promoting both [51]. In this study, the avoided burden approach and the CFF approach were compared. Since, in the cut-off approach, no burdens or benefits are assigned to recycling and incineration with energy recovery, this approach was excluded from the comparison as it was not suitable for the purpose of this study.

2.3.1. Avoided Burden Method

In the avoided burden method, the system boundary is expanded to two connected product systems. Materials coming from the first life cycle are assumed to be recovered and consumed again in the subsequent life cycle. In this study, one of the two EoL scenarios is based on the avoided burden method. According to this, the benefits are assigned to each
  • product/material that produces a share of recycled;
  • product that is reused.
The environmental impacts of each vehicle are credited, taking into account the recycling rate of each material, as it is assumed that secondary materials, obtained through recycling or reuse, will be used in the subsequent life cycle, thereby avoiding additional environmental releases from their primary production [47]. Since only virgin materials are considered as input, benefits are credited only at the last stage of the life cycle: the EoL stage [49]. The LCIs of this EoL scenario are reported in Table S3 for each ELV. Materials and components involved in recycling and reuse are listed in the section “Avoided products” in Table S3.
Regarding incineration with energy recovery, the conversion of nonrecyclable waste materials into usable heat and electricity through combustion generates a renewable energy source and reduces GHG emissions by offsetting the need for energy from fossil fuel sources and reduces methane generation in landfills [52]. Since there is a lack of guidelines on how to calculate the avoided burdens that result from energy recovery, in this study, the calculation proposed in the CFF method was assumed for both of the EoL scenarios.

2.3.2. CFF Method

The European product environmental footprint (PEF) method has been developed with the aim of increasing comparability and reducing the flexibility of methodological choices when the impact categories of different products within the same product category are evaluated [42]. Within ISO, no formula or approach is defined to model the EoL stage [42], while within the PEF method, the CFF was introduced to standardize and predefine the specifications for the modeling of the EoL stage [42]. The current PEF guide [53] requires the use of the CFF to deal with multifunctionality in recycling, re-use, and energy recovery situations. The formula is a combination of three parts, defined as “material part” reported in (1), “energy part” reported in (2), and “other disposal part” reported in (3) [53]. The “material part” (1) can be further portioned in Equation (1a–c). The “material part” (1) is further divided into three parts: the so-called “CFF material part primary” reported in Equation (1a) is the share of impact allocated to the primary material production, the “CFF material part secondary” reported in Equation (1b) is the share of impact allocated to the secondary material production, while the “CFF material part recycling” reported in Equation (1c) is the share of impact allocated to the recycling process minus the benefit for the avoided primary material production.
( 1 R 1 ) E v + R 1 × ( A E r e c y c l e d + ( 1 A ) E v × Q s i n Q p ) + ( 1 A ) R 2 × ( E r e c y c l i n g E o L E v Q s o u t Q p )
( 1 R 1 ) E v
R 1 × ( A E r e c y c l e d + ( 1 A ) E v × Q s i n Q p )
( 1 A ) R 2 × ( E r e c y c l i n g E o L E v Q s o u t Q p )
( 1 B ) R 3 × ( E E R L H V × X E R . h e a t × E S E , h e a t L H V × X E R , e l e c × E S E ,   e l e c )
( 1 R 2 R 3 ) × E D
The A factor shall be in the range 0.2 ≤ A ≤ 0.8, and it allocates the burdens and benefits between the two life cycles, reflecting market realities (0.2 for a low offer of recyclable materials and high demand, and 0.8 for a high offer of recyclable materials and low demand) [53]. It was assumed that the A factor was equal to 0.2 for metals and 0.5 for the other materials.
The B factor is used as an allocation factor for the energy recovery processes but in order to avoid double-counting, it is equal to 0 as default [53].
The two quality ratios, Q s i n / Q p and Q s o u t / Q p , capture the downcycling of a material compared to the original primary material, considering the quality of both the ingoing and the outgoing recycled materials [53]. It was assumed that quality factors are equal to 1 for metals and 0.9 for the other materials.
R 1 is the share of the recycled content in the input at the production stage and it is a primary data provided by the manufacturer.
R 2 is the share of product that will be successfully recycled; in fact, it takes into account the collection and recycling efficiency, while R 3 is the proportion of the material used for energy recovery [53]. When available, EUROSTAT data were used for the R 2 and R 3 factors. In the other cases, Annex C of the PEF guide was used [54].
X E R . h e a t ,   X E R , e l e c are the efficiencies of the energy recovery process for both heat and electricity, and they were assumed to be 0.3 and 0.15, respectively. The lower heating values (LHV) assumed are based on the literature.
Definitions of the specific emissions and resources consumed, E i , are reported in Table A4.
To deal with allocation, all the products/materials are considered as closed-loop product systems or open-loop product systems, where no changes occur in the inherent properties of the recycled material in compliance with [44]. In the specific case in which recyclable material substitutes the same virgin material (thus, in cases where the closed-loop allocation procedure can be applied) [53], E v = E v and E r e c y c l e d = E r e c y c l i n g E o L . The avoided burden scenario and the CFF scenario have, in common, the amounts of material recycled, R 2 , the amount of material used for energy recovery, R 3 , and the specific emissions and resources consumed, E i . To avoid incorrect comparisons, the same values of the quality factors Q s i n / Q p and Q s o u t / Q p have been assumed in the two EoL scenarios.

3. Results

3.1. Comparison of the Two EoL Scenarios

In this section, two EoL scenarios are compared. The two scenarios are based on the two distinct allocation methods: CFF and avoided burden; these only apply to the raw material acquisition, processing, and EoL stages, while the manufacturing and use stages fall outside of their scope. Consequently, this section shows the results of the following life cycle stages: raw material acquisition, processing, and EoL. In Figure 4, the GWP impacts for each vehicle configuration are compared under the CFF (green) avoided burden (grey) methods. In all vehicle configurations, the GWP impact under the CFF scenario is significantly higher than that under the avoided burden scenario. In more detail, the net GWP impact of the CFF method is 19% greater for DIE-ICEV, 18% greater for CNG-ICEV, and 14% greater for BEV when compared to the avoided burden method. This can be explained as follows:
  • In the CFF scenario, the benefits of recycling are partitioned between the two connected product systems; therefore, the product system under study receives lower benefits (−16% for DIE-ICEV, −15% for CNG-ICEV, and −18% for BEV);
  • In the CFF scenario, the product system under study benefits from the introduction of a certain percentage of recycled content as input at the manufacturing stage, while in the avoided burden scenario, only the primary materials are considered as inputs. Consequently, in the CFF scenario, the GWP impact of the raw material acquisition and processing stage is reduced by around −4% for DIE-ICEV and −3% for CNG-ICEV and BEV.
In Figure 5, for each vehicle configuration, the GWP impact of the EoL stage under the avoided burden scenario is compared with the sum of the following parts of the CFF: “CFF material part recycling” (1c), “energy part” (2), and “other disposal part” (3). For each vehicle, the GWP impact of the EoL stage includes a share of burdens (with a positive sign) and a share of benefits (with a negative sign). The burdens are due to the recycling processes (red bars) and to other disposal methods, which, in this graph, have been considered separately to highlight their impacts on the total (e.g., treatment of polymers (yellow bars), tires (orange bars), platinum, rhodium, and palladium (purple bars), batteries (magenta bars), and the ASR non identified fraction (light blue bars)). The benefits are due to the avoided impacts of virgin material production from material recycling (blue bars) and reuse (green bars).
As can be seen in Figure 5, in all the three vehicle configurations and in all the EoL scenarios, the benefits due to the avoided virgin production of materials reduce the total GWP impact, compensating the burdens. As far as the BEV configuration is concerned, the burdens are greater than those of the conventional ones (by a factor of two in the CFF scenario and by 66–83% in the avoided burden scenario), mainly due to the impacts related to the treatment of the Li-ion batteries.
In addition, significant differences can be found if the EoL scenarios are compared within the same configuration. Although the specific emissions, E i   , and mass of materials in both scenarios are the same, the net GWP impacts (black scatters in Figure 5) of the CFF scenario are 33, 29, and 24% higher than those of the avoided burden scenario for DIE-ICEV, CNG-ICEV, and BEV, respectively. These significative differences are due to the A parameter, which largely influences the results [55]. The A parameter, for which the range is between 0.2 and 0.8, aims to allocate the burdens and benefits between the two connected product systems; consequently, as also highlighted in [42], the benefits allocated to the product system under study are reduced. According to [42], for CFF, only a maximum of 80% of the benefits can be allocated to the product system under study, whereas in the avoided burden scenario, the product system receives 100% of the benefits. In this study, the CFF scenario reduces the total benefits by 19, 17, and 22% for the DIE-ICEV, CNG-ICEV, and BEV configurations, respectively. This outcome is in line with [42].
The avoided GWP impacts resulting from recycling are illustrated in Figure 6. It can be seen that steel recycling (dark blue bars) has a significant impact on conventional vehicles, accounting for approximately 50% of the total benefits for DIE-ICEV and 40% for CNG-ICEV. Aluminum recycling (light blue bars) accounts for approximately 15% of the total benefits for DIE-ICEV and 20% for CNG-ICEV. The recycling of the polymers accounts for less than 10% for both DIE-ICEV and CNG-ICEV, while the recycling of platinum and palladium in the DIE-ICEV configuration (approximately 20% of the total benefits, red bars) and the recycling of platinum and rhodium in the CNG-ICEV configuration (approximately 30% of the total benefits, red bars) significantly reduce the impacts.
The share of benefits due to steel recycling in the BEV configuration is comparable to those of the conventional configurations (approximately 40% of the total benefits). A significant reduction in the GWP impact is due to the avoided impact on the production of virgin materials involving the Li-ion batteries (approximately 30% of the total benefits). The avoided impact of primary polymer production accounts for approximately 10% of the total BEV benefits, while approximately 8% is the share of benefits due to electronic equipment recycling. Less significant are the avoided impacts due to aluminum and copper recycling.

3.2. Insight into the Avoided Burden Scenario

Figure 7 shows the environmental impacts of EoL for different environmental impact categories other than GWP. The results are reported for each vehicle configuration, and the avoided burden scenario is assumed as the EoL scenario.
Considering the abiotic depletion category for each vehicle configuration, the benefits outweigh the burdens. In conventional vehicles, the main contributor to the share of avoided impacts (blue bars) is the avoided production of lead (about 60% of the total share of avoided impacts for DIE-ICEV and about 45% for CNG-ICEV). Moreover, the avoided impacts related to aluminum production account for about 30% of the total avoided impacts for DIE-ICEV and about 40% for CNG-ICEV. For conventional vehicles, a significant share of the avoided impacts is due to reused spare parts (orange bars). Spare parts are mainly composed of metal components, for which aluminum and steel production emissions are avoided (as reported in Table S2, it was assumed that the 36% in weight of the metal components is reused).
For ozone layer depletion and cumulative energy demand, the results are particularly different between the conventional and BEV configurations. When considering ozone layer depletion, it can be seen that although conventional vehicles show a benefit for the EoL stage, the BEV configuration presents high burdens due to Li-ion battery recycling. This outcome was obtained in [45,56] also, where the life cycle assessment of the battery showed that the benefits do not compensate for the recycling burdens for the ozone layer depletion category. When considering cumulative energy demand, it can be seen that the BEV configuration requires more energy in the EoL stage with respect to conventional vehicles due to Li-ion battery recycling.
On the contrary, the EoL stage of the BEV configuration is characterized by significantly greater benefits than the other vehicle configurations for photochemical oxidation, acidification, and eutrophication. This is due to the impacts avoided by recycling the Li-ion batteries and CNG tanks.

3.3. Comparison of the Cradle-to-Grave LCA of the Three Vehicles under Study

In Figure 8a, the entire cradle-to-grave GWP impact for each vehicle under study is reported in gCO2eq/km. Although the EoL stage (light green bars) reduces the total GWP impact, the reduction is not significant. In fact, it accounts for −3.6% for both the DIE-ICEV and BEV configurations and −5.3% for the CNG-ICEV configuration. Nevertheless, as is shown in Figure 8b, the role of the EoL stage is significant in the following impact categories:
  • Abiotic depletion accounts for −59%, −78%, and −35% of the DIE-ICEV, CNG-ICEV, and BEV configurations, respectively;
  • Human toxicity accounts for −33%, −31%, and −48% of the DIE-ICEV, CNG-ICEV, and BEV configurations, respectively;
  • Freshwater aquatic ecotoxicity accounts for −48%, −49%, and −35% of the DIE-ICEV, CNG-ICEV, and BEV configurations, respectively;
  • Marine aquatic ecotoxicity accounts for −32%, −30%, and −27% of the DIE-ICEV, CNG-ICEV, and BEV configurations, respectively;
  • Photochemical oxidation accounts for −13%, −24%, and −23% of the DIE-ICEV, CNG-ICEV, and BEV configurations, respectively;
  • Acidification accounts for −24%, −34%, and −18% of the DIE-ICEV, CNG-ICEV, and BEV configurations, respectively;
  • Eutrophication accounts for −23%, −28%, and −11% of the DIE-ICEV, CNG-ICEV, and BEV configurations, respectively.

4. Discussion

One of the main outcomes of this study is that, for all the configurations, GWP impact under the CFF method is significantly greater than under the avoided burden method. This outcome highlighted that a proper allocation method is fundamental in the LCAs of vehicles, not only for the practical calculation of the EoL stage environmental impacts but also to ensure comparability when different products are compared. In order to accomplish this goal, the introduction of widely accepted guidelines that limit flexibility in the calculation is necessary.
In addition, it is important to underline that neither the avoided burden nor the CFF methods consider the number of times a material has been recycled. Avoiding the virgin production of a material that is recycled once carries the same burden/benefit as avoiding the virgin production of a material that is recycled several times [42]. All of the amount of aluminum considered in this study was assumed to be recycled. Actually, aluminum is composed of wrought alloys and cast alloys. The latter can be successfully remelted and recycled, while the former needs the recycling process to change to avoid losses. A similar consideration can be made for plastic materials. In the automotive sector, plastic components are improbably composed of a monotype plastic material. Noncontaminated monotype plastic materials can be recovered by primary recycling, as reported in the standard ISO 15270, while a mix of plastics can be recovered but with a lower quality. Although Annex C of the PEF [54] includes the R1, R2, and Qs/Qp factors for different types of plastics, they are mainly suitable for the building, construction, and electronic sectors. The automotive sector is not included, and there are no guidelines for the estimation of the recyclability and quality rates of plastic materials.

5. Conclusions

The present study evaluates the cradle-to-grave LCA of the following powertrain configurations of LDCVs: DIE-ICEV, CNG-ICEV, and BEV. Two EoL scenarios were considered to differently handle the allocation of burdens and benefits between the connected product systems. The two EoL scenarios are based on two distinct allocation methods: CFF and avoided burden, and their scope is limited to the following stages: raw material acquisition and processing and EoL.
Considering only the life cycle stages within the scope of the two allocation methods and GWP, when compared to the avoided burden method, the net impact of the CFF method is 19% greater for DIE-ICEV, 18% greater for CNG-ICEV, and 14% greater for BEV.
Considering only the EoL stage and GWP, even though the burdens for the BEV configuration are greater than those of the conventional ones, in all the vehicle configurations and in all the EoL scenarios, the benefits due to the avoided virgin production of the materials outweigh the GWP burdens.
Considering only the EoL stage and categories other than GWP, ozone layer depletion and cumulative energy demand showed particularly different results between the conventional and BEV configurations. In these two impact categories, the benefits due to Li-ion battery recycling do not outweigh the burdens, resulting in an increase in the impacts when the assessment is expanded to the entire vehicle.
Considering only avoided burden and GWP, steel recycling significantly reduces the GWP impact in all the vehicle configurations. Platinum, palladium, and rhodium recycling significantly reduces the GWP impact of the conventional LDCVs, while Li-ion battery recycling significantly reduces the GWP impact of the electric LDCVs.
Considering all the life cycle stages (cradle-to-grave) and all the categories, it should be highlighted that the role of the EoL stage in reducing GWP impact is not significant. On the contrary, when considering the other impact categories, the role of the EoL stage is not only relevant but is also fundamental for the success of circular economy strategies. In fact, the EoL stage reduces abiotic depletion by −59, −78, and −35% for DIE-ICEV, CNG-ICEV, and BEV, respectively.

Supplementary Materials

The following supporting information can be downloaded at: https://www.mdpi.com/article/10.3390/app13031494/s1, Table S1: Compositions of the ELVs; Table S2: Assumed fates; Table S3: Life Cycle Inventory of the three ELVs EoL scenario.

Author Contributions

Conceptualization, A.A.; methodology, A.A.; methodology-use stage F.M.; formal analysis, A.A., F.M.; investigation, A.A., F.M.; resources, A.A.; data curation, A.A.; writing—original draft preparation, A.A., F.M.; software, A.A., F.M.; writing—review and editing, G.D. and E.S.; supervision, G.D. and E.S. All authors have read and agreed to the published version of the manuscript.

Funding

This research received no external funding.

Informed Consent Statement

Not applicable.

Data Availability Statement

Not applicable.

Conflicts of Interest

The authors declare no conflict of interest.

Nomenclature

ASR Automotive shredder residue
BEV Battery electric vehicle
BOM Bill of materials
CNG-ICEV Compressed natural gas internal combustion engine vehicle
CED Cumulative energy demand
CFF Circular footprint formula
DIE-ICEV Diesel oil internal combustion engine vehicle
ELV End-of-life vehicle
EoLEnd-of-life
EV Electric vehicle
GHGGreenhouse gas emission
LDCV Light duty commercial vehicle
LCA Life cycle assessment
LCI Life cycle inventory
LHV Lower heating value
PAH Polycyclic aromatic hydrocarbons
PEF Product environmental footprint
PEFCR Product environmental footprint category rules
TTW Tank-to-wheel
UFT Urban freight transport
VOC Volatile organic compound
WTT Well-to-tank

Appendix A

Appendix A.1. LCA Models of the Three Vehicles

Appendix A.1.1. Manufacturing Stage

Regarding the manufacturing stage, mining and transforming of raw materials, components production, and vehicle assembly were included. In this stage, the consumption of electricity and natural gas from the grid and wastes produced by the plant are also included and based on primary data of a European Original Equipment Manufacturer (OEM). Since the vehicles contain many components, they were grouped by material families. The material composition of each vehicle configuration represents primary data provided by a European OEM, and it is reported in Table S1.

Appendix A.1.2. Use Stage

Regarding the use stage, it was assumed that the three configurations are used in the specific context of urban logistics. Both the Well-To-Thank (WTT) emissions due to the production and distribution of fuels and electricity and the Tank-To-Wheel (TTW) emissions due to the combustion of fuels during the driving mission were considered. TTW emissions were calculated using an ad hoc developed vehicle simulation model for the vehicles. It belongs to the class of simulation models that are generally referred to as backward powertrain simulation models. Each individual powertrain component was modeled using experimentally derived characteristics supplied by the manufacturer. In particular, the engine and electrical machines were characterized with fuel consumption and/or efficiency maps as appropriate, and the battery was modeled using an equivalent circuit model.
The adopted vehicle models belong to the class of longitudinal backward simulation models, which are widely used to predict the emissions and energy consumption of conventional and electrified vehicles [40]. These models assume that a given speed trace is followed exactly by the vehicles and thus determine the required operational condition of the prime movers and energy sources, such as the engine, the electrical machine, and the battery (depending on the vehicle architecture).
The driving mission (i.e., the speed trace) is discretized into a number of timesteps. Then for each timestep, the vehicle model evaluates the required engine speed and torque to evaluate fuel consumption or the required EV battery power to update the battery SOC.
First, the tractive load is set to overcome the sum of the resistant forces and the vehicle’s inertia:
F t r a c t = F r e s + m v e h   v v e h
where m v e h is the vehicle’s mass, and v v e h is its speed.
The resistant forces are divided into the tire rolling resistance and the aerodynamic drag resistance:
F t r a c t = m v e h c r g cos ( s ) + 1 2 ρ a i r c x A v e h   v v e h 2
where c r is the tyre rolling resistance coefficient, g     is the gravitational acceleration, s is the road slope, ρ a i r is the air density in standard conditions, c x the vehicle’s aerodynamic drag coefficient, and A veh its frontal area.
A third term, grade resistance, is not reported here, as it is nonzero only if the road slope is, and the vehicle missions used in this study do not consider road gradients.
The wheel speed and torque are then computed with an ideal model, since all tire losses are included by the rolling resistance:
ω w h e e l = v v e h r w h e e l
T w h e e l = F v e h   r w h e e l + J w h e e l     ω ˙ w h e e l
where r w h e e l is the wheel radius, and J w h e e l their inertia.
The final drive and gearbox are characterized by their respective transmission efficiencies, η fd and η gb , speed ratios, τ fd and τ gb , and inertias, J fd and J gb . The gearbox input speed and torque are then:
ω g b = ω w h e e l τ f d τ g b
{ T g b = T w h e e l τ f d η f d + J f d ω ˙ f d   τ g b η g b + J g b ω ˙ g b i f     T f d 0 , T g b = T w h e e l τ f d   η f d + J f d ω ˙ f d   τ g b   η g b + J g b ω ˙ g b i f     T f d < 0 .
For the DIE-ICEV and CNG-ICEV architectures, the engine speed and torque are then evaluated as
ω e n g = ω g b ,
T e n g = T g b + J e n g     ω ˙ e n g ,
where J eng is the engine inertia.
Finally, fuel consumption is evaluated using a fuel consumption map as a function of the engine speed and torque m ˙ f = m ˙ f ( ω eng , T eng ) ; CO2 emissions can then be estimated assuming complete combustion as in [40] as the mass of the pollutants is lower than the products of complete combustion by at least one order of magnitude. Pollutant emissions are evaluated at a later simulation step as emission maps for the simulated engines were not available.
For the electric battery architecture, the e-machine speed and torque are evaluated as
ω e m = ω g b ,  
T e m = T g b + J e m     ω ˙ e m ,
where J em is the engine inertia. When the e-machine torque is negative, it is assumed that only a fraction is absorbed by it for regenerative braking, while the remaining part is absorbed by the mechanical brakes. For simplicity, an average regenerative braking to total braking power fraction of 80% was assumed.
Then, the electrical power consumption is evaluated using an electro-mechanical conversion efficiency map η em = η em ( ω em , T em ) .
{ P e m = 1 η e m ω e m T e m i f     ω e m T e m 0 , P e m = η e m ω e m T e m i f     ω e m T e m < 0 .
The electrical power used (or provided) by the e-machine is then used to track the battery’s state-of-charge (SOC) dynamics. The battery current is evaluated based on a simple internal resistance model:
i b = v O C v o c 2 4 R e q P e m 2 R e q
and then used to update the SOC as
S O C ˙ = η c i b C b
Here, v OC = v OC ( SOC ) and R eq = R eq ( SOC ) are the battery open-circuit voltage and equivalent resistance, η c is the coulombic efficiency, and C b the nominal battery capacity.
After the vehicle’s behavior is simulated for the whole driving mission, two distinct additional steps are introduced for the conventional and BEV vehicles.
For the conventional vehicles, pollutants emissions are evaluated based on the engines’ WHTC certification-specific emissions. The specific emissions are multiplied by the energy provided by the engine throughout the whole mission to obtain the total emissions for a mission.
For the BEV, the battery’s full recharge is simulated assuming that the vehicle is charged through its 22 kW on-board charger, and the energy absorbed from the grid is evaluated as:
E b , recharge = η charger   P charger   dt = η charger   P charger   Δ t recharge ,
where P charger is the on-board charger’s constant input power (i.e., 22 kW) and η charger its efficiency. The time required for a full recharge is evaluated as
Δ t r e c h a r g e = S O C f 1   C b η c i b d S O C .
The vehicles’ operation was simulated over a WLTC cycle. In order to ensure that all vehicles could perform the same driving mission, the WLTC cycle downscaling procedure defined in the relevant EU regulation [40] has been applied to the BEV (which has the lowest power-to-weight ratio of the three configurations). The mission thus obtained was then used for all configurations. The main results of the analysis of the use phase are the distance-specific energy consumption (Table A1), CO2 emissions (Table A2), and pollutants emissions (Table A3).
Table A1. Distance-specific energy consumption.
EC, Wh/kmBEVCNG-ICEVDIE-ICEV
wltc3b, load 0%433.21245.91073.2
wltc3b, load 50%446.31310.51145.3
Average439.81278.21109.3
Table A2. Distance-specific TTW CO2 emissions.
CO2 ttw, g/kmBEVCNG-ICEVDIE-ICEV
wltc3b, load 0%0.0225.3267.6
wltc3b, load 50%0.0237.0285.6
Average0.0231.2276.6
Table A3. Distance-specific TTW pollutant emissions.
Pollutants, mg/kmCONOxPMHCCH4NMVOC
CNG-ICEV18445.30.113084.41.02
DIE-ICEV221501.8637.200

Appendix A.1.3. EoL Stage

Table A4. Definitions of specific emissions and resources consumed E i .
E r e c y c l e d Arising from the recycling process of the recycled (reused) material. E v Arising from the acquisition and preprocessing of virgin material assumed to be substituted by recyclable materials.
E r e c y c l i n g E o L Arising from the recycling process at EoL. E E R Arising from the energy recovery process.
E v Arising from the acquisition and pre-processing of virgin material. E S E , h e a t Arising from the energy recovery process.
E S E ,   e l e c Emissions that would have arisen from the specific substituted energy source (heat and electricity, respectively).

References

  1. Allacker, K.; Mathieux, F.; Pennington, D.; Pant, R. The search for an appropriate end-of-life formula for the purpose of the European Commission Environmental Footprint initiative. Int. J. Life Cycle Assess. 2017, 22, 1441–1458. [Google Scholar] [CrossRef]
  2. Yuik, C.J.; Mat Saman, M.Z.; Ngadiman, N.H.A.; Hamzah, H.S. Supply chain optimisation for recycling and remanufacturing sustainable management in end-of-life vehicles: A mini-review and classification. Waste Manag. Res. 2022. [Google Scholar] [CrossRef]
  3. Sawyer-Beaulieu, S.; Tam, E.K.L. Maximizing Automotive Parts Reuse, Remanufacturing, and Recycling Through Effective End-of-Life Vehicle Management: A Different Perspective on What Needs to be Done. SAE Int. J. Mater. Manuf. 2015, 8, 118–127. [Google Scholar] [CrossRef]
  4. Korica, P.; Cirman, A.; Žgajnar Gotvajn, A. Comparison of end-of-life vehicles management in 31 European countries: A LMDI analysis. Waste Manag. Res. 2022, 40, 1156–1166. [Google Scholar] [CrossRef] [PubMed]
  5. Al-Quradaghi, S.; Zheng, Q.P.; Betancourt-Torcat, A.; Elkamel, A. Optimization Model for Sustainable End-of-Life Vehicle Processing and Recycling. Sustainability 2022, 14, 3551. [Google Scholar] [CrossRef]
  6. European Parliament, European Union. Directive 2000/53/EC of the European Parliament and of the Council of 18 September 2000 on End-of Life Vehicles; European Parliament, European Union: Brussels, Belgium, 2000.
  7. Cossu, R.; Lai, T. Automotive shredder residue (ASR) management: An overview. Waste Manag. 2015, 45, 143–151. [Google Scholar] [CrossRef]
  8. ISO 22628:2002; International Organization for Standardization, Road vehicles—Recyclability and Recoverability—Calculation Method. ISO: Geneva, Switzerland, 2002.
  9. Fonseca, A.S.; Nunes, M.I.; Matos, M.A.; Gomes, A.P. Environmental impacts of end-of-life vehicles’ management: Recovery versus elimination. Int. J. Life Cycle Assess. 2013, 18, 1374–1385. [Google Scholar] [CrossRef]
  10. Schmid, A.; Naquin, P.; Gourdon, R. Incidence of the level of deconstruction on material reuse, recycling and recovery from end-of life vehicles: An industrial-scale experimental study. Resour. Conserv. Recycl. 2013, 72, 118–126. [Google Scholar] [CrossRef]
  11. Saidani, M.; Kendall, A.; Yannou, B.; Leroy, Y.; Cluzel, F. Management of the end-of-life of light and heavy vehicles in the U.S.: Comparison with the European union in a circular economy perspective. J. Mater. Cycles Waste Manag. 2019, 21, 1449–1461. [Google Scholar] [CrossRef]
  12. Sharma, P.; Sharma, A.; Sharma, A.; Srivastava, P. Automobile Waste and Its Management. Res. J. Chem. Environ. Sci. 2016, 4, 1–7. [Google Scholar]
  13. Modoi, O.-C.; Mihai, F.-C. E-Waste and End-of-Life Vehicles Management and Circular Economy Initiatives in Romania. Energies 2022, 15, 1120. [Google Scholar] [CrossRef]
  14. Yano, J.; Xu, G.; Liu, H.; Toyoguchi, T.; Iwasawa, H.; Sakai, S. Resource and toxic characterization in end-of-life vehicles through dismantling survey. J. Mater. Cycles Waste Manag. 2019, 21, 1488–1504. [Google Scholar] [CrossRef]
  15. Govindan, K.; Gholizadeh, H. Robust network design for sustainable-resilient reverse logistics network using big data: A case study of end-of-life vehicles. Transp. Res. Part E Logist. Transp. Rev. 2021, 149, 102279. [Google Scholar] [CrossRef]
  16. Wong, Y.C.; Al-Obaidi, K.M.; Mahyuddin, N. Recycling of end-of-life vehicles (ELVs) for building products: Concept of processing framework from automotive to construction industries in Malaysia. J. Clean. Prod. 2018, 190, 285–302. [Google Scholar] [CrossRef]
  17. Özceylan, E.; Demirel, N.; Çetinkaya, C.; Demirel, E. A closed-loop supply chain network design for automotive industry in Turkey. Comput. Ind. Eng. 2017, 113, 727–745. [Google Scholar] [CrossRef]
  18. Demirel, E.; Demirel, N.; Gökçen, H. A mixed integer linear programming model to optimize reverse logistics activities of end-of-life vehicles in Turkey. J. Clean. Prod. 2016, 112, 2101–2113. [Google Scholar] [CrossRef]
  19. Rovinaru, F.I.; Rus, A.V. The Economic and Ecological Impacts of Dismantling End-of-Life Vehicles in Romania. Sustainability 2019, 11, 6446. [Google Scholar] [CrossRef] [Green Version]
  20. Arora, N.; Bakshi, S.K.; Bhattacharjya, S. Framework for sustainable management of end-of-life vehicles management in India. J. Mater. Cycles Waste Manag. 2019, 21, 79–97. [Google Scholar] [CrossRef]
  21. Evangelopoulos, P.; Sophonrat, N.; Jilvero, H.; Yang, W. Investigation on the low-temperature pyrolysis of automotive shredder residue (ASR) for energy recovery and metal recycling. Waste Manag. 2018, 76, 507–515. [Google Scholar] [CrossRef]
  22. Choi, J.; Jang, Y.-C.; Kim, J.-G. Substance flow analysis and environmental releases of PBDEs in life cycle of automobiles. Sci. Total Environ. 2017, 574, 1085–1094. [Google Scholar] [CrossRef]
  23. Cossu, R.; Lai, T. Washing treatment of automotive shredder residue (ASR). Waste Manag. 2013, 33, 1770–1775. [Google Scholar] [CrossRef] [PubMed]
  24. Fiore, S.; Ruffino, B.; Zanetti, M.C. Automobile Shredder Residues in Italy: Characterization and valorization opportunities. Waste Manag. 2012, 32, 1548–1559. [Google Scholar] [CrossRef] [Green Version]
  25. Ruffino, B.; Fiore, S.; Zanetti, M.C. Strategies for the enhancement of automobile shredder residues (ASRs) recycling: Results and cost assessment. Waste Manag. 2014, 34, 148–155. [Google Scholar] [CrossRef] [PubMed] [Green Version]
  26. Tai, H.-S.; He, W.-H. An exploration of automotive shredder residue recovery as fuel in Taiwan. J. Chin. Inst. Eng. 2015, 38, 675–684. [Google Scholar] [CrossRef]
  27. Huang, J.; Bian, Z.; Lei, S. Feasibility Study of Sensor Aided Impact Acoustic Sorting of Plastic Materials from End-of-Life Vehicles (ELVs). Appl. Sci. 2015, 5, 1699–1714. [Google Scholar] [CrossRef] [Green Version]
  28. Tian, J.; Chen, M. Sustainable design for automotive products: Dismantling and recycling of end-of-life vehicles. Waste Manag. 2014, 34, 458–467. [Google Scholar] [CrossRef]
  29. Ohno, H.; Matsubae, K.; Nakajima, K.; Nakamura, S.; Nagasaka, T. Unintentional Flow of Alloying Elements in Steel during Recycling of End-of-Life Vehicles: Unintentional Flow of Alloying Elements in Steel during ELV Recycling. J. Ind. Ecol. 2014, 18, 242–253. [Google Scholar] [CrossRef]
  30. Ohno, H.; Matsubae, K.; Nakajima, K.; Nakamura, S.; Nagasaka, T. Development of Efficient Recycling System for Steel Alloying Elements in End of Life Vehicles. In REWAS 2013 Enabling Materials Resource Sustainability; Wiley: Hoboken, NJ, USA, 2013; pp. 414–422. [Google Scholar] [CrossRef]
  31. Xu, G.; Yano, J.; Sakai, S. Scenario analysis for recovery of rare earth elements from end-of-life vehicles. J. Mater. Cycles Waste Manag. 2016, 18, 469–482. [Google Scholar] [CrossRef]
  32. Jin, H.; Yu, J.; Okubo, K. Life cycle assessment on automotive bumper: Scenario analysis based on End-of-Life vehicle recycling system in Japan. Waste Manag. Res. 2022, 40, 765–774. [Google Scholar] [CrossRef]
  33. Schmid, A.; Batton-Hubert, M.; Naquin, P.; Gourdon, R. Multi-Criteria Evaluation of End-of-Life Vehicles’ Dismantling Scenarios with Respect to Technical Performance and Sustainability Issues. Resources 2016, 5, 42. [Google Scholar] [CrossRef] [Green Version]
  34. Directorate General for Climate Action (European Commission); Ricardo Energy & Environment; Hill, N.; Amaral, S.; Morgan-Price, S.; Nokes, T.; Bates, J.; Helms, H.; Fehrenbach, H.; Biemann, K.; et al. Determining the Environmental Impacts of Conventional and Alternatively Fuelled Vehicles through LCA: Final Report; Publications Office of the European Union: Brussels, Belgium, 2020.
  35. Del Pero, F.; Delogu, M.; Pierini, M. Life Cycle Assessment in the automotive sector: A comparative case study of Internal Combustion Engine (ICE) and electric car. Procedia Struct. Integr. 2018, 12, 521–537. [Google Scholar] [CrossRef]
  36. Li, W.; Bai, H.; Yin, J.; Xu, H. Life cycle assessment of end-of-life vehicle recycling processes in China—Take Corolla taxis for example. J. Clean. Prod. 2016, 117, 176–187. [Google Scholar] [CrossRef]
  37. Habermacher, F. Modeling Material Inventories and Environmental Impacts of Electric Passenger Cars. Master’s Thesis, Department of Environmental Sciences, ETH Zurich, Zürich, Switzerland, 2011. [Google Scholar]
  38. Sawyer-Beaulieu, S.S.; Tam, E.K.L. Applying Life Cycle Assessment (LCA) to North American End-of-Life Vehicle (ELV) Management Processes; SAE Technical Paper 2005-01–0846; SAE: Warrendale, PA, USA, 2005. [Google Scholar] [CrossRef]
  39. Sawyer-Beaulieu, S.S. Gate-to-Gate Life Cycle Inventory Assessment of North American End-of-Life Vehicle Management Processes; University of Windsor: Windsor, ON, Canada, 2009. [Google Scholar]
  40. Marmiroli, B.; Venditti, M.; Dotelli, G.; Spessa, E. The transport of goods in the urban environment: A comparative life cycle assessment of electric, compressed natural gas and diesel light-duty vehicles. Appl. Energy 2020, 260, 114236. [Google Scholar] [CrossRef]
  41. Lozzi, G.; Marcucci, E.; Gatta, V.; Pacell, V.; Rodrigues, M. Research for TRAN Committee—COVID-19 and Urban Mobility: Impacts and Perspectives; European Parliament, Policy Department for Structural and Cohesion Policies: Brussels, Belgium, 2020. [Google Scholar]
  42. Bach, V.; Lehmann, A.; Görmer, M.; Finkbeiner, M. Product Environmental Footprint (PEF) Pilot Phase—Comparability over Flexibility? Sustainability 2018, 10, 2898. [Google Scholar] [CrossRef] [Green Version]
  43. ISO 14040:2006; Environmental Management. Life Cycle Assessment. Principles and Framework. British Standards Institute: London, UK, 2006.
  44. ISO 14044:2006; Environmental Management. Life Cycle Assessment. Requirements and Guidelines. ISO: Geneva, Switzerland, 2018.
  45. Accardo, A.; Dotelli, G.; Musa, M.L.; Spessa, E. Life Cycle Assessment of an NMC Battery for Application to Electric Light-Duty Commercial Vehicles and Comparison with a Sodium-Nickel-Chloride Battery. Appl. Sci. 2021, 11, 1160. [Google Scholar] [CrossRef]
  46. Castro, M.B.G.; Remmerswaal, J.A.M.; Reuter, M.A. Life cycle impact assessment of the average passenger vehicle in the Netherlands. Int. J. LCA 2003, 8, 297–304. [Google Scholar] [CrossRef]
  47. Del Duce, A.; Egede, P.; Öhlschläger, G.; Dettmer, T.; Althaus, H.J.; Bütler, T.; Szczechowicz, E. eLCAr: Guidelines for the LCA of Electric Vehicles; European Union: Brussels, Belgium, 2013. [Google Scholar] [CrossRef]
  48. EUROSTAT Database. Available online: https://ec.europa.eu/eurostat/web/main/data/database (accessed on 4 February 2021).
  49. Nordelöf, A.; Poulikidou, S.; Chordia, M.; Bitencourt de Oliveira, F.; Tivander, J.; Arvidsson, R. Methodological Approaches to End-Of-Life Modelling in Life Cycle Assessments of Lithium-Ion Batteries. Batteries 2019, 5, 51. [Google Scholar] [CrossRef] [Green Version]
  50. Manzoni, M. Impatto ambientale di un veicolo commerciale BEV con metodologia LCA. Master’s Thesis, Politecnico di Torino, Corso di Laurea Magistrale in Ingegneria Meccanica, Torino, Italy, 2020. [Google Scholar]
  51. Wolf, M.-A.; Hofstra, U. Circular Footprint Formula Webinar; Environmental Footprint (EF) Transition Phase. Webinar; Environmental Footprint (EF) Transition Phase. Available online: https://ec.europa.eu/environment/eussd/pdf/Webinar%20CFF%20Circular%20Footprint%20Formula_final-shown_8Oct2019.pdf (accessed on 15 January 2021).
  52. US EPA O. Sustainable Materials Management: Non-Hazardous Materials and Waste Management Hierarchy. 2015. Available online: https://www.epa.gov/smm/sustainable-materials-management-non-hazardous-materials-and-waste-management-hierarchy (accessed on 5 July 2022).
  53. Siret, C.; Tytgat, J.; Ebert, T.; Mistry, M.; Thirlaway, C.; Schutz, B.; Xhantopoulos, D.; Wiaux, J.-P.; Chanson, C.; Tomboy, W.; et al. PEFCR—Product Environmental Footprint Category Rules for High Specific Energy Rechargeable Batteries for Mobile Applications; Recharge: Brussels, Belgium, 2018. [Google Scholar]
  54. European Commission. Latest Version of the Annex C for PEF Studies (and PEFCRs/OEFSRs under Development) in the EF Transition Phase, Including Default Application-Specific and Material-Specific Values to Be Used in the Application of the Circular Footprint Formula When Performing a PEF or OEF Study. European Platform on Life Cycle Assessment. Available online: https://view.officeapps.live.com/op/view.aspx?src=https%3A%2F%2Feplca.jrc.ec.europa.eu%2Fpermalink%2FAnnex_C_V2.1_May2020.xlsx&wdOrigin=BROWSELINK (accessed on 15 January 2021).
  55. Rickert, J. Understanding and Applying the Circular Footprint Formula (CFF) in Product Environmental Footprints (PEF) GreenDelta. Available online: https://www.greendelta.com/understanding-and-applying-the-circular-footprint-formula-cff-in-product-environmental-footprints-pef/ (accessed on 11 June 2021).
  56. Cusenza, M.A.; Bobba, S.; Ardente, F.; Cellura, M.; Di Persio, F. Energy and environmental assessment of a traction lithium-ion battery pack for plug-in hybrid electric vehicles. J. Clean. Prod. 2019, 215, 634–649. [Google Scholar] [CrossRef]
Figure 1. System boundary.
Applsci 13 01494 g001
Figure 2. Flowchart of the waste management scheme of the three vehicles.
Applsci 13 01494 g002
Figure 3. Rates of recycling, reuse, and incineration with energy recovery and landfilling for each ELV.
Applsci 13 01494 g003
Figure 4. Comparison of the GWP impacts in the raw material acquisition, processing, and EoL stages of the three vehicle configurations adopting the CFF and avoided burden scenarios.
Applsci 13 01494 g004
Figure 5. GWP impact of the EoL stage of the three vehicle configurations adopting the CFF and avoided burden scenarios.
Applsci 13 01494 g005
Figure 6. Avoided impacts of the two EoL scenarios studied for the three vehicle configurations.
Applsci 13 01494 g006
Figure 7. EoL stage environmental impacts under the avoided burden scenario for different impact categories: ozone layer depletion; abiotic depletion; photochemical oxidation; acidification; eutrophication; cumulative energy demand.
Applsci 13 01494 g007
Figure 8. (a) Cradle-to-grave results for global warming for the three vehicles analyzed; (b) Cradle-to-grave results for the impact categories other than global warming for the three vehicles analyzed.
Applsci 13 01494 g008
Table 1. Percentage by weight of the ASR fractions.
ASR Fraction% by ELV Weight% by ASR Weight
Metallic2.412
Polymeric5.3–7.731–39
Nonidentified9.8–12.249–61
Table 2. Contribution to material removal of each EoL stage in mass percentage.
EoL StageDIE-ICEVCNG-ICEVBEV
Depollution1%9%17%
Dismantling27%24%19%
Shredding54%51%48%
Post-shredding18%17%16%
Disclaimer/Publisher’s Note: The statements, opinions and data contained in all publications are solely those of the individual author(s) and contributor(s) and not of MDPI and/or the editor(s). MDPI and/or the editor(s) disclaim responsibility for any injury to people or property resulting from any ideas, methods, instructions or products referred to in the content.

